

Assessing the Photocatalytic Degradation of Penconazole on TiO2 in Aqueous Suspensions: Mechanistic and Ecotoxicity Studies in Aerated and Degassed Systems


Abstract
1. Introduction
2. Discussion
2.1. Degradation of Penconazole
2.1.1. Photolysis
2.1.2. Photocatalysis
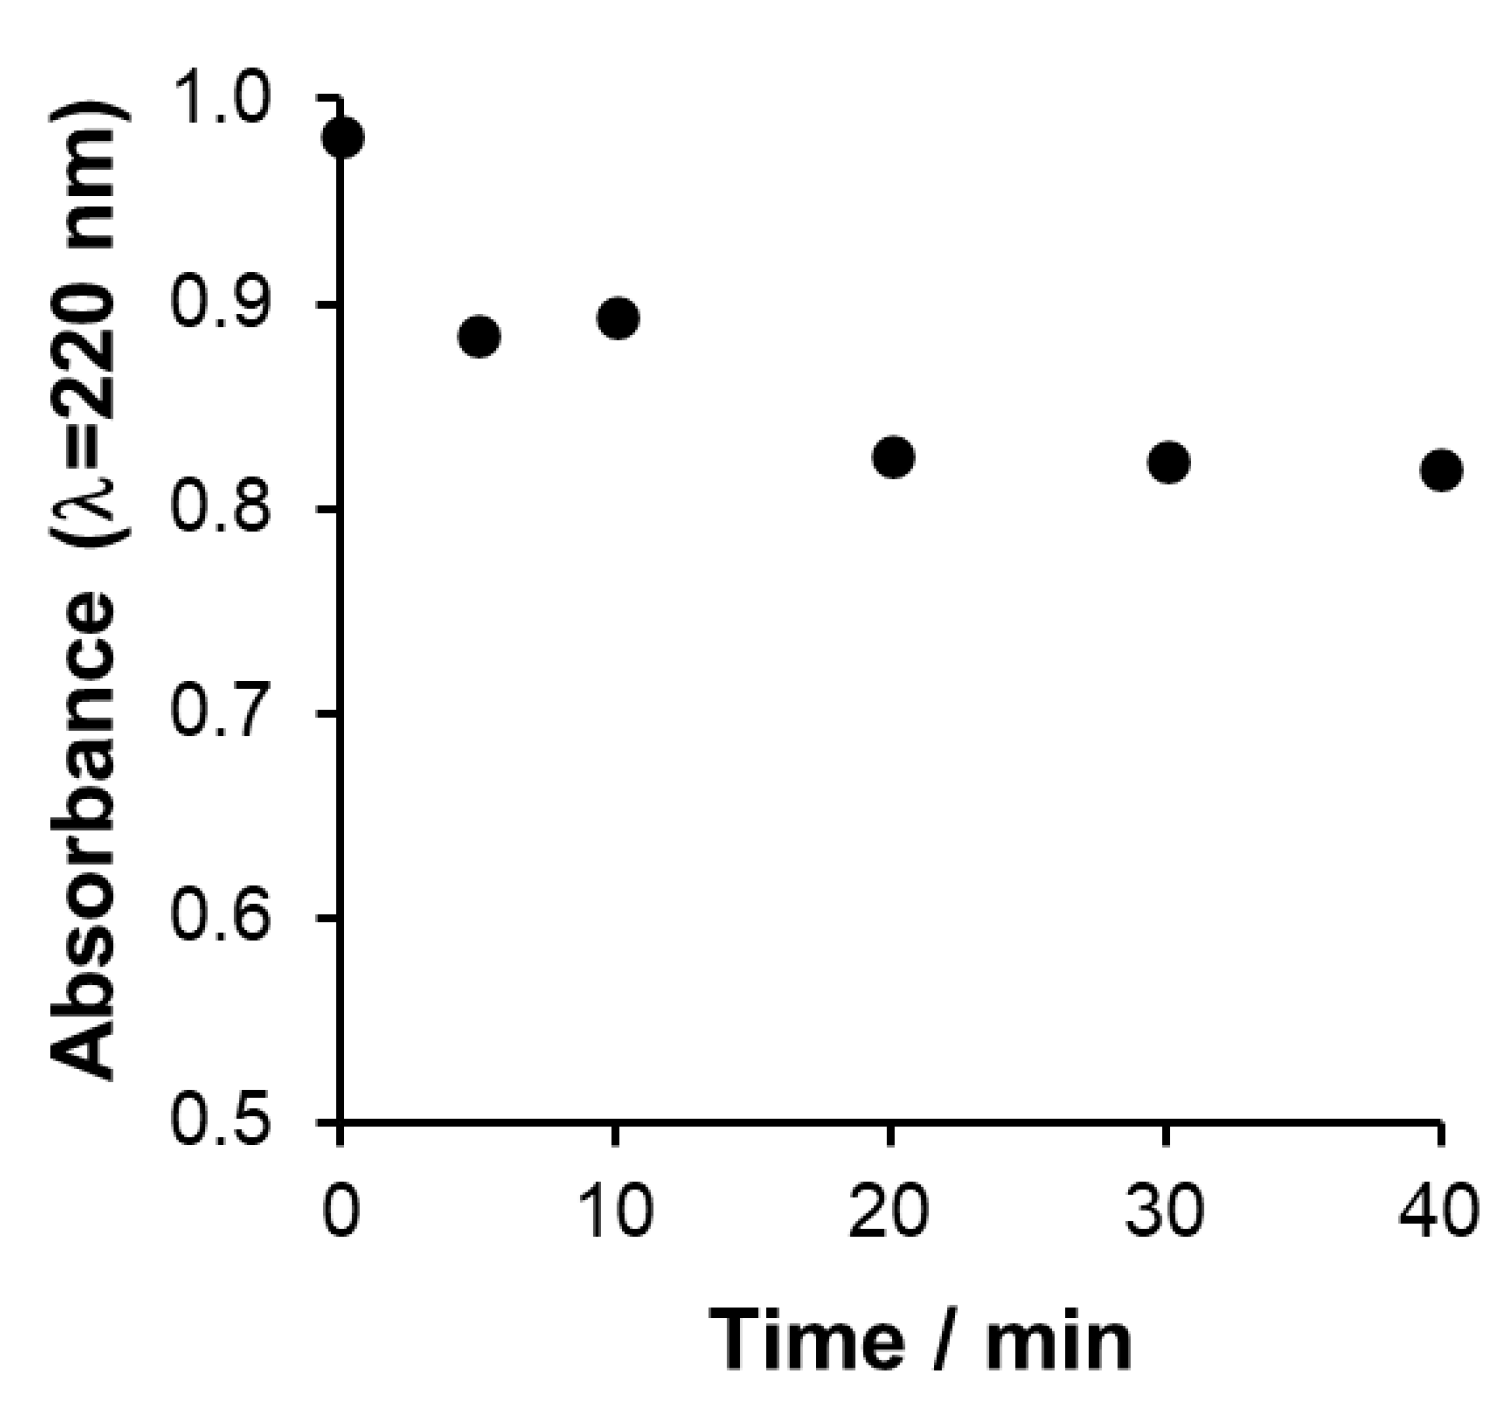
Adsorption
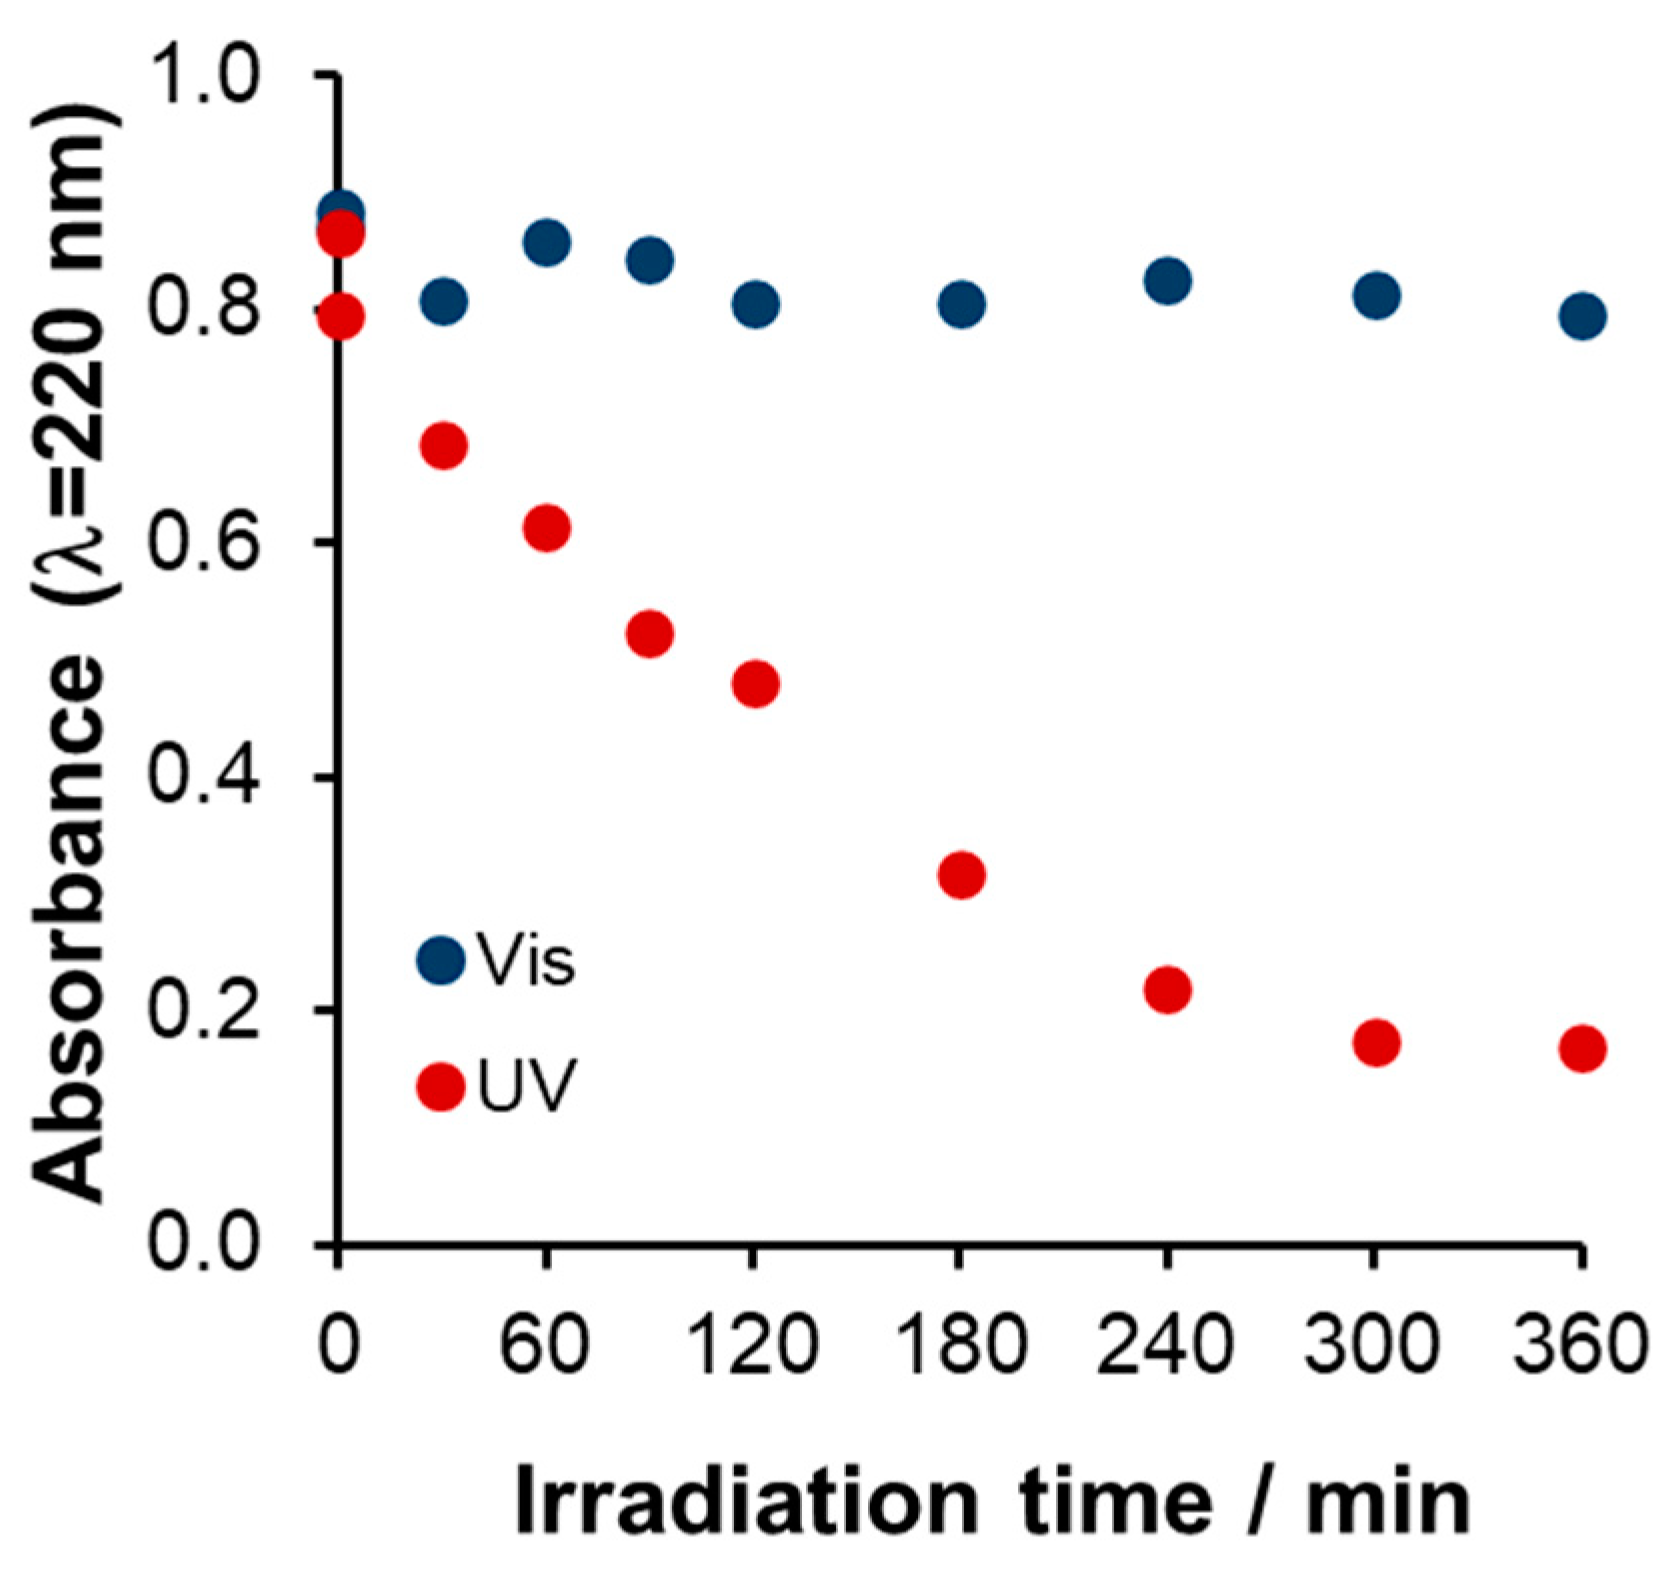
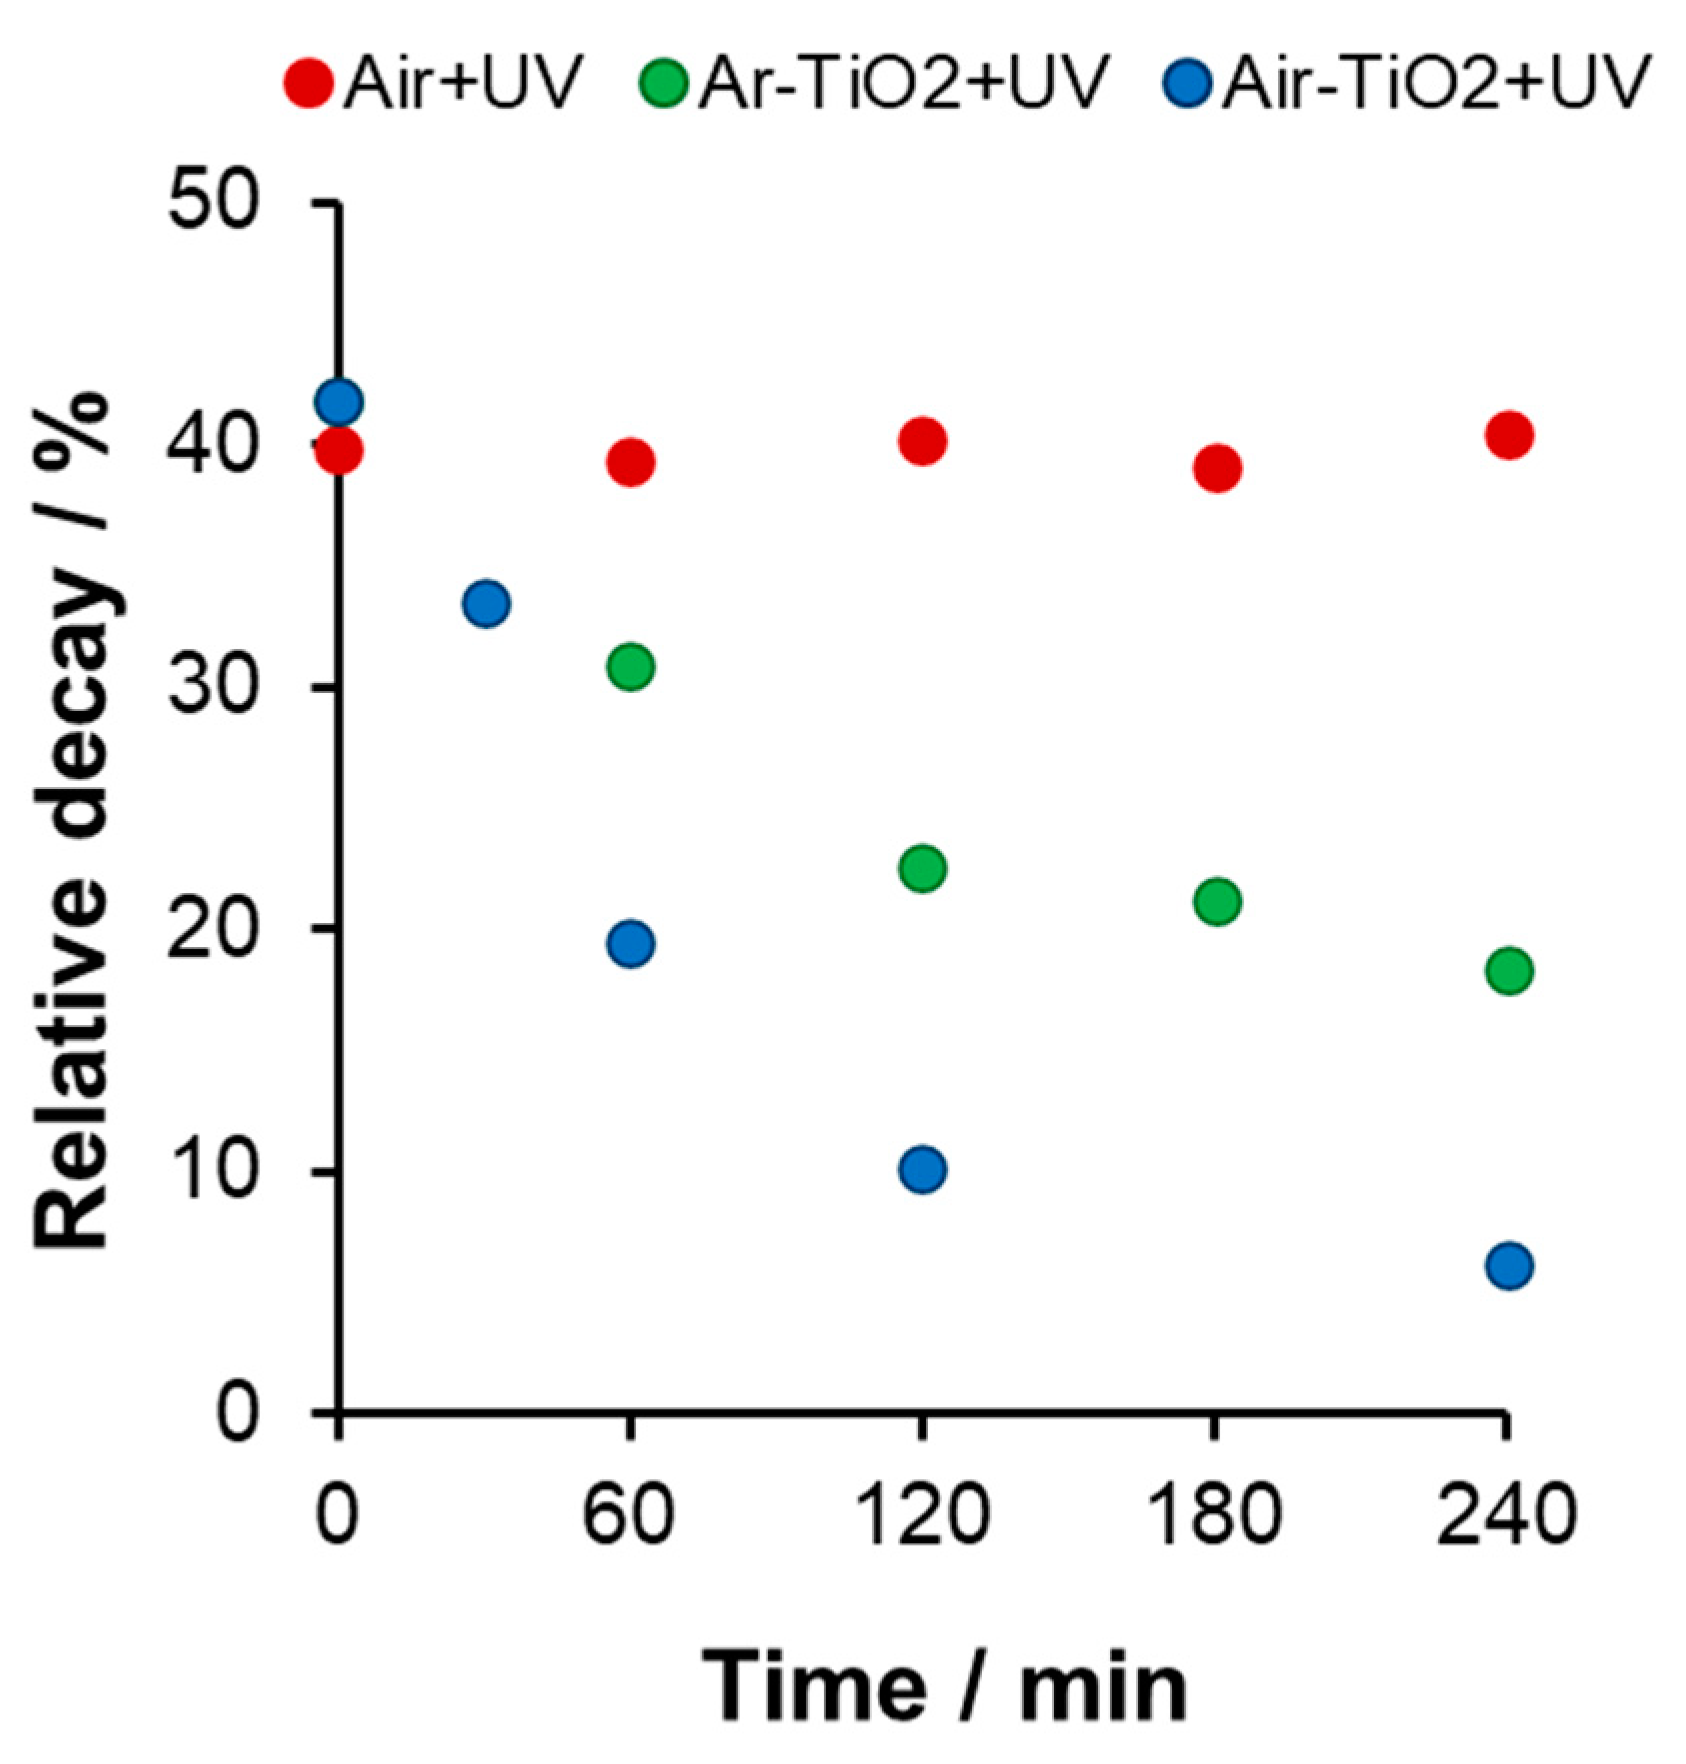
Comparison of UV and Vis Photocatalysis
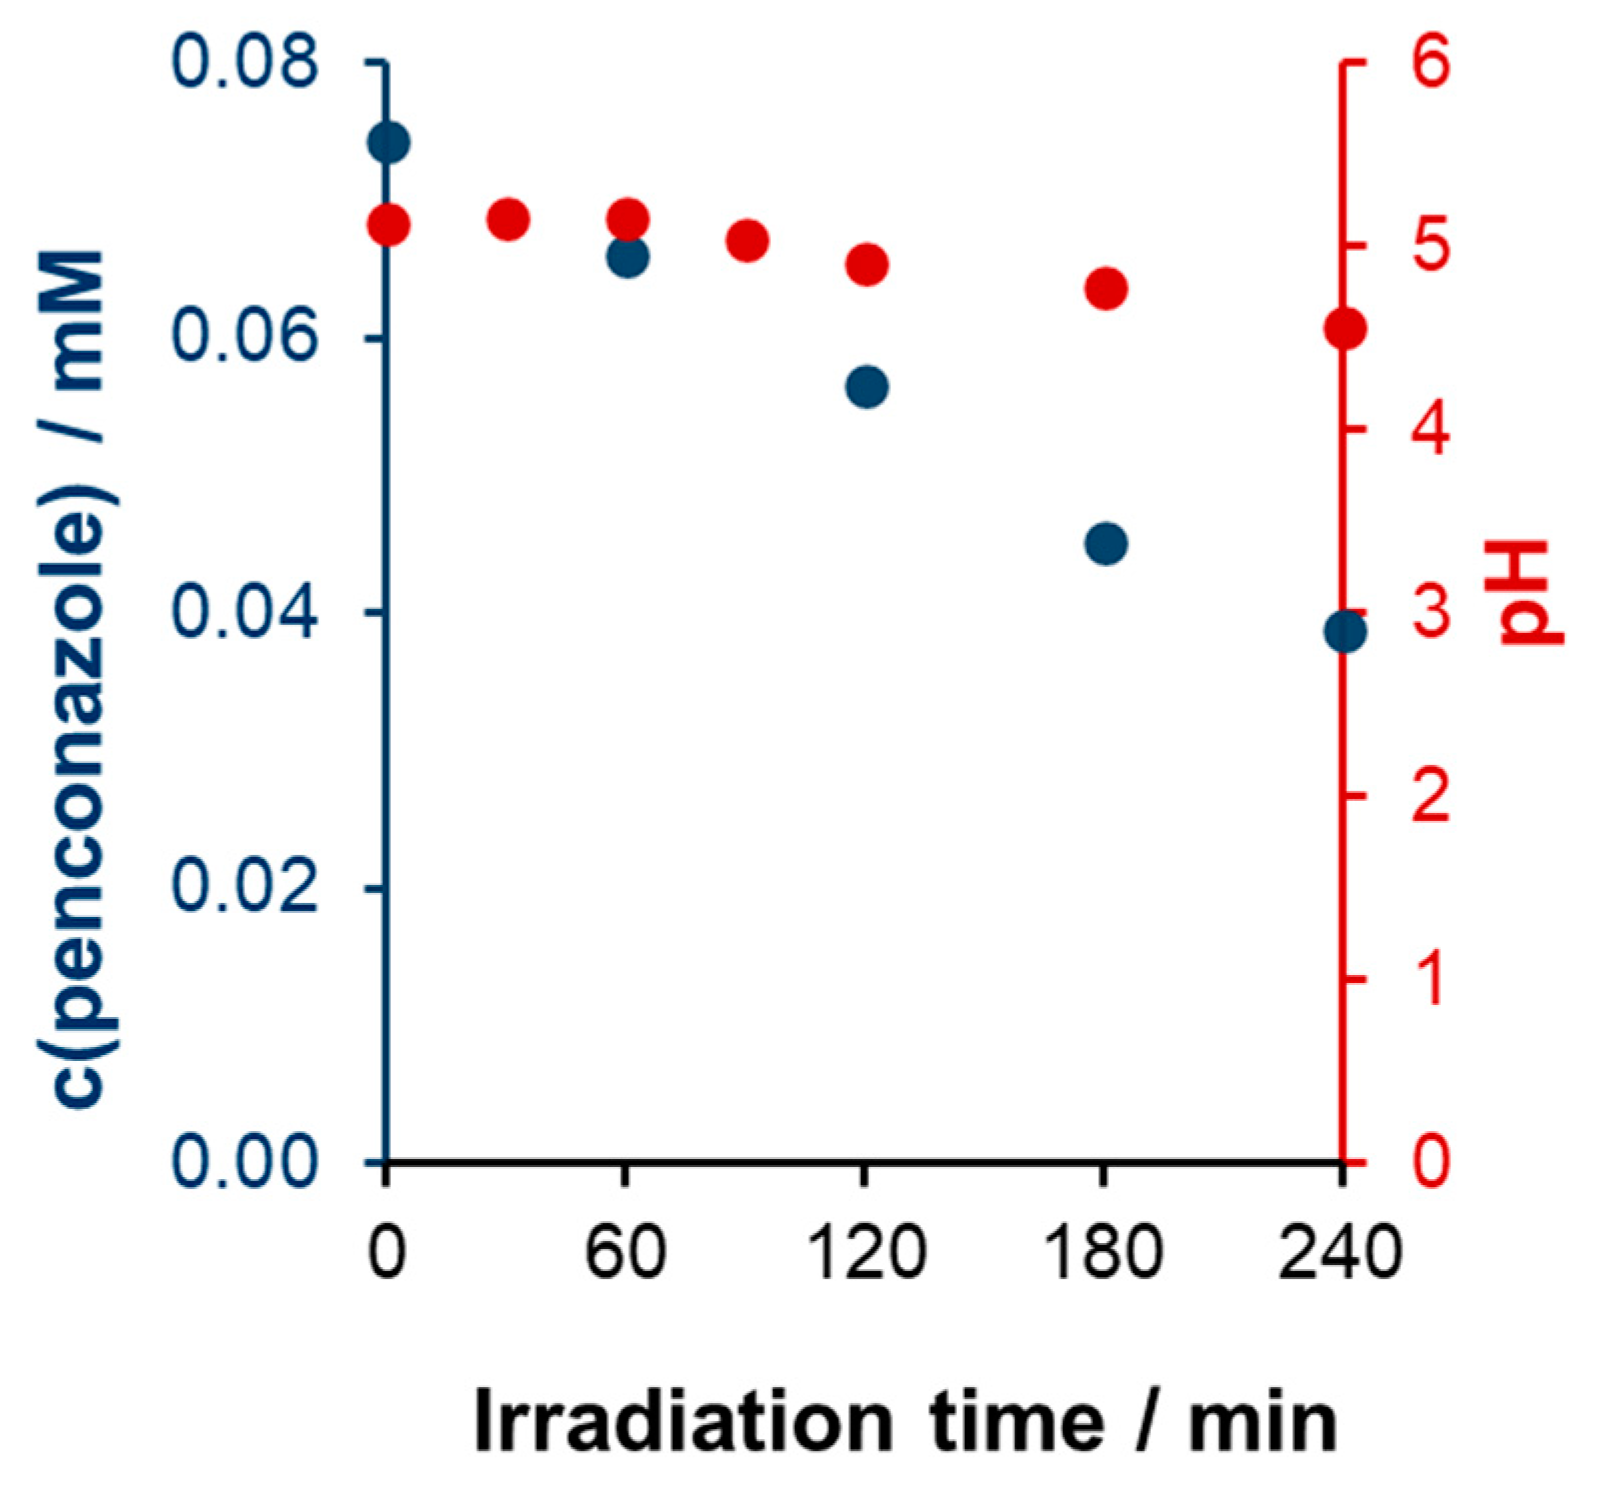
UV Photocatalysis
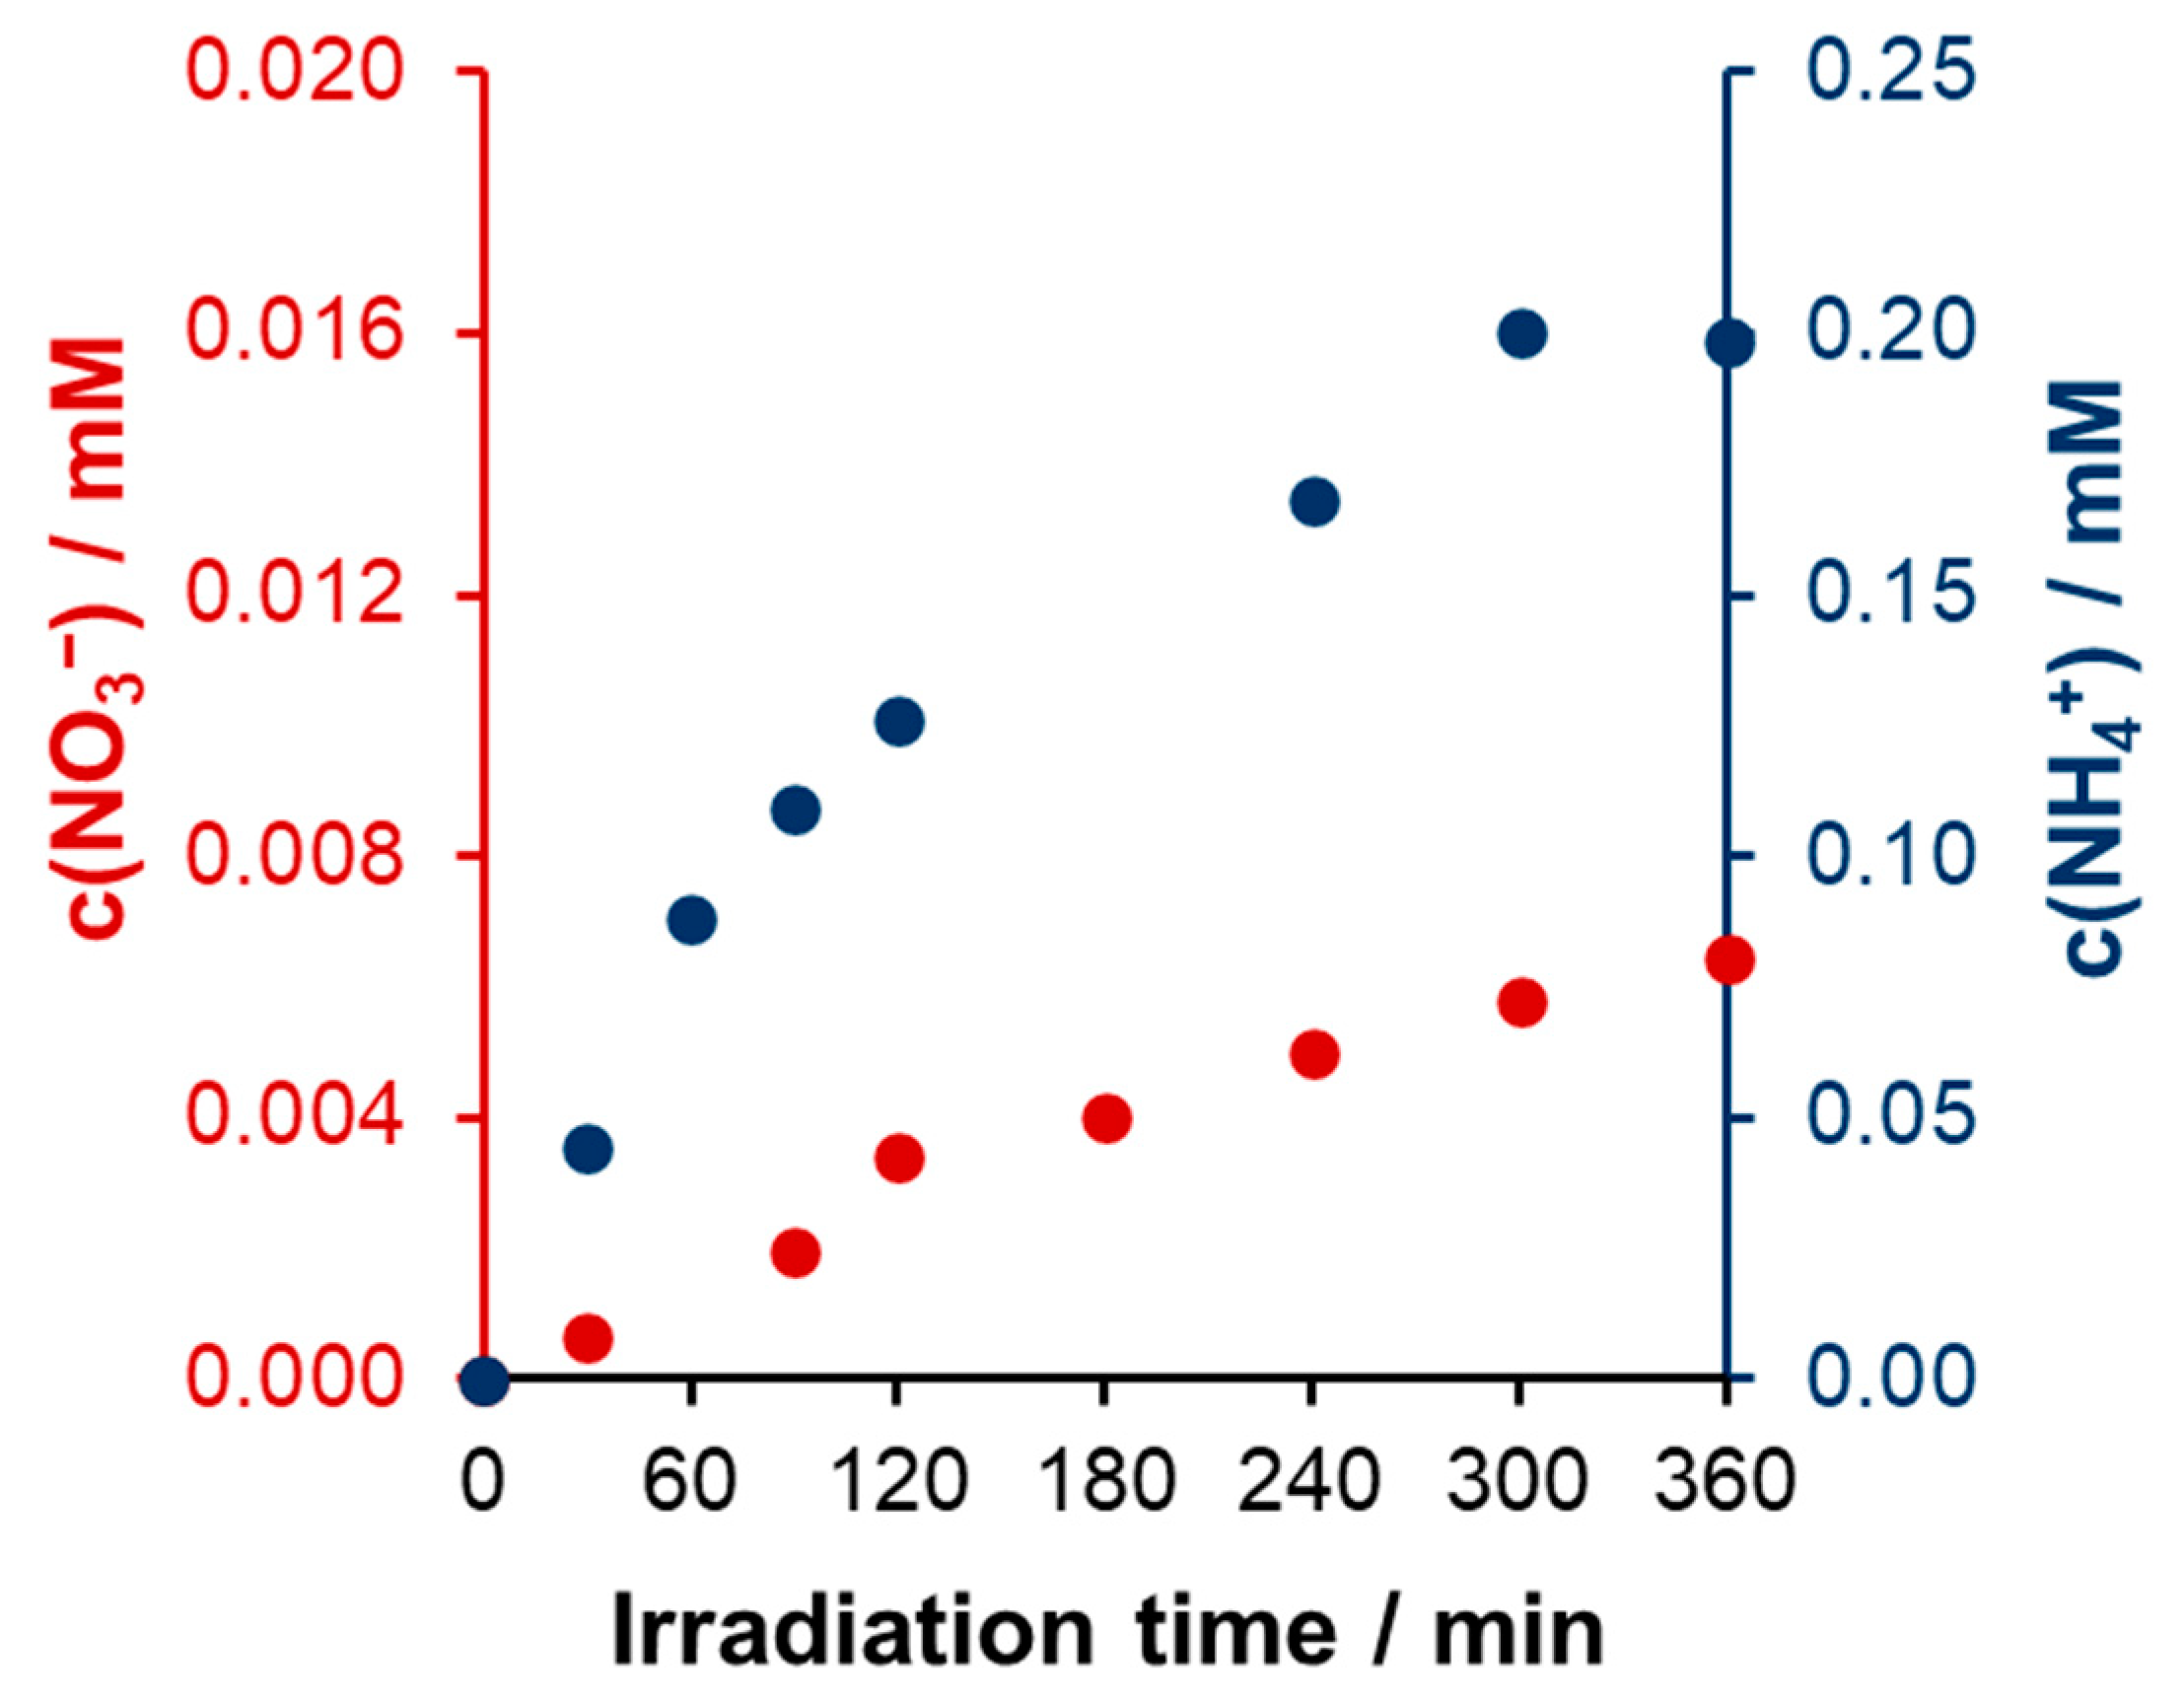
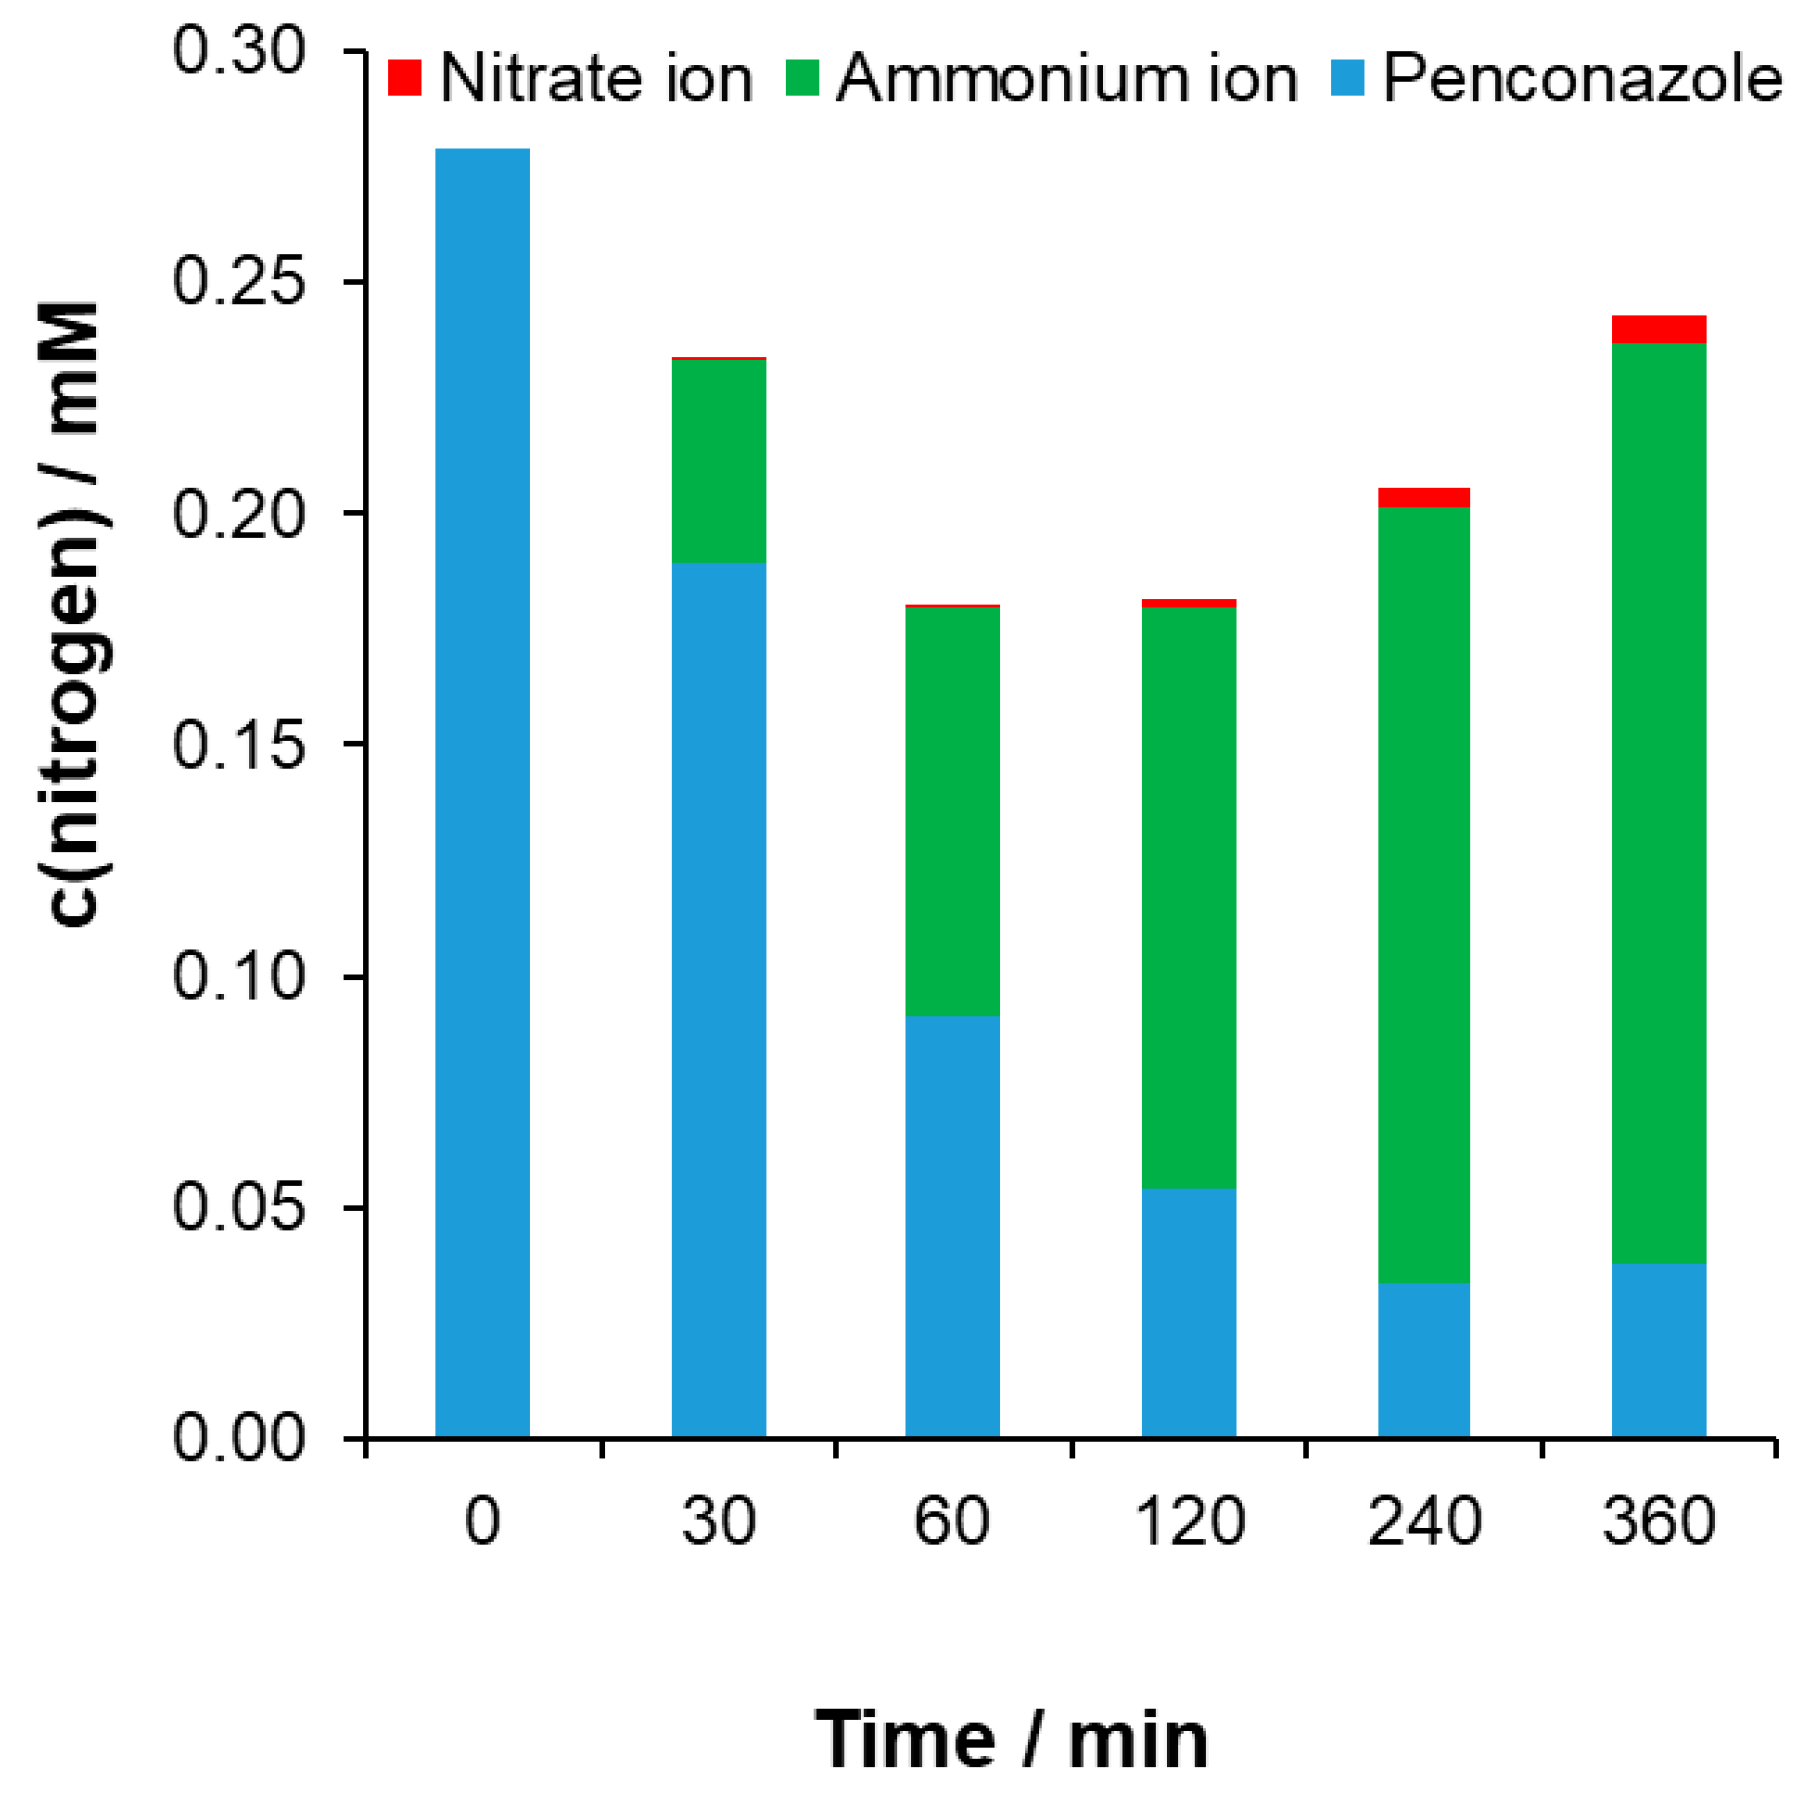
Nitrogen Balance
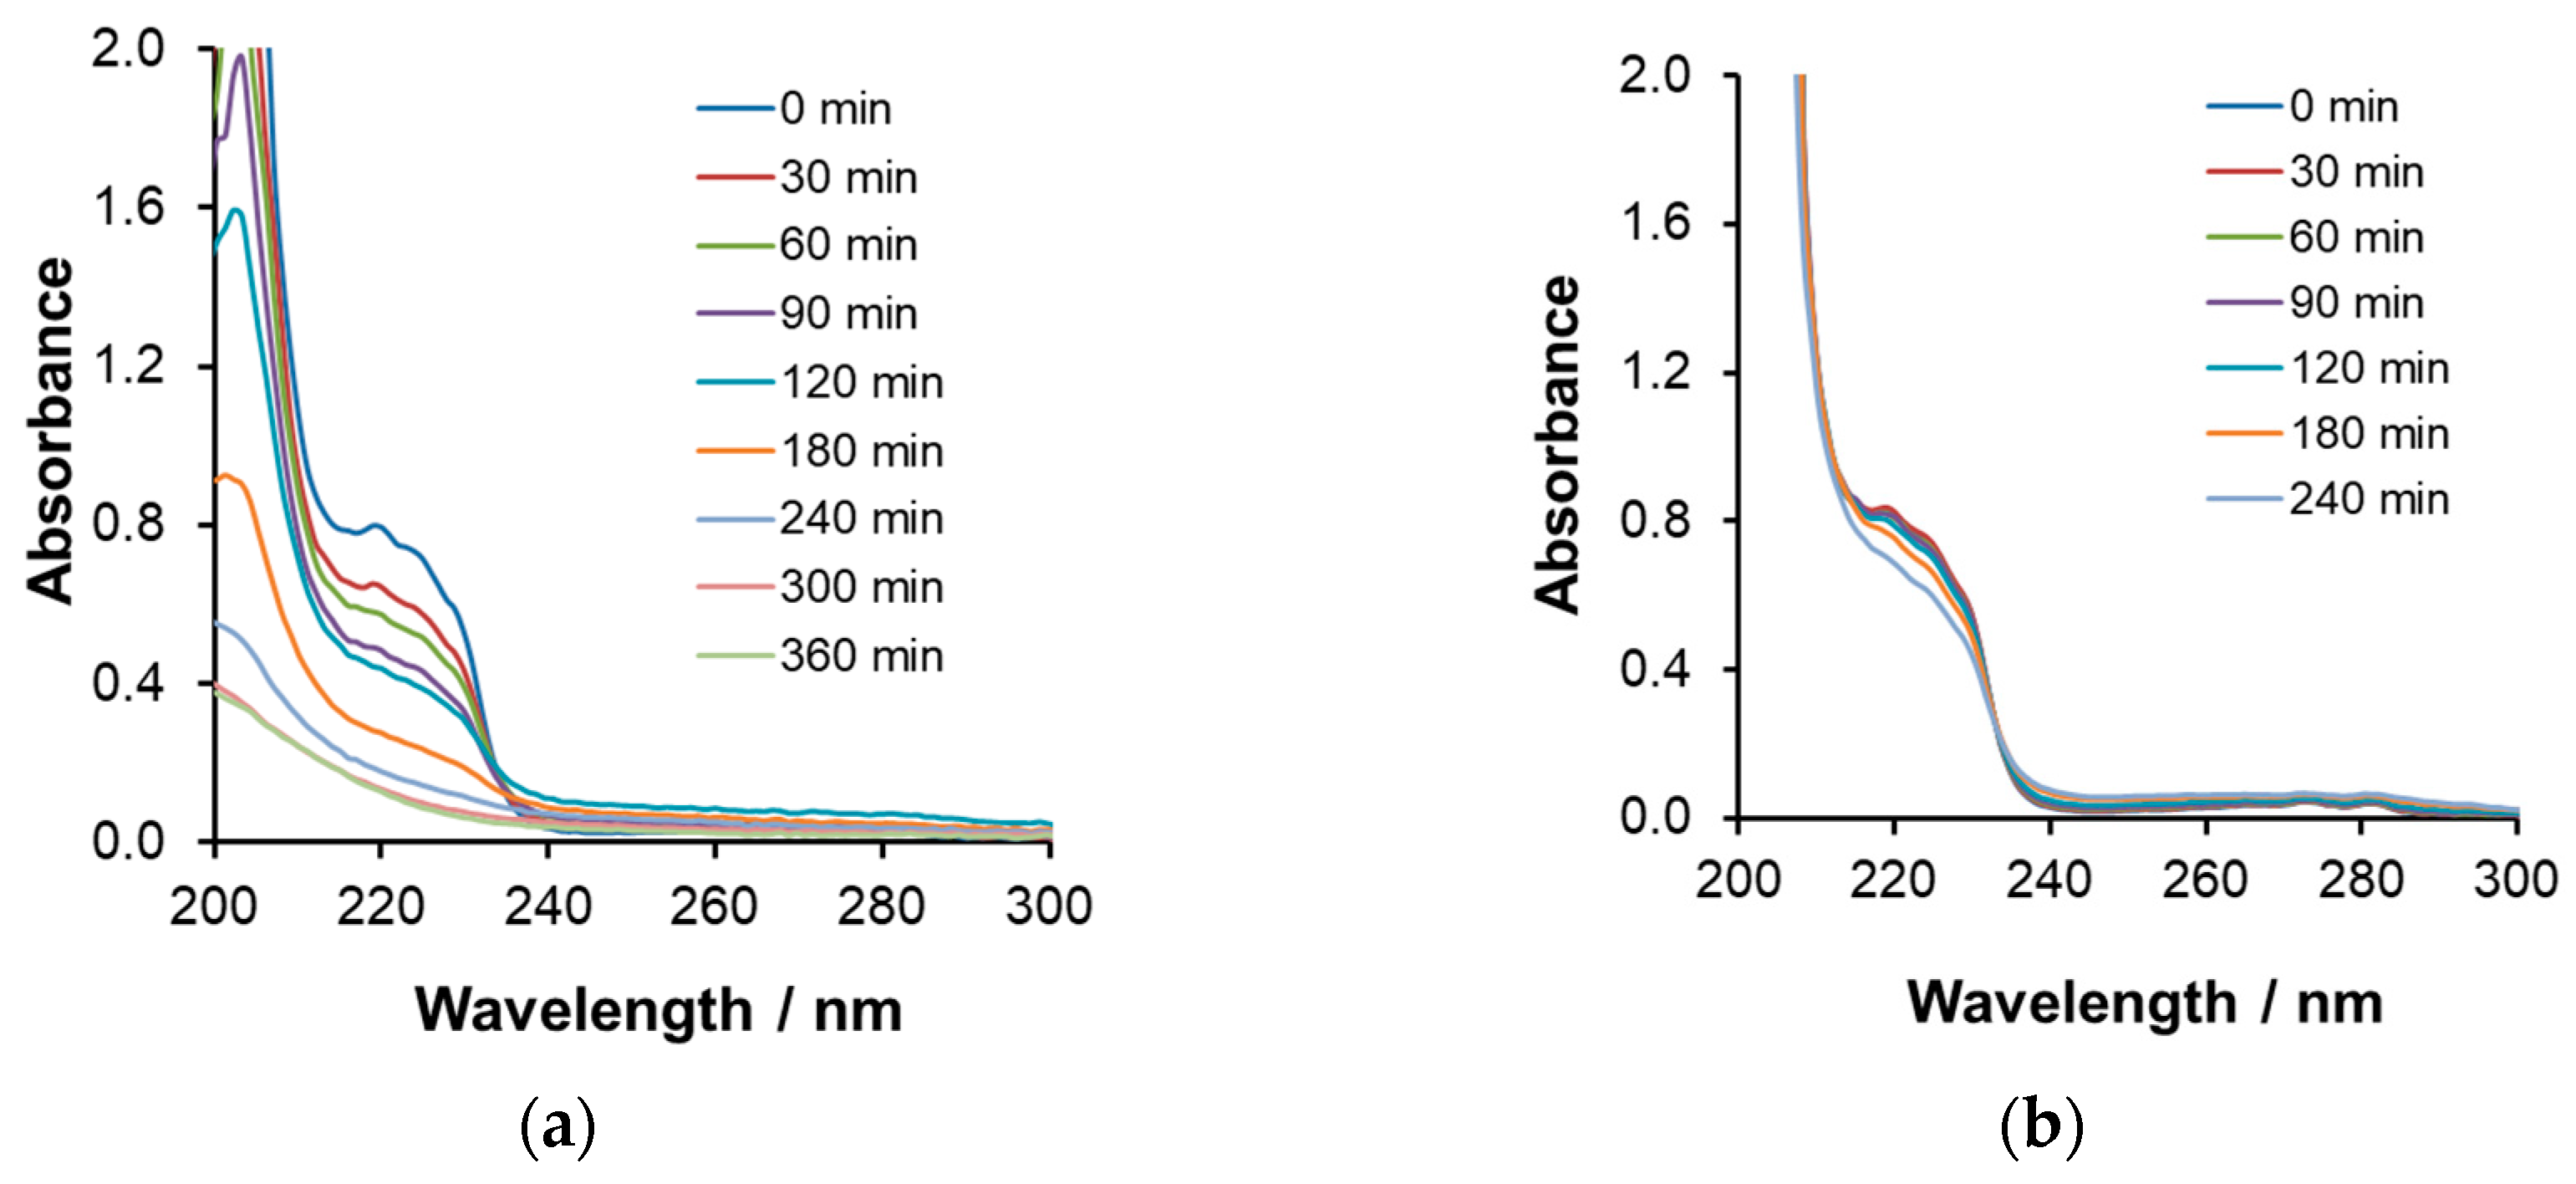
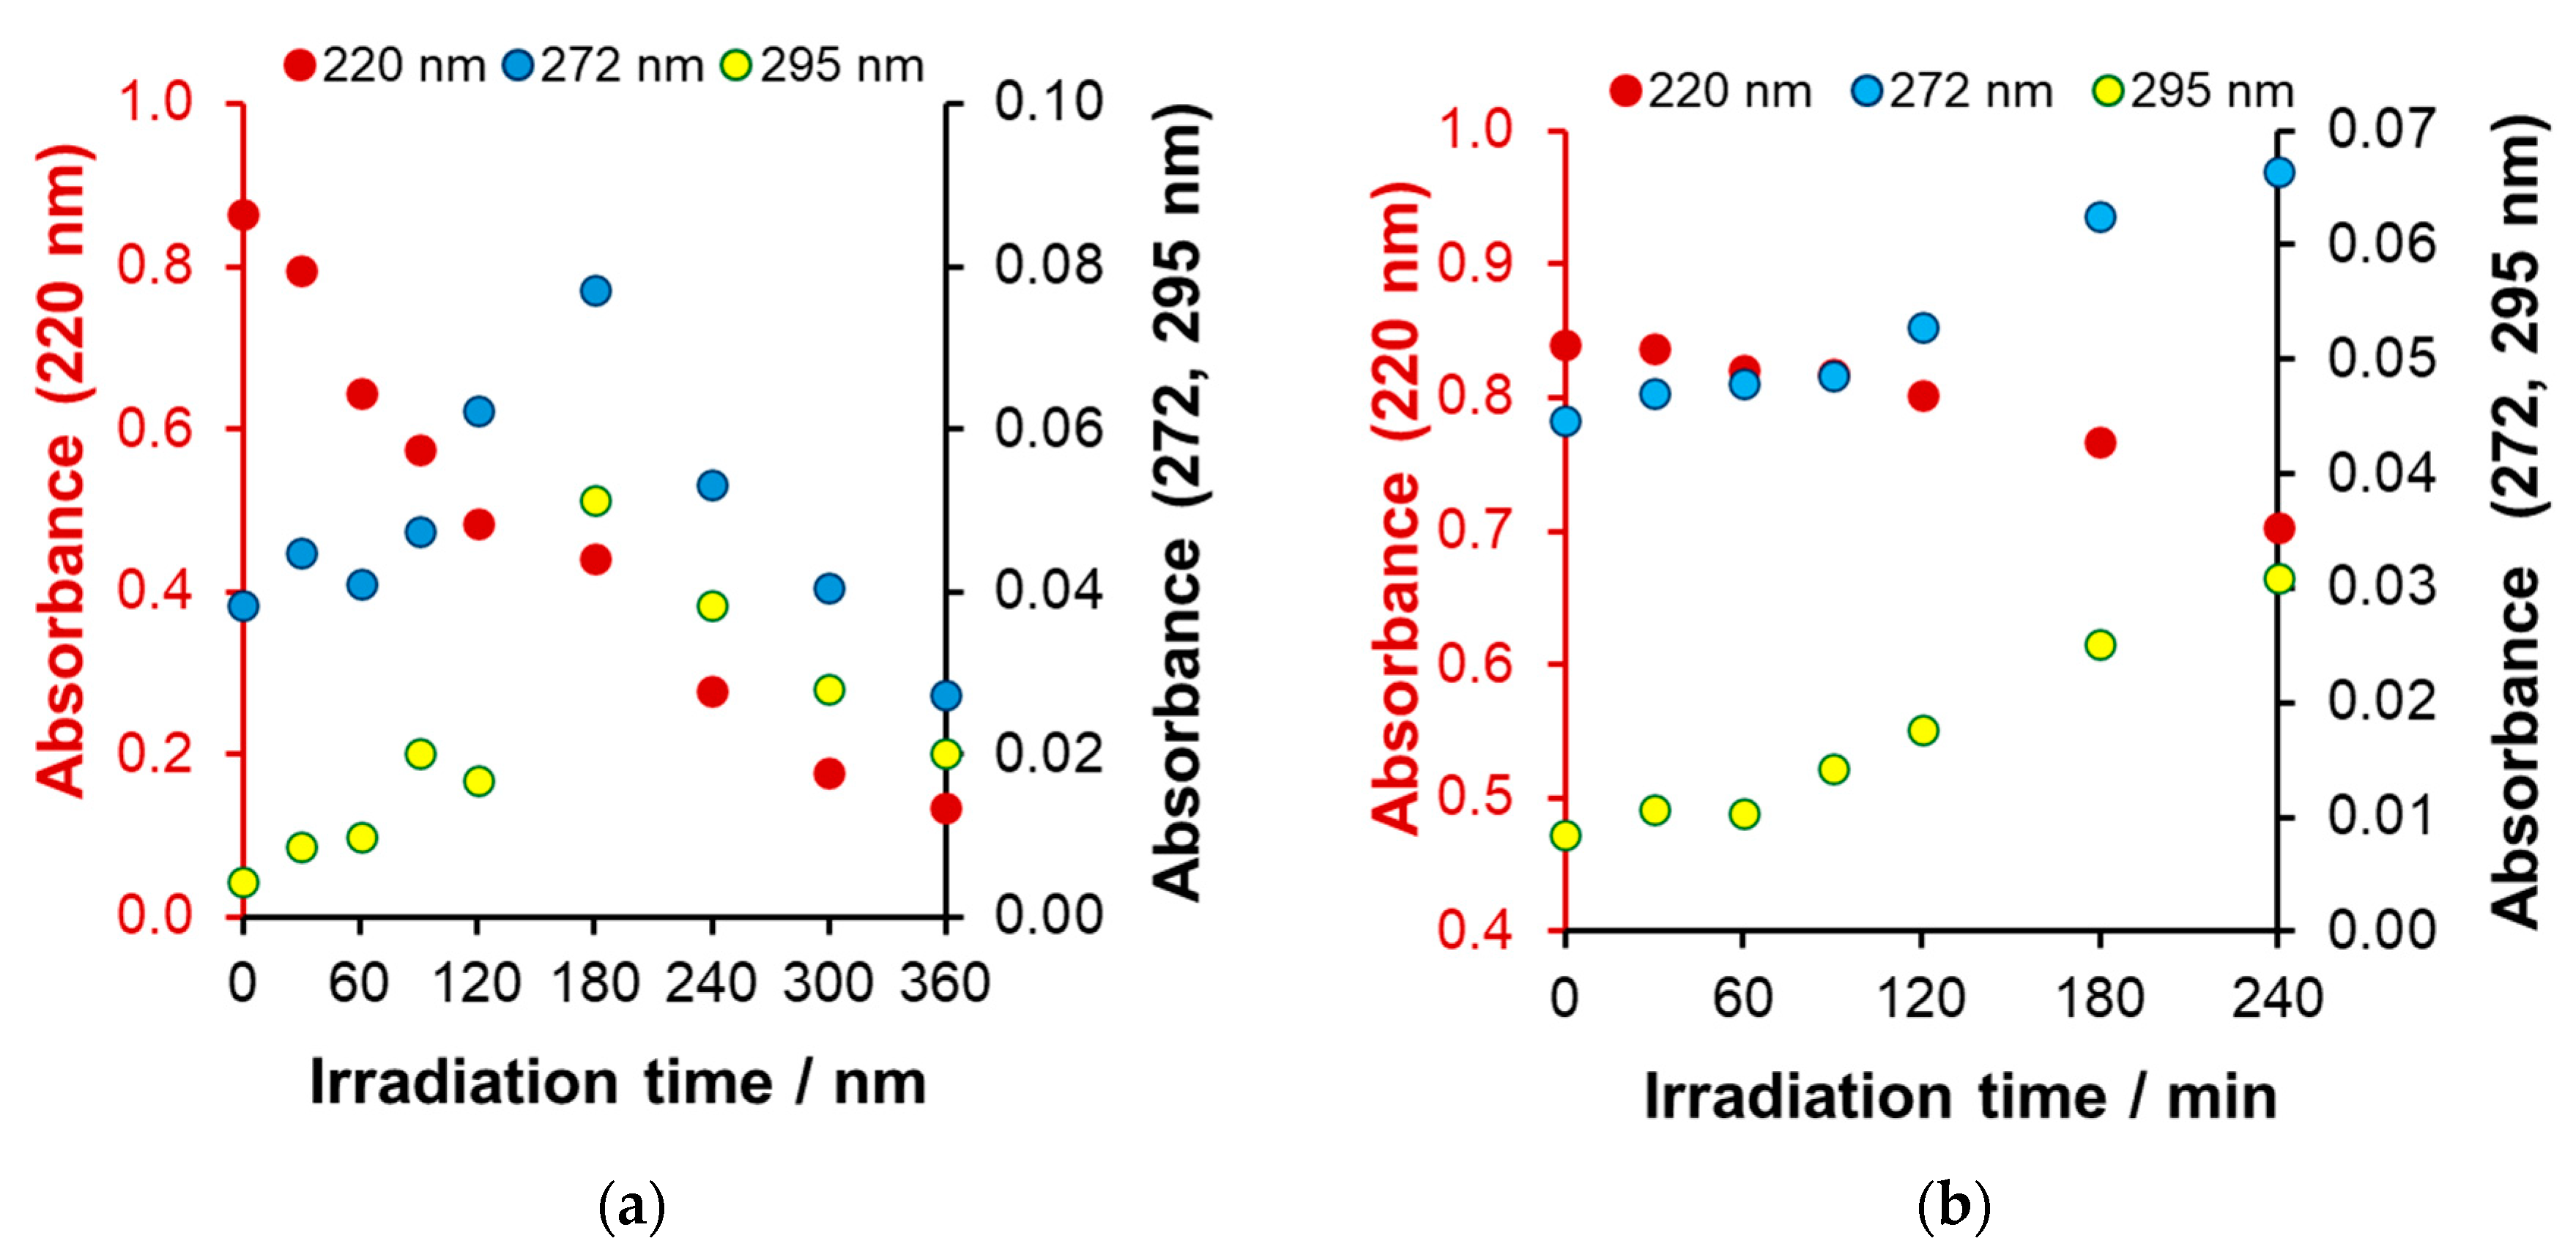
Spectral Changes
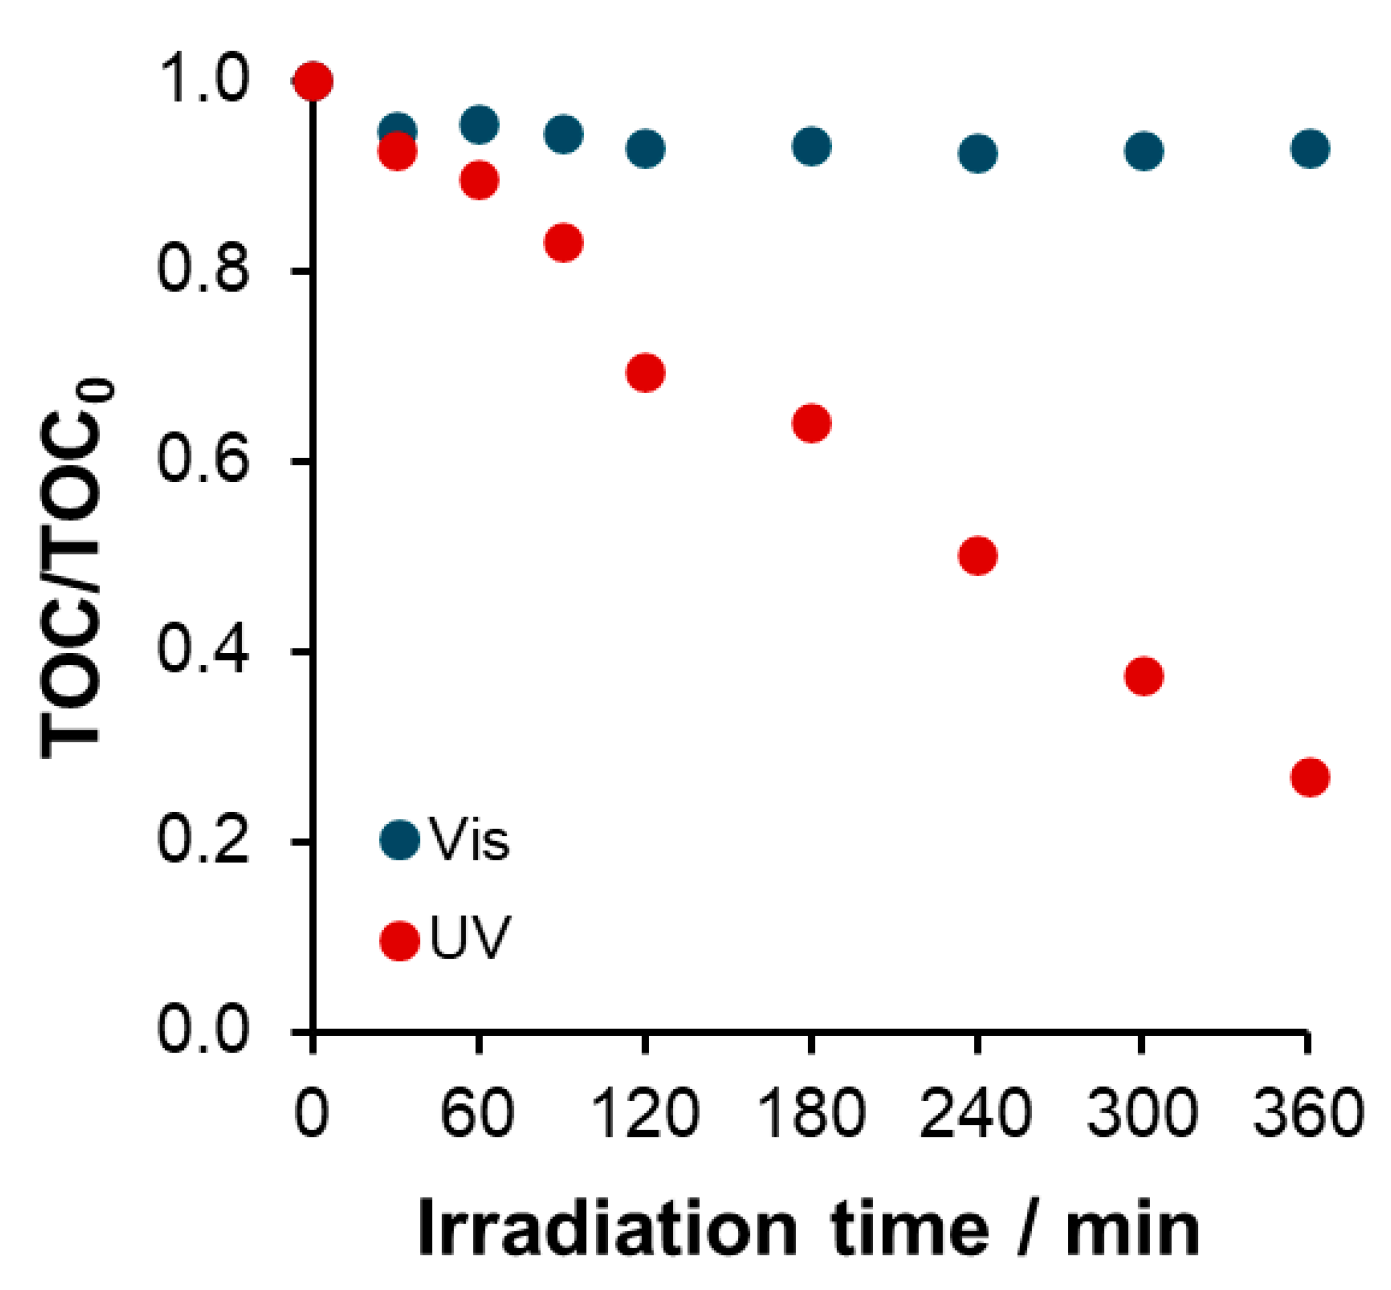
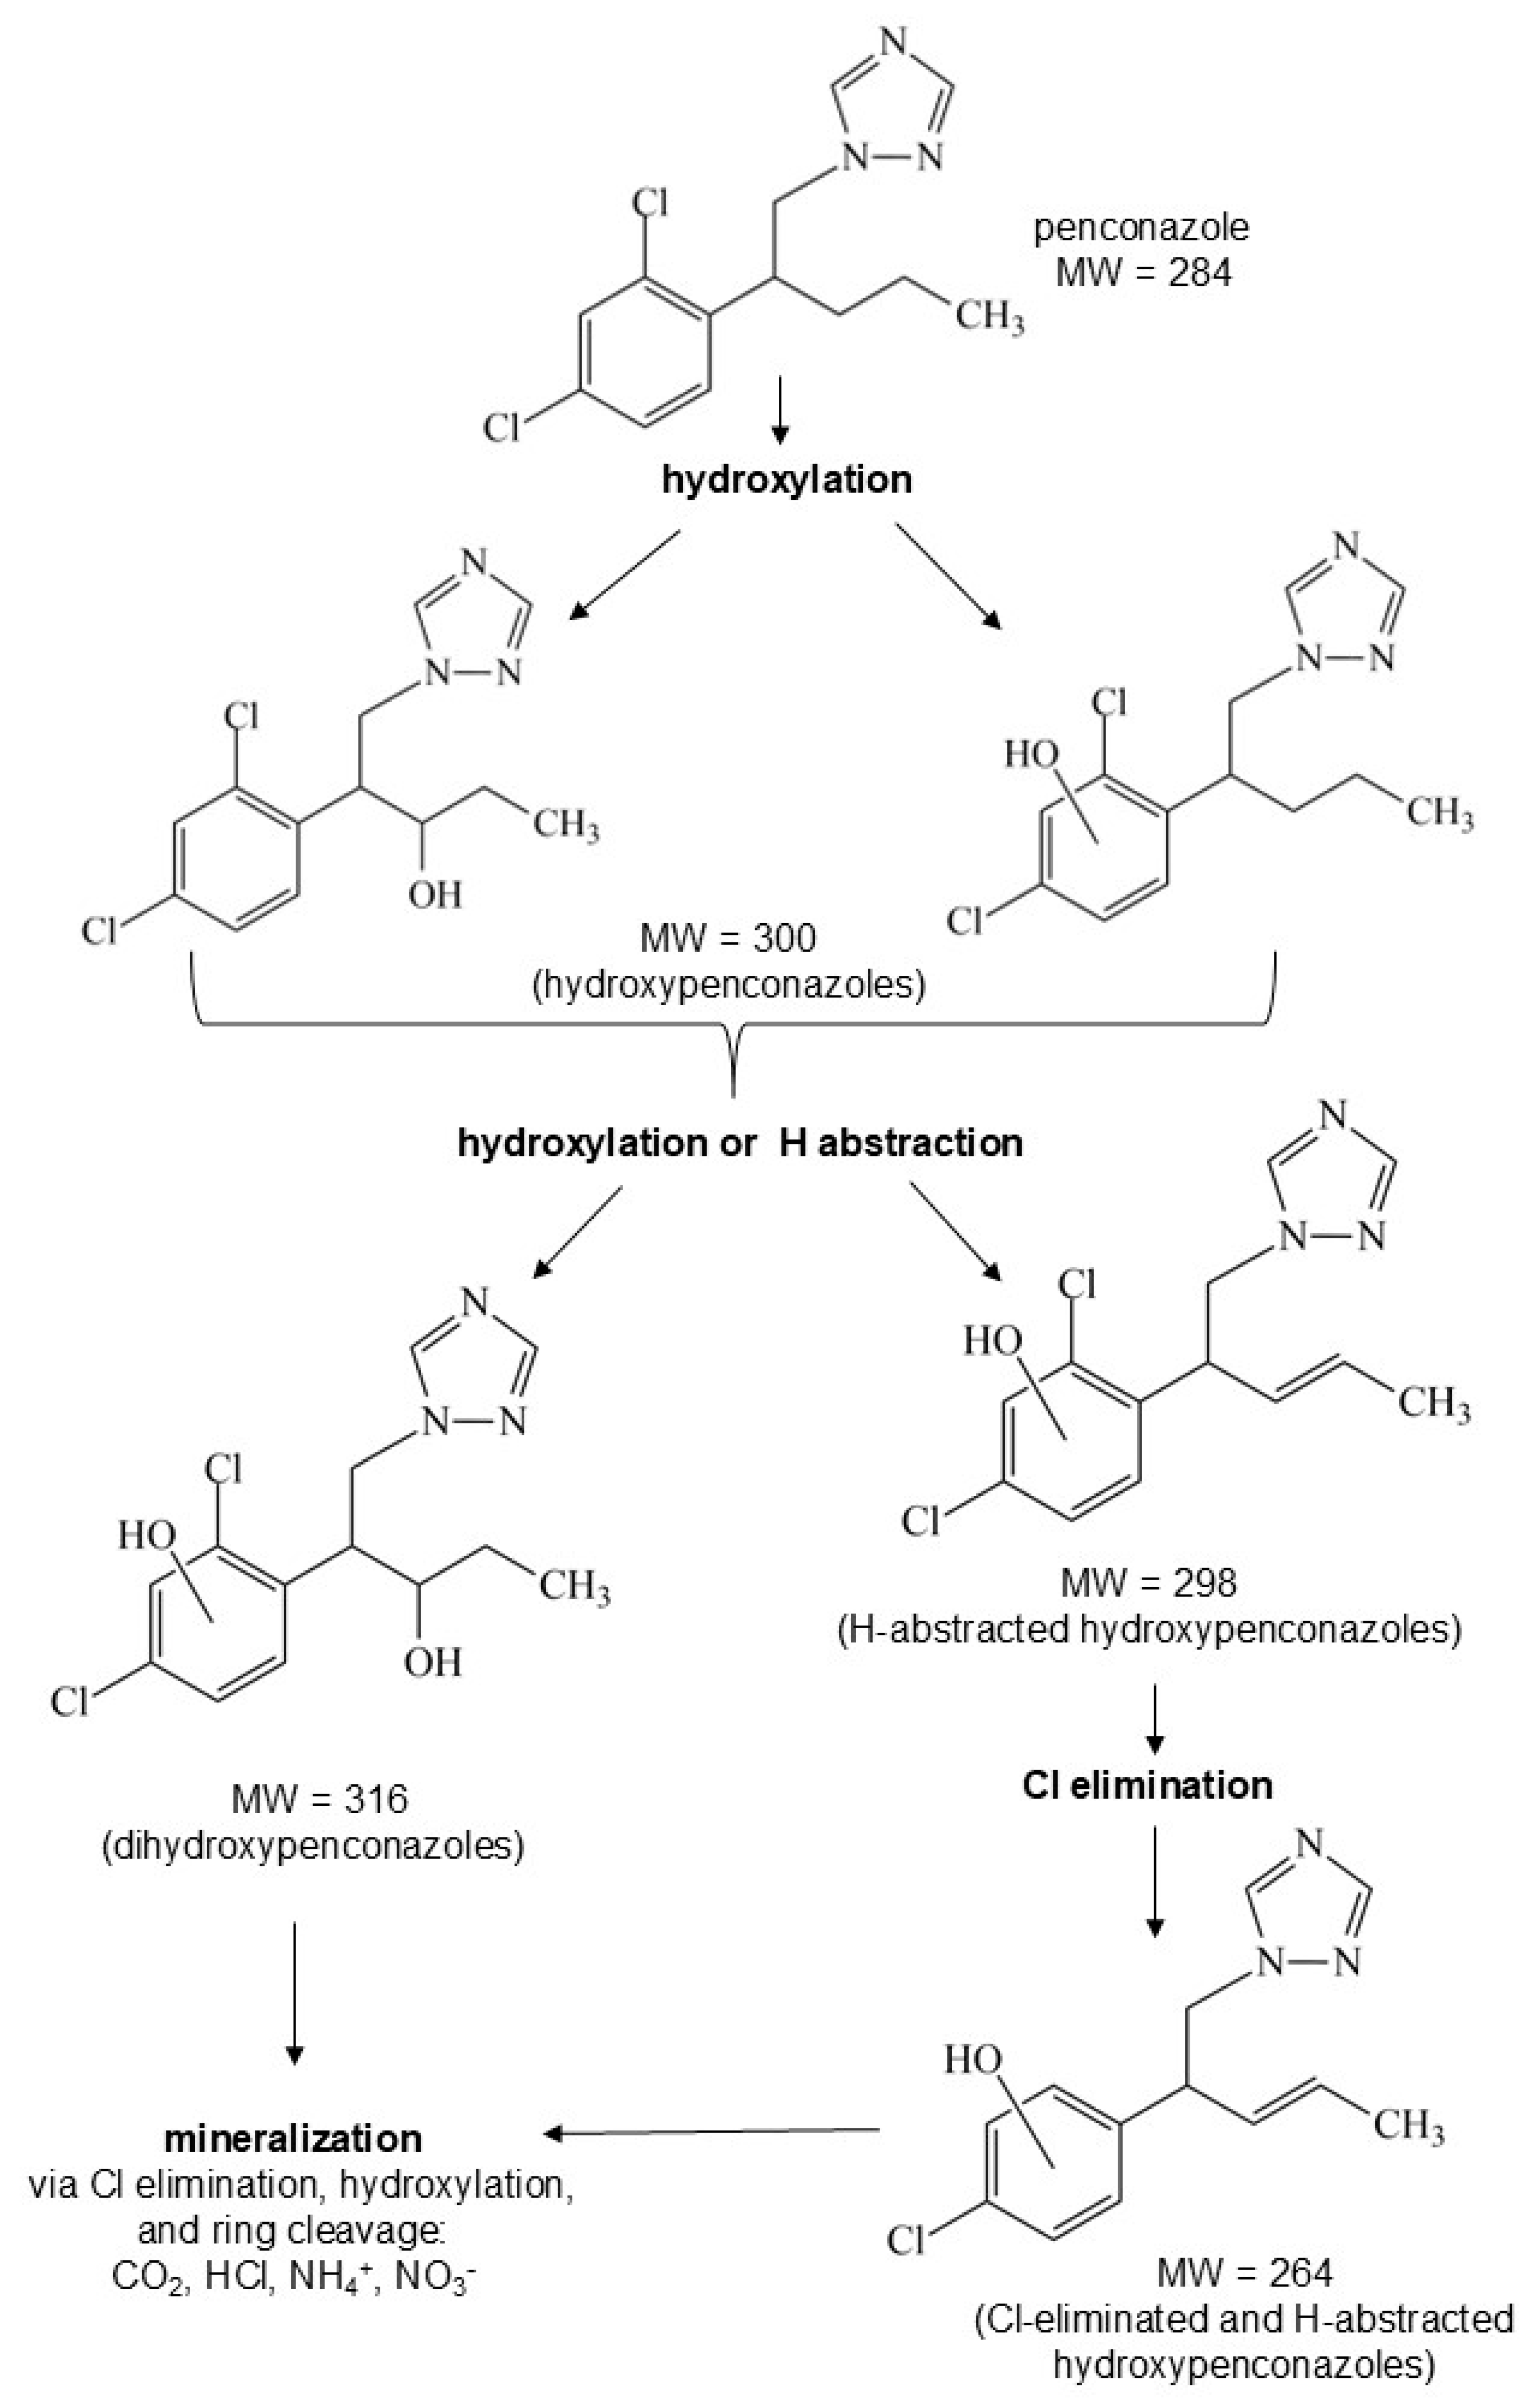
Mineralization and Intermediates
Identification of Intermediates
2.2. Stability, Reusability of the Photocatalyst
2.3. Ecotoxicity Results
3. Materials and Methods
3.1. Materials
3.2. Penconazole Model Solution
3.3. Photochemical Experiments
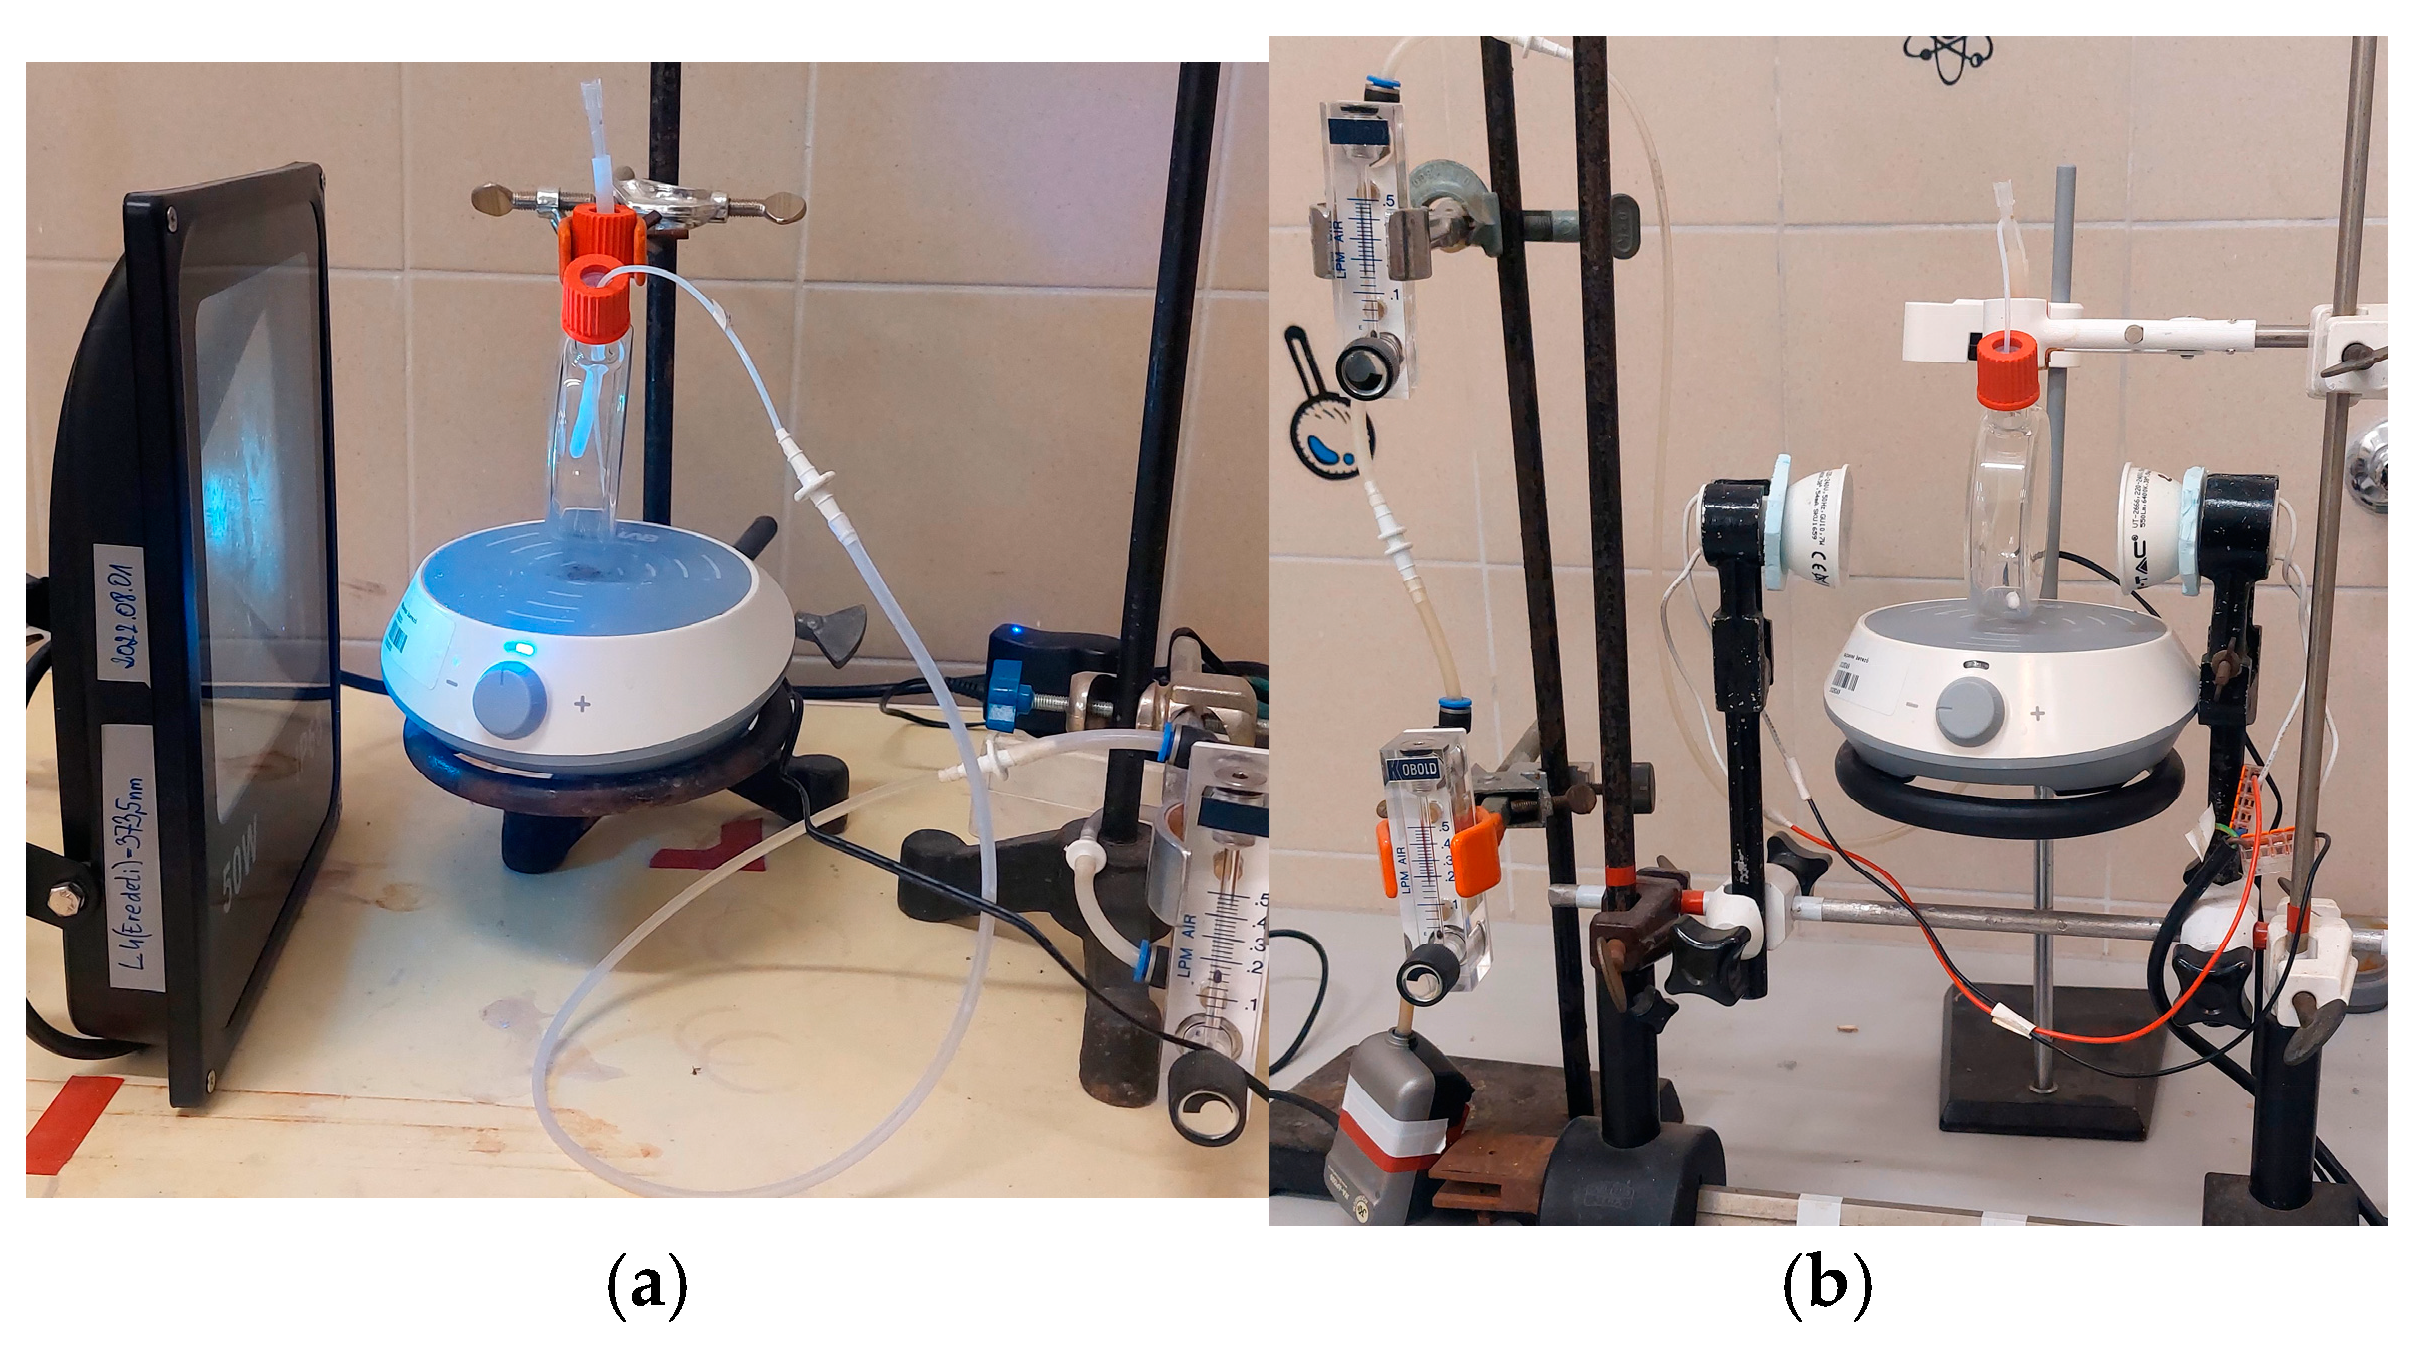
3.3.1. Reactor
3.3.2. Experimental Conditions
3.4. Analysis of Samples
3.4.1. UV-Vis Light Absorption and pH Measurements
3.4.2. HPLC Analysis
| 0 min: 89% A, 11% B | 14 min: 89% A, 11% B |
| 10 min: 5% A, 95% B | 18 min: 89% A, 11% B |
| 13 min: 5% A, 95% B |
3.4.3. Ion Chromatography
3.4.4. Total Organic Carbon Measurement
3.4.5. Determination of Ammonia
- -
- A: sodium salicylate (C7H5NaO3), tripotassium citrate (K3C6O7·H2O), aqueous solution of nitro-prusside sodium (Na2[Fe(CN)5NO] 2H2O);
- -
- B: alkaline solution of sodium dichloroisocyanurate (C3Cl2N3NaO3·2H2O).
3.4.6. Toxicity Measurements
4. Conclusions
Supplementary Materials
Author Contributions
Funding
Data Availability Statement
Acknowledgments
Conflicts of Interest
References
- Khmelevtsova, L.; Azhogina, T.; Karchava, S.; Klimova, M.; Polienko, E.; Litsevich, A.; Chernyshenko, E.; Khammami, M.; Sazykin, I.; Sazykina, M. Effect of Mineral Fertilizers and Pesticides Application on Bacterial Community and Antibiotic-Resistance Genes Distribution in Agricultural Soils. Agronomy 2024, 14, 1021. [Google Scholar] [CrossRef]
- Hu, Y.; Liu, Y. Impact of Fertilizer and Pesticide Reductions on Land Use in China Based on Crop-Land Integrated Model. Land Use Policy 2024, 141, 107155. [Google Scholar] [CrossRef]
- Cornejo, A.; Pérez, J.; Alonso, A.; López-Rojo, N.; Monroy, S.; Boyero, L. A Common Fungicide Impairs Stream Ecosystem Functioning through Effects on Aquatic Hyphomycetes and Detritivorous Caddisflies. J. Environ. Manag. 2020, 263, 110425. [Google Scholar] [CrossRef] [PubMed]
- Ádám, B.; Cocco, P.; Godderis, L. Hazardous Effects of Pesticides on Human Health. Toxics 2024, 12, 186. [Google Scholar] [CrossRef] [PubMed]
- Li, Y.; Han, L.; Wang, B.; Zhang, J.; Nie, J. Dynamic Degradation of Penconazole and Its Effect on Antioxidant Enzyme Activity and Malondialdehyde Content in Apple Fruit. Sci. Hortic. 2022, 300, 111053. [Google Scholar] [CrossRef]
- Rueegg, J.; Siegfried, W. Residues of Difenoconazole and Penconazole on Apple Leaves and Grass and Soil in an Apple Orchard in North-Eastern Switzerland. Crop Prot. 1996, 15, 27–31. [Google Scholar] [CrossRef]
- Cortes, L.G.; Marinov, D.; Sanseverino, I.; Cuenca, A.N.; Niegowska, M.; Rodriguez, E.P.; Lettieri, T. Selection of Substances for the 3rd Watch List under the Water Framework Directive; Publications Office of the European Union: Luxembourg, 2022. [Google Scholar]
- Icoglu Aksakal, F.; Ciltas, A. Developmental Toxicity of Penconazole in Zebrfish (Danio Rerio) Embryos. Chemosphere 2018, 200, 8–15. [Google Scholar] [CrossRef]
- Chandra, S.; Roychoudhury, A. Penconazole, Paclobutrazol, and Triacontanol in Overcoming Environmental Stress in Plants. In Protective Chemical Agents in the Amelioration of Plant Abiotic Stress; Wiley: New York, NY, USA, 2020; pp. 510–534. [Google Scholar]
- Kumari, P.; Kumar, A. Advanced Oxidation Process: A Remediation Technique for Organic and Non-Biodegradable Pollutant. Results Surf. Interfaces 2023, 11, 100122. [Google Scholar] [CrossRef]
- Lopez-Arago, N.; Munoz, M.; de Pedro, Z.M.; Casas, J.A. Natural Magnetite as an Effective and Long-Lasting Catalyst for CWPO of Azole Pesticides in a Continuous up-Flow Fixed-Bed Reactor. Environ. Sci. Pollut. Res. 2024, 31, 29148–29161. [Google Scholar] [CrossRef]
- Pacholak, A.; Burlaga, N.; Frankowski, R.; Zgoła-Grześkowiak, A.; Kaczorek, E. Azole Fungicides: (Bio)Degradation, Transformation Products and Toxicity Elucidation. Sci. Total Environ. 2022, 802, 149917. [Google Scholar] [CrossRef]
- Gopinath, K.P.; Madhav, N.V.; Krishnan, A.; Malolan, R.; Rangarajan, G. Present Applications of Titanium Dioxide for the Photocatalytic Removal of Pollutants from Water: A Review. J. Environ. Manag. 2020, 270, 110906. [Google Scholar] [CrossRef] [PubMed]
- Stamatis, N.; Antonopoulou, M.; Konstantinou, I. Photocatalytic Degradation Kinetics and Mechanisms of Fungicide Tebuconazole in Aqueous TiO2 Suspensions. Catal. Today 2015, 252, 93–99. [Google Scholar] [CrossRef]
- Bragetta, M.; Germani, R.; Tiecco, M.; Alabed, H.B.R.; Del Giacco, T. Effect of Halide Ions on the TiO2-Mediated Photocatalysis of Carbendazim in Aqueous Medium Under Near-Ultraviolet Light Irradiation. Water Air Soil Pollut. 2024, 235, 713. [Google Scholar] [CrossRef]
- Islam, J.B.; Furukawa, M.; Tateishi, I.; Katsumata, H.; Kaneco, S. Photocatalytic Degradation of a Typical Agricultural Chemical: Metalaxyl in Water Using TiO2 under Solar Irradiation. SN Appl. Sci. 2020, 2, 925. [Google Scholar] [CrossRef]
- Aliste, M.; Garrido, I.; Pérez-Lucas, G.; Flores, P.; Hellín, P.; Navarro, S.; Fenoll, J. Appraisal of Water Matrix on the Removal of Fungicide Residues by Heterogeneous Photocatalytic Treatment Using UV-LED Lamp as Light Source. Environ. Sci. Pollut. Res. 2021, 28, 23849–23858. [Google Scholar] [CrossRef]
- Christian M’Bra, I.; Keller, N.; Trokourey, A.; Robert, D. Photocatalytic Efficiency of Suspended and Immobilized TiO2 P25 for Removing Myclobutanil, Penconazole and Their Commercial Formulations. Photocatal. Res. Potential 2023, 1, 1–10. [Google Scholar] [CrossRef]
- Hadei, M.; Mesdaghinia, A.; Nabizadeh, R.; Mahvi, A.H.; Rabbani, S.; Naddafi, K. A Comprehensive Systematic Review of Photocatalytic Degradation of Pesticides Using Nano TiO2. Environ. Sci. Pollut. Res. 2021, 28, 13055–13071. [Google Scholar] [CrossRef]
- EL-Saeid, M.H.; Alotaibi, M.O.; Alshabanat, M.; AL-Anazy, M.M.; Alharbi, K.R.; Altowyan, A.S. Impact of Photolysis and TiO2 on Pesticides Degradation in Wastewater. Water 2021, 13, 655. [Google Scholar] [CrossRef]
- EL-Saeid, M.H.; BaQais, A.; Alshabanat, M. Study of the Photocatalytic Degradation of Highly Abundant Pesticides in Agricultural Soils. Molecules 2022, 27, 634. [Google Scholar] [CrossRef]
- M’Bra, I.C.; Atheba, G.P.; Robert, D.; Drogui, P.; Trokourey, A. Photocatalytic Degradation of Paraquat Herbicide Using a Fixed Bed Reactor Containing TiO2 Nanoparticles Coated onto β-SiC Alveolar Foams. Am. J. Analyt. Chem. 2019, 10, 171–184. [Google Scholar] [CrossRef]
- Dang, J.; Pei, W.; Hu, F.; Yu, Z.; Zhao, S.; Hu, J.; Liu, J.; Zhang, D.; Jing, Z.; Lei, X. Photocatalytic Degradation and Toxicity Analysis of Sulfamethoxazole Using TiO2/BC. Toxics 2023, 11, 818. [Google Scholar] [CrossRef] [PubMed]
- Frankowski, R.; Zgoła-Grześkowiak, A.; Grześkowiak, T.; Stanisz, E.; Werner, J.; Płatkiewicz, J. Photocatalytic Treatment of Emerging Contaminants with Ag-Modified Titania—Is There a Risk Arising from the Degradation Products? Processes 2022, 10, 2523. [Google Scholar] [CrossRef]
- Makram, S.; Ibrahim, H.; Mohammed, M. Effect of Direct Sunlight and UV-rays on Degradation of Bupirimate, Penconazole and Profenofos. Fayoum J. Agric. Res. Dev. 2020, 34, 103–112. [Google Scholar] [CrossRef]
- Voigt, M.; Wellen, N.; Dluziak, J.-M.; Langerbein, V.; Jaeger, M. Photoinduced Degradation of Three Azole Compounds from 3rd EU Watchlist Monitored by High-Resolution Higher-Order Mass Spectrometry–Part I: A Mechanistic Study. Environ. Adv. 2022, 9, 100288. [Google Scholar] [CrossRef]
- Voigt, M.; Dluziak, J.-M.; Wellen, N.; Langerbein, V.; Jaeger, M. Photoinduced Degradation of Three Azole Compounds from 3rd EU Watchlist Monitored by High-Resolution Higher-Order Mass Spectrometry–Part II A Critical in Silico Ecotoxicity Assessment and Application of Ecotoxicity Equivalents. Environ. Adv. 2023, 11, 100356. [Google Scholar] [CrossRef]
- Szabó-Bárdos, E.; Somogyi, K.; Törő, N.; Kiss, G.; Horváth, A. Photocatalytic Decomposition of L-Phenylalanine over TiO2: Identification of Intermediates and the Mechanism of Photodegradation. Appl. Catal. B 2011, 101, 471–478. [Google Scholar] [CrossRef]
- Garrido, I.; Aznar-Cervantes, S.; Aliste, M.; Yáñez-Gascón, M.J.; Vela, N.; Cenis, J.L.; Navarro, S.; Fenoll, J. Photocatalytic Performance of Electrospun Silk Fibroin/ZnO Mats to Remove Pesticide Residues from Water under Natural Sunlight. Catalysts 2020, 10, 110. [Google Scholar] [CrossRef]
- Del Puerto, O.; Gonçalves, N.P.F.; Medana, C.; Prevot, A.B.; Roslev, P. Attenuation of Toxicity and Occurrence of Degradation Products of the Fungicide Tebuconazole after Combined Vacuum UV and UVC Treatment of Drinking Water. Environ. Sci. Pollut. Res. 2022, 29, 58312–58325. [Google Scholar] [CrossRef]
- Armbrust, K.L. Pesticide Hydroxyl Radical Rate Constants: Measurements and Estimates of Their Importance in Aquatic Environments. Environ. Toxicol. Chem. 2000, 19, 2175–2180. [Google Scholar] [CrossRef]
- Bamba, D.; Coulibaly, M.; Robert, D. Nitrogen-Containing Organic Compounds: Origins, Toxicity and Conditions of Their Photocatalytic Mineralization over TiO2. Sci. Total Environ. 2017, 580, 1489–1504. [Google Scholar] [CrossRef]
- Fónagy, O.; Szabó-Bárdos, E.; Horváth, O.; Kiss, G. Application of Ozonation and Silveration for Heterogeneous Photocatalytic Degradation of an Aromatic Surfactant. J. Photochem. Photobiol. A Chem. 2018, 366, 152–161. [Google Scholar] [CrossRef]
- Szabó-Bárdos, E.; Markovics, O.; Horváth, O.; Törő, N.; Kiss, G. Photocatalytic Degradation of Benzenesulfonate on Colloidal Titanium Dioxide. Water Res. 2011, 45, 1617–1628. [Google Scholar] [CrossRef] [PubMed]
- Hensen, B.; Olsson, O.; Kümmerer, K. The Role of Irradiation Source Setups and Indirect Phototransformation: Kinetic Aspects and the Formation of Transformation Products of Weakly Sunlight-Absorbing Pesticides. Sci. Total Environ. 2019, 695, 133808. [Google Scholar] [CrossRef] [PubMed]
- Wafi, A.; Szabó-Bárdos, E.; Horváth, O.; Makó, É.; Jakab, M.; Zsirka, B. Coumarin-Based Quantification of Hydroxyl Radicals and Other Reactive Species Generated on Excited Nitrogen-Doped TiO2. J. Photochem. Photobiol. A Chem. 2021, 404, 112913. [Google Scholar] [CrossRef]
- Hatchard, C.G.; Parker, C.A. A New Sensitive Chemical Actinometer-II. Potassium Ferrioxalate as a Standard Chemical Actinometer. Proc. R Soc. Lond. A Math Phys. Sci. 1956, 235, 518–536. [Google Scholar] [CrossRef]
- Szabó-Bárdos, E.; Kulcsár, P.; Kováts, N.; Békéssy, Z.; Eck-Varanka, B.; Horváth, O. Assessment of the Potential Bactericide Effect of Self-Cleaning Floors: A Proposed Protocol. Luminescence 2020, 35, 434–436. [Google Scholar] [CrossRef]


Disclaimer/Publisher’s Note: The statements, opinions and data contained in all publications are solely those of the individual author(s) and contributor(s) and not of MDPI and/or the editor(s). MDPI and/or the editor(s) disclaim responsibility for any injury to people or property resulting from any ideas, methods, instructions or products referred to in the content. |
© 2024 by the authors. Licensee MDPI, Basel, Switzerland. This article is an open access article distributed under the terms and conditions of the Creative Commons Attribution (CC BY) license (https://creativecommons.org/licenses/by/4.0/).
Share and Cite
Székely, Á.; Szabó-Bárdos, E.; Fónagy, O.; Horváth, O. Assessing the Photocatalytic Degradation of Penconazole on TiO2 in Aqueous Suspensions: Mechanistic and Ecotoxicity Studies in Aerated and Degassed Systems. Catalysts 2024, 14, 898. https://doi.org/10.3390/catal14120898
Székely Á, Szabó-Bárdos E, Fónagy O, Horváth O. Assessing the Photocatalytic Degradation of Penconazole on TiO2 in Aqueous Suspensions: Mechanistic and Ecotoxicity Studies in Aerated and Degassed Systems. Catalysts. 2024; 14(12):898. https://doi.org/10.3390/catal14120898
Chicago/Turabian StyleSzékely, Ákos, Erzsébet Szabó-Bárdos, Orsolya Fónagy, and Ottó Horváth. 2024. "Assessing the Photocatalytic Degradation of Penconazole on TiO2 in Aqueous Suspensions: Mechanistic and Ecotoxicity Studies in Aerated and Degassed Systems" Catalysts 14, no. 12: 898. https://doi.org/10.3390/catal14120898
APA StyleSzékely, Á., Szabó-Bárdos, E., Fónagy, O., & Horváth, O. (2024). Assessing the Photocatalytic Degradation of Penconazole on TiO2 in Aqueous Suspensions: Mechanistic and Ecotoxicity Studies in Aerated and Degassed Systems. Catalysts, 14(12), 898. https://doi.org/10.3390/catal14120898