
Effect of High Voltage Electrode Material on Methanol Synthesis in a Pulsed Dielectric Barrier Discharge Plasma Reactor

 ,
,
Abstract
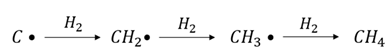
1. Introduction
2. Results and Discussion
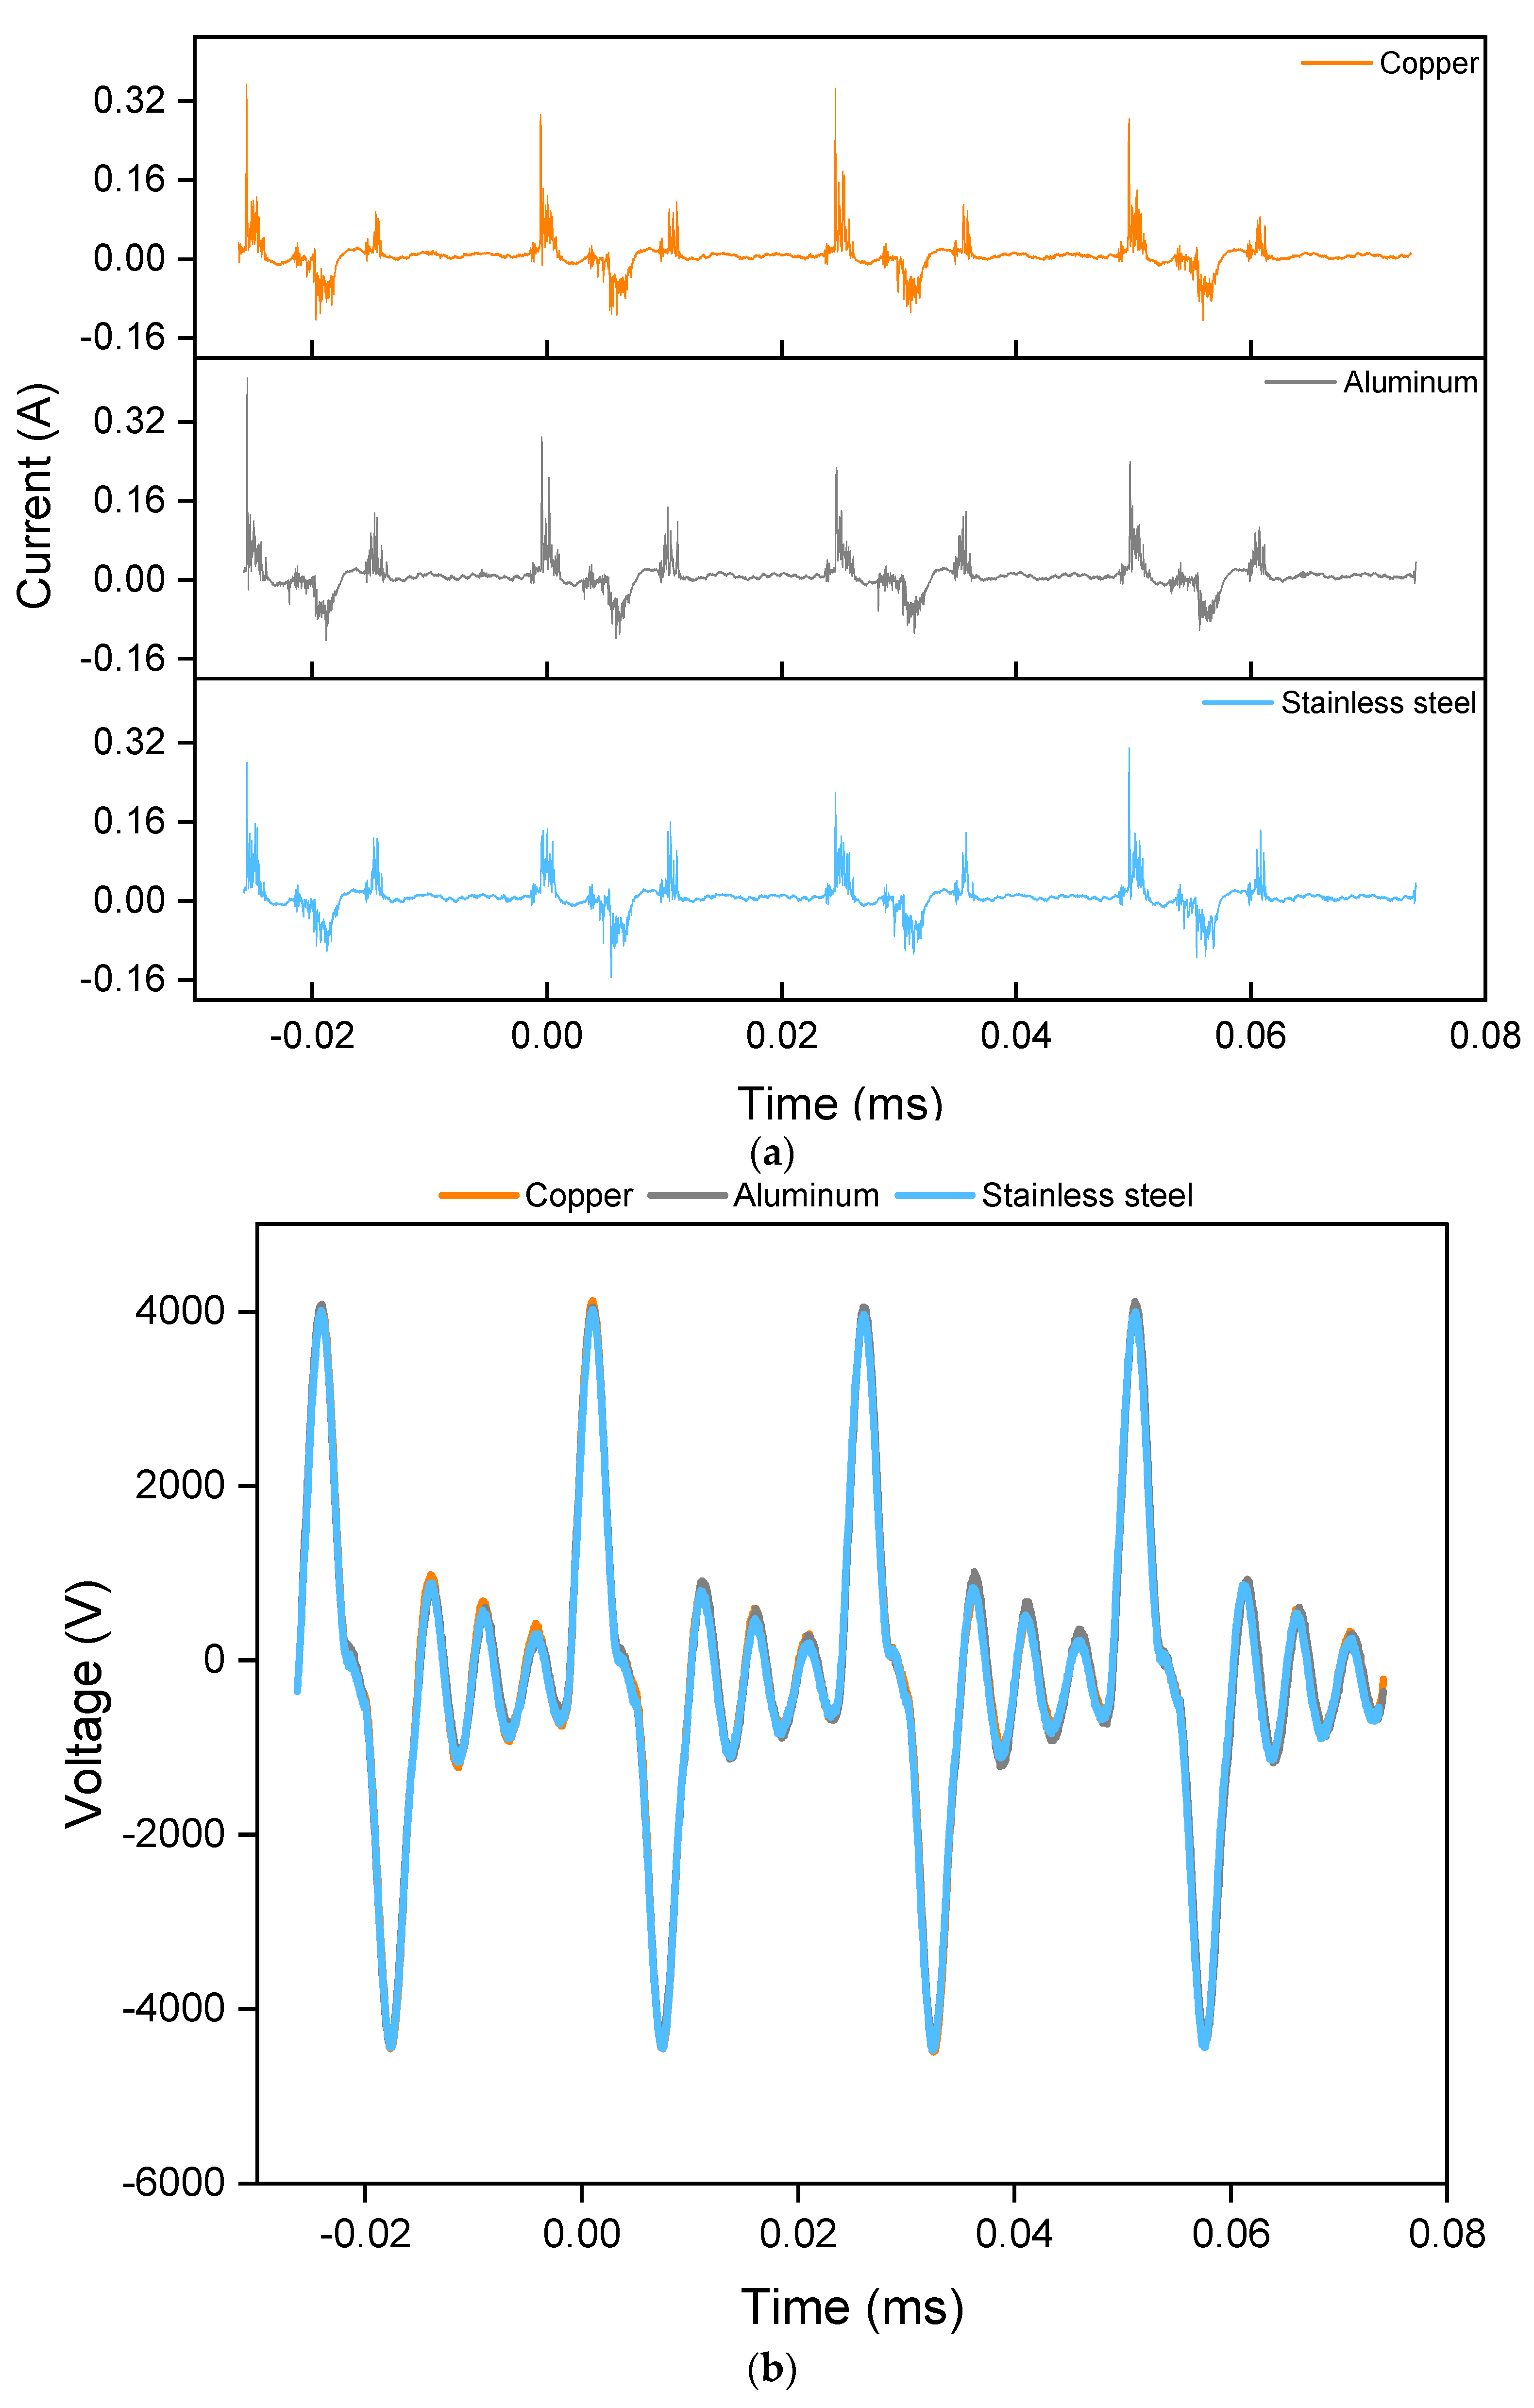
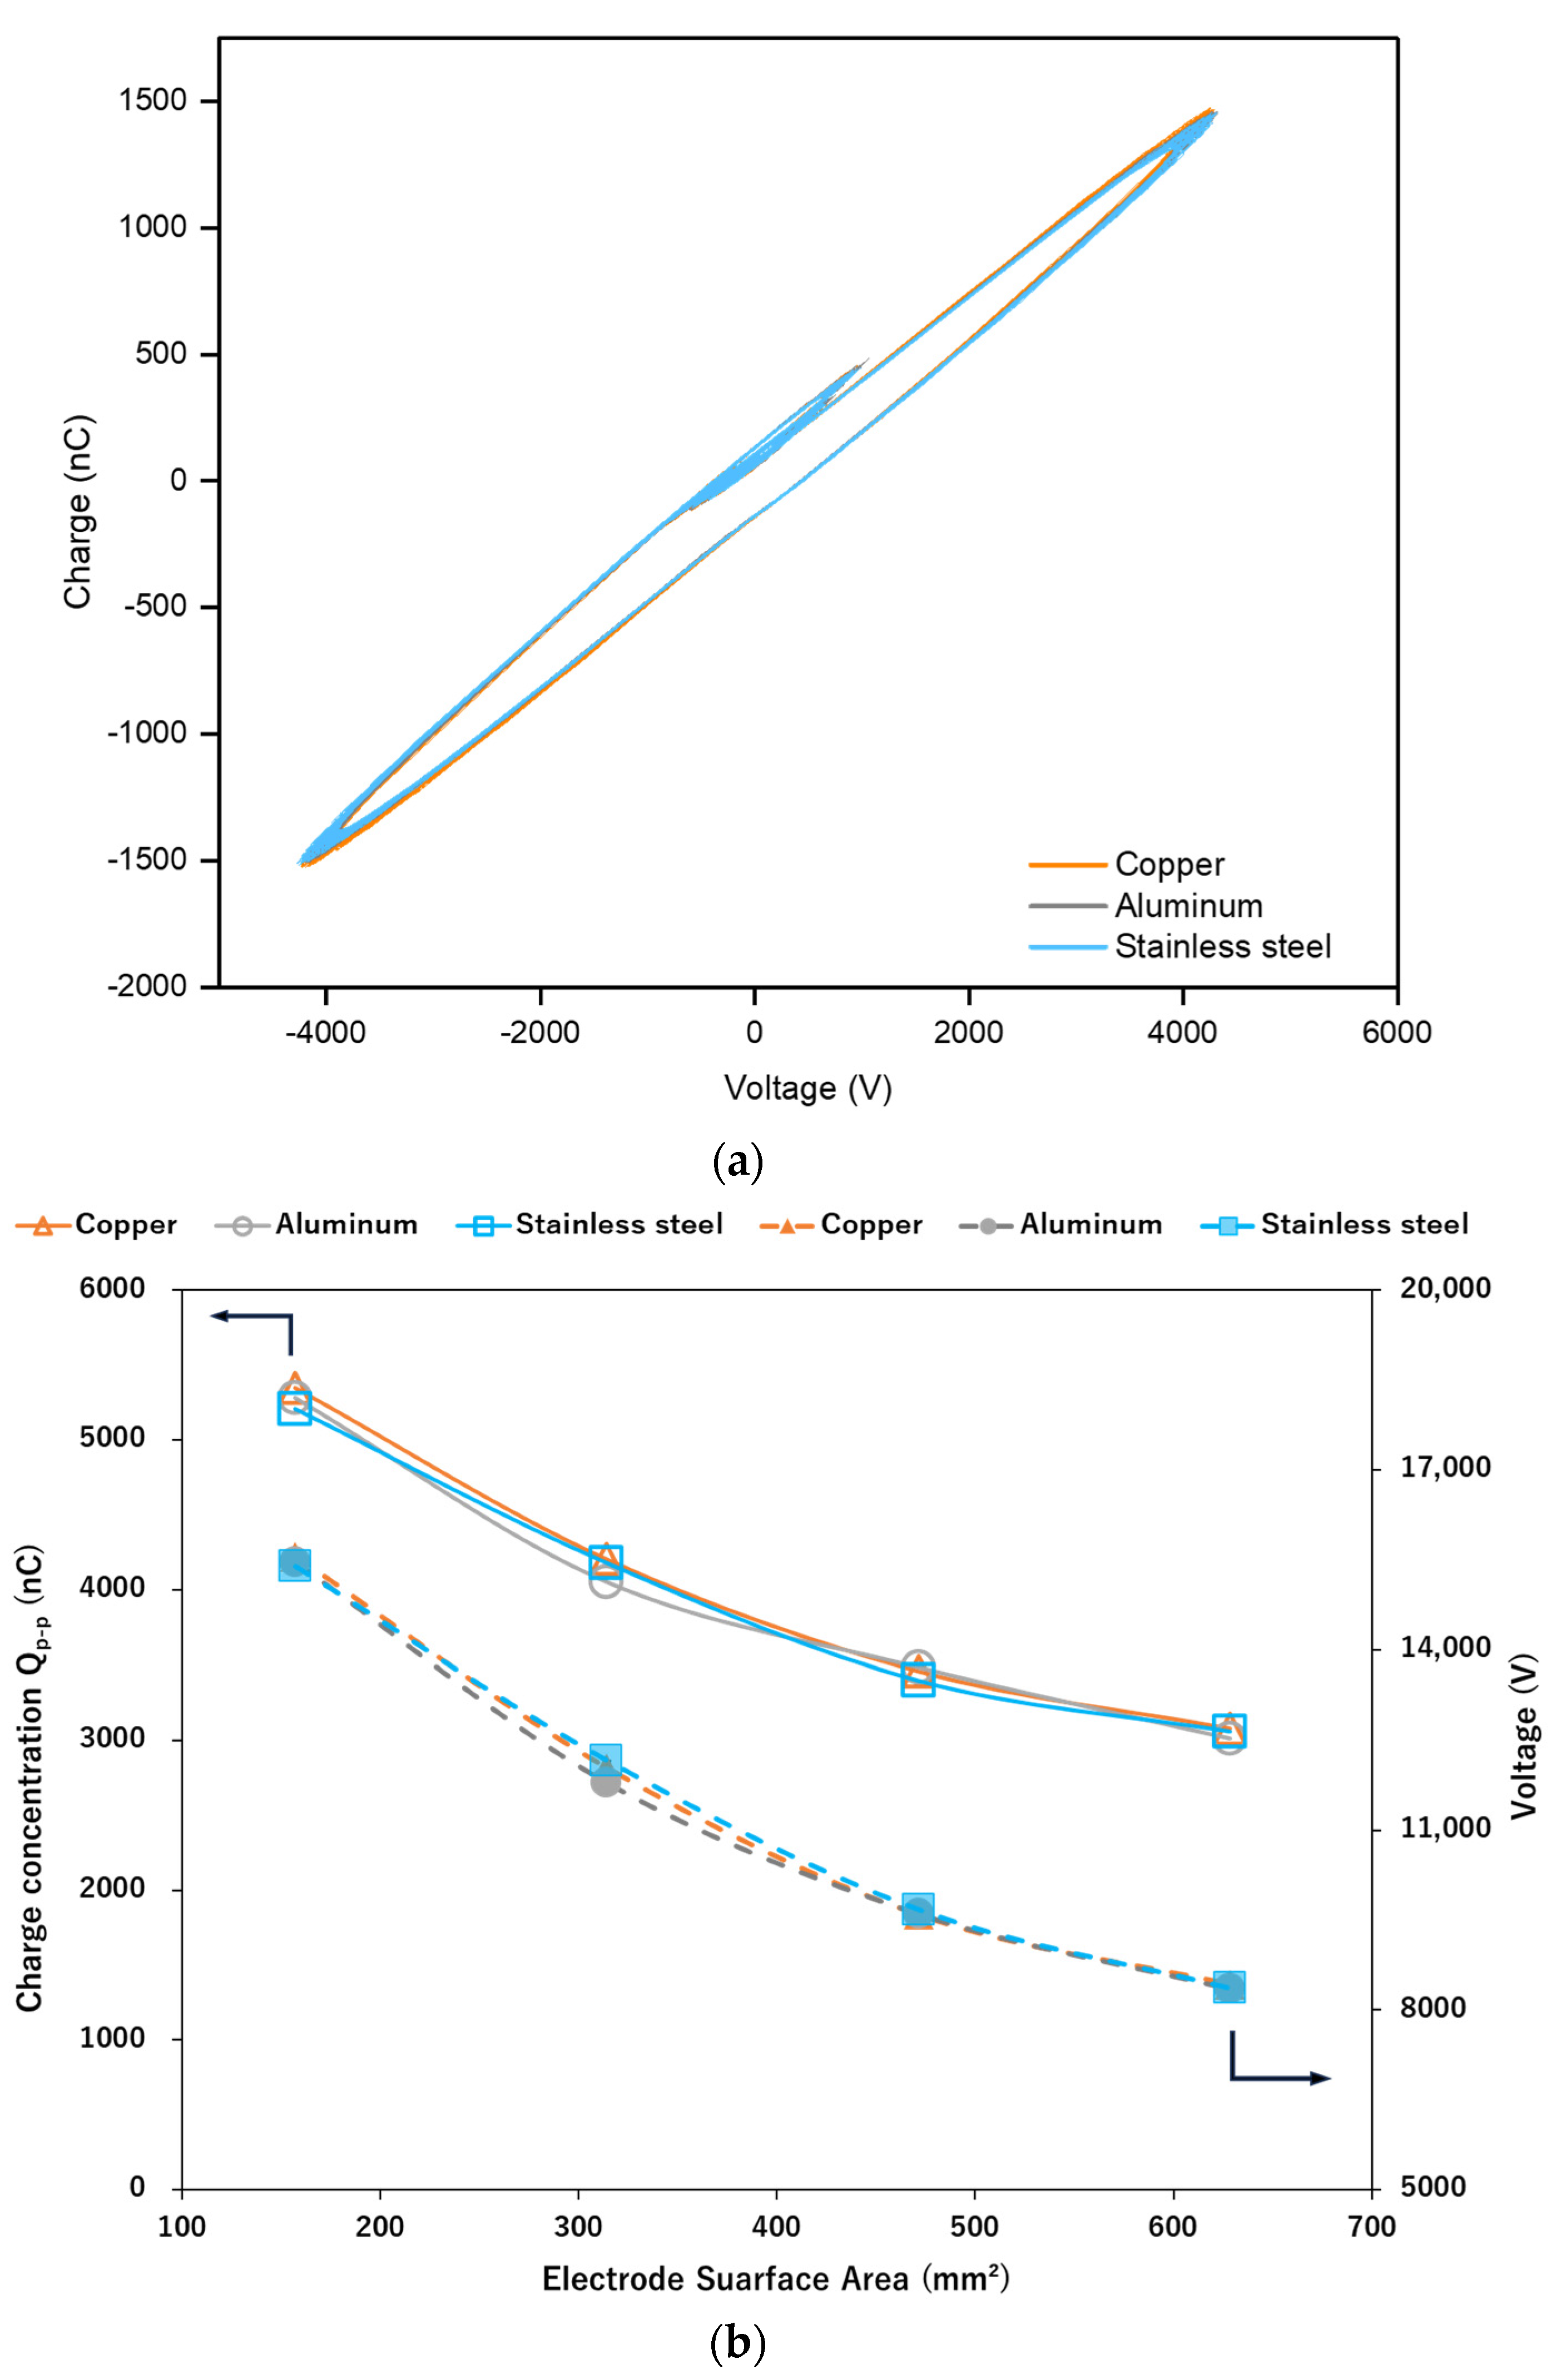
2.1. Effect of the Electrode Material on the Discharge Characteristics
2.2. Effect of the High-Voltage Electrode Material on the Plasma Methanol Synthesis Process

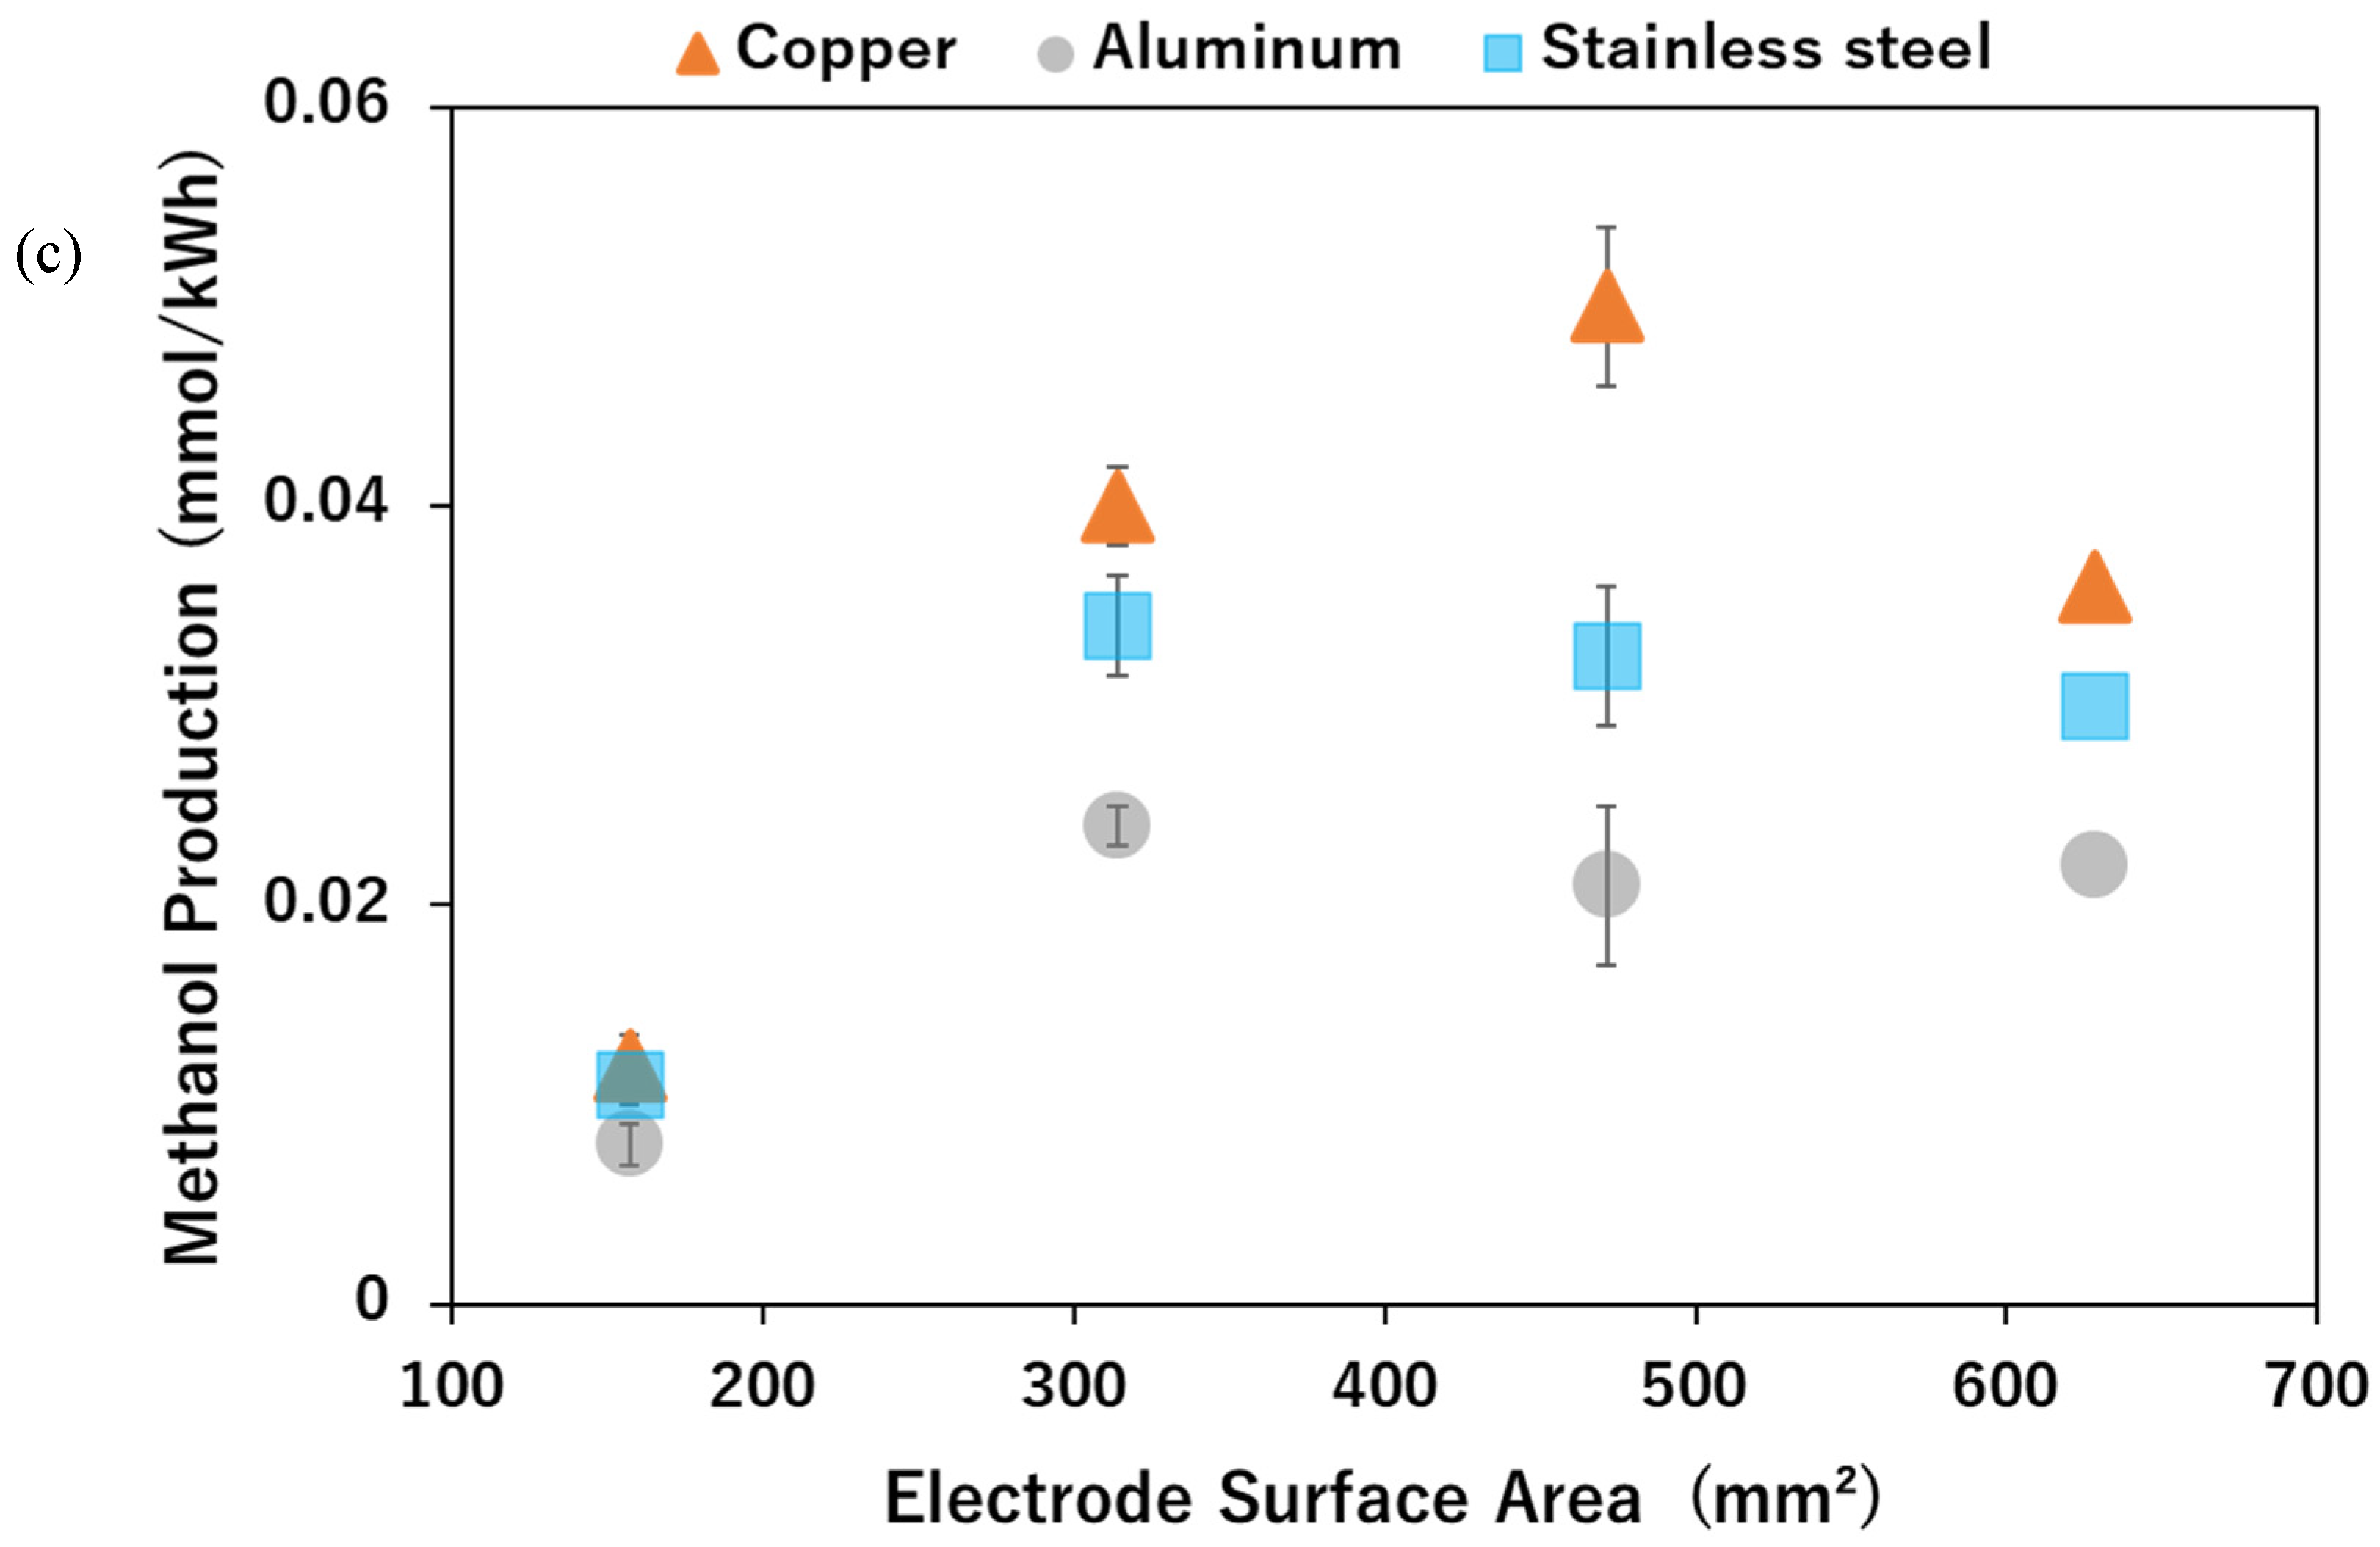
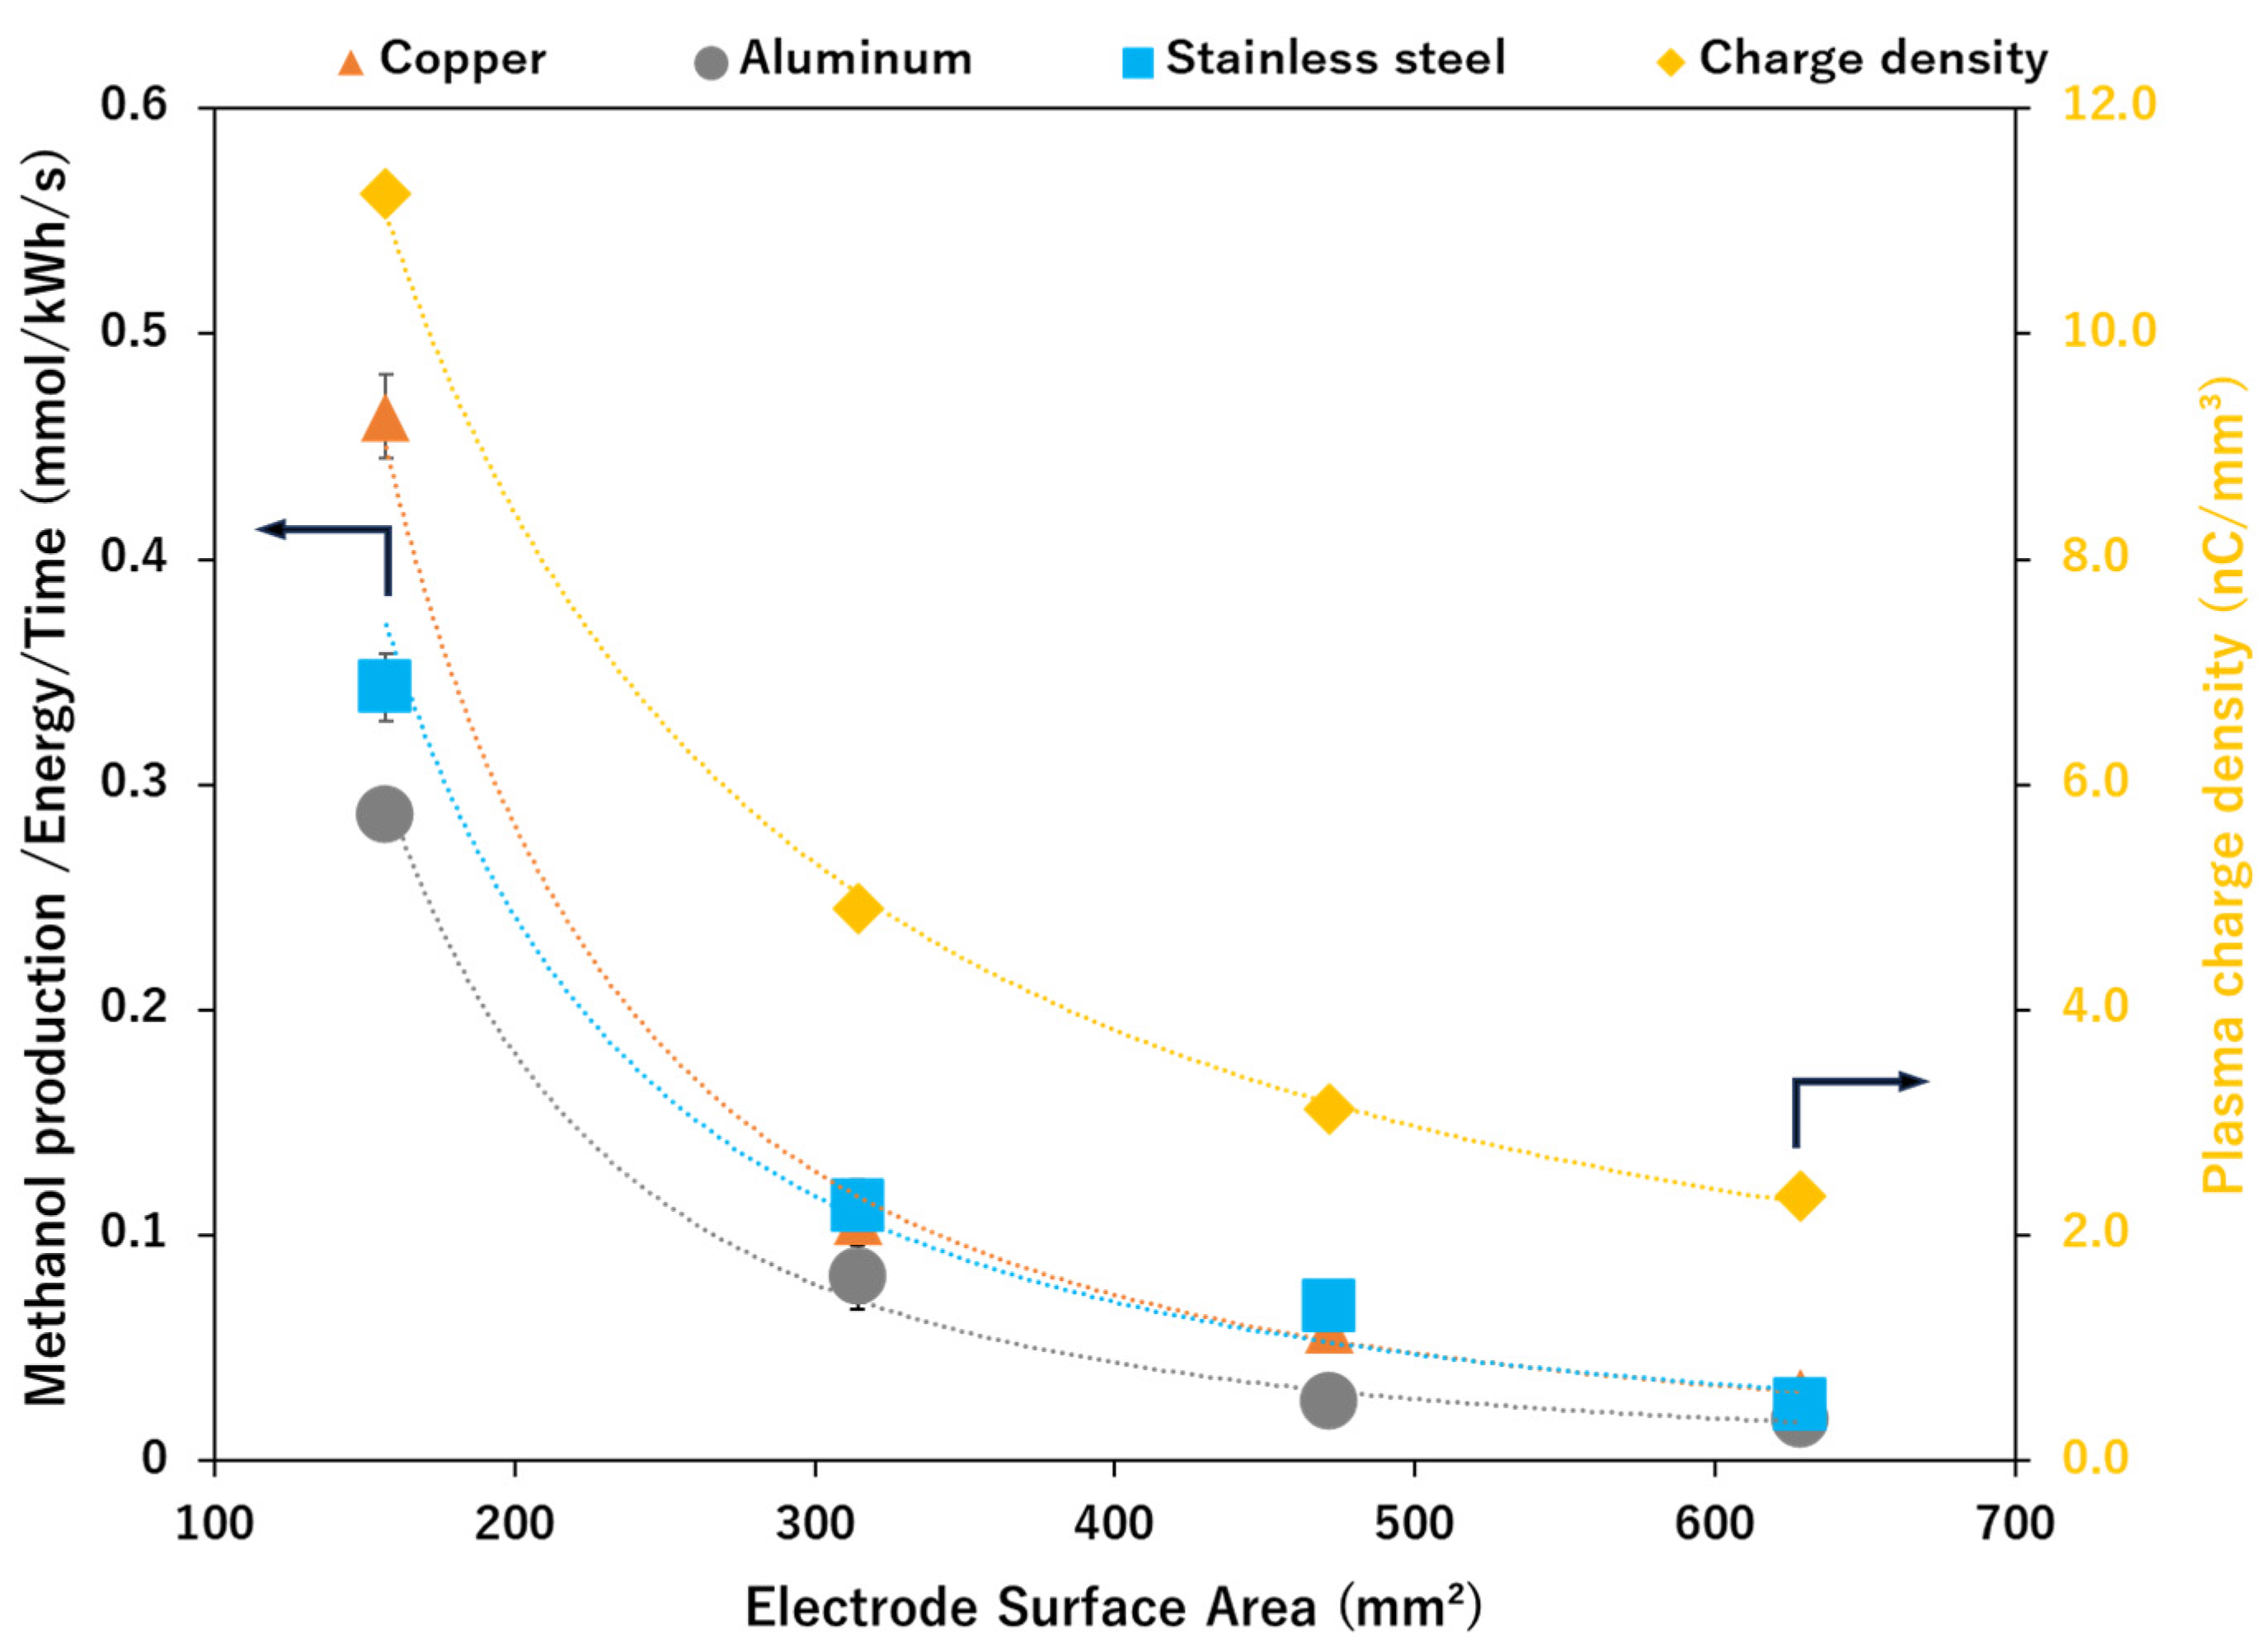
2.3. Effect of Varying the Electrode Surface Area (ESA) on Methanol Production
3. Materials and Methods
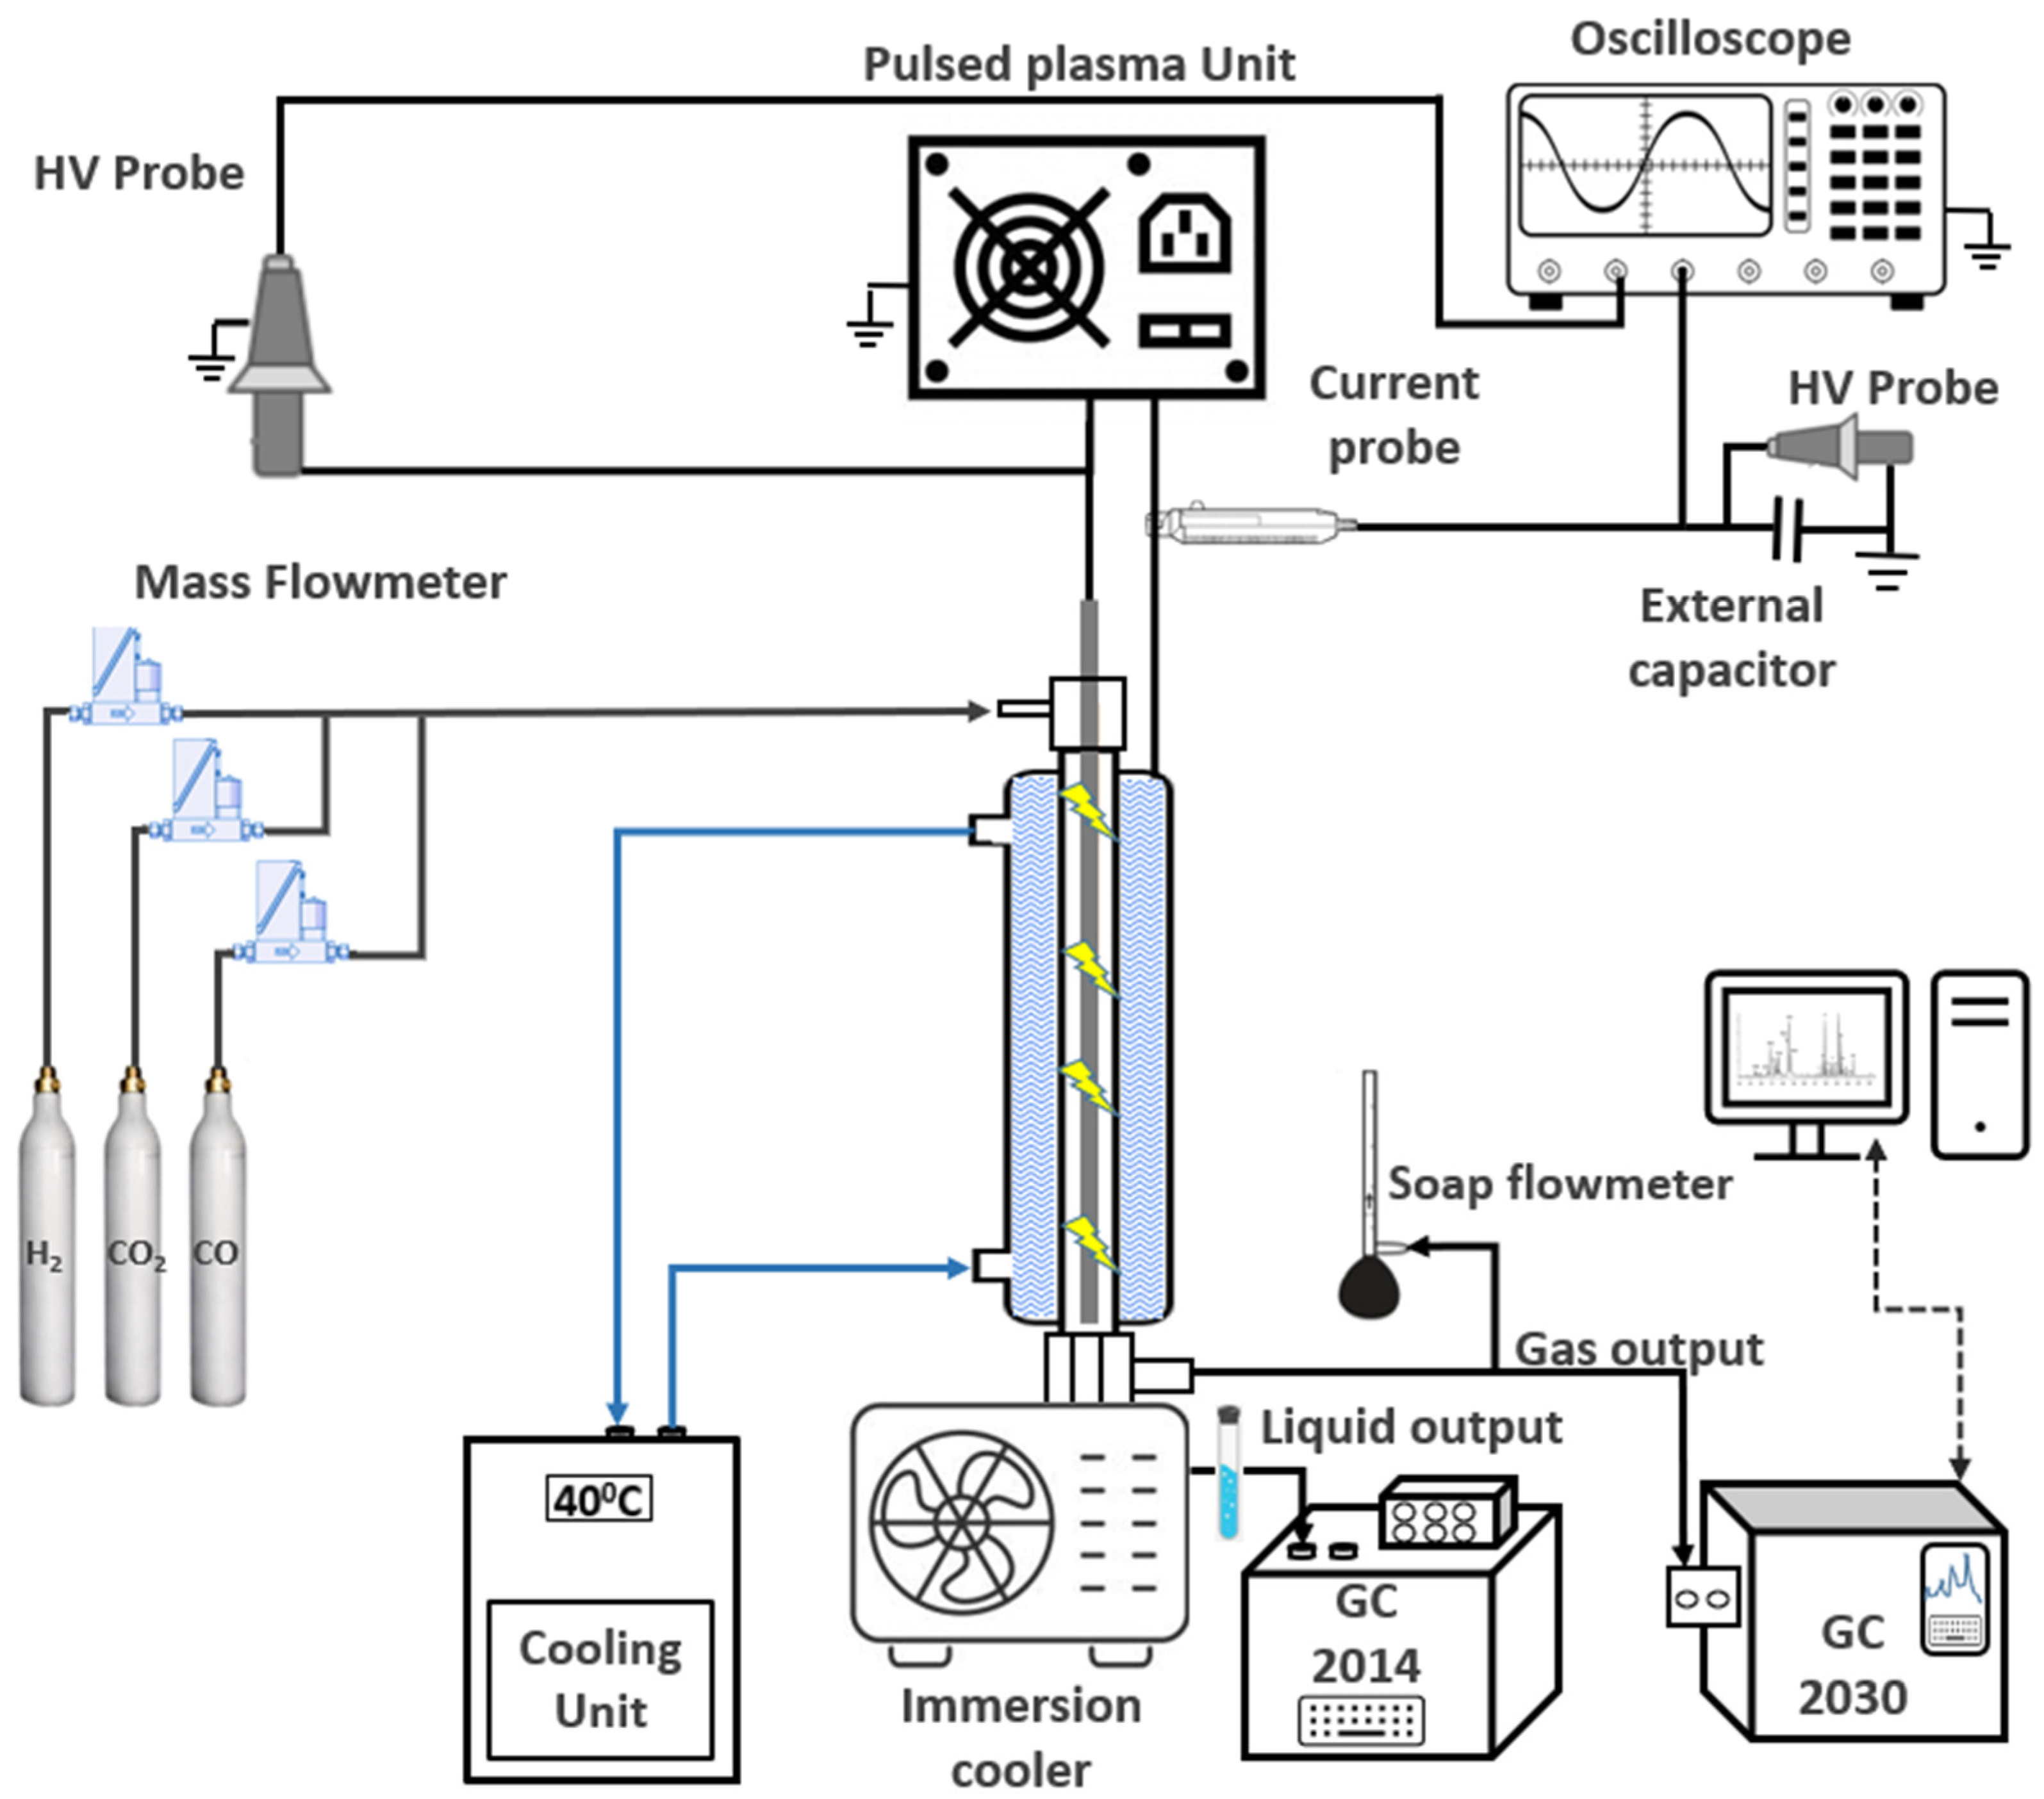
3.1. Experimental Setup
3.2. Product Analysis
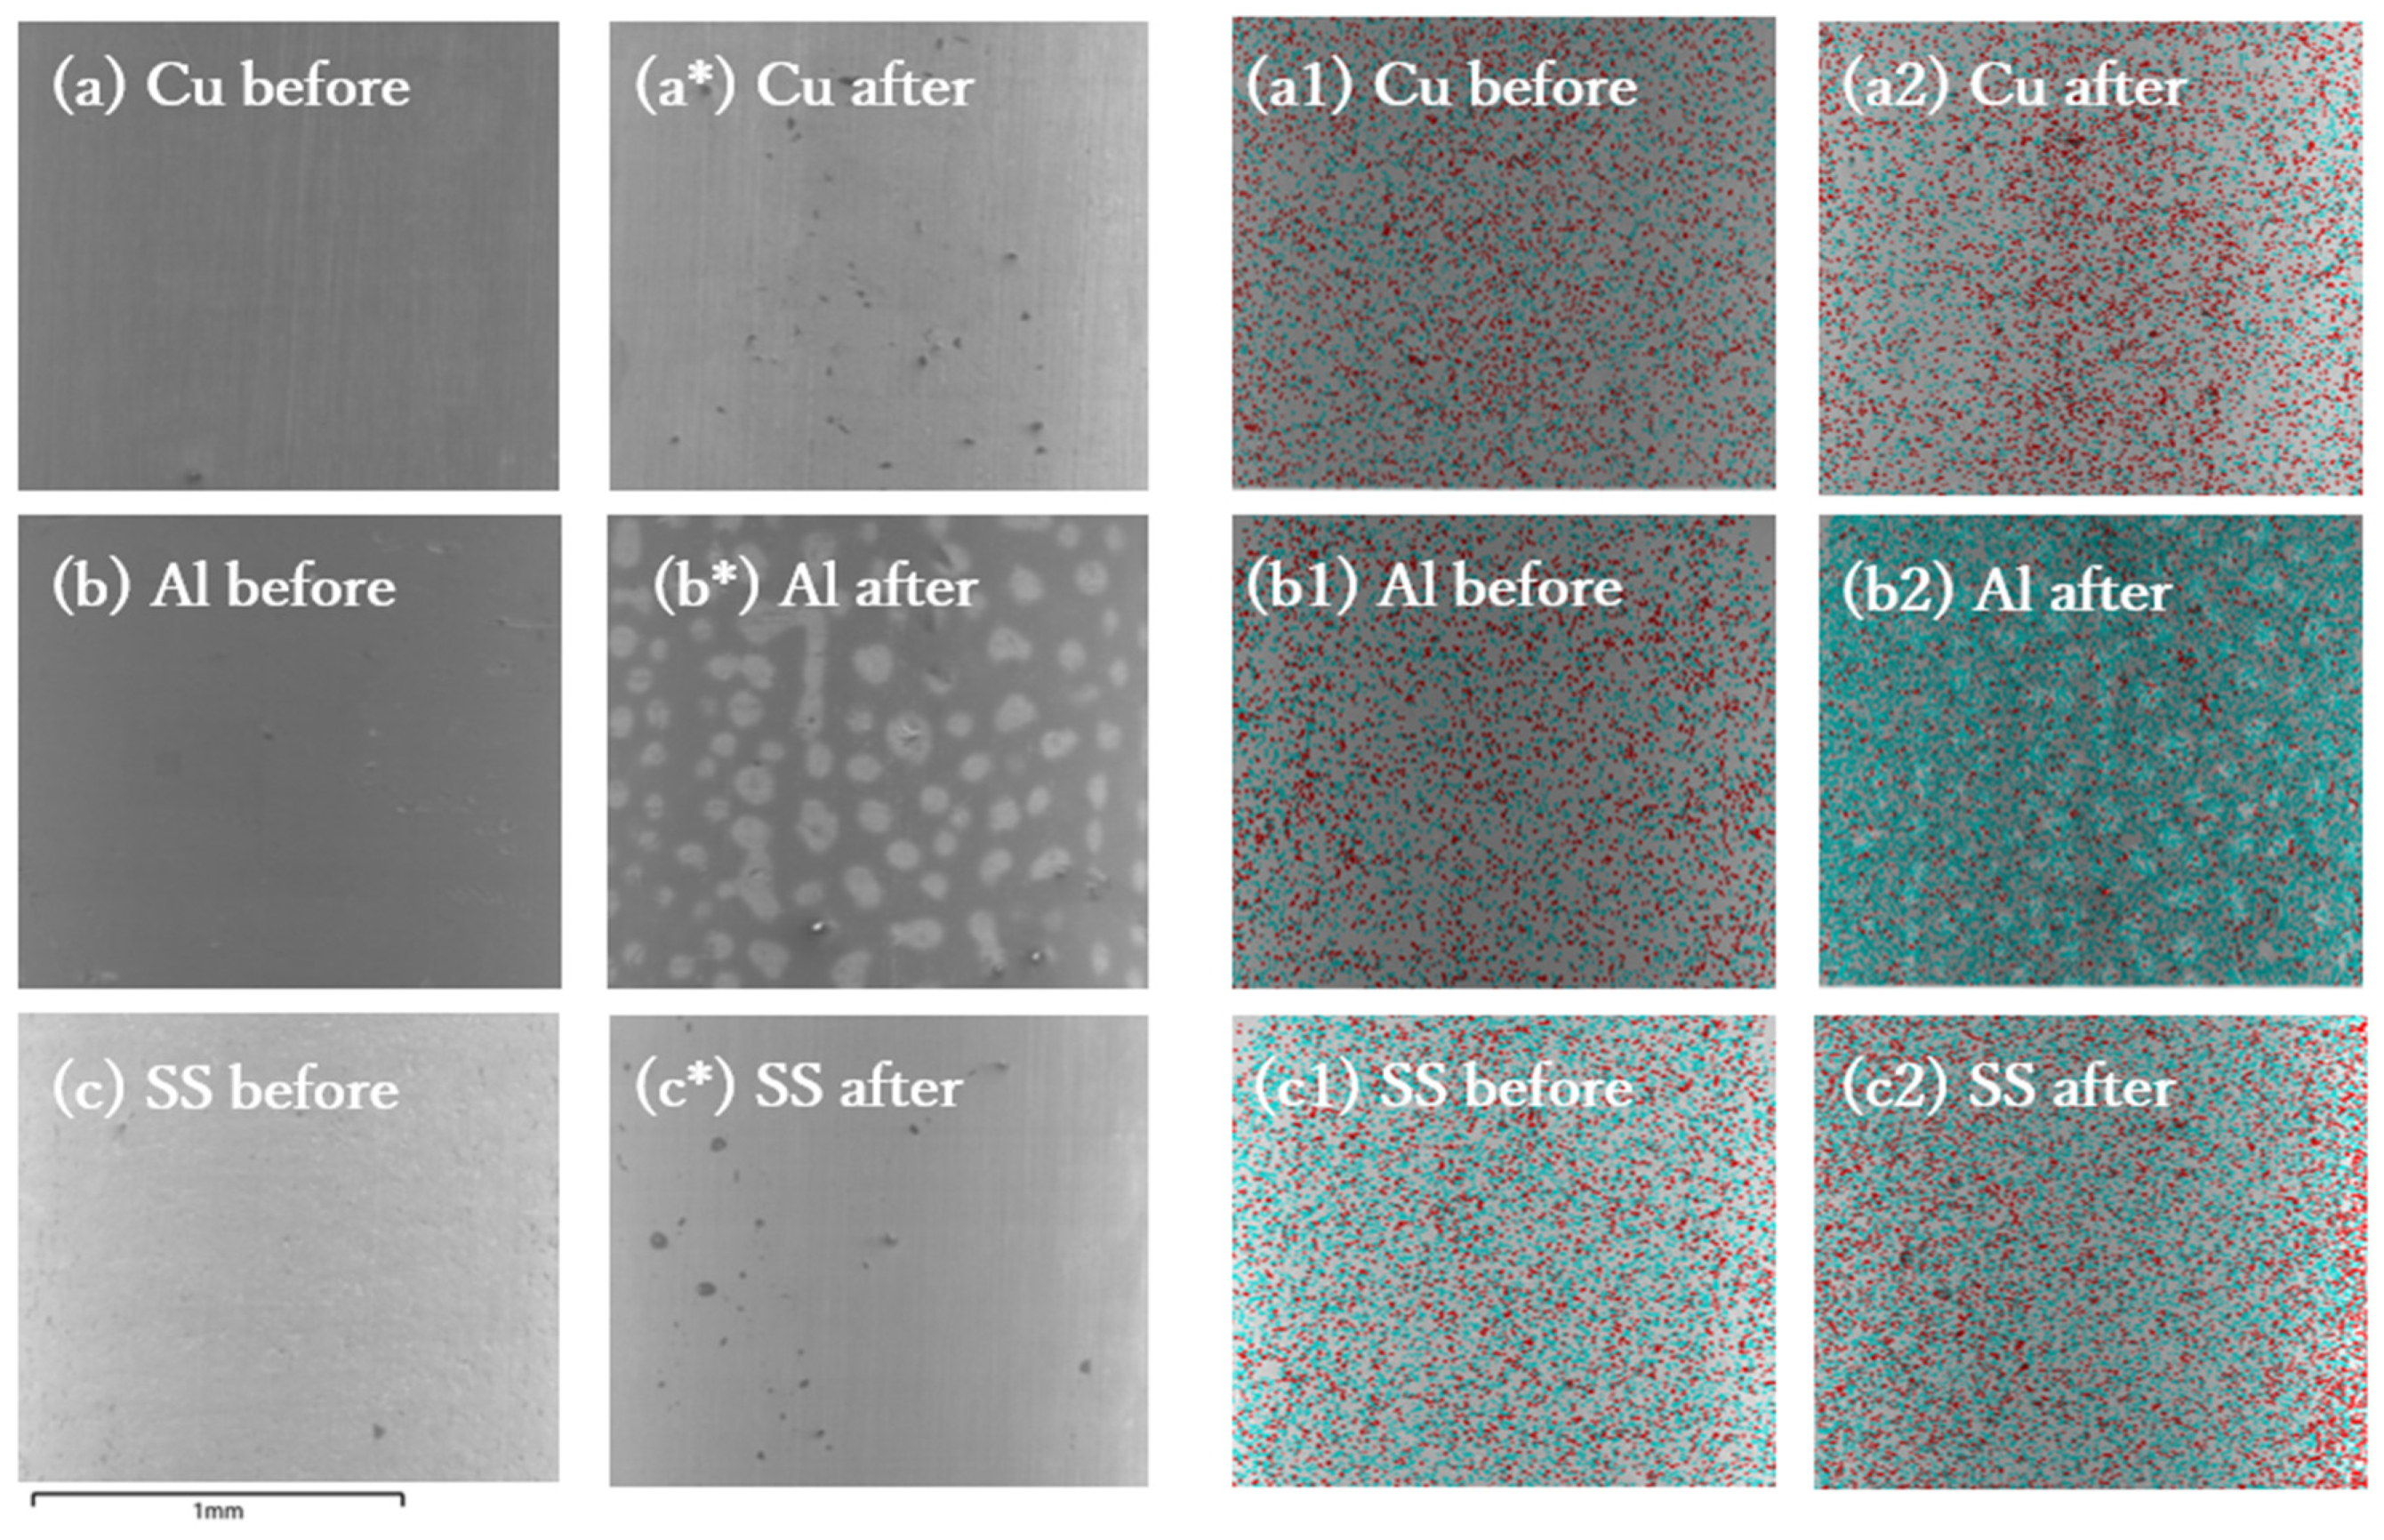
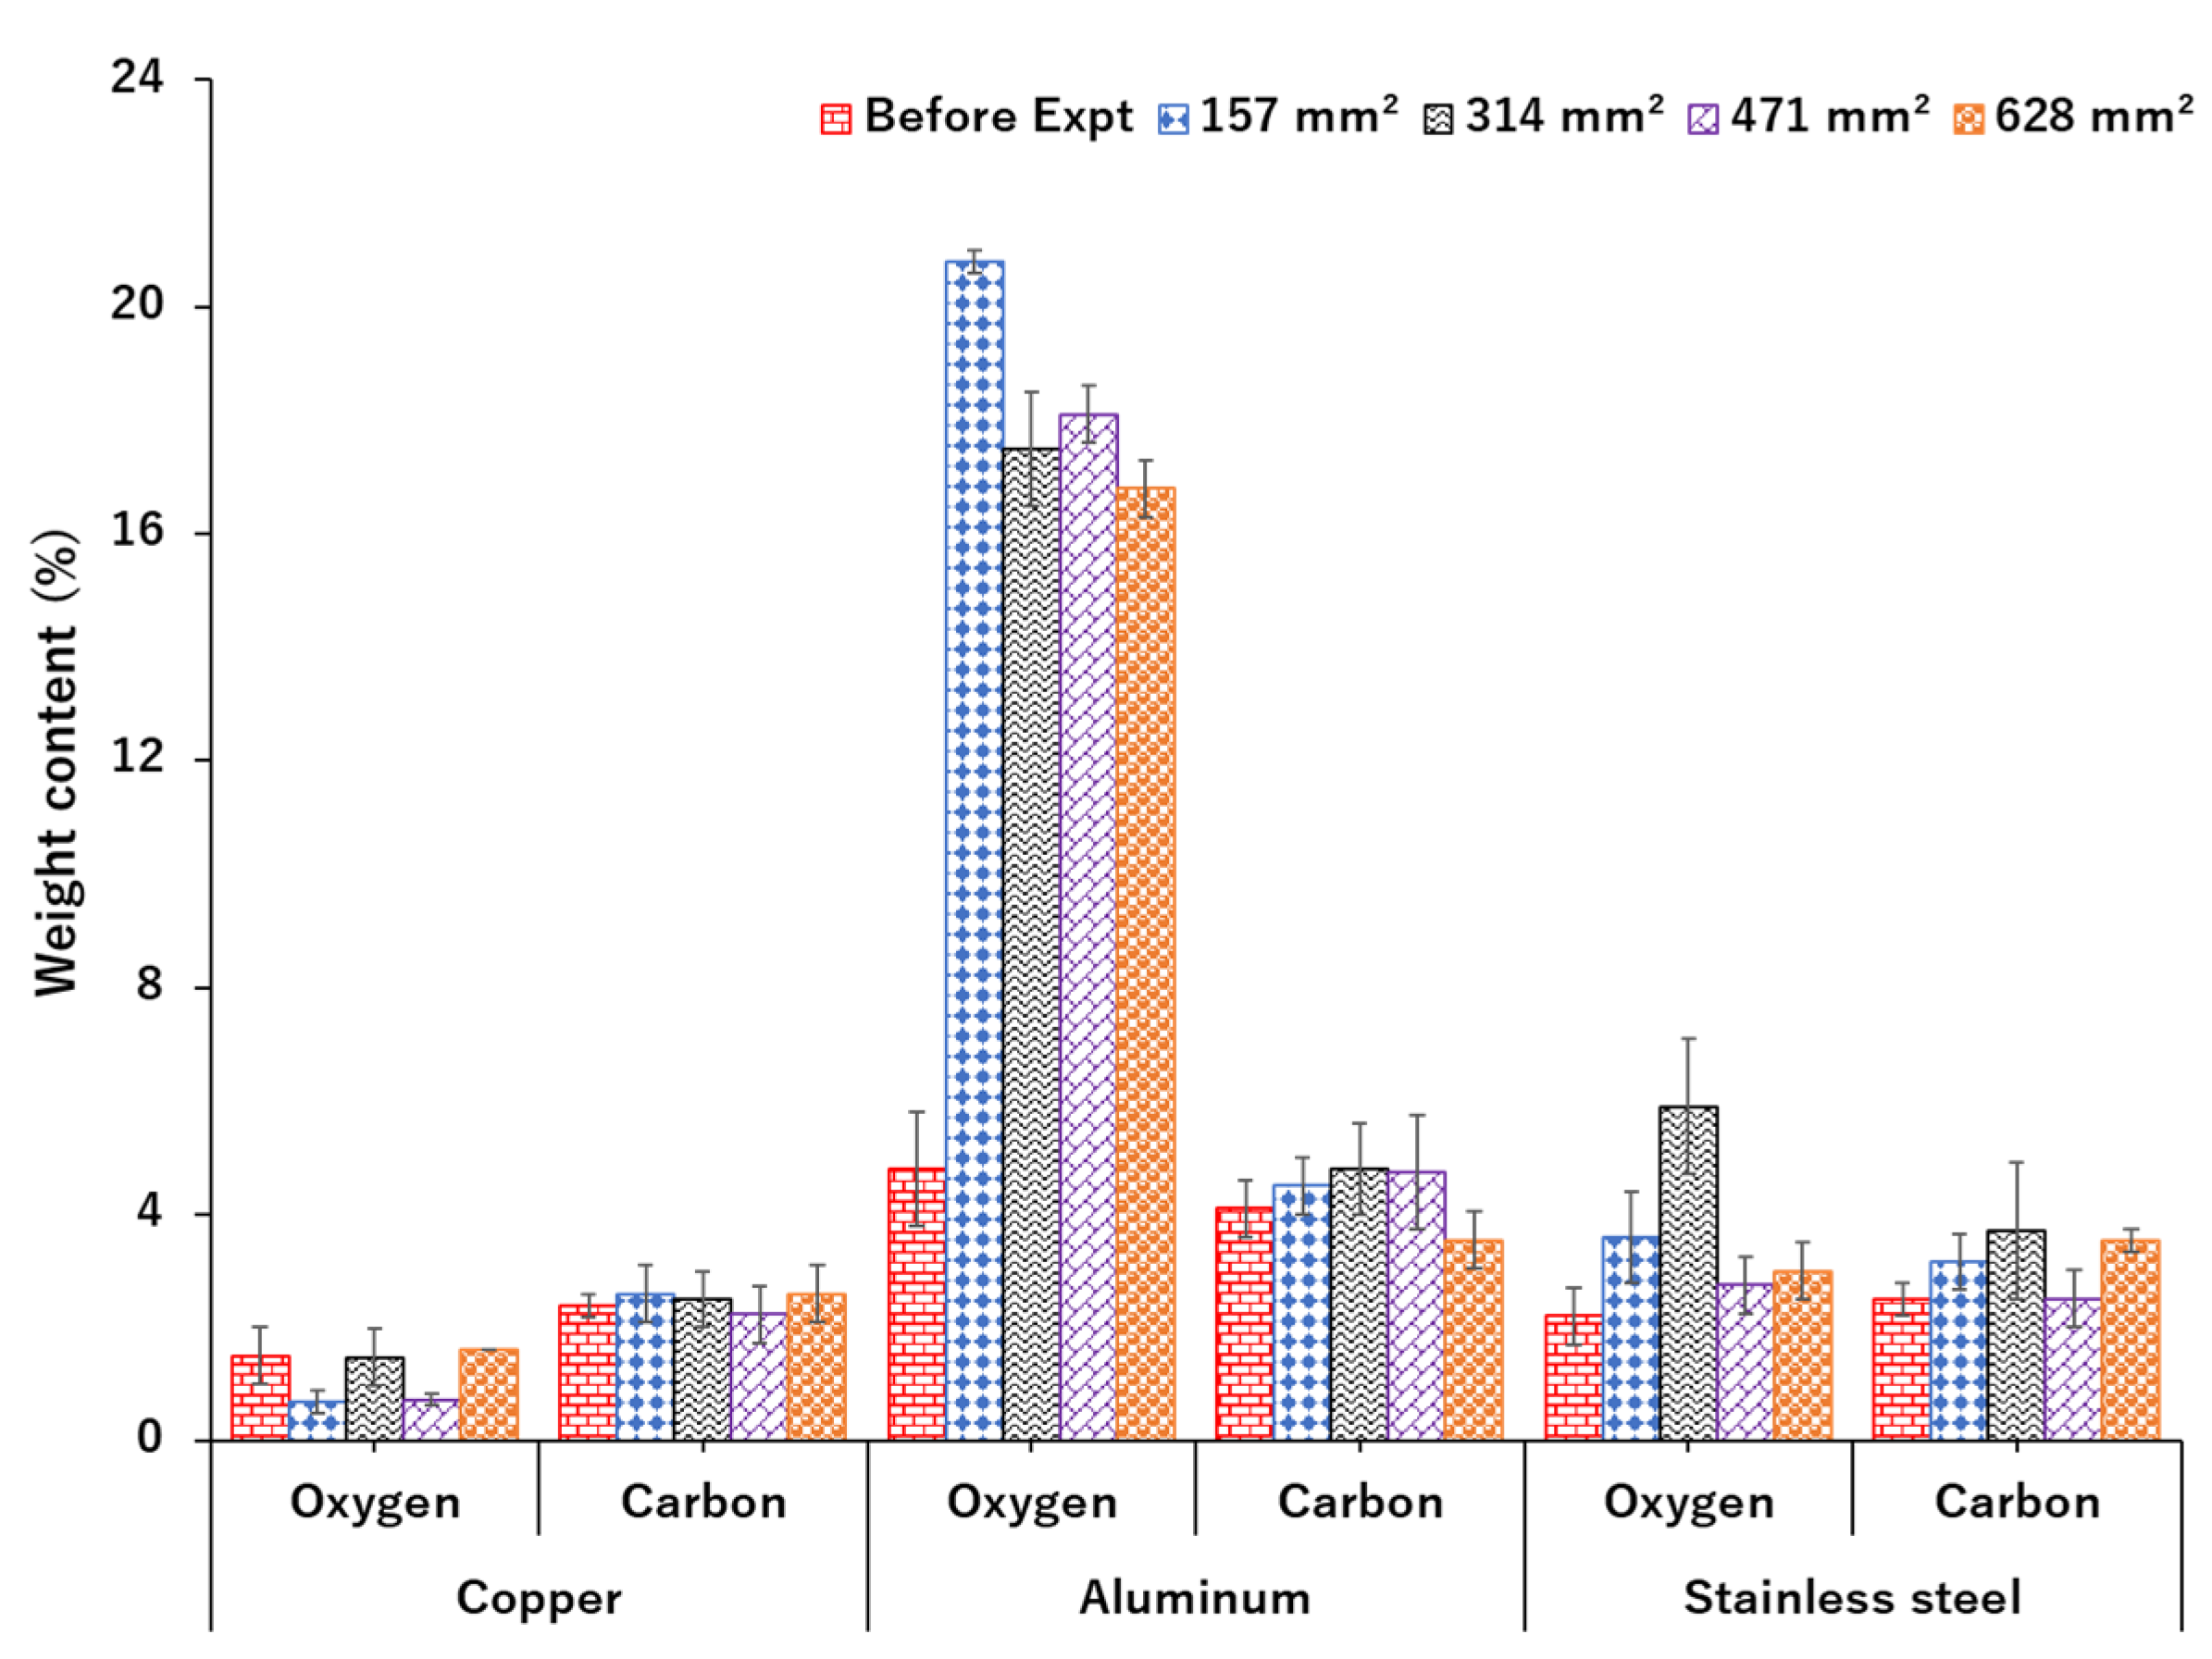
3.3. Electrode Surface Characterization
3.4. Electrical Parameters Evaluation
4. Conclusions
Supplementary Materials
Author Contributions
Funding
Data Availability Statement
Acknowledgments
Conflicts of Interest
References
- Bertau, M.; Offermanns, H.; Plass, L.; Schmidt, F.; Wernicke, H.-J. Methanol: The Basic Chemical and Energy Feedstock of the Future; Springer: Berlin/Heidelberg, Germany, 2014. [Google Scholar]
- IEA. Global Hydrogen Review; IEA: Paris, France, 2021. [Google Scholar]
- Kumar, A.; Anirudh, G.; Nikhil, S.; Akhilendra, S. Methanol and the Alternate Fuel Economy Energy, Environment, and Sustainability; Springer: Singapore, 2019. [Google Scholar]
- IEA. Primary Chemical Production in the Sustainable Development Scenario, 2000-2030-Charts-Data & Statistics-IEA. Available online: https://www.iea.org/data-and-statistics/charts/primary-chemical-production-in-the-sustainable-development-scenario-2000-2030 (accessed on 2 April 2024).
- IRENA. Innovation Outlook Renewable Methanol; International Renewable Energy Agency (IRENA): Masdar, Abu Dhabi, 2021. [Google Scholar]
- UNFCCC. COP28 Agreement Signals “Beginning of the End” of the Fossil Fuel Era | UNFCCC. Available online: https://unfccc.int/news/cop28-agreement-signals-beginning-of-the-end-of-the-fossil-fuel-era (accessed on 2 April 2024).
- Fridman, A. Plasma Chemistry; Cambridge University Press: New York, NY, USA, 2008. [Google Scholar]
- Chen, Q.; Meng, S.; Liu, R.; Zhai, X.; Wang, X.; Wang, L.; Guo, H.; Yi, Y. Plasma-catalytic CO2 hydrogenation to methanol over CuO-MgO/Beta catalyst with high selectivity. Appl. Catal. B Environ. 2024, 342, 123422. [Google Scholar] [CrossRef]
- Cui, Z.; Meng, S.; Yi, Y.; Jafarzadeh, A.; Li, S.; Neyts, E.C.; Hao, Y.; Li, L.; Zhang, X.; Wang, X.; et al. Plasma-Catalytic Methanol Synthesis from CO2 Hydrogenation over a Supported Cu Cluster Catalyst: Insights into the Reaction Mechanism. ACS Catal. 2022, 12, 1326–1337. [Google Scholar] [CrossRef]
- Men, Y.L.; Liu, Y.; Wang, Q.; Luo, Z.H.; Shao, S.; Li, Y.B.; Pan, Y.X. Highly dispersed Pt-based catalysts for selective CO2 hydrogenation to methanol at atmospheric pressure. Chem. Eng. Sci. 2019, 200, 167–175. [Google Scholar] [CrossRef]
- Meng, S.; Wu, L.; Liu, M.; Cui, Z.; Chen, Q.; Li, S.; Yan, J.; Wang, L.; Wang, X.; Qian, J.; et al. Plasma-driven CO2 hydrogenation to CH3OH over Fe2O3/γ-Al2O3 catalyst. AIChE J. 2023, 69, e18154. [Google Scholar] [CrossRef]
- Ronda-Lloret, M.; Wang, Y.; Oulego, P.; Rothenberg, G.; Tu, X.; Shiju, N.R. CO2 Hydrogenation at Atmospheric Pressure and Low Temperature Using Plasma-Enhanced Catalysis over Supported Cobalt Oxide Catalysts. ACS Sustain. Chem. Eng. 2020, 8, 17397–17407. [Google Scholar] [CrossRef] [PubMed]
- Wang, L.; Yi, Y.; Guo, H.; Tu, X. Atmospheric Pressure and Room Temperature Synthesis of Methanol through Plasma-Catalytic Hydrogenation of CO2. ACS Catal. 2018, 8, 90–100. [Google Scholar] [CrossRef]
- Masumbuko, R.K.; Kobayashi, N.; Itaya, Y.; Suami, A. Enhanced methanol selectivity and synthesis in a non-catalytic dielectric barrier discharge (DBD) plasma reactor. Chem. Eng. Sci. 2024, 287, 119698. [Google Scholar] [CrossRef]
- Wang, Y.; Chen, Y.; Harding, J.; He, H.; Bogaerts, A.; Tu, X. Catalyst-free single-step plasma reforming of CH4 and CO2 to higher value oxygenates under ambient conditions. Chem. Eng. J. 2022, 450, 137860. [Google Scholar] [CrossRef]
- Yi, Y.; Li, S.; Cui, Z.; Hao, Y.; Zhang, Y.; Wang, L.; Liu, P.; Tu, X.; Xu, X.; Guo, H.; et al. Selective oxidation of CH4 to CH3OH through plasma catalysis: Insights from catalyst characterization and chemical kinetics modelling. Appl. Catal. B Environ. 2021, 296, 120384. [Google Scholar] [CrossRef]
- Suraidin; Nur, M.; Gunawan; Susan, A.I. Study of ozone reactor with dielectric barrier discharge plasma (BDBP): Variations of inner electrode based on Stainless steel, Galvalume, and Copper. J. Phys. Conf. Ser. 2016, 776, 012047. [Google Scholar] [CrossRef]
- Fitria, S.; Nawawi, Z.; Sidik, M.A.B.; Jambak, M.I.; Yuniarti, D.; Kurnia, R.F.; Buntat, Z. The Effects of Different Electrode Holes on Ozone Generation. In Proceedings of the 2019 International Conference on Electrical Engineering and Computer Science (ICECOS), Batam Island, Indonesia, 2–3 October 2019; IEEE: New York, NY, USA, 2019; pp. 181–185. [Google Scholar]
- Dey, G.R.; Kamble, S. Effects of electrode material and frequency on carbon monoxide formation in carbon dioxide dielectric barrier discharge. J. CO2 Util. 2020, 40, 101207. [Google Scholar] [CrossRef]
- Emeraldi, P.; Imai, T.; Hayakawa, Y.; Kambara, S. Effect of electrode materials on the CO2 conversion performance of micro-gap cylindrical DBD plasma reactor. In Proceedings of the Symposium on Environmental Engineering, Takamatsu, Japan, 7–8 July 2022. [Google Scholar] [CrossRef]
- Wu, P.; Li, X.; Ullah, N.; Li, Z. Synergistic effect of catalyst and plasma on CO2 decomposition in a dielectric barrier discharge plasma reactor. Mol. Catal. 2021, 499, 111304. [Google Scholar] [CrossRef]
- Panda, N.R.; Sahu, D. Enhanced hydrogen generation efficiency of methanol using dielectric barrier discharge plasma methodology and conducting sea water as an electrode. Heliyon 2020, 6, e04717. [Google Scholar] [CrossRef] [PubMed]
- Wang, B.; Zhang, X.; Bai, H.; Lü, Y.; Hu, S. Hydrogen production from methanol through dielectric barrier discharge. Front. Chem. Sci. Eng. 2011, 5, 209–214. [Google Scholar] [CrossRef]
- Iwamoto, M.; Akiyama, M.; Aihara, K.; Deguchi, T. Ammonia Synthesis on Wool-Like Au, Pt, Pd, Ag, or Cu Electrode Catalysts in Nonthermal Atmospheric-Pressure Plasma of N2 and H2. ACS Catal. 2017, 7, 6924–6929. [Google Scholar] [CrossRef]
- Ma, Y.; Tian, Y.; Zeng, Y.; Tu, X. Plasma synthesis of ammonia in a tangled wire dielectric barrier discharge reactor: Effect of electrode materials. J. Energy Inst. 2021, 99, 137–144. [Google Scholar] [CrossRef]
- Kogelschatz, U. Dielectric-Barrier Discharges: Their History, Discharge Physics, and Industrial Applications. Plasma Chem. Plasma Process. 2003, 23, 1–46. [Google Scholar] [CrossRef]
- Peeters, F.; Butterworth, T. Electrical Diagnostics of Dielectric Barrier Discharges. In Atmospheric Pressure Plasma—From Diagnostics to Applications; IntechOpen: London, UK, 2019. [Google Scholar] [CrossRef]
- Liu, S.; Zeng, Y.; Chi, F.; Li, J.; Xiao, C. Influence of electrode on discharge property in dielectric barrier discharge of atmospheric pressure helium. Vacuum 2023, 209, 111793. [Google Scholar] [CrossRef]
- Yang, Y.; Evans, J.; Rodriguez, J.A.; White, M.G.; Liu, P. Fundamental studies of methanol synthesis from CO2 hydrogenation on Cu(111), Cu clusters, and Cu/ZnO(0001−). Phys. Chem. Chem. Phys. 2010, 12, 9909. [Google Scholar] [CrossRef]
- Liu, Y.-M.; Liu, J.-T.; Liu, S.-Z.; Li, J.; Gao, Z.-H.; Zuo, Z.-J.; Huang, W. Reaction mechanisms of methanol synthesis from CO/CO2 hydrogenation on Cu2O(111): Comparison with Cu(111). J. CO2 Util. 2017, 20, 59–65. [Google Scholar] [CrossRef]
- Rasmussen, P.B.; Holmblad, P.M.; Askgaard, T.; Ovesen, C.V.; Stoltze, P.; Nørskov, J.K.; Chorkendorff, I. Methanol synthesis on Cu(100) from a binary gas mixture of CO2 and H2. Catal. Lett. 1994, 26, 373–381. [Google Scholar] [CrossRef]
- Chinchen, G.C.; Waugh, K.C.; Whan, D.A. The activity and state of the copper surface in methanol synthesis catalysts. Appl. Catal. 1986, 25, 101–107. [Google Scholar] [CrossRef]
- Yoshihara, J.; Campbell, C.T. Methanol Synthesis and Reverse Water–Gas Shift Kinetics over Cu(110) Model Catalysts: Structural Sensitivity. J. Catal. 1996, 161, 776–782. [Google Scholar] [CrossRef]
- Li, W.; Lu, P.; Xu, D.; Tao, K. CO2 hydrogenation to methanol over Cu/ZnO catalysts synthesized via a facile solid-phase grinding process using oxalic acid. Korean J. Chem. Eng. 2018, 35, 110–117. [Google Scholar] [CrossRef]
- Kim, J.Y.; Rodriguez, J.A.; Hanson, J.C.; Frenkel, A.I.; Lee, P.L. Reduction of CuO and Cu2O with H2: H Embedding and Kinetic Effects in the Formation of Suboxides. J. Am. Chem. Soc. 2003, 125, 10684–10692. [Google Scholar] [CrossRef]
- Ahouari, H.; Soualah, A.; Le Valant, A.; Pinard, L.; Magnoux, P.; Pouilloux, Y. Methanol synthesis from CO2 hydrogenation over copper based catalysts. React. Kinet. Mech. Catal. 2013, 110, 131–145. [Google Scholar] [CrossRef]
- Urbonavicius, M.; Varnagiris, S.; Milcius, D. Generation of Hydrogen through the Reaction between Plasma-Modified Aluminum and Water. Energy Technol. 2017, 5, 2300–2308. [Google Scholar] [CrossRef]
- Michiels, R.; Engelmann, Y.; Bogaerts, A. Plasma Catalysis for CO2 Hydrogenation: Unlocking New Pathways toward CH3OH. J. Phys. Chem. C 2020, 124, 25859–25872. [Google Scholar] [CrossRef]
- Shun, K.; Mori, K.; Kidawara, T.; Ichikawa, S.; Yamashita, H. Heteroatom doping enables hydrogen spillover via H+/e− diffusion pathways on a non-reducible metal oxide. Nat. Commun. 2024, 15, 6403. [Google Scholar] [CrossRef]
- Beniya, A.; Higashi, S.; Ohba, N.; Jinnouchi, R.; Hirata, H.; Watanabe, Y. CO oxidation activity of non-reducible oxide-supported mass-selected few-atom Pt single-clusters. Nat. Commun. 2020, 11, 1888. [Google Scholar] [CrossRef] [PubMed]
- Liu, S.; Winter, L.R.; Chen, J.G. Review of Plasma-Assisted Catalysis for Selective Generation of Oxygenates from CO2 and CH4. ACS Catal. 2020, 10, 2855–2871. [Google Scholar] [CrossRef]
- Zeng, Y.; Tu, X. Plasma-catalytic hydrogenation of CO2 for the cogeneration of CO and CH4 in a dielectric barrier discharge reactor: Effect of argon addition. J. Phys. Appl. Phys. 2017, 50, 184004. [Google Scholar] [CrossRef]
- Alawi, N.M.; Sunarso, J.; Pham, G.H.; Barifcani, A.; Nguyen, M.H.; Liu, S. Comparative study on the performance of microwave-assisted plasma DRM in nitrogen and argon atmospheres at a low microwave power. J. Ind. Eng. Chem. 2020, 85, 118–129. [Google Scholar] [CrossRef]
- Wang, W.; Snoeckx, R.; Zhang, X.; Cha, M.S.; Bogaerts, A. Modeling Plasma-based CO2 and CH4 Conversion in Mixtures with N2, O2, and H2O: The Bigger Plasma Chemistry Picture. J. Phys. Chem. C 2018, 122, 8704–8723. [Google Scholar] [CrossRef]
- Bozzano, G.; Manenti, F. Efficient methanol synthesis: Perspectives, technologies and optimization strategies. Prog. Energy Combust. Sci. 2016, 56, 71–105. [Google Scholar] [CrossRef]


| DBD Plasma System Electrode Configuration | Conditions | Feedstock Gasses | Selectivity CH3OH | Energy Consumption/Efficiency | Ref. |
|---|---|---|---|---|---|
| Stainless steel (high voltage), Water (ground) | 9.2 kHz, 24 W, 30 °C | CO2 + H2 | 7.5% | 387.5 kJ/mmol | [8] |
| Stainless steel (high voltage), Water (ground) | 9 kHz, 18 W, 60 °C | CO2 + H2 | 17% | 181.7 kJ/mmol | [11] |
| Stainless steel (high voltage), Water (ground) | 9.5 kHz, 26 W, 60 °C | CO2 + H2 | 3.7% | 855.9 kJ/mmol | [9] |
| Stainless steel (high voltage), Water (ground) | 9 kHz, 10 W, 30 °C | CO2 + H2 | 54.2% | [13] | |
| Copper (high voltage), Water (ground) | 40 kHz, 30 W, 40 °C | CO + CO2 + H2 + (N2 additive) | 86% | 4512 kJ/mmol | [14] |
| Stainless steel (high voltage), Water (ground) | 9.2 kHz, 20 W, 5 °C | CH4 + CO2 | 43% | >0.8 mol/kWh | [15] |
| Stainless steel (high voltage), Water (ground) | 30 W, 85 °C | CH4 + O2 | 42% | 0.76 mol/kWh | [16] |
Disclaimer/Publisher’s Note: The statements, opinions and data contained in all publications are solely those of the individual author(s) and contributor(s) and not of MDPI and/or the editor(s). MDPI and/or the editor(s) disclaim responsibility for any injury to people or property resulting from any ideas, methods, instructions or products referred to in the content. |
© 2024 by the authors. Licensee MDPI, Basel, Switzerland. This article is an open access article distributed under the terms and conditions of the Creative Commons Attribution (CC BY) license (https://creativecommons.org/licenses/by/4.0/).
Share and Cite
Masumbuko, R.K.; Kobayashi, N.; Suami, A.; Itaya, Y.; Zhang, B. Effect of High Voltage Electrode Material on Methanol Synthesis in a Pulsed Dielectric Barrier Discharge Plasma Reactor. Catalysts 2024, 14, 891. https://doi.org/10.3390/catal14120891
Masumbuko RK, Kobayashi N, Suami A, Itaya Y, Zhang B. Effect of High Voltage Electrode Material on Methanol Synthesis in a Pulsed Dielectric Barrier Discharge Plasma Reactor. Catalysts. 2024; 14(12):891. https://doi.org/10.3390/catal14120891
Chicago/Turabian StyleMasumbuko, Robert Karisa, Nobusuke Kobayashi, Akira Suami, Yoshinori Itaya, and Baiqiang Zhang. 2024. "Effect of High Voltage Electrode Material on Methanol Synthesis in a Pulsed Dielectric Barrier Discharge Plasma Reactor" Catalysts 14, no. 12: 891. https://doi.org/10.3390/catal14120891
APA StyleMasumbuko, R. K., Kobayashi, N., Suami, A., Itaya, Y., & Zhang, B. (2024). Effect of High Voltage Electrode Material on Methanol Synthesis in a Pulsed Dielectric Barrier Discharge Plasma Reactor. Catalysts, 14(12), 891. https://doi.org/10.3390/catal14120891