Advances in Liquid-Phase Synthesis: Monitoring of Kinetics for Platinum Nanoparticles Formation, and Pt/C Electrocatalysts with Monodispersive Nanoparticles for Oxygen Reduction

 ,
,  , , and
Abstract

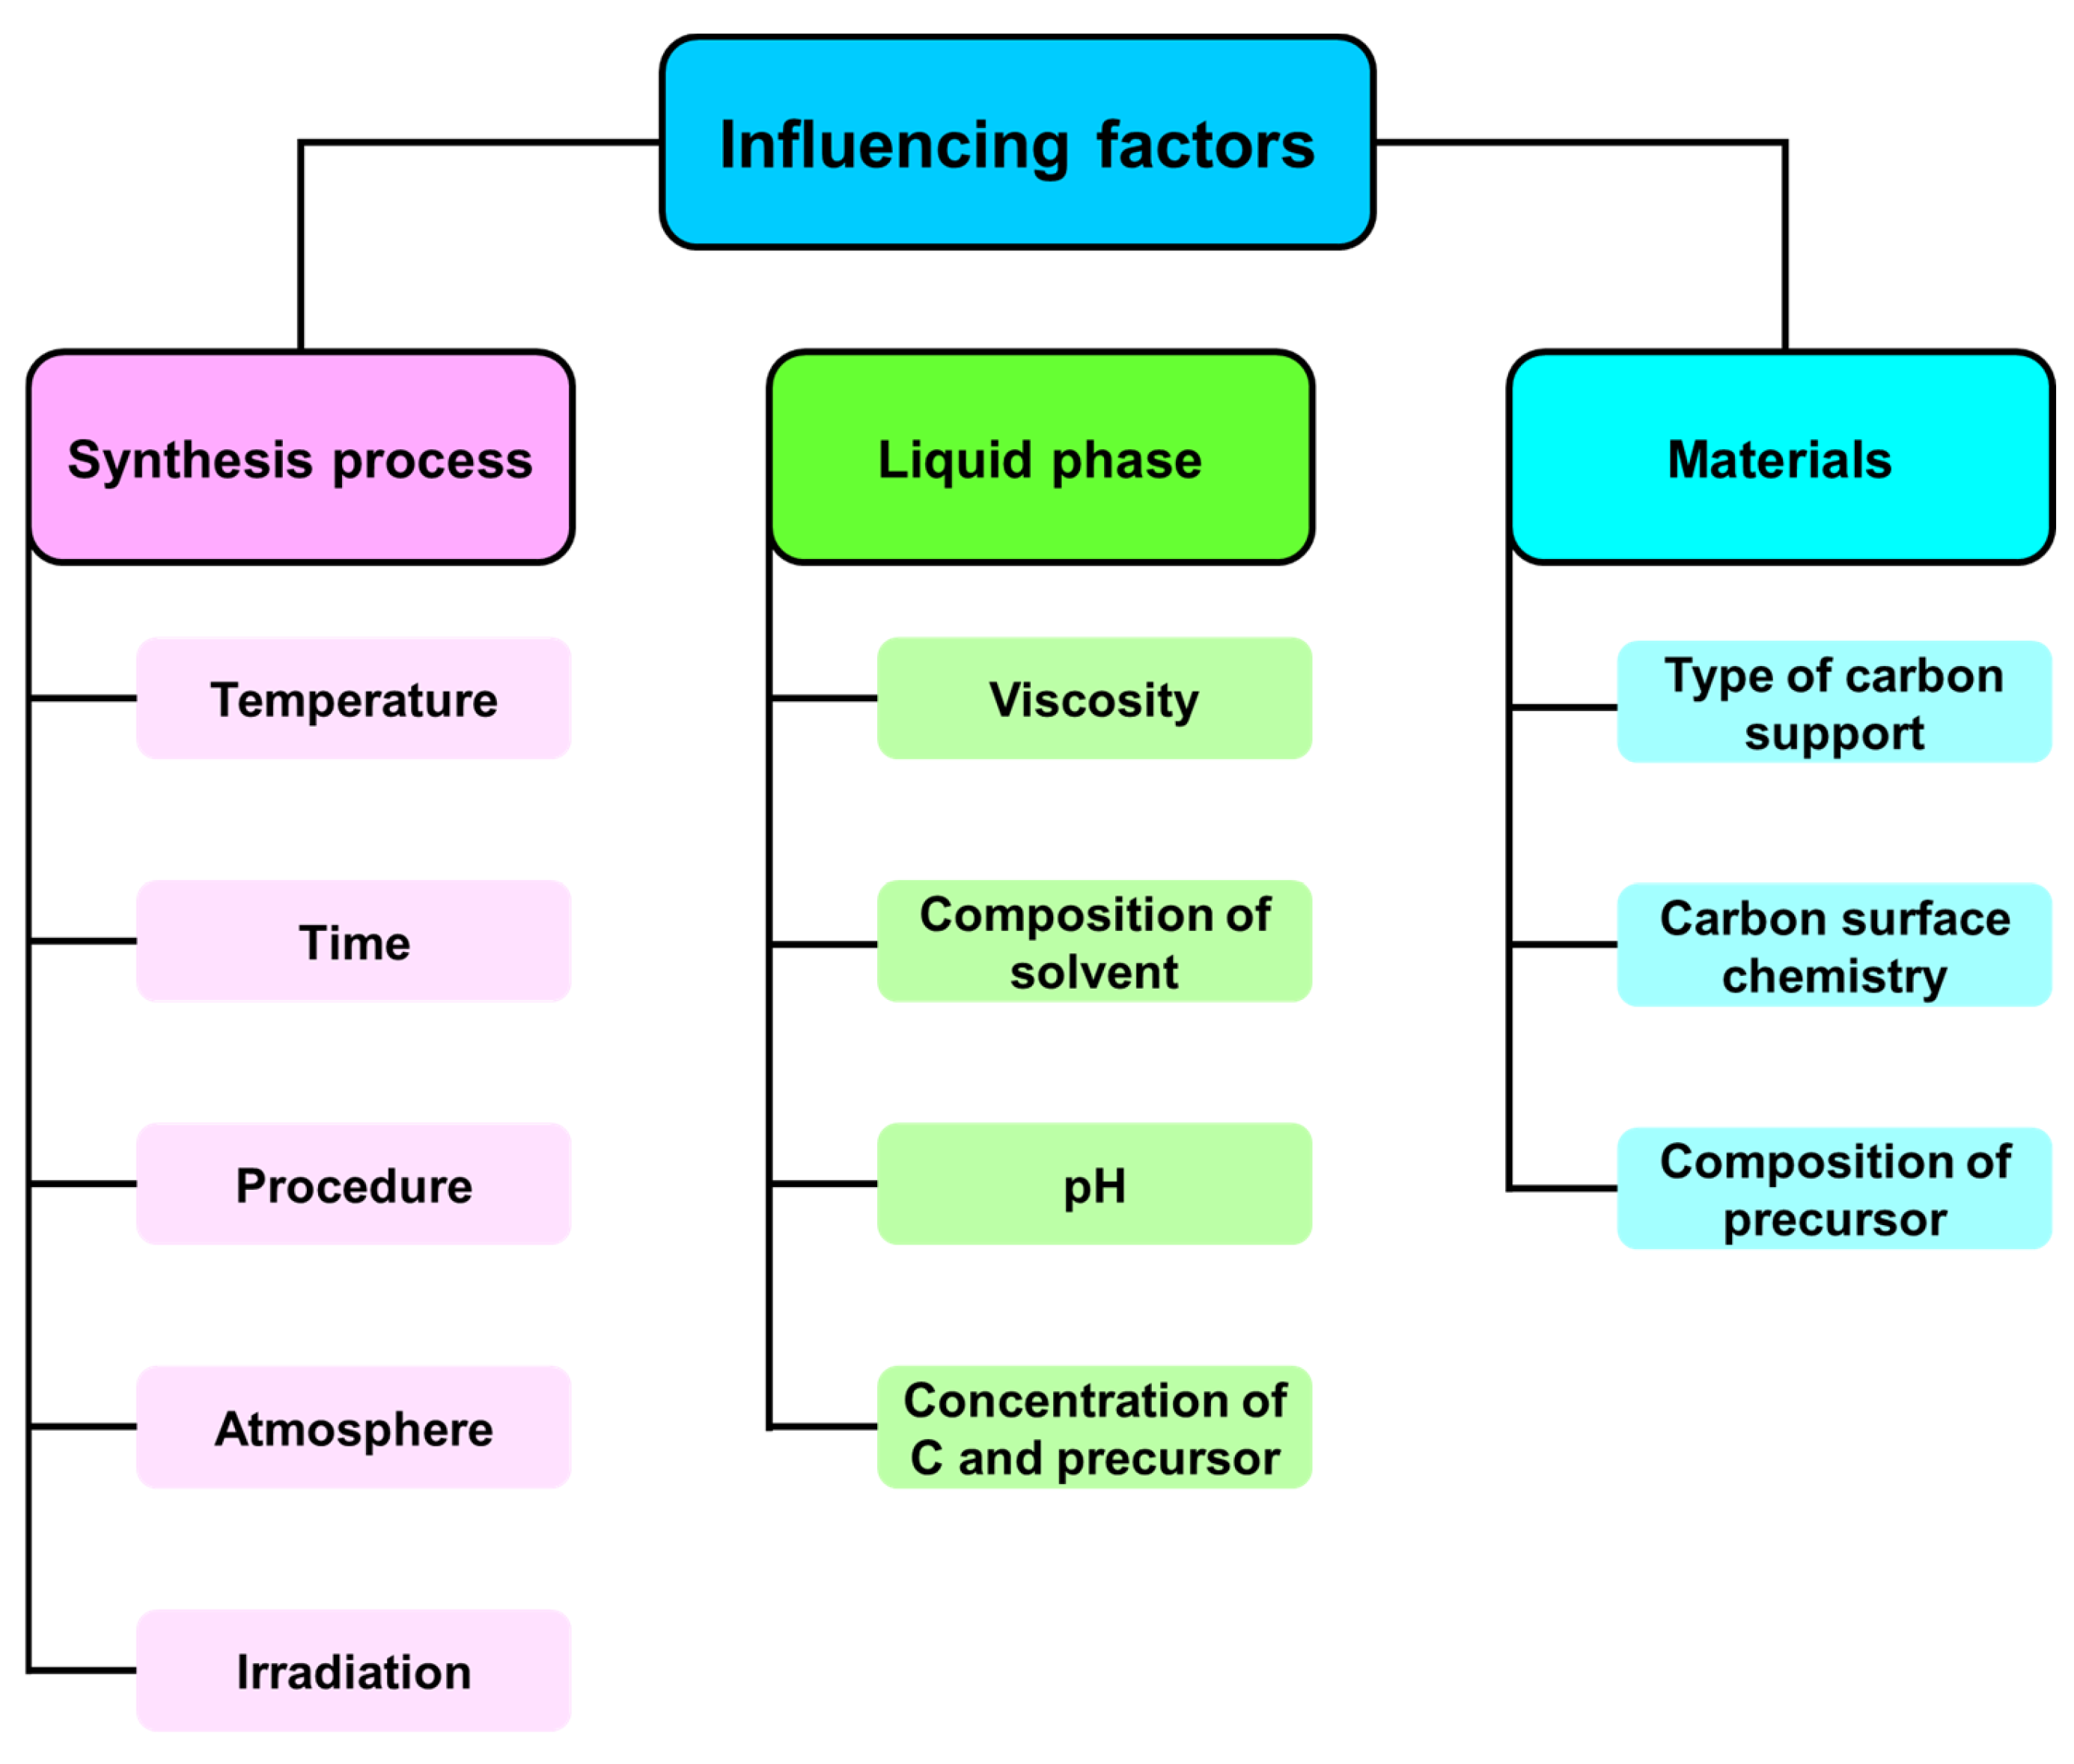
1. Introduction
2. Results and Discussion
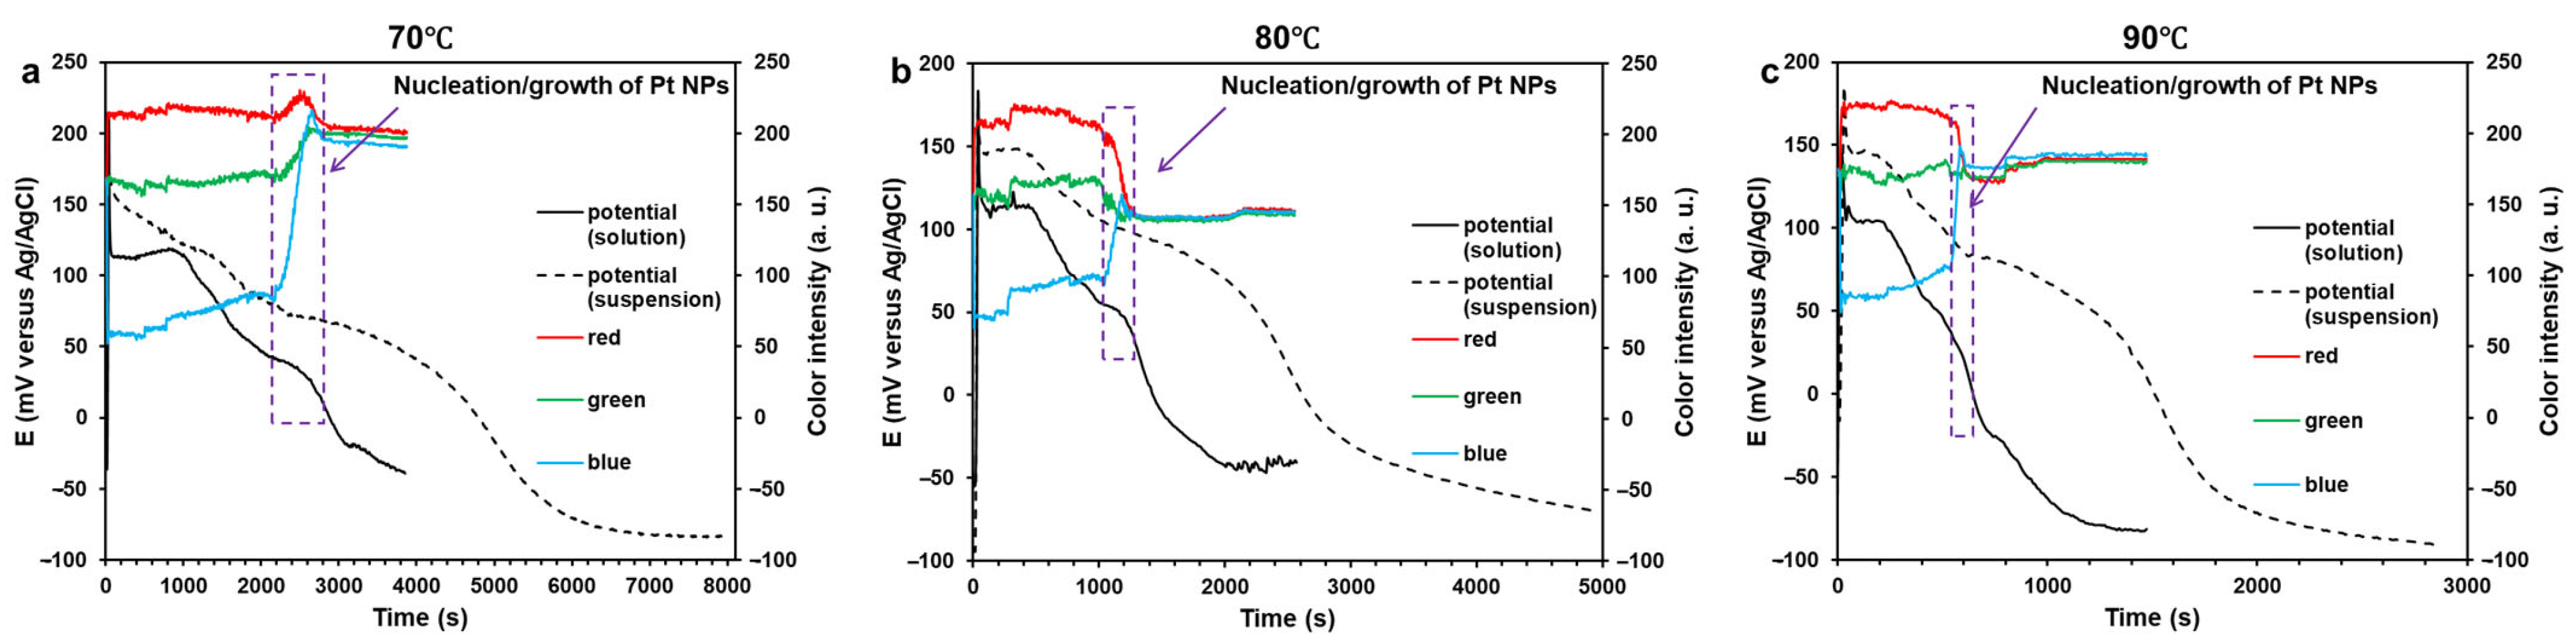
2.1. Kinetics of the Pt(IV) Reduction with Citric Acid and the Resulting Pt/C Materials
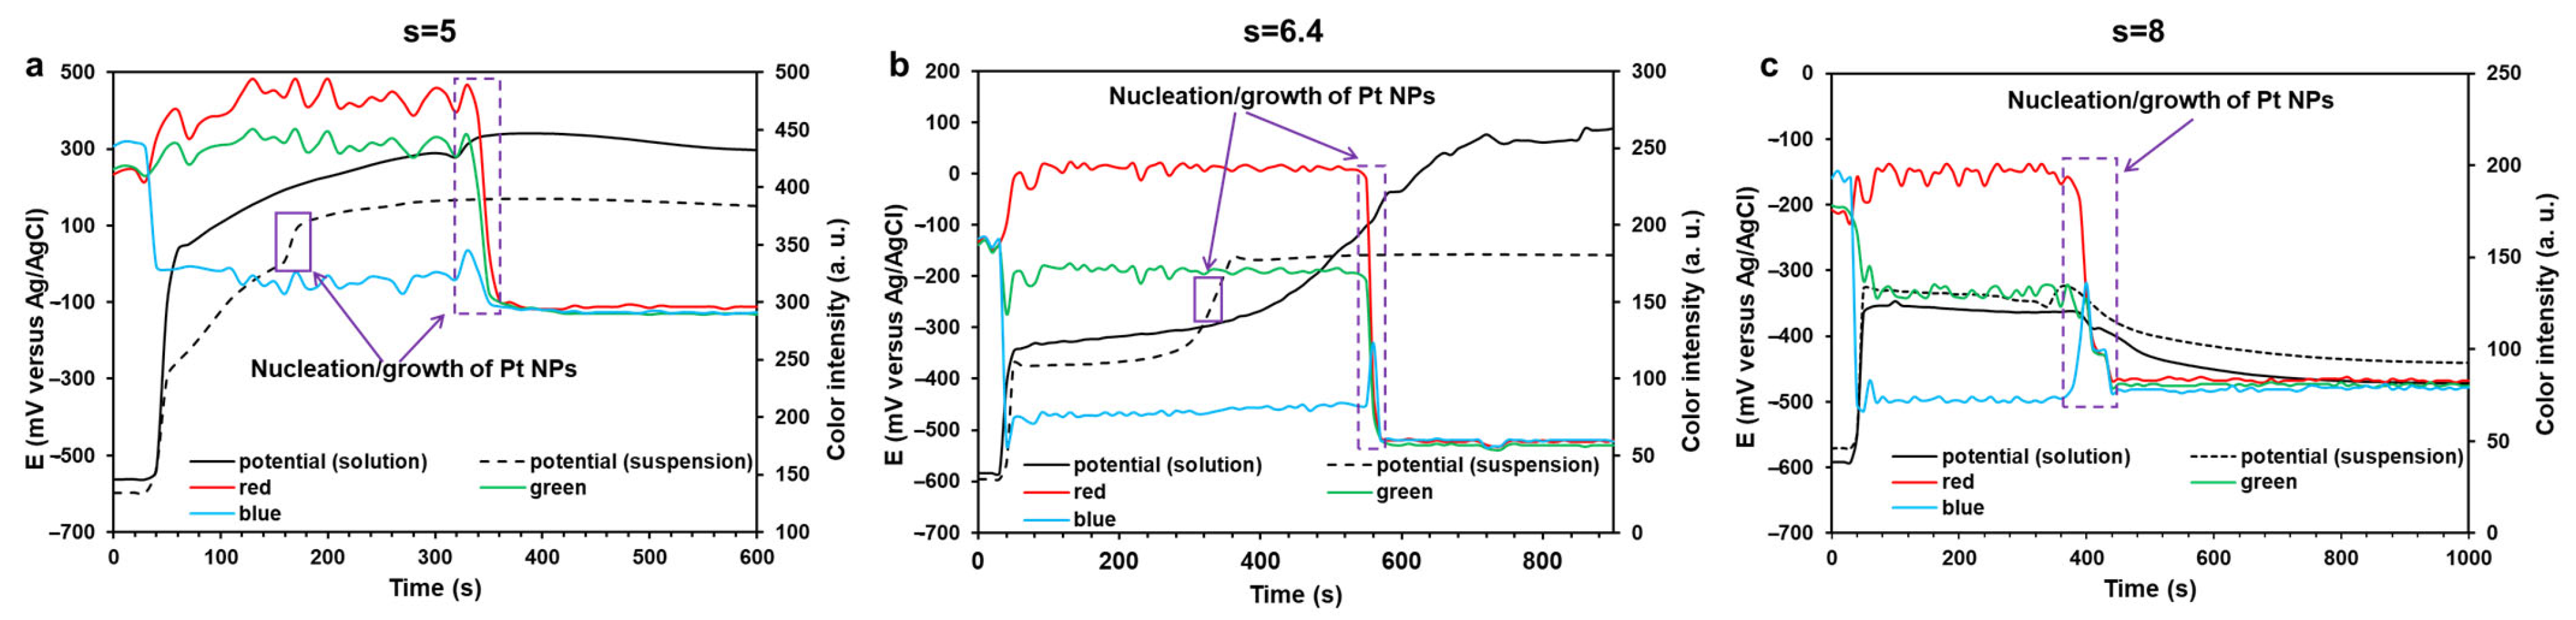
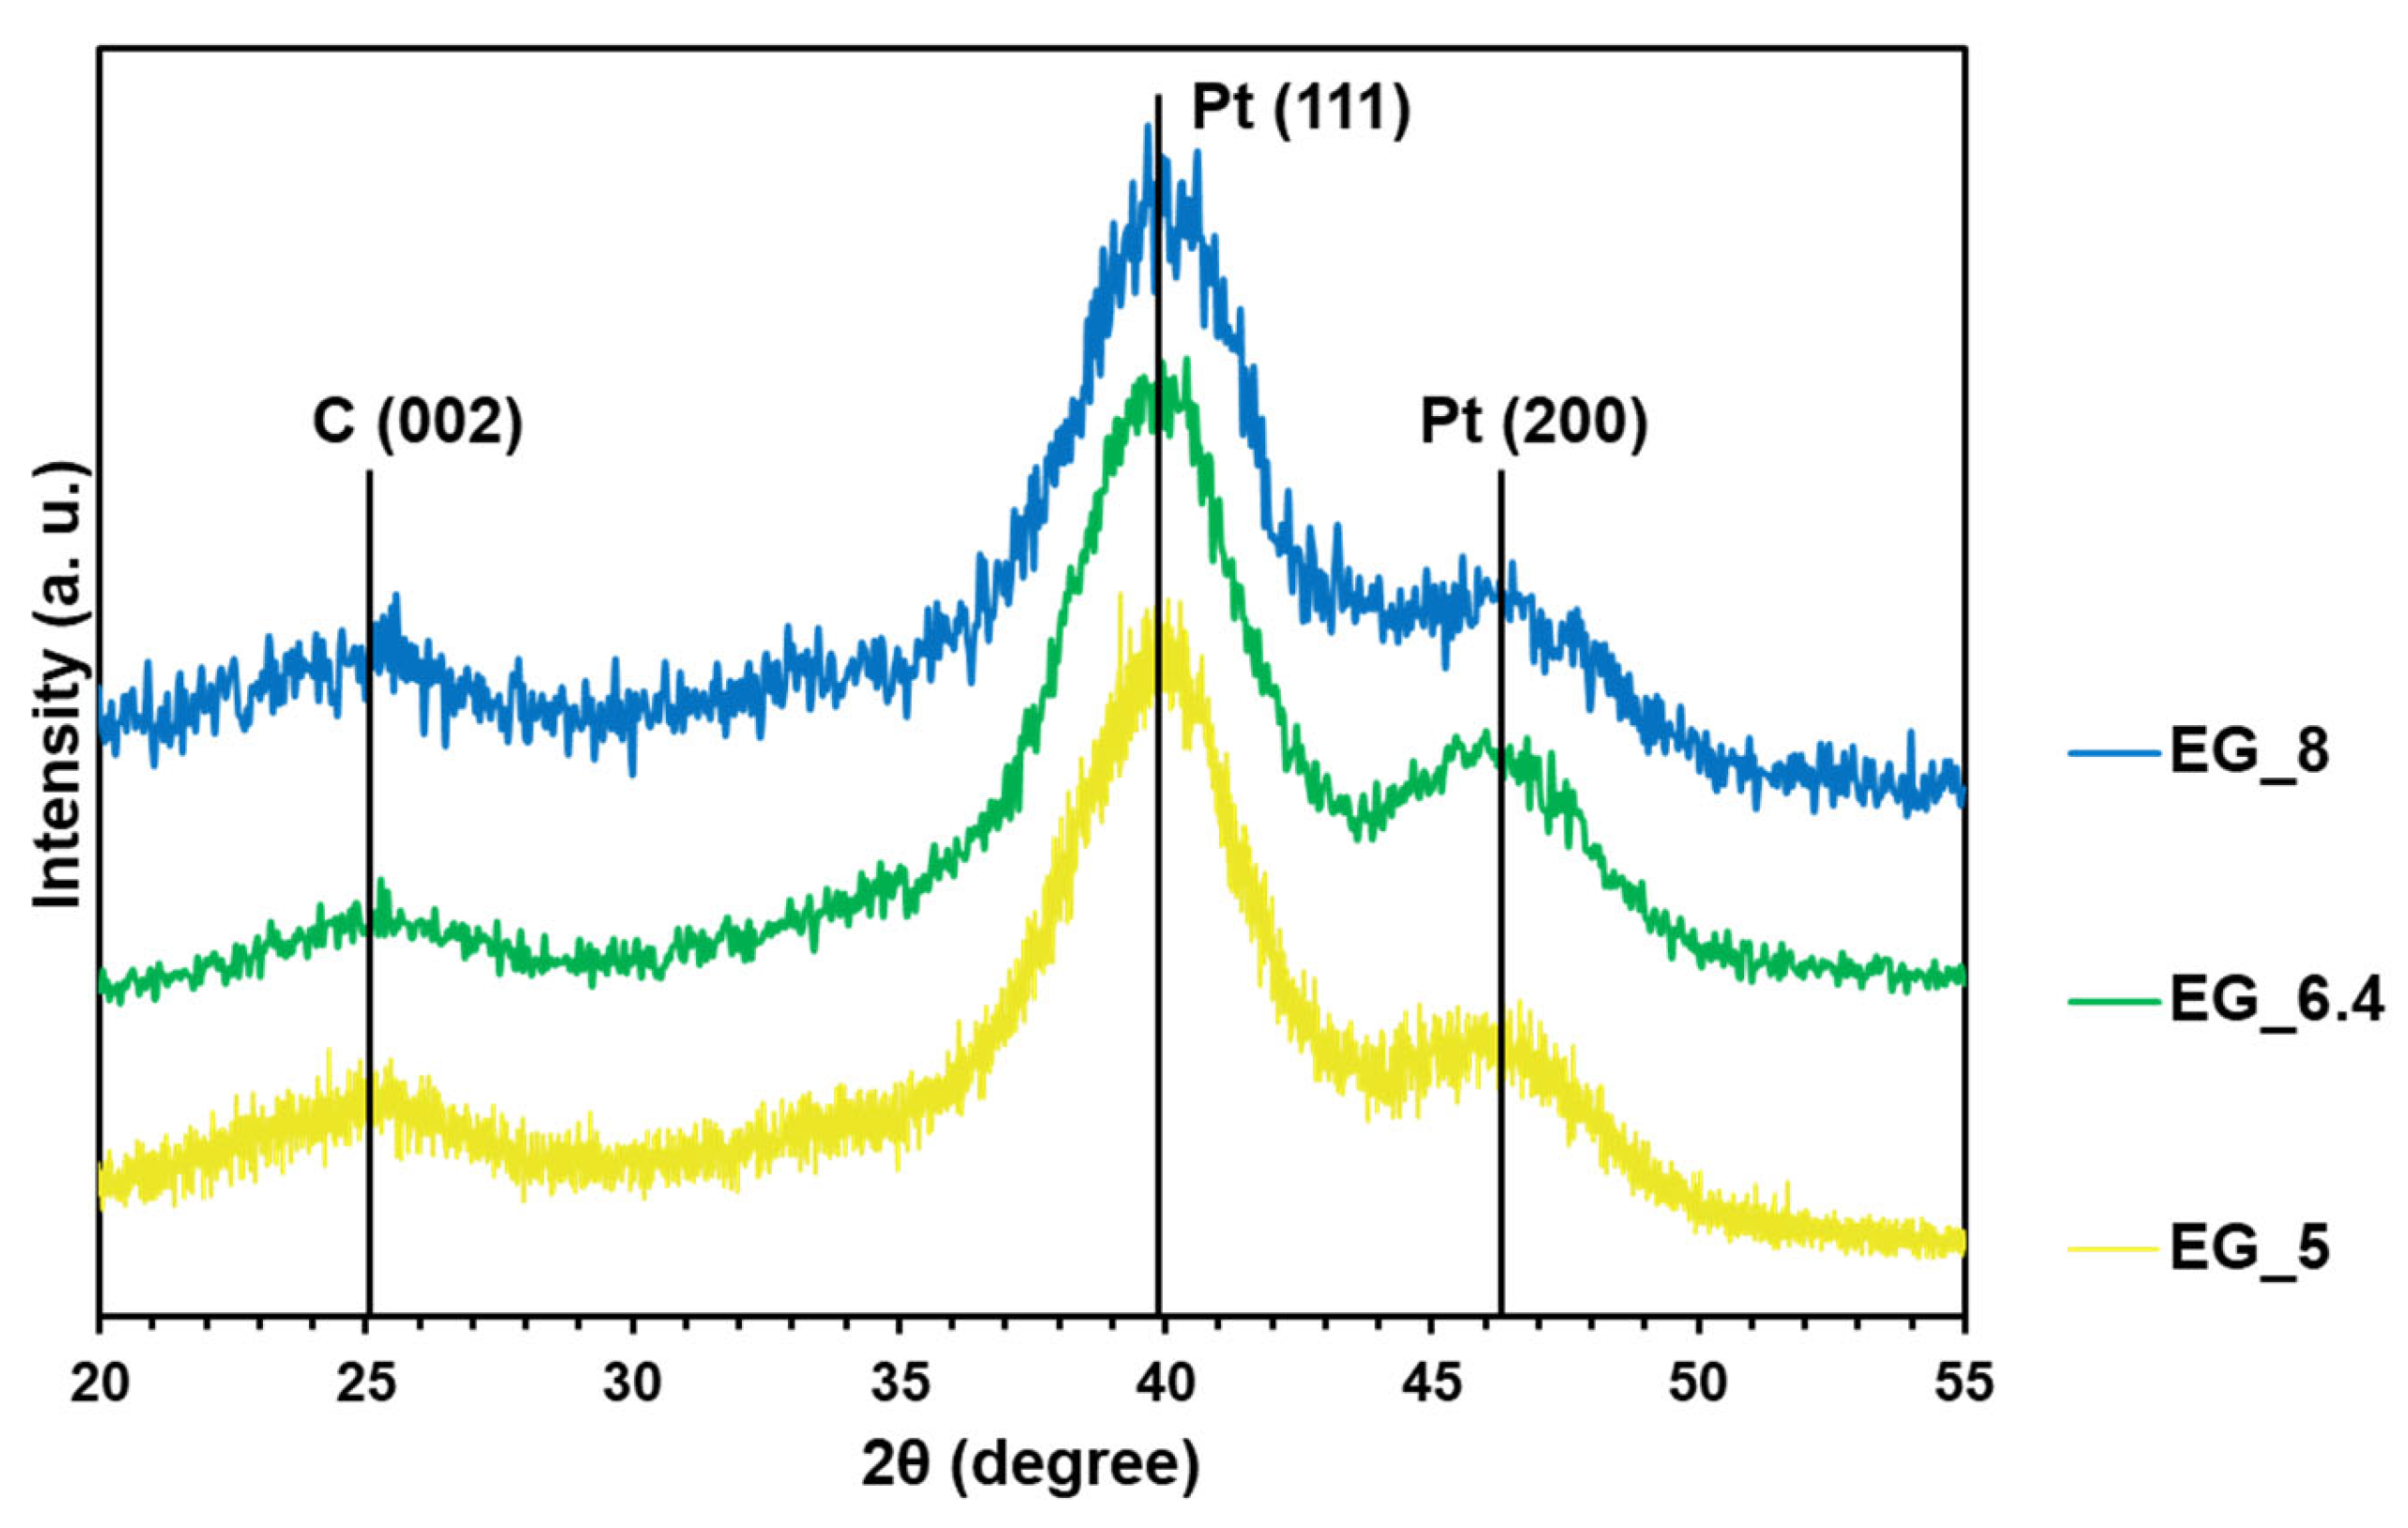
2.2. Kinetics of the Pt(IV) Reduction with Ethylene Glycol and the Resulting Pt/C Materials
2.3. Cyclic Voltammetry and Electrochemically Active Surface Area of Pt/C Electrocatalysts
2.4. Advantages of Pt/C Electrocatalysts Containing Nearly Monodispersive Platinum Nanoparticles
3. Materials and Methods
3.1. Reagents and Synthesis Methods
3.1.1. Reagents Used
3.1.2. Synthesis of Pt NPs and Pt/C Using Citric Acid as the Reducing Agent
3.1.3. Synthesis of Pt NPs and Pt/C Using Ethylene Glycol as the Reducing Agent
3.2. Methods for Studying the Kinetics of Pt NPs Phase Formation
3.2.1. Measuring the Solution Coloring Intensity During the Synthesis
3.2.2. Measuring the Redox Potential of the Reaction Medium During the Synthesis
3.3. Assessment of Structural and Morphological Characteristics of the Pt/C Materials
3.3.1. Determination of the Pt Mass Fraction
3.3.2. Determination of the Average Pt Crystallite Size
3.3.3. Determination of the Average Size and the Size Dispersion of Pt NPs
3.4. Study of the Electrocatalysts Electrochemical Behavior
3.4.1. Formation of the Catalytic Layer
3.4.2. Surface Activation and Determination of the Pt/C ESA
3.4.3. Determination of the ORR Activity
3.4.4. Determination of the Pt/C Catalysts Resistance to Degradation
4. Conclusions
Author Contributions
Funding
Data Availability Statement
Acknowledgments
Conflicts of Interest
References
- Markovič, N.M.; Schmidt, T.J.; Stamenkovič, V.; Ross, P.N. Oxygen Reduction Reaction on Pt and Pt Bimetallic Surfaces: A Selective Review. Fuel Cells 2001, 1, 105–116. [Google Scholar] [CrossRef]
- Ross, P.; Lipkowski, J. Electrocatalysis; Wiley-VCH: New York, NY, USA, 1998. [Google Scholar]
- Wang, Y.; Seo, B.; Wang, B.; Zamel, N.; Jiao, K.; Adroher, X.C. Fundamentals, Materials, and Machine Learning of Polymer Electrolyte Membrane Fuel Cell Technology. Energy AI 2020, 1, 100014. [Google Scholar] [CrossRef]
- Banham, D.; Ye, S. Current Status and Future Development of Catalyst Materials and Catalyst Layers for Proton Exchange Membrane Fuel Cells: An Industrial Perspective. ACS Energy Lett. 2017, 2, 629–638. [Google Scholar] [CrossRef]
- Sui, S.; Wang, X.; Zhou, X.; Su, Y.; Riffat, S.; Liu, C.J. A Comprehensive Review of Pt Electrocatalysts for the Oxygen Reduction Reaction: Nanostructure, Activity, Mechanism and Carbon Support in PEM Fuel Cells. J. Mater. Chem. A Mater. 2017, 5, 1808–1825. [Google Scholar] [CrossRef]
- Suter, T.A.; Smith, K.; Hack, J.; Rasha, L.; Rana, Z.; Angel, G.M.A.; Shearing, P.R.; Miller, T.S.; Brett, D.J. Engineering Catalyst Layers for Next-Generation Polymer Electrolyte Fuel Cells: A Review of Design, Materials, and Methods. Adv. Energy Mater. 2021, 11, 2101025. [Google Scholar] [CrossRef]
- Nesselberger, M.; Ashton, S.; Meier, J.C.; Katsounaros, I.; Mayrhofer, K.J.J.; Arenz, M. The Particle Size Effect on the Oxygen Reduction Reaction Activity of Pt Catalysts: Influence of Electrolyte and Relation to Single Crystal Models. J. Am. Chem. Soc. 2011, 133, 17428–17433. [Google Scholar] [CrossRef]
- Tritsaris, G.A.; Greeley, J.; Rossmeisl, J.; Nørskov, J.K. Atomic-Scale Modeling of Particle Size Effects for the Oxygen Reduction Reaction on Pt. Catal. Lett. 2011, 141, 909–913. [Google Scholar] [CrossRef]
- Zhang, C.; Shen, X.; Pan, Y.; Peng, Z. A Review of Pt-Based Electrocatalysts for Oxygen Reduction Reaction. Front. Energy 2017, 11, 268–285. [Google Scholar] [CrossRef]
- Suo, N.; Cao, L.; Qin, X.; Shao, Z. Research Progress of Pt and Pt-Based Cathode Electrocatalysts for Proton-Exchange Membrane Fuel Cells. Chin. Phys. B 2022, 31, 128108. [Google Scholar] [CrossRef]
- Paperzh, K.O.; Alekseenko, A.A.; Volochaev, V.A.; Pankov, I.V.; Safronenko, O.A.; Guterman, V.E. Stability and Activity of Platinum Nanoparticles in the Oxygen Electroreduction Reaction: Is Size or Uniformity of Primary Importance? Beilstein J. Nanotechnol. 2021, 12, 593–606. [Google Scholar] [CrossRef]
- Yano, H.; Watanabe, M.; Iiyama, A.; Uchida, H. Particle-Size Effect of Pt Cathode Catalysts on Durability in Fuel Cells. Nano Energy 2016, 29, 323–333. [Google Scholar] [CrossRef]
- Shao, M.; Chang, Q.; Dodelet, J.P.; Chenitz, R. Recent Advances in Electrocatalysts for Oxygen Reduction Reaction. Chem. Rev. 2016, 116, 3594–3657. [Google Scholar] [CrossRef] [PubMed]
- Xu, X.; Zhong, Y.; Wajrak, M.; Bhatelia, T.; Jiang, S.P.; Shao, Z. Grain Boundary Engineering: An Emerging Pathway toward Efficient Electrocatalysis. InfoMat 2024, 6, e12608. [Google Scholar] [CrossRef]
- Rossi, K.; Asara, G.G.; Baletto, F. Structural Screening and Design of Platinum Nanosamples for Oxygen Reduction. ACS Catal. 2020, 10, 3911–3920. [Google Scholar] [CrossRef]
- Nyabadza, A.; McCarthy, É.; Makhesana, M.; Heidarinassab, S.; Plouze, A.; Vazquez, M.; Brabazon, D. A Review of Physical, Chemical and Biological Synthesis Methods of Bimetallic Nanoparticles and Applications in Sensing, Water Treatment, Biomedicine, Catalysis and Hydrogen Storage. Adv. Colloid Interface Sci. 2023, 321, 103010. [Google Scholar] [CrossRef]
- Liu, H.; Zhao, J.; Li, X. Controlled Synthesis of Carbon-Supported Pt-Based Electrocatalysts for Proton Exchange Membrane Fuel Cells. Electrochem. Energy Rev. 2022, 5, 13. [Google Scholar] [CrossRef] [PubMed]
- Quinson, J.; Jensen, K.M.Ø. From Platinum Atoms in Molecules to Colloidal Nanoparticles: A Review on Reduction, Nucleation and Growth Mechanisms. Adv. Colloid Interface Sci. 2020, 286, 102300. [Google Scholar] [CrossRef]
- Kim, H.; Park, J.N.; Lee, W.H. Preparation of Platinum-Based Electrode Catalysts for Low Temperature Fuel Cell. Catal. Today 2003, 87, 237–245. [Google Scholar] [CrossRef]
- Quinson, J.; Kunz, S.; Arenz, M. Surfactant-Free Colloidal Syntheses of Precious Metal Nanoparticles for Improved Catalysts. ACS Catal. 2023, 13, 4903–4937. [Google Scholar] [CrossRef]
- Qi, J.; Jiang, L.; Jing, M.; Tang, Q.; Sun, G. Preparation of Pt/C via a Polyol Process—Investigation on Carbon Support Adding Sequence. Int. J. Hydrogen Energy 2011, 36, 10490–10501. [Google Scholar] [CrossRef]
- Wang, Y.; Wang, X. Solvent and Simple Ion-Stabilized Metal Nanoclusters: Chemical Synthesis and Application. In Metal Nanoclusters in Catalysis and Materials Science: The Issue of Size Control; Elsevier: Amsterdam, The Netherlands, 2008; pp. 327–340. [Google Scholar] [CrossRef]
- Quinson, J.; Inaba, M.; Neumann, S.; Swane, A.A.; Bucher, J.; Simonsen, S.B.; Theil Kuhn, L.; Kirkensgaard, J.J.K.; Jensen, K.M.; Oezaslan, M.; et al. Investigating Particle Size Effects in Catalysis by Applying a Size-Controlled and Surfactant-Free Synthesis of Colloidal Nanoparticles in Alkaline Ethylene Glycol: Case Study of the Oxygen Reduction Reaction on Pt. ACS Catal. 2018, 8, 6627–6635. [Google Scholar] [CrossRef]
- Favilla, P.C.; Acosta, J.J.; Schvezov, C.E.; Sercovich, D.J.; Collet-Lacoste, J.R. Size Control of Carbon-Supported Platinum Nanoparticles Made Using Polyol Method for Low Temperature Fuel Cells. Chem. Eng. Sci. 2013, 101, 27–34. [Google Scholar] [CrossRef]
- Oh, H.S.; Oh, J.G.; Hong, Y.G.; Kim, H. Investigation of Carbon-Supported Pt Nanocatalyst Preparation by the Polyol Process for Fuel Cell Applications. Electrochim. Acta 2007, 52, 7278–7285. [Google Scholar] [CrossRef]
- Veizaga, N.; Fernandez, J.; Bruno, M.; Scelza, O.; De Miguel, S. Deposition of Pt Nanoparticles on Different Carbonaceous Materials by Using Different Preparation Methods for PEMFC Electrocatalysts. Int. J. Hydrogen Energy 2012, 37, 17910–17920. [Google Scholar] [CrossRef]
- Xia, Y.; Xiong, Y.; Lim, B.; Skrabalak, S.E. Shape-Controlled Synthesis of Metal Nanocrystals: Simple Chemistry Meets Complex Physics? Angew. Chem. Int. Ed. 2009, 48, 60–103. [Google Scholar] [CrossRef]
- Rodrigues, T.S.; Zhao, M.; Yang, T.H.; Gilroy, K.D.; da Silva, A.G.M.; Camargo, P.H.C.; Xia, Y. Synthesis of Colloidal Metal Nanocrystals: A Comprehensive Review on the Reductants. Chem.–Eur. J. 2018, 24, 16944–16963. [Google Scholar] [CrossRef]
- Nakamoto, T.; Seki, R.; Motomiya, K.I.; Yokoyama, S.; Tohji, K.; Takahashi, H. Morphological Control of Carbon-Supported Pt-Based Nanoparticles via One-Step Synthesis. Nano-Struct. Nano-Objects 2020, 22, 100443. [Google Scholar] [CrossRef]
- Burda, C.; Chen, X.; Narayanan, R.; El-Sayed, M.A. Chemistry and Properties of Nanocrystals of Different Shapes. Chem. Rev. 2005, 105, 1025–1102. [Google Scholar] [CrossRef] [PubMed]
- Quinson, J.; Neumann, S.; Kacenauskaite, L.; Bucher, J.; Kirkensgaard, J.J.K.; Simonsen, S.B.; Theil Kuhn, L.; Zana, A.; Vosch, T.; Oezaslan, M.; et al. Solvent-Dependent Growth and Stabilization Mechanisms of Surfactant-Free Colloidal Pt Nanoparticles. Chem.–Eur. J. 2020, 26, 9012–9023. [Google Scholar] [CrossRef]
- Zhang, Z.; Yang, G.; Wang, H.; Cao, Y.; Peng, F.; Yu, H. Controllable Surfactant-Free Synthesis of Colloidal Platinum Nanocuboids Enabled by Bromide Ions and Carbon Monoxide. ChemElectroChem 2022, 9, e202101726. [Google Scholar] [CrossRef]
- Danilenko, M.V.; Guterman, V.E.; Vetrova, E.V.; Metelitsa, A.V.; Paperzh, K.O.; Pankov, I.V.; Safronenko, O.I. Nucleation/Growth of the Platinum Nanoparticles under the Liquid Phase Synthesis. Colloids Surf. A Physicochem. Eng. Asp. 2021, 630, 127525. [Google Scholar] [CrossRef]
- Popa, M.; Pradell, T.; Crespo, D.; Calderón-Moreno, J.M. Stable Silver Colloidal Dispersions Using Short Chain Polyethylene Glycol. Colloids Surf. A Physicochem. Eng. Asp. 2007, 303, 184–190. [Google Scholar] [CrossRef]
- Schröder, J.; Neumann, S.; Quinson, J.; Arenz, M.; Kunz, S. Anion Dependent Particle Size Control of Platinum Nanoparticles Synthesized in Ethylene Glycol. Nanomaterials 2021, 11, 2092. [Google Scholar] [CrossRef] [PubMed]
- Guterman, V.E.; Belenov, S.V.; Alekseenko, A.A.; Lin, R.; Tabachkova, N.Y.; Safronenko, O.I. Activity and Stability of Pt/C and Pt-Cu/C Electrocatalysts. Electrocatalysis 2018, 9, 550–562. [Google Scholar] [CrossRef]
- Hirsch, R. Exploring Colour Photography: A Complete Guide; Laurence King Publishing: London, UK, 2005; p. 352. [Google Scholar]
- Moguchikh, E.; Paperzh, K.; Pankov, I.; Belenov, S.; Alekseenko, A. Durability of Commercial Catalysts within Relevant Stress Testing Protocols. Catalysts 2023, 13, 923. [Google Scholar] [CrossRef]
- GOST 58144–2018. Available online: https://www.russiangost.com/p-354110-gost-r-58144-2018.aspx (accessed on 29 June 2023).
- Langford, J.I.; Wilson, A.J.C. Scherrer after Sixty Years: A Survey and Some New Results in the Determination of Crystallite Size. J. Appl. Crystallogr. 1978, 11, 102–113. [Google Scholar] [CrossRef]
- Liu, Z.; Ling, X.Y.; Su, X.; Lee, J.Y. Carbon-Supported Pt and PtRu Nanoparticles as Catalysts for a Direct Methanol Fuel Cell. J. Phys. Chem. B 2004, 108, 8234–8240. [Google Scholar] [CrossRef]
- Vega, L.; Garcia-Cardona, J.; Viñes, F.; Cabot, P.L.; Neyman, K.M. Nanostructuring Determines Poisoning: Tailoring CO Adsorption on PtCu Bimetallic Nanoparticles. Mater. Adv. 2022, 3, 4159–4169. [Google Scholar] [CrossRef]
- Pavlets, A.; Alekseenko, A.; Menshchikov, V.; Belenov, S.; Volochaev, V.; Pankov, I.; Safronenko, O.; Guterman, V. Influence of Electrochemical Pretreatment Conditions of PtCu/C Alloy Electrocatalyst on Its Activity. Nanomaterials 2021, 11, 1499. [Google Scholar] [CrossRef]
- Shinozaki, K.; Zack, J.W.; Pylypenko, S.; Pivovar, B.S.; Kocha, S.S. Oxygen Reduction Reaction Measurements on Platinum Electrocatalysts Utilizing Rotating Disk Electrode Technique. J. Electrochem. Soc. 2015, 162, F1384–F1396. [Google Scholar] [CrossRef]
- Rotating Disk-Electrode Aqueous Electrolyte Accelerated Stress Tests for PGM Electrocatalyst/Support Durability Evaluation DOE Durability Working Group 10/4/2011. Available online: https://www.energy.gov/eere/fuelcells/articles/rotating-disk-electrode-aqueous-electrolyte-accelerated-stress-tests-pgm (accessed on 29 June 2023).


| Sample | Product Yield, % | Pt Mass Fraction, wt.% | DAv (Pt), nm | ESA, m2/g (Pt) |
|---|---|---|---|---|
| CA_70 | 86 ± 2 | 34 ± 1 | 2.1 ± 0.2 | 60 ± 6 |
| CA_80 | 83 ± 2 | 38 ± 1 | 2.3 ± 0.2 | 71 ± 7 |
| CA_90 | 87 ± 2 | 38 ± 1 | 2.4 ± 0.2 | 72 ± 7 |
| EG_5 | 86 ± 2 | 39 ± 1 | 2.1 ± 0.2 | 85 ± 8 |
| EG_6.4 | 80 ± 2 | 41 ± 1 | 2.2 ± 0.2 | 66 ± 7 |
| EG_8 | 80 ± 2 | 40 ± 1 | 2.1 ± 0.2 | 71 ± 7 |
Disclaimer/Publisher’s Note: The statements, opinions and data contained in all publications are solely those of the individual author(s) and contributor(s) and not of MDPI and/or the editor(s). MDPI and/or the editor(s) disclaim responsibility for any injury to people or property resulting from any ideas, methods, instructions or products referred to in the content. |
© 2024 by the authors. Licensee MDPI, Basel, Switzerland. This article is an open access article distributed under the terms and conditions of the Creative Commons Attribution (CC BY) license (https://creativecommons.org/licenses/by/4.0/).
Share and Cite
Guterman, V.; Paperzh, K.; Novomlinskaya, I.; Kantsypa, I.; Khudoley, A.; Astravukh, Y.; Pankov, I.; Nikulin, A. Advances in Liquid-Phase Synthesis: Monitoring of Kinetics for Platinum Nanoparticles Formation, and Pt/C Electrocatalysts with Monodispersive Nanoparticles for Oxygen Reduction. Catalysts 2024, 14, 728. https://doi.org/10.3390/catal14100728
Guterman V, Paperzh K, Novomlinskaya I, Kantsypa I, Khudoley A, Astravukh Y, Pankov I, Nikulin A. Advances in Liquid-Phase Synthesis: Monitoring of Kinetics for Platinum Nanoparticles Formation, and Pt/C Electrocatalysts with Monodispersive Nanoparticles for Oxygen Reduction. Catalysts. 2024; 14(10):728. https://doi.org/10.3390/catal14100728
Chicago/Turabian StyleGuterman, Vladimir, Kirill Paperzh, Irina Novomlinskaya, Ilya Kantsypa, Alina Khudoley, Yana Astravukh, Ilya Pankov, and Alexey Nikulin. 2024. "Advances in Liquid-Phase Synthesis: Monitoring of Kinetics for Platinum Nanoparticles Formation, and Pt/C Electrocatalysts with Monodispersive Nanoparticles for Oxygen Reduction" Catalysts 14, no. 10: 728. https://doi.org/10.3390/catal14100728
APA StyleGuterman, V., Paperzh, K., Novomlinskaya, I., Kantsypa, I., Khudoley, A., Astravukh, Y., Pankov, I., & Nikulin, A. (2024). Advances in Liquid-Phase Synthesis: Monitoring of Kinetics for Platinum Nanoparticles Formation, and Pt/C Electrocatalysts with Monodispersive Nanoparticles for Oxygen Reduction. Catalysts, 14(10), 728. https://doi.org/10.3390/catal14100728