Article

Identifying the Active Phase of RuO2 in the Catalytic CO Oxidation Reaction, Employing Operando CO Infrared Spectroscopy and Online Mass Spectrometry

1
Institute of Physical Chemistry, Justus Liebig University, Heinrich Buff Ring 17, 35392 Giessen, Germany
2
Center for Materials Research, Justus Liebig University, Heinrich-Buff-Ring 16, 35392 Giessen, Germany
*
Author to whom correspondence should be addressed.
Catalysts 2023, 13(8), 1178; https://doi.org/10.3390/catal13081178
Submission received: 16 June 2023 / Revised: 13 July 2023 / Accepted: 19 July 2023 / Published: 1 August 2023

Abstract

:
Operando diffuse reflectance infrared Fourier transform spectroscopy (DRIFTS) is combined with online mass spectrometry (MS) to help to resolve a long-standing debate concerning the active phase of RuO2 supported on rutile TiO2 (RuO2@TiO2) during the CO oxidation reaction. DRIFTS has been demonstrated to serve as a versatile probe molecule to elucidate the active phase of RuO2@TiO2 under various reaction conditions. Fully oxidized and fully reduced catalysts serve to provide reference DRIFT spectra, based on which the operando CO spectra acquired during CO oxidation under various reaction conditions are interpreted. Partially reduced RuO2@TiO2 was identified as the most active catalyst in the CO oxidation reaction. This is independent of the reaction conditions being reducing or oxidizing and whether the starting catalyst is the fully oxidized RuO2@TiO2 or the partially reduced RuO2@TiO2.

Graphical Abstract

1. Introduction

Scientific discussions about the nature of the active phase in a catalytic reaction are not straightforward [1]. This has been encountered particularly often with reducible oxides of precious metals such as Ru [2,3], Pd [4,5], Pt [6], Rh [7], and Ir [8,9,10], which can readily adapt their oxidation state depending on the specific reaction condition. Therefore, to identify the actual active phase one needs to employ operando spectroscopic or structure-sensitive methods [11,12,13].
One particular intensively discussed example, and the first catalytic system where this discussion heated up, is the CO oxidation reaction over Ru-based catalysts [14]. Here, two schools are involved: one that prefers metallic ruthenium being the active phase [15] and another that favors oxide being the active phase [16]. We recall that the ruthenium system reveals a surprisingly rich chemistry during CO oxidation, exhibiting phase changes and being subject to poisoning by the formed CO2 [2] to the point that even oscillations in the CO2 yield can occur in the CO oxidation reaction performed in a flow cell [17]. At the summit of this discussion, ruthenium dioxide was even considered to be not active at all in oxidation catalysis. Admittedly, the catalytic CO oxidation reaction over Ru-based catalysts does not have application in exhaust after treatment due to the potential formation of toxic and volatile RuO4 at high temperatures. However, Ru and especially RuO2 are currently applied in large-scale industrial processes, such as the catalytic HCl oxidation reaction (Deacon process) [18,19,20] and the electrochemical chlorine evolution reaction (CER) [21], and is considered to be the most efficient oxygen evolution reaction (OER) catalyst for electrochemical water splitting under acidic reaction conditions [22,23]. A general discussion about the catalytically active phase even for a “seemingly less relevant” CO oxidation reaction may therefore have greater impact than hitherto expected, since the same sites and phases may play a role in these reactions as well. As far as we can judge, the discussion of the active phase of Ru-catalyzed CO oxidation has still not been settled.
In a recent paper by Gustafson et al. [7], the discussion of the active phase in the CO oxidation over Pd and Rh was settled, employing operando high-pressure X-ray photoelectron spectroscopy (XPS). For Rh, the oxygen-covered metallic surface was shown to be more active than the oxide, whereas for Pd, thin oxide films were reported to be at least as active as the metallic surface, but a thicker oxide was less active.
In this contribution, we present and discuss operando diffuse reflectance infrared Fourier transform spectroscopy (DRIFTS) experiments [24,25] in combination with online mass spectrometry for catalytic CO oxidation over ruthenium. Catalytic CO oxidation, a well-documented model reaction [26], is carried out in a flow cell reactor setup under various reaction conditions. DRIFTS has been demonstrated to be a powerful technique to identify reaction intermediates on the catalyst’s surface, in particular when CO is involved. More important for our present study is, however, that CO can serve as a versatile probe molecule to study the actual chemical nature of the active phase under reaction conditions [27,28]. This approach is applied to elucidate the active phase of RuO2@TiO2. To do so, first, fully oxidized and fully reduced Ru-based catalysts supported on rutile TiO2 are prepared. The DRIFT spectra of these are used as reference spectra for the subsequent interpretation of operando CO spectra acquired during CO oxidation under various reaction conditions. It is found that, independent of the reaction conditions, the partially reduced RuO2@TiO2 catalyst constitutes the most active catalyst in the CO oxidation reaction.

2. Experimental Results

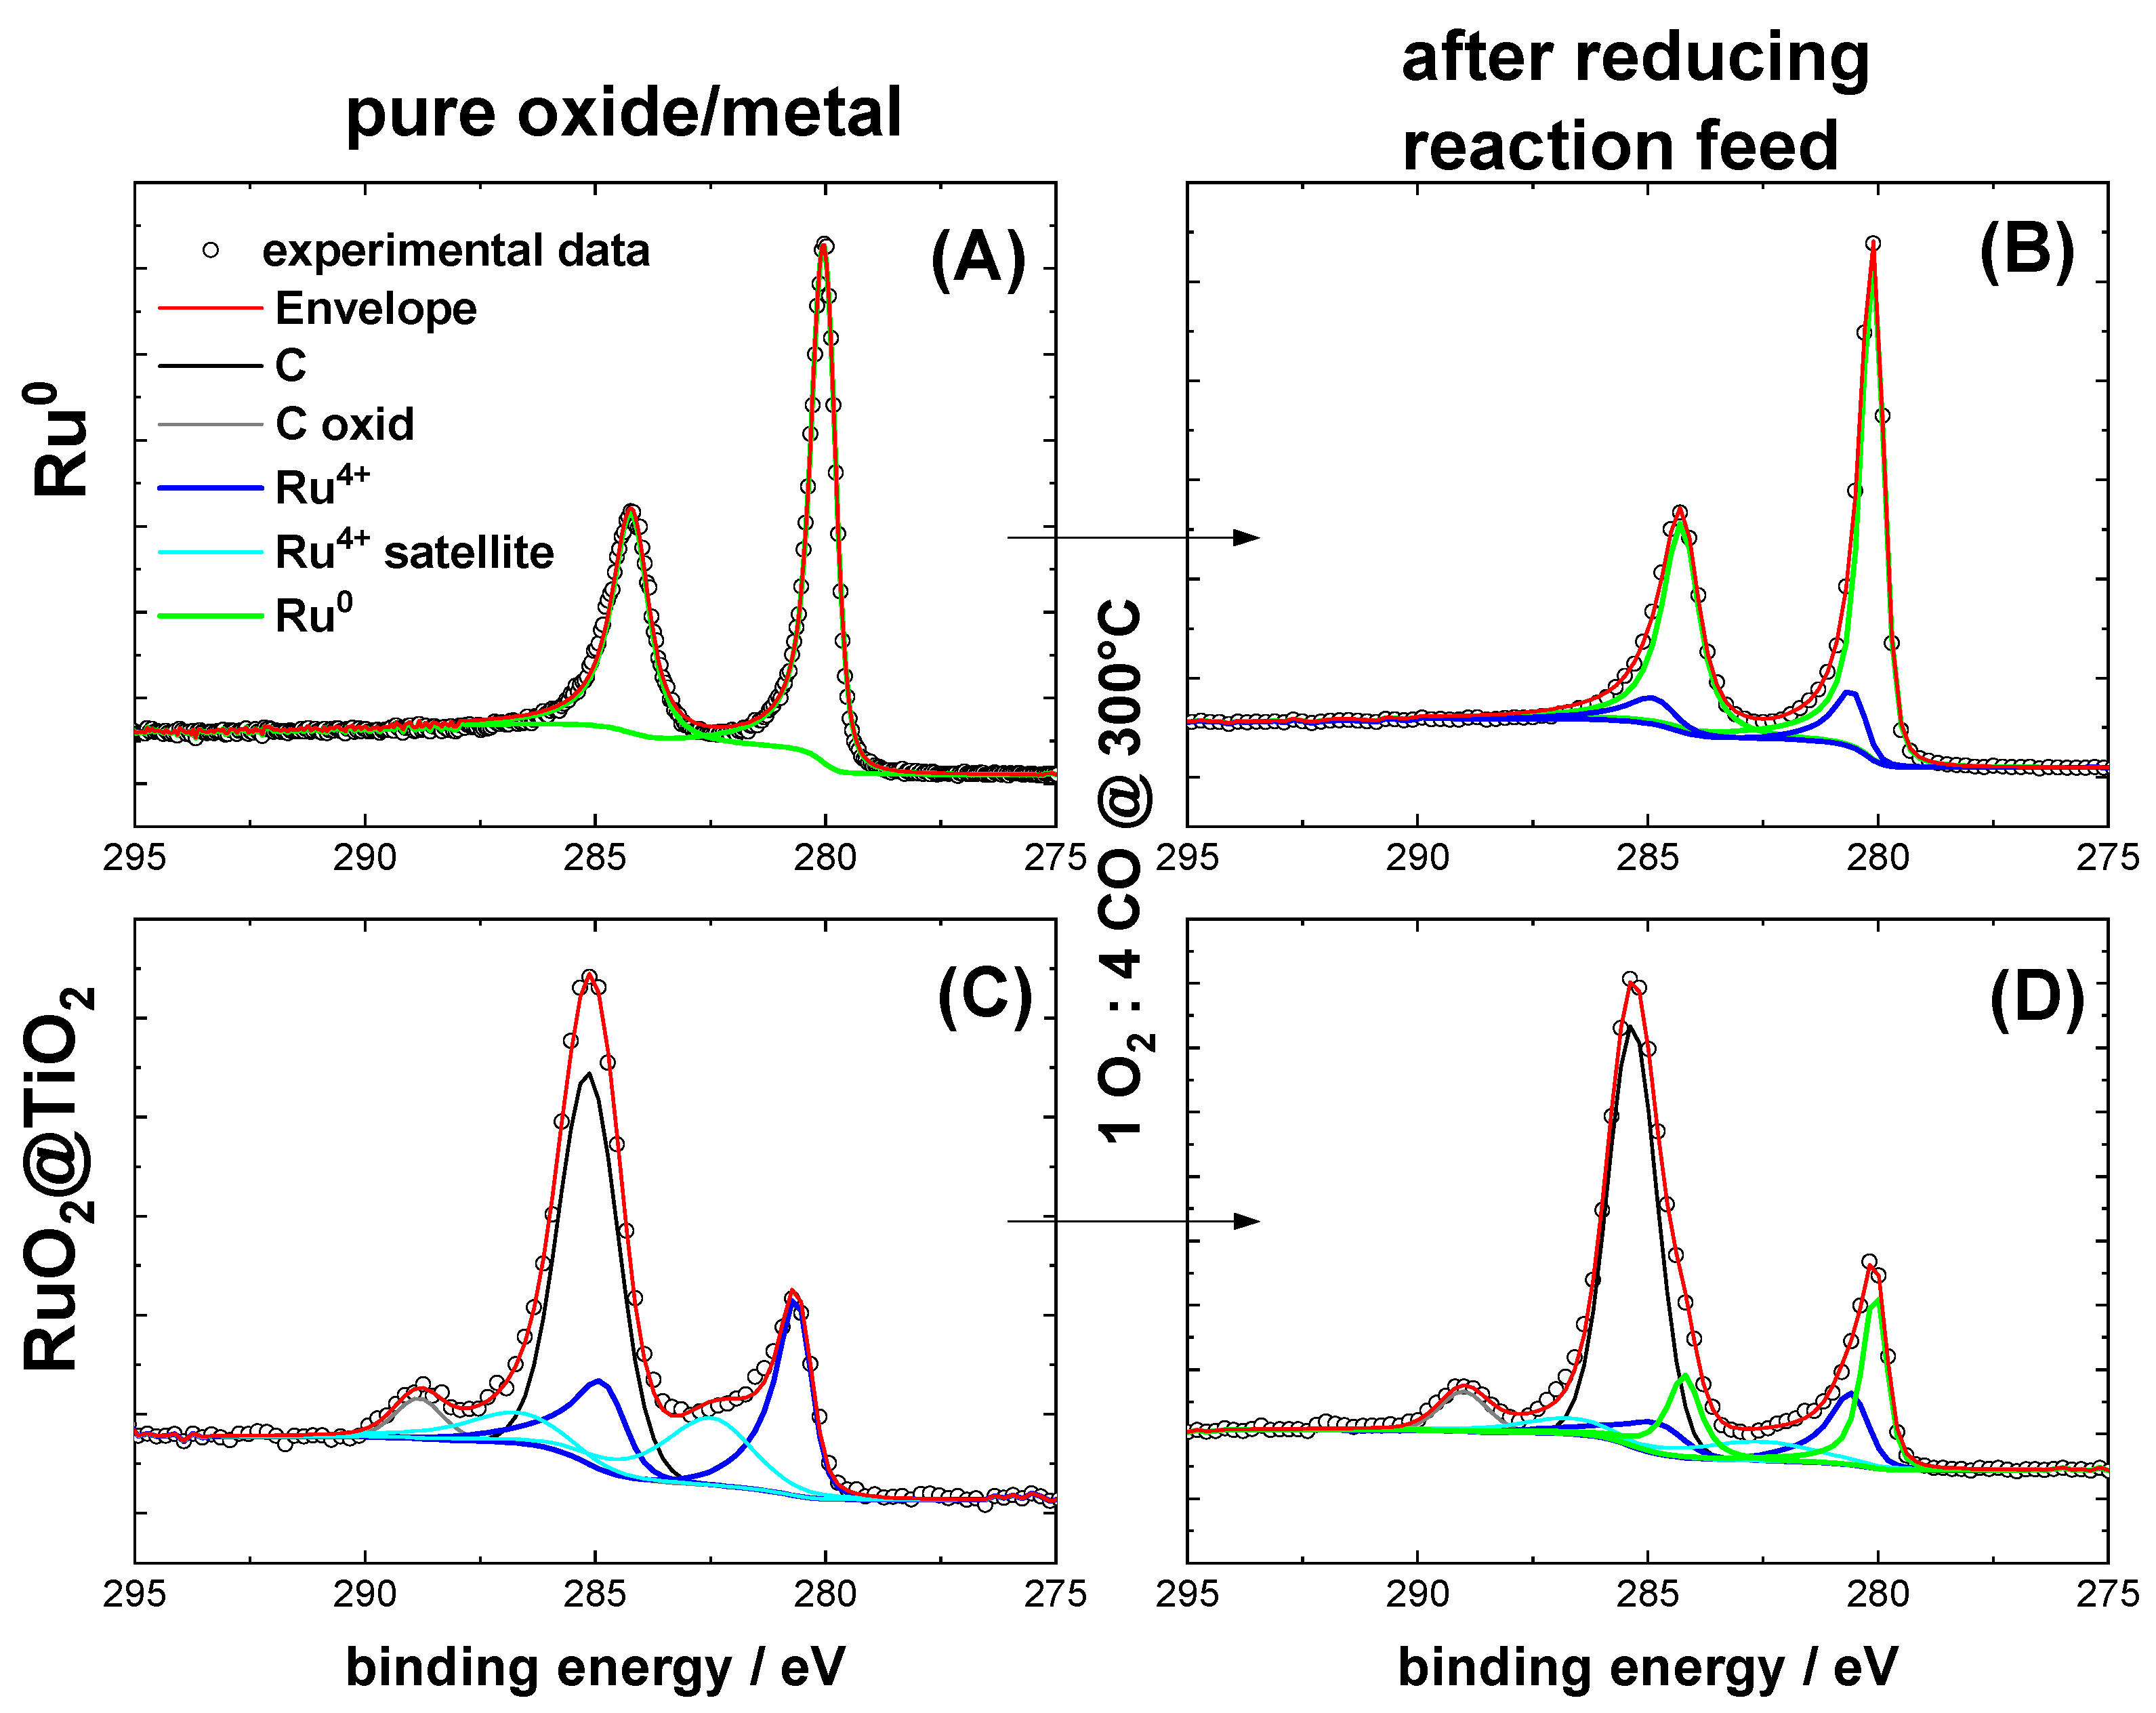
2.1. Characterization of Pre-Oxidized and Pre-Reduced RuO2@TiO2 and Ru0 + TiO2 Samples

Figure 1 shows XP spectra of the Ru 3d binding energy region of supported RuO2 on TiO2, referred to as RuO2@TiO2, and the metallic Ru0 physically mixed with TiO2, referred to as Ru0 + TiO2. The fit parameters used were taken from Morgan et al. [29] and are compiled in Table S1. According to the spectra, ruthenium was fully oxidized in the case of RuO2@TiO2. The spectra of the mixture of Ru0 + TiO2 yielded very low signals in XPS. Therefore, pure Ru0 powder was used to make a meaningful deconvolution possible in the XPS analysis. Here, pure metallic Ru0 was found. After exposure to reducing CO oxidation conditions (1% O2/4% CO/95% Ar), the XP spectra of Ru0 + TiO2 and RuO2@TiO2 in Figure 1 indicate spectral features of both metallic and oxidic Ru. For Ru0 + TiO2, this effect seem to be less pronounced than for RuO2@TiO2. The reason for this is likely the large size of the Ru0 particles, as only the surface would be oxidized and therefore the bulk metal signal would dominate the XPS signal.

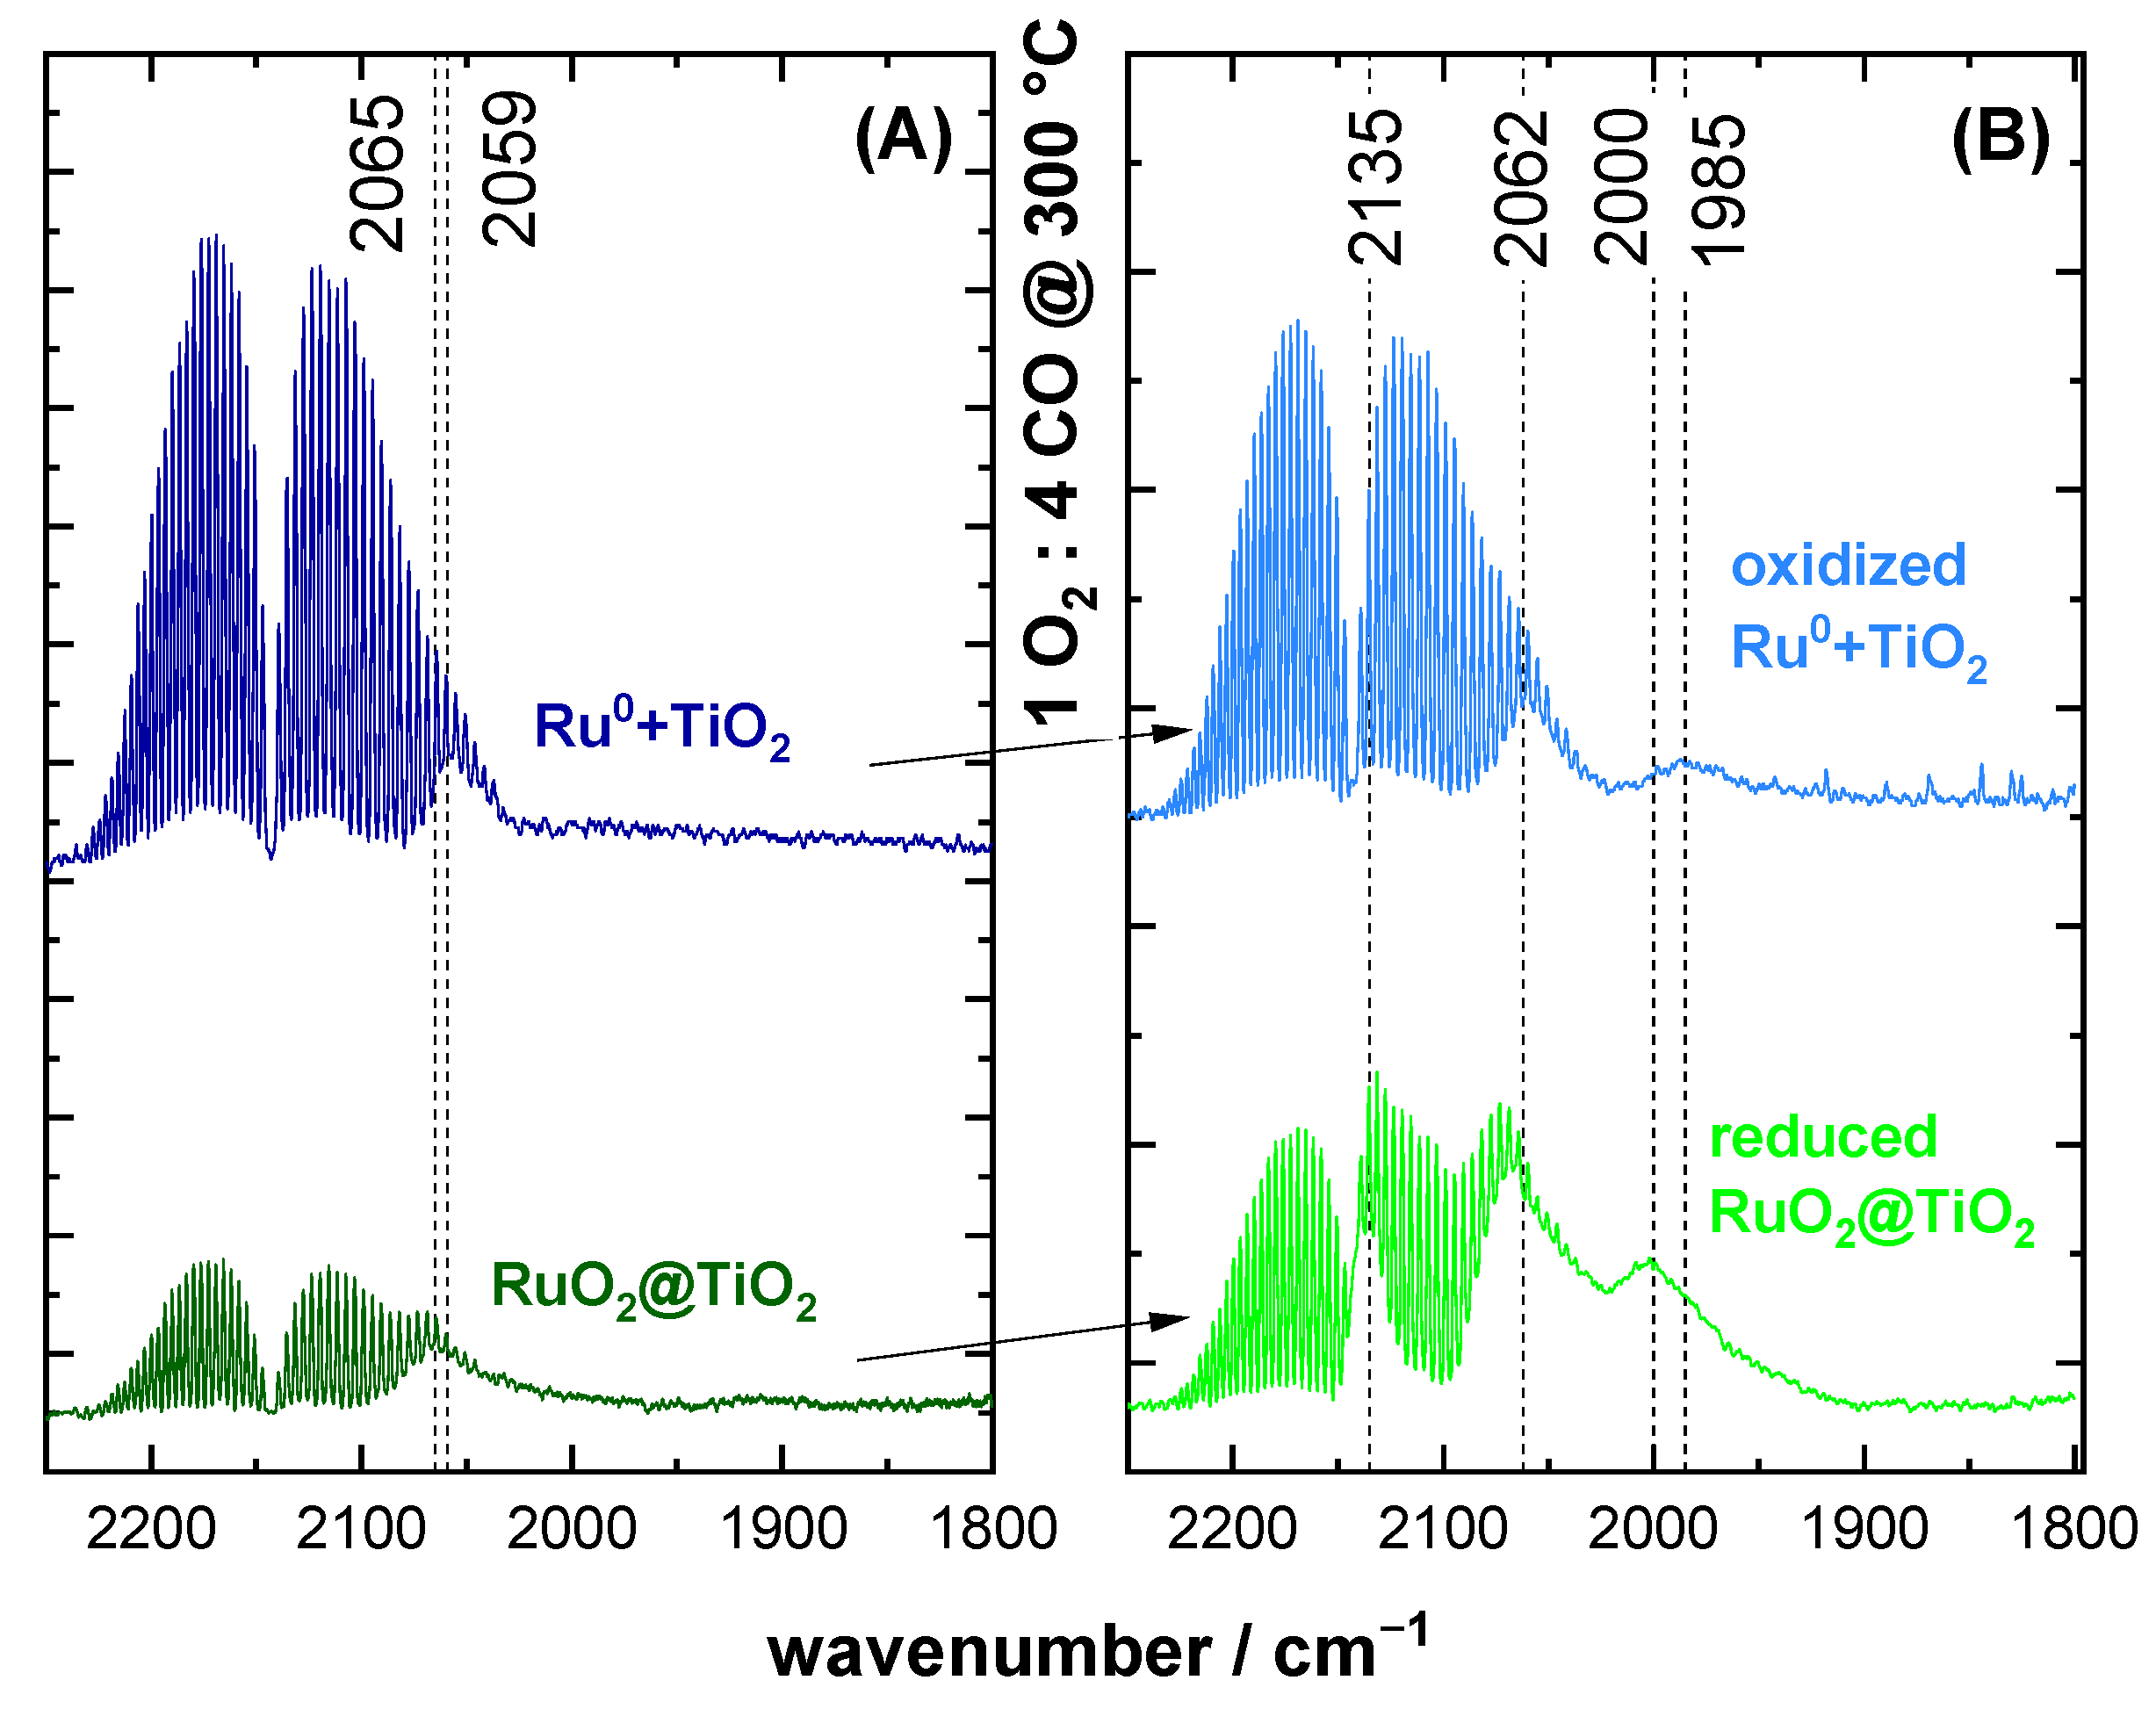
2.2. CO DRIFTS Experiments of Oxidized and Reduced RuO2@TiO2 and Ru0 + TiO2 Samples

Figure 2A shows CO DRIFT spectra of RuO2@TiO2 and Ru0 + TiO2. For this and all following DRIFTS spectra, the y-axis corresponds to absorption in arbitrary units. As evidenced by XPS, these samples consisted of pure oxide and pure metal, respectively. As such, these served as references for assigning spectral DRIFTS features to the CO adsorption on oxide RuO2 and pure metal Ru0, respectively. For both samples, a single symmetric band at around 2060 cm−1 was observed. The same spectral feature was observed for Ru0 + TiO2, which had been oxidized in 4% O2 at 300 °C (cf. Figure S2). We therefore conclude that a distinction between pure metal and pure oxide cannot be made in DRIFTS experiments based on band position alone.
Under reducing CO oxidation conditions (1% O2/4% CO/95% Ar) at 300 °C, the as-prepared catalyst changed its composition in that Ru0 + TiO2 partially oxidized, whereas RuO2@TiO2 partially reduced. DRIFT spectra of the samples after cooling down under these reaction conditions are summarized in Figure 2B. Here, some differences and similarities of the two samples can be identified. The differences in signal strength were due to differing reflectivity of the samples. For oxidized Ru0 + TiO2 the only difference to the pristine Ru0 + TiO2 was the occurrence of a second absorption band at 1985 cm−1. For RuO2@TiO2, the spectra changed more profoundly relative to its pristine sample (Figure 2A). On the one hand, it also exhibited the aforementioned second signal, albeit at a higher wavenumber of 2000 cm−1. In addition, the band at 2065 cm−1 revealed an asymmetric shoulder reaching lower wavenumbers. Experiments on more strongly reduced RuO2@TiO2 indicated this shoulder to be a distinct third species at ca. 2040 cm−1 (cf. Figure 3). The importance of this species for the activity of Ru0/RuO2 towards CO oxidation is discussed below. Furthermore, a fourth band at 2135 cm−1 can be observed. Spectra of pure TiO2 under a CO atmosphere did not indicate any adsorbed CO in DRIFTS (cf. Figure S3). The DRIFT spectra of RuO2@TiO2 and Ru0 + TiO2 in Figure 2B under reducing reaction conditions were similar but different from the pristine samples, thus evidencing a partial reduction of RuO2@TiO2 and the partial oxidation of Ru0 + TiO2 in Figure 2B.

2.3. CO Oxidation Experiments of RuO2@TiO2 Samples

Figure 3 shows DRIFT spectra and the corresponding CO conversion of RuO2@TiO2 and reduced RuO2@TiO2 (see Experimental Details, Section 4.1) during the CO oxidation reaction under oxidizing conditions (2% O2/2% CO/96% Ar) in the temperature range of 20 °C to 260 °C.
For RuO2@TiO2, presented in Figure 3A, a single band at 2075 cm−1 was observed, in accordance with a fully oxidized RuO2 surface (cf. Figure 2A). This band remained unchanged in shape and position up to 140 °C, where it started to diminish. Above 160 °C, no adsorbed CO could be detected in DRIFTS. The conversion increased till it reached a plateau from 150 °C to 180 °C, at which temperature the reaction rate increased again up to 260 °C.
The reduced RuO2@TiO2, which was exposed to 4% CO at 300 °C during the pretreatment, initially showed, as seen in Figure 3C, a somewhat different peak shape than in Figure 2B. Here the most prominent feature is a band at 2042 cm−1 surrounded by shoulders reaching high and low wavenumbers. At 60 °C, the 2042 cm−1 signal started to diminish, and at 100 °C it vanished completely. Between 120 °C and 180 °C, the DRIFT spectra looked like those of the reduced RuO2@TiO2 sample (cf. Figure 2B), albeit with a less pronounced low wavenumber shoulder on the 2077 cm−1 band. During this transition, it can clearly be seen that the DRIFT bands of adsorbed CO observed between 2100 cm−1 and 1980 cm−1 consisted of three distinct spectral features at ca. 2075 cm−1, 2000 cm−1, and 2042 cm−1. Although the 2042 cm−1 feature vanished first with increasing temperature, the bands at 2075 cm−1 and 2000 cm−1 seemed to be more stable. It is furthermore important to note that, concomitant with the disappearance of the 2042 cm−1 band at 100 °C, the reaction rate increased steeply. Above 100 °C, the conversion observed for reduced RuO2@TiO2 overtook the one for RuO2@TiO2 and remained higher than the one for RuO2@TiO2 over the entire temperature range. At high temperatures, the gas-phase bands of CO and CO2 seemed to become negative. This is due to IR emission of the heated gas layer above the catalyst.
Figure 4 depicts DRIFT spectra of RuO2@TiO2 during cooling from 260 °C (cf. Figure 3A) to room temperature under an oxidizing (2% O2/2% CO/96% Ar) reaction feed. Interestingly, below 160 °C the spectra showed the same low wavenumber bands previously associated with partial reduction of RuO2@TiO2 (cf. Figure 2B), albeit to a lesser degree. This suggests that a partial reduction of the RuO2 surface is observed, even under an oxidizing reaction feed. Further implications of this finding are discussed in the Section 3.
Figure 5 summarizes the operando DRIFTS experiments of RuO2@TiO2 and reduced RuO2@TiO2 during the CO oxidation reaction under reducing conditions (1% O2/4% CO/95% Ar) when increasing the reaction temperature from 20 °C to 260 °C together with corresponding CO conversion data. In DRIFTS of RuO2@TiO2 (Figure 5A), there was again only a single band at 2077 cm−1 observed at low temperatures. This spectral feature remained unchanged up to 140 °C, when two additional bands appeared at 2025 cm−1 and 2134 cm−1. The conversion under reducing reaction conditions (Figure 5B) behaved like that under oxidizing reaction conditions (Figure 3B), with conversion increasing up to 140 °C, followed by a plateau till 210 °C. At this temperature, the band at 2040 cm−1 re-emerged, concomitant with a steep increase in the conversion.
With a further increase in the temperature, the 2040 cm−1 band diminished and merged with the 2025 cm−1 signal. At 260 °C, only bands at 2134 cm−1, 2075 cm−1, and 2025 cm−1 could be discerned clearly, with the latter being the most prominent one. Different from RuO2@TiO2 under oxidizing conditions, here a clear correlation between the partial reduction of the catalyst and an increase in activity was observed.
For DRIFTS of reduced RuO2@TiO2 under reducing reaction conditions (Figure 5C), the bands of adsorbed CO initially looked like those observed under oxidizing reaction conditions (Figure 3C). However, with increasing temperature, the high and low wavenumber shoulders of the 2040 cm−1 signal became more pronounced. Here, the 2040 cm−1 did not vanish above 100 °C. Instead, it remained clearly visible up to 200 °C, where it started to diminish. Note that for RuO2@TiO2 and reduced RuO2@TiO2 the spectra at 260 °C started to look very similar. The CO conversion of reduced RuO2@TiO2 under reducing conditions was markedly higher than that of RuO2@TiO2 throughout the entire temperature region.
Conversion plots and DRIFT spectra for a second heating ramp are summarized in Figure 6. The spectra were recorded after the catalyst was cooled back to room temperature. For both reducing and oxidizing reaction conditions, the DRIFT spectra looked similar regardless of the initial state of the catalyst. For reducing conditions, both samples exhibited bands at ca. 2135 cm−1, 2060 cm−1, and 2000 cm−1, with almost identical shape and intensity (cf. Figure 6B, green spectra), which were characteristic for the partial reduction of the catalyst. For oxidizing conditions, the main band was 2077 cm−1 (cf. Figure 6B, blue spectra), but additionally, some weak signals were observed reaching down to 2000 cm−1, as also seen in Figure 4. The conversion curves converged as well for the second heating ramp for all samples only depending on the gas feed composition. For reducing conditions, the conversion curves (Figure 6A) were practically identical. The only difference with respect to the first heating ramp of reduced RuO2@TiO2 (shown in grey) is that the conversion was slightly lower throughout the temperature range and the conversion during the second heat-up of RuO2@TiO2 still exhibited hints of the high temperature conversion plateau.
For oxidizing conditions (Figure 6C), the differences in the conversion curves were more profound between the first and second heat ramps. The conversion plateau of the second heating ramp was markedly reduced relative to the first heat-up, signifying a clear correlation between activity and the presence of low wavenumber signals. However, the conversion curves for the second heat-up for both RuO2@TiO2 and reduced RuO2@TiO2 were practically identical and depended only on the reaction conditions. Overall, we can conclude from Figure 6 that the catalyst adapted dynamically to the same active phase regardless of whether it started from the oxidized or the reduced sample, but of course depending on the reaction environment.

3. Discussion

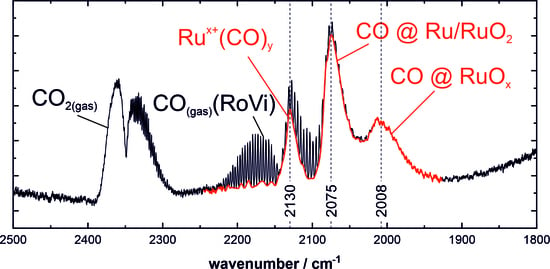
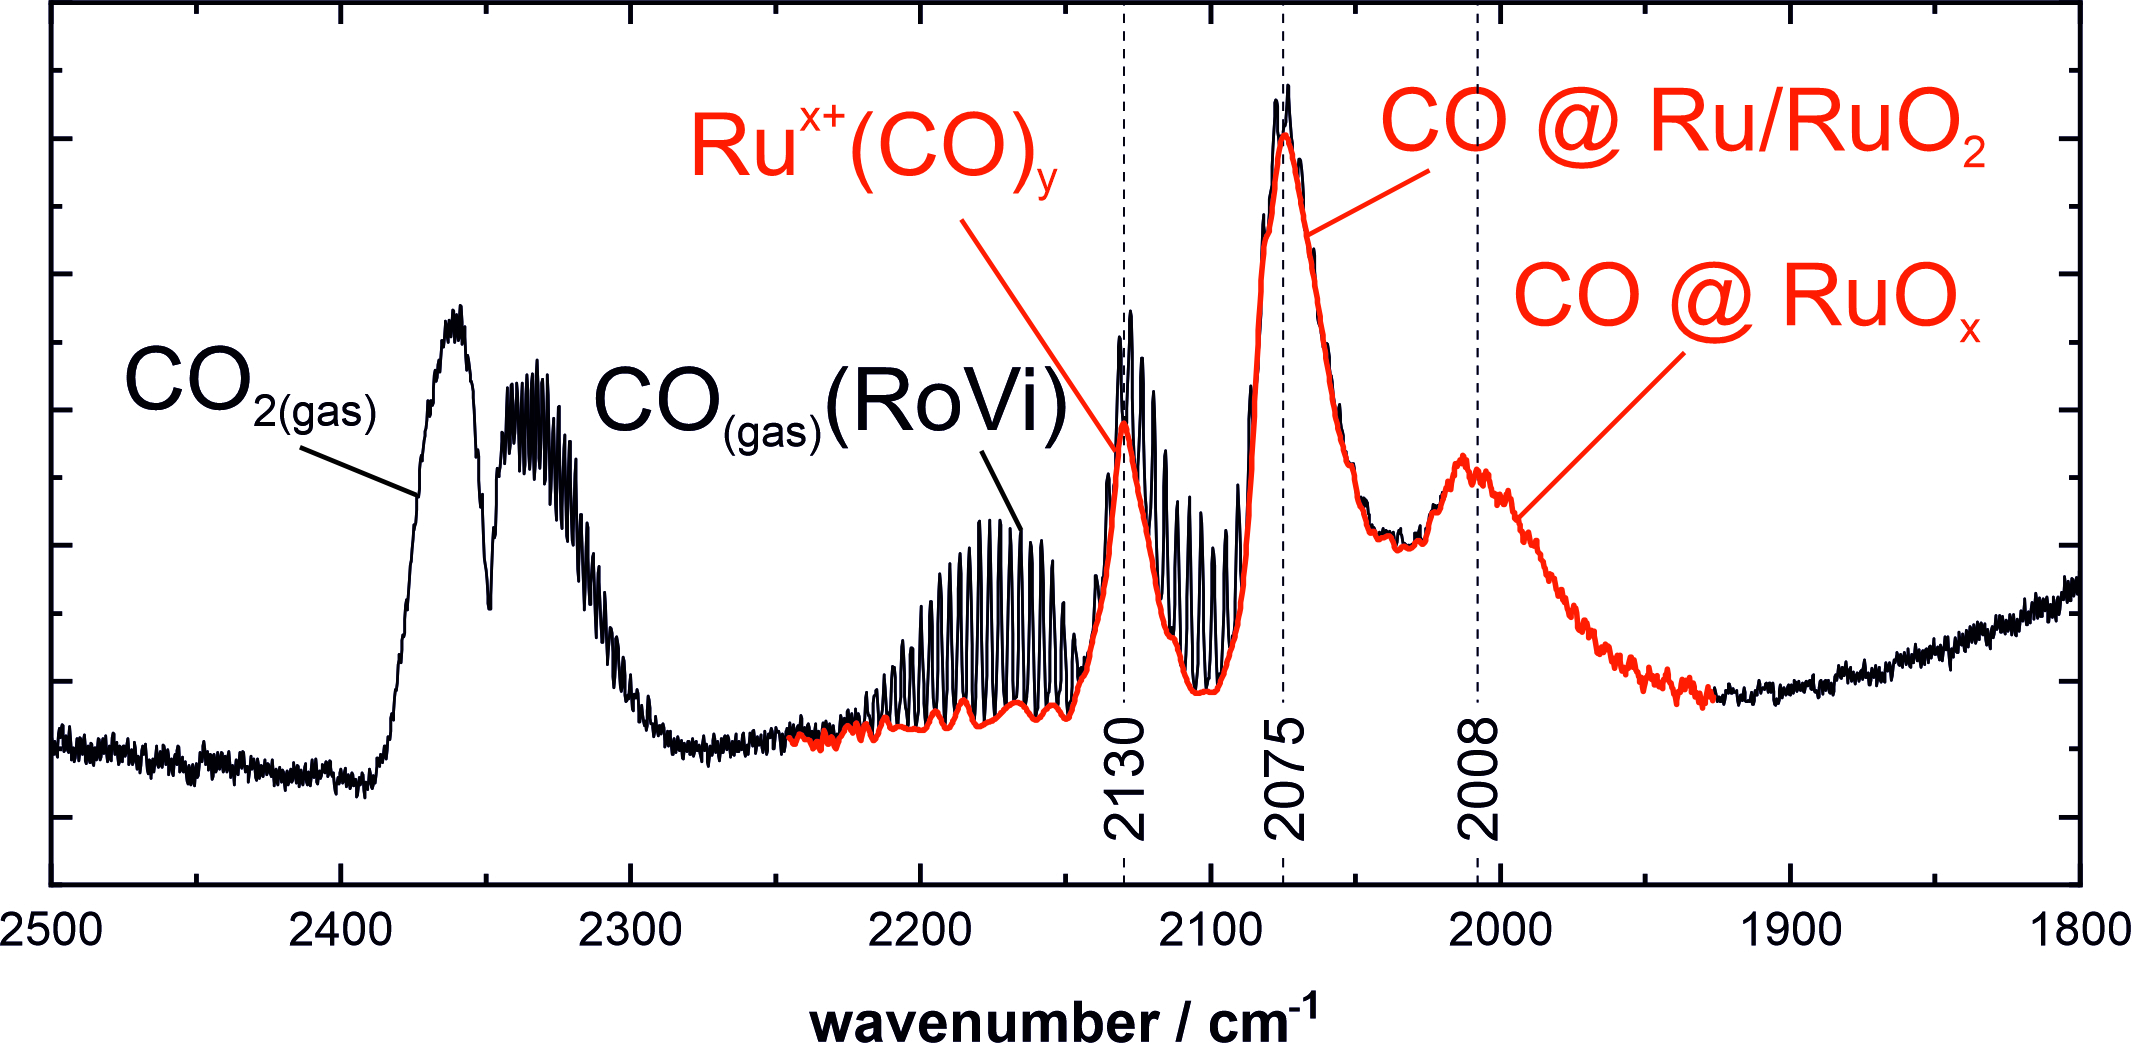
3.1. Stretching Vibrations of Adsorbed CO Probing the Actual Surface Oxidation State of RuO2

Table 1 summarizes stretching modes of adsorbed CO for various Ru-based catalysts reported in the literature. We note that the assignment of the band positions to specific adsorption sites vary sometimes between different publications. This is likely due to exact band positions being dependent on many factors, such as coverage of CO and O, as well as the oxidation state of the adsorption site. A few general trends can, however, be identified. RuO2 bands below 2000 cm−1 are assigned to CO on bridge positions, whereas those above 2000 cm−1 are ascribed to on-top CO. Here, a bridge position means CO being adsorbed to two adjacent Ru atoms, whereas on-top means CO on a single Ru atom. Infrared bands between 2000 and 2050 cm−1 were mainly observed for reduced RuO2 or supposedly metallic samples. Note that Peden et al. [30], who assigned the band at 2040 cm−1 to metallic Ru, exposed the sample to strongly oxidizing conditions before the measurement. Bands in the region of 2050–2100 cm−1 are assigned to both RuO2 and metallic Ru. Bands above 2100 cm−1 are assigned to Rux+(CO)y, which is linked to partial reduction of RuO2 or to CO on fully O covered RuO2(110) surfaces in some single-crystal studies.
The CO adsorption on RuO2@TiO2 and Ru0 + TiO2 at 20 °C resulted in one distinct DRIFT signal at around 2060 cm−1. Although the band position was slightly different between the two catalysts, it varied more substantially due to coverage effects and the occupancy of bridge positions by oxygen. Accordingly, this spectral feature alone was insufficient for characterization of the chemical state of the catalyst. It is quite surprising that only one single band was observed, as there are many different facets and adsorption sites expected to be present on the particle surfaces. The presence of only one symmetrical band in DRIFTS points toward efficient dipole–dipole coupling of the vibrational modes of all the different sites next to each other. This coupling was previously reported for RAIRS of CO on mildly reduced RuO2(110) [31].
When RuO2@TiO2 and Ru0 + TiO2 were exposed to a reducing reaction feed (1% O2/4% CO/95% Ar) at 300 °C, the samples were partially reduced and partially oxidized, respectively, as revealed in XP spectra (cf. Figure 1). This state of partial reduction of RuO2@TiO2 or partial oxidation of Ru0 + TiO2 was also corroborated by a dedicated DRIFTS signal at ca. 2000 cm−1 for both samples (cf. Figure 2). Additionally, a mid-wavenumber signal around 2040 cm−1 appeared for the reduced RuO2@TiO2 catalyst. This species was only visible as a shoulder in Figure 2B but, however, turned into an individual band when RuO2 was reduced with 4% CO, as seen in the DRIFT spectra recorded at 20 °C in Figure 3C and Figure 5C. Furthermore, a DRIFTS signal at 2135 cm−1 was discerned for reduced RuO2@TiO2, which can likely be attributed to a Ru-carbonyl species due to reduction induced roughening of the catalyst.

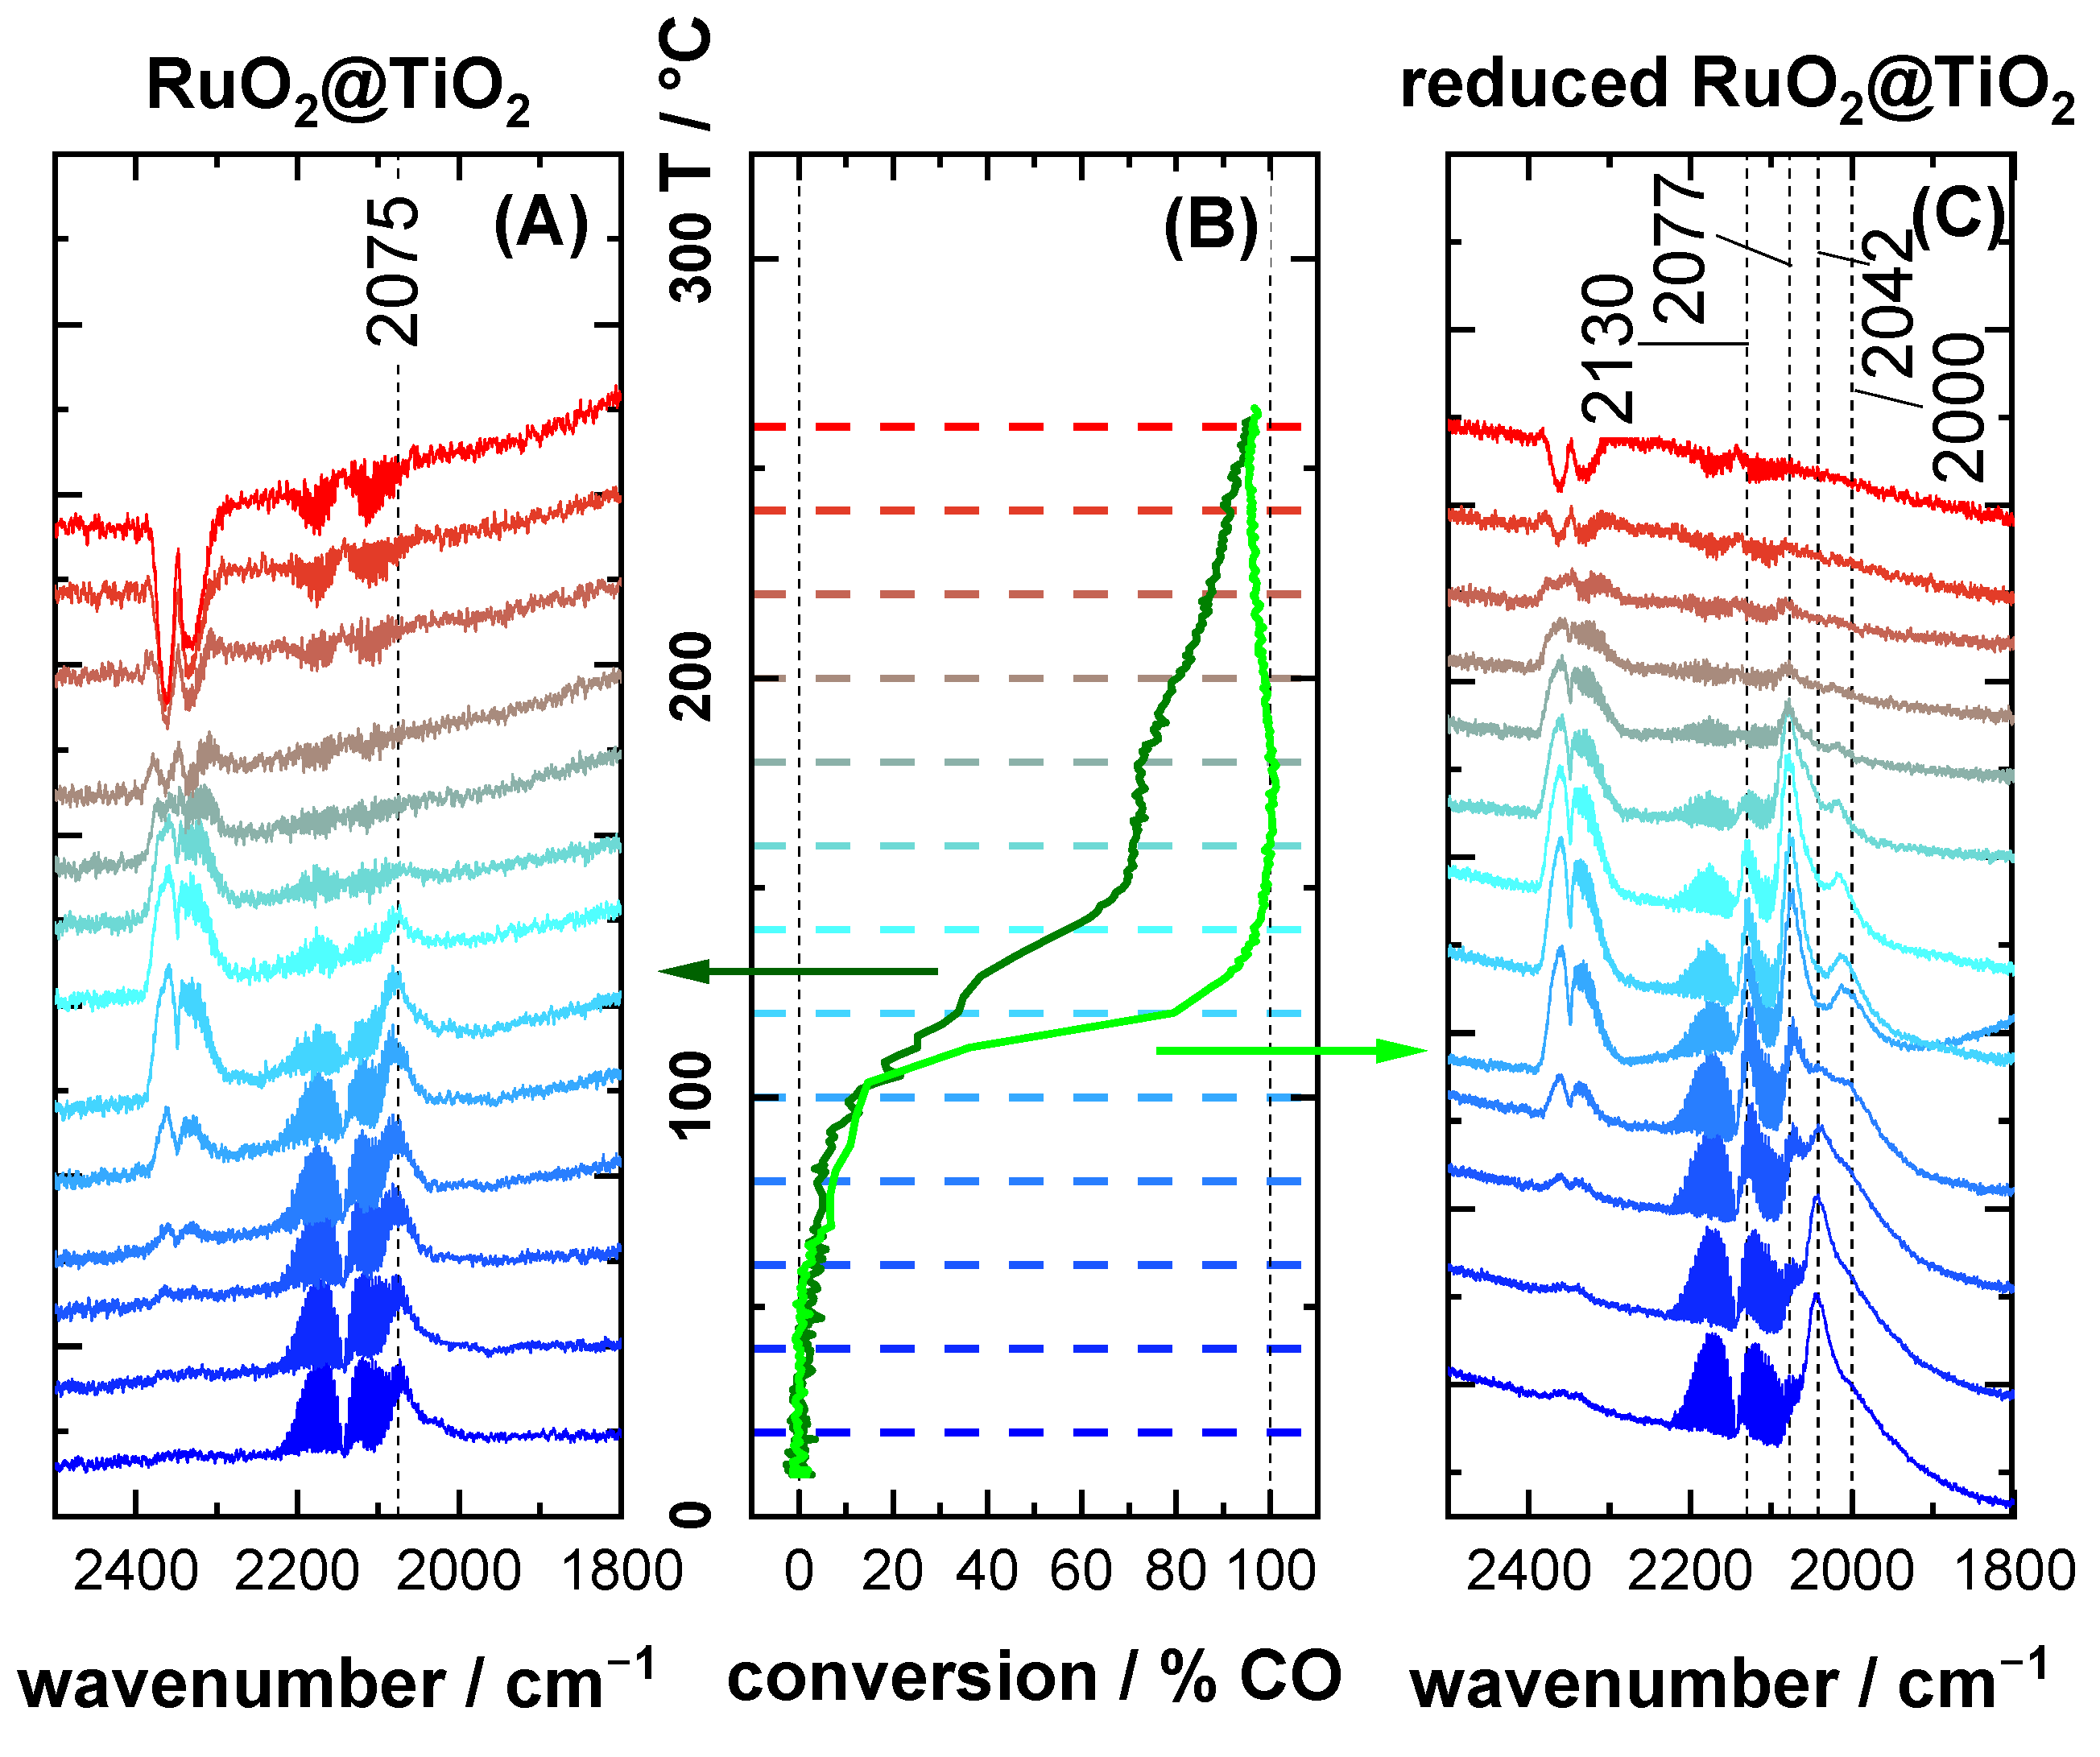
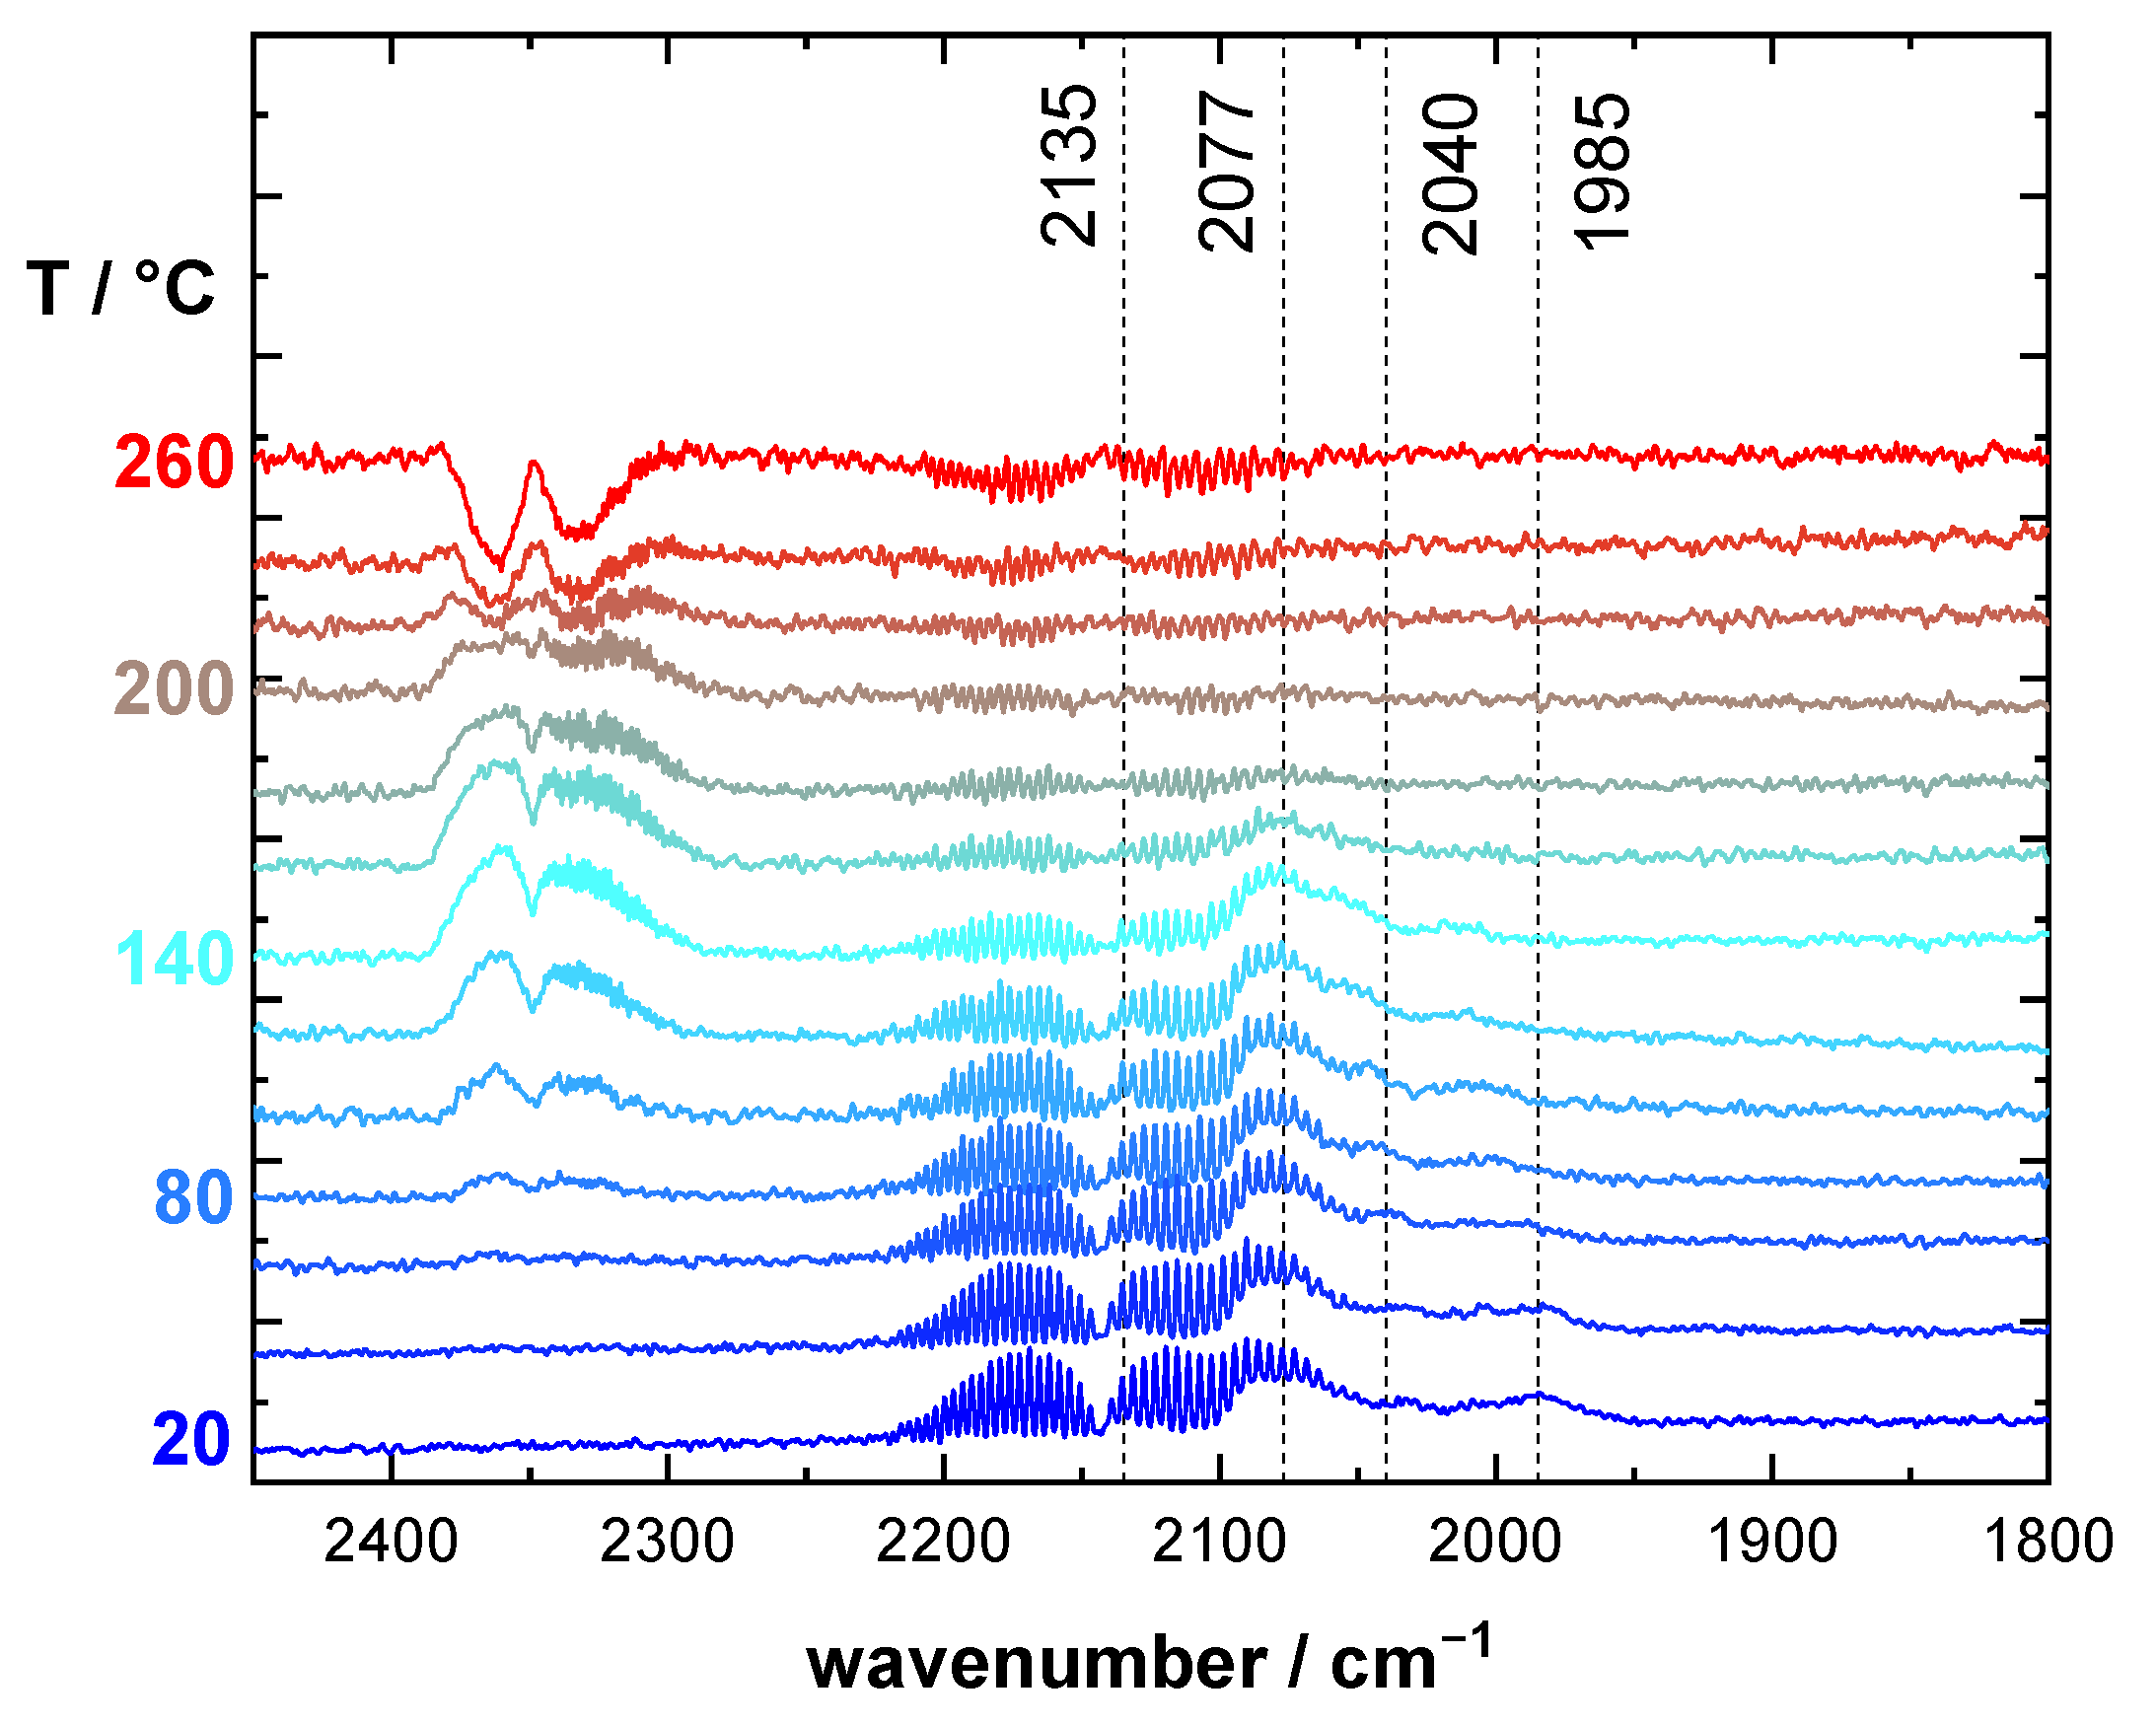
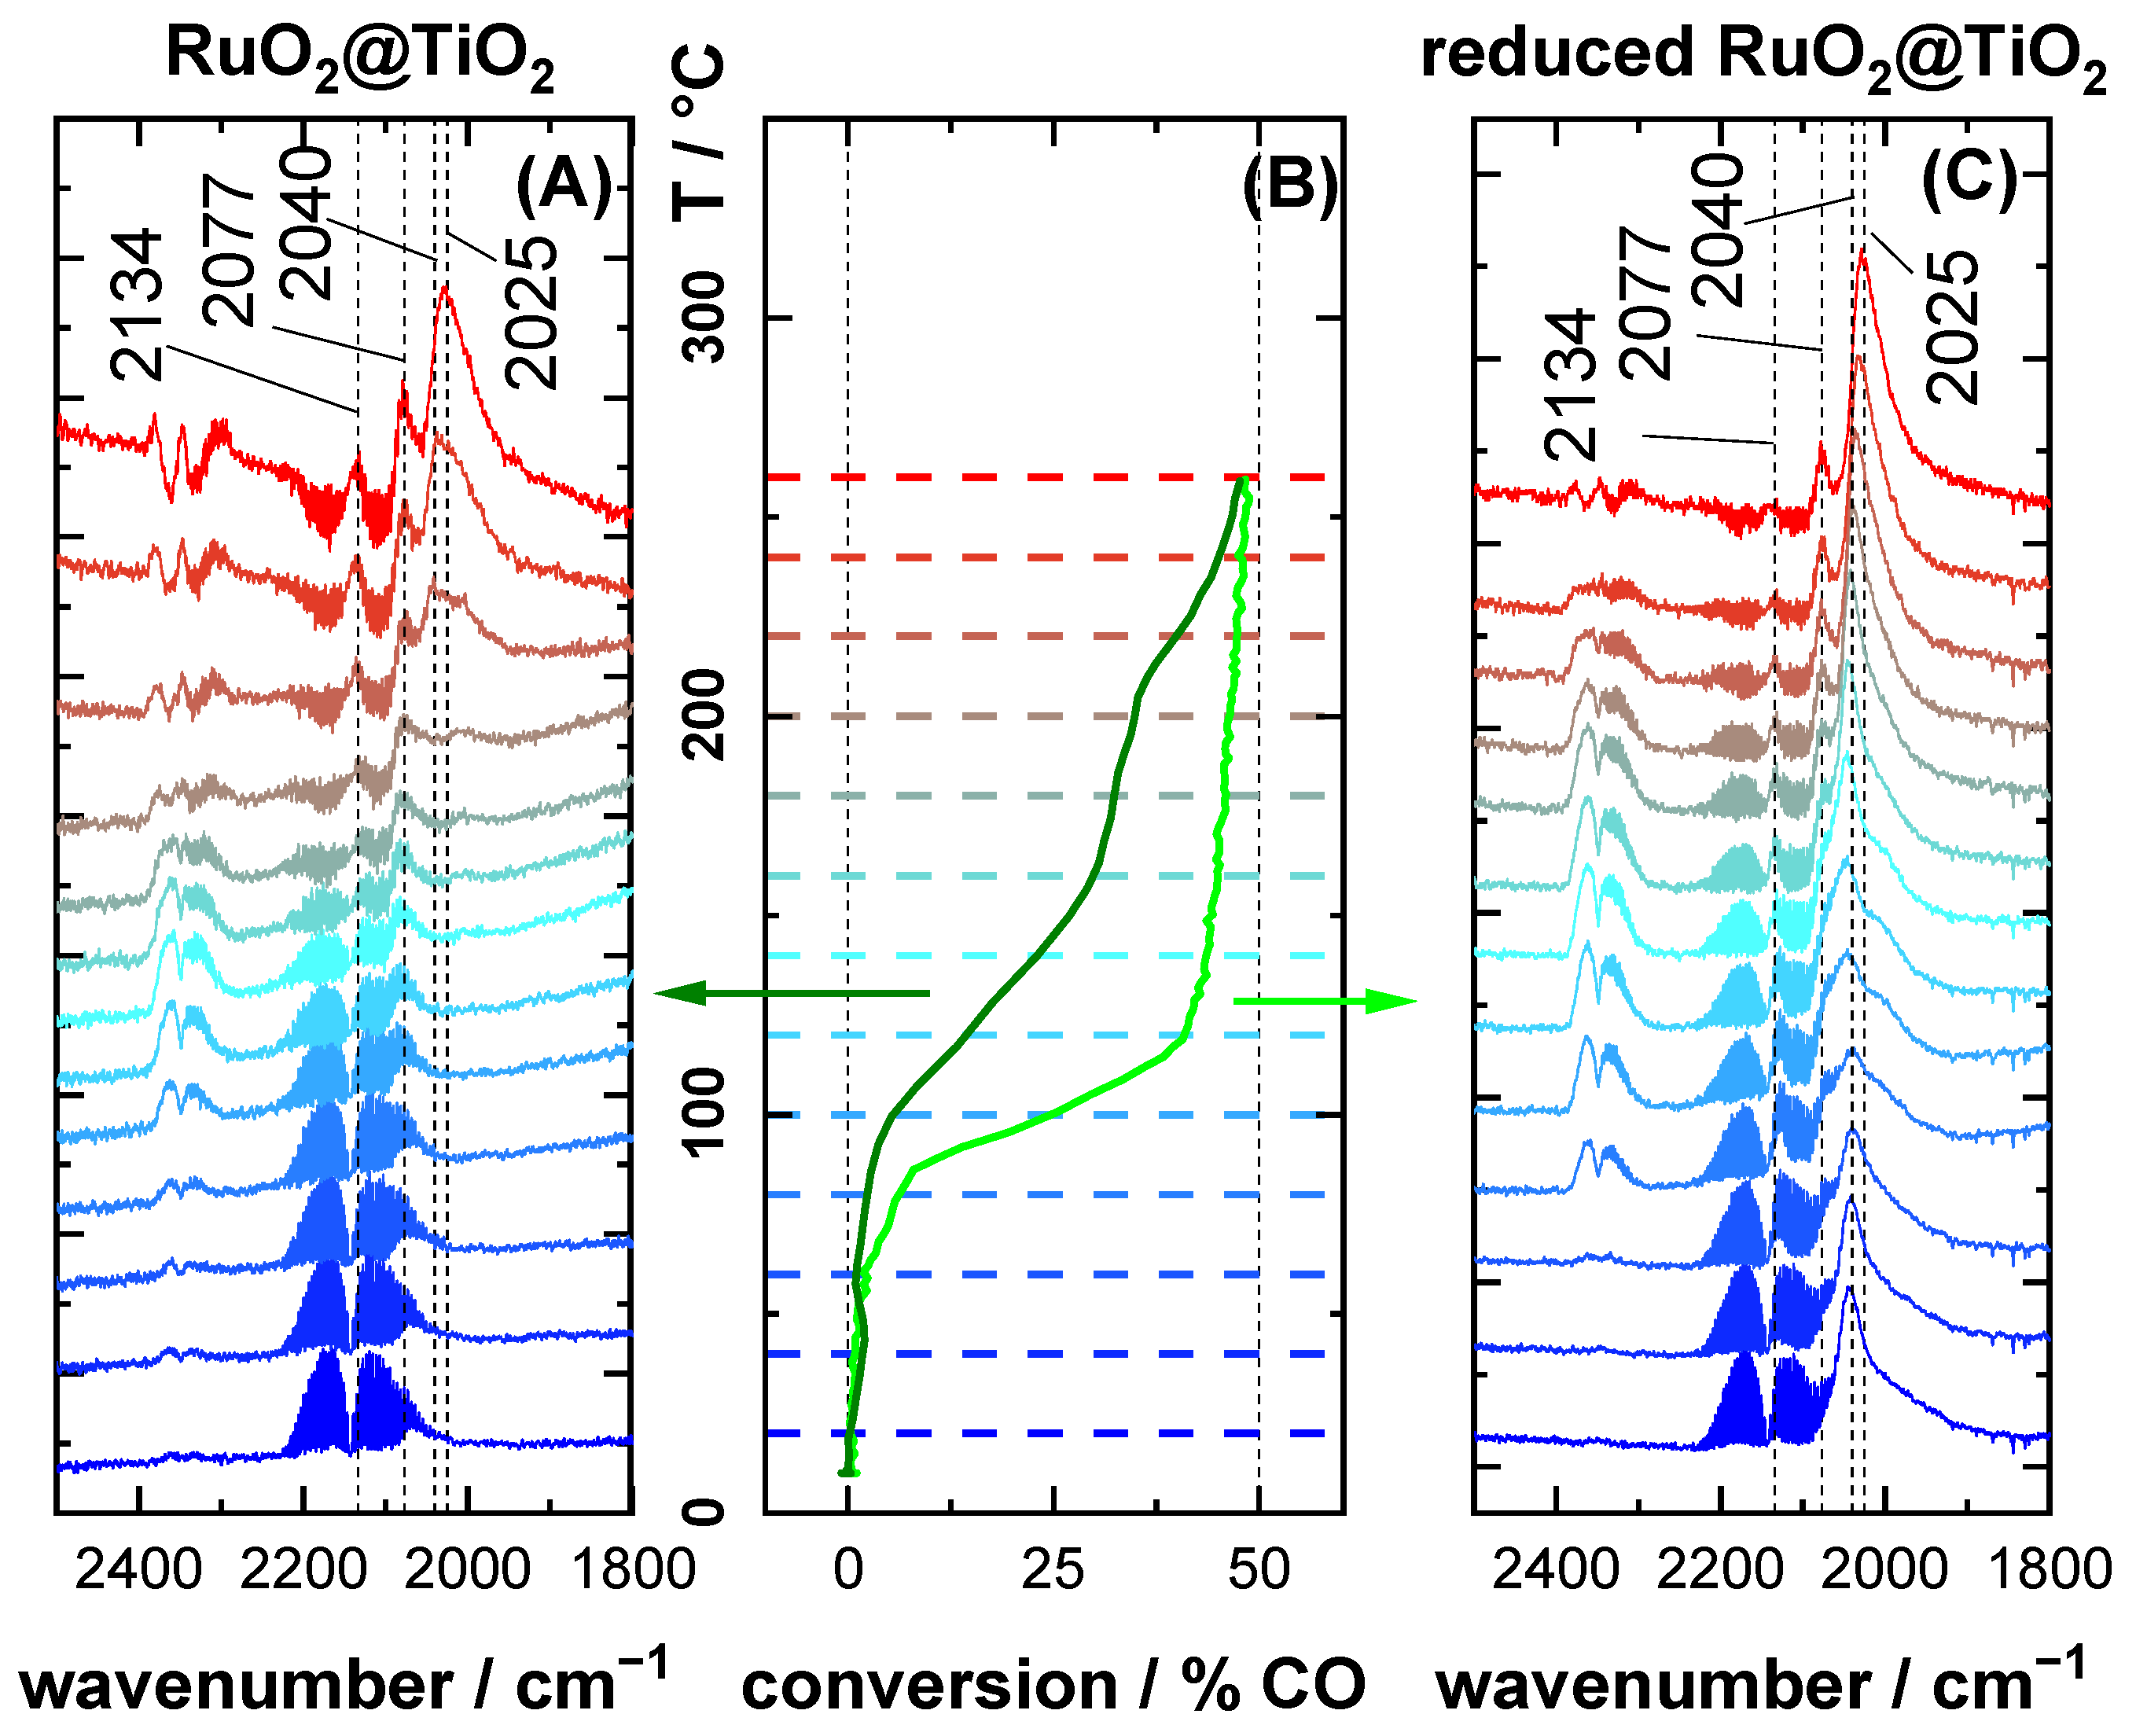
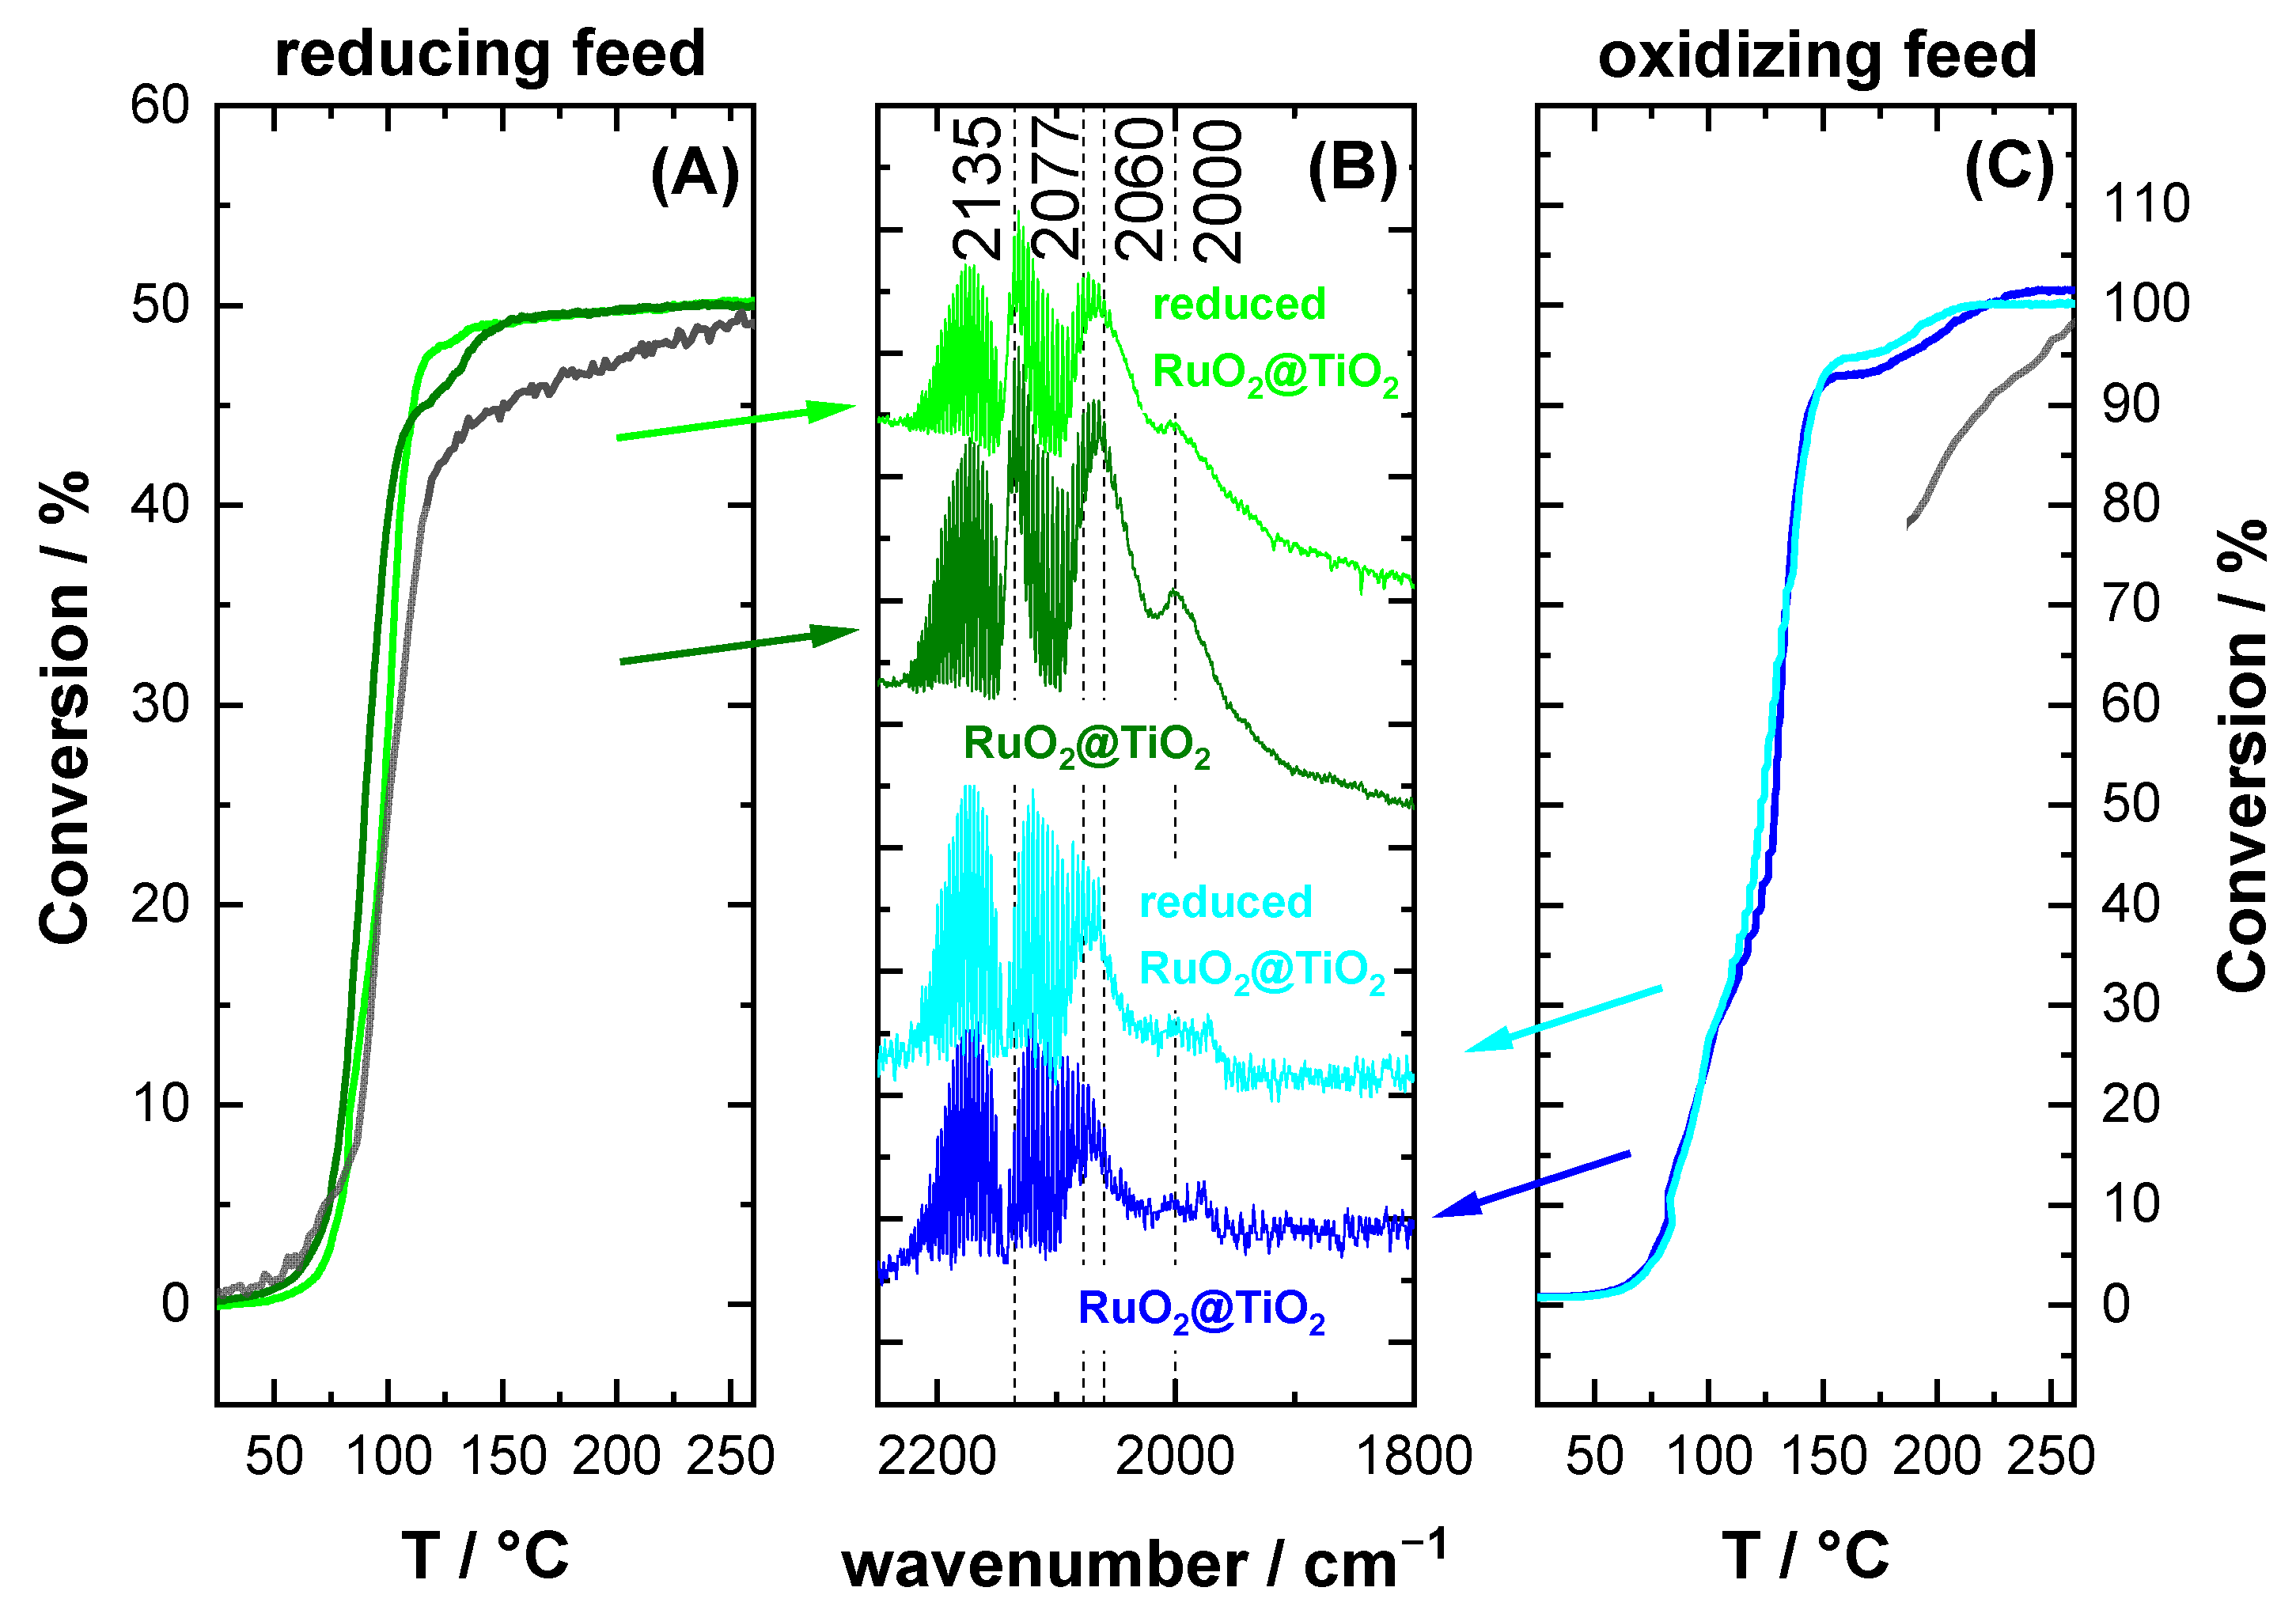
3.2. CO Oxidation as Case Study

The active phase of Ru-based catalysts in the CO oxidation reaction has been controversially debated over the last two decades. Broadly speaking, there are three interpretations of what constitutes the most active phase: (1) a metal surface with chemisorbed O reacting with CO without oxidizing the Ru itself [15,39,40,41], (2) an oxide surface with CO binding to coordinatively unsaturated Ru sites (Rucus) and reacting with adjacent bridging oxygen [31,36,42,43,44], and (3) a sub-stoichiometric RuOx or mixture of phases. We elaborate on these different views on the active phase in the following sections.
Various UHV studies reported either metal or oxide to be the most active phase. On the one hand, Goodman and coworkers claimed to have identified metallic Ru as the active phase. This determination conflicts, however, with studies demonstrating that at low O coverages oxygen binds too strongly and at high O coverages CO binds too weakly [3,16,45], rendering metallic Ru inactive according to the Sabatier principle. This view is supported by the experiments of Narloch et al. [46], wherein CO desorbed from a mixed CO-O phase on Ru(0001) without forming CO2. In addition, it is important to note that in the study of Gao et al. [3], no structural information of the active phase was provided except for post-reaction Auger electron spectroscopy (AES) (coverage of oxygen was found to be close to one monolayer). We note that AES characterization was carried out after heating the sample to desorb residual CO from the surface. This procedure may have reduced any potentially present surface oxide.
On the other hand, RuO2 has been favored as the active phase in CO oxidation by various other studies [31,36,42,43,44]. Gao et al. argued that RuO2 is not active in catalytic CO oxidation due to its high adsorption energy for CO, leading to poisoning by CO [3] and an expected reaction order of –1 in CO. Meanwhile, this conclusion was disproven by Martynova et al. [47], who determined the reaction orders for CO oxidation over RuO2(110) to be +1 for CO and zero for O2. A reaction order of +1 in CO is compatible with a previous study of Seitsonen et al. [48], who found not only strongly but also weakly adsorbed CO on RuO2(110).
So far, we have considered results for single-crystal surfaces without considering defects like steps or edges. On powder catalysts, the abundance of steps, edges, and corners may provide sites with more favorable adsorption energies for both O and CO, as demonstrated by Kim et al. [49] and Šljivančanin et al. [50]. The importance of defects for Ru-catalyzed CO oxidation has already been discussed by Gao et al.: Defects may overcome unfavorable adsorption energies of Ru(0001) [3].
Let us now discuss the third option of multiple phases in coexistence. One motive of such a multi-phase system, discussed in the literature and often linked to increased activity, consists of an ultrathin layer of RuO2 or sub-stoichiometric RuOx over Ru-metal [16,47,51,52,53]. Martynova et al. [47] demonstrated that the activity of Ru(0001) increased substantially when a surface oxide layer of 1–7 ML grew and that its activity was even higher when this surface oxide was disordered.
Another motive discussed in the literature is that of oxide and reduced oxides or even metallic phases coexisting on the surface [42,47,54,55]. Blume et al. [55] identified with XPS microscopy that oxidized RuO2 and reduced RuOx areas coexist on Ru(0001) during CO oxidation. They correlated the coexistence of both phases with increased activity. Martynova et al. [47] demonstrated that Ru(0001) formed a surface oxide in coexistence with an oxygen adsorption phase on Ru(0001) when exposed to 10−4 mbar O2 at 300–400 °C and connected the increase in activity to an expansion of the oxide phase. Therefore, it seems unlikely that RuO2 or Ru surfaces stay in their fully oxidic or metallic state, respectively, when exposed to reaction conditions.
Overall, it can be summarized that the presence of multiple phases of RuO2 and Ru has been linked to higher activity of the catalyst. Some of these phases may only be present under reaction conditions or in small fractions. As such, they could easily be missed, especially in non-operando measurements. This may also explain the controversial discussion in the literature about the active phase of Ru/RuO2 in the CO oxidation. How multiple phases correlate to increased activity is, however, still unclear. According to the literature, it could be a core shell structure with a thin oxide layer on top of a metal core, a sub-stoichiometric RuOx, or coexistence of these phases. In UHV studies, the reduction of RuO2(110) and RuO2(100) has shown to not lead to sub-stoichiometric RuOx phases. Instead, the RuO2 decomposes into RuO2 and Ru (with adsorbed oxygen) patches under reducing reaction conditions [56].
Due to the dynamic behavior of the catalyst (cf. also discussion of Figure 6) depending on the applied gas composition, it is paramount to conduct operando spectroscopic experiments with supported powder catalysts. In this study, we investigated RuO2 supported on rutile TiO2 in a flow reactor cell adapted to a DRIFTS spectrometer. We found that RuO2@TiO2 and reduced RuO2@TiO2 revealed significant differences in activity when exposed to various CO oxidation reaction conditions (cf. Figure 3B and Figure 5B). Regardless of the CO oxidation reaction conditions being reducing or oxidizing, reduced RuO2@TiO2 turned out to be always significantly more active than RuO2@TiO2.
Under oxidizing conditions, both samples (RuO2@TiO2 and reduced RuO2@TiO2) were similarly active at low temperatures, but at 100 °C the conversion on reduced-RuO2@TiO2 increased steeply and remained higher than that of RuO2@TiO2. It is important to note that the conversion for RuO2@TiO2 reached a plateau from 150 °C up to 180 °C and then increased again. Taking into consideration that a chemical reduction of RuO2@TiO2 can occur even under oxidizing reaction conditions (cf. Figure 4), the increased conversion above 180 °C is correlated with the reduction of RuO2@TiO2. This interpretation is supported by the fact that 180 °C is also the temperature at which reduction of RuO2@TiO2 under reducing reaction conditions sets in (cf. Figure 5A).
The activity behavior of the samples was quite similar under reducing conditions. Above 60 °C, reduced RuO2@TiO2 revealed higher conversions than RuO2@TiO2 throughout the entire temperature range. Although the conversion of RuO2@TiO2 did not exhibit a plateau, it only increased slightly in the temperature region of 160–200 °C. In this temperature region, a slight reduction of RuO2@TiO2 was observed in DRIFTS. For even higher temperatures, DRIFT spectra evidenced pronounced reduction concomitantly with an increase in CO conversion, thus again correlating chemical reduction of RuO2@TiO2 with an increase in activity.
Gao et al. [3] proposed that the interaction between Ru metal and RuO2 may play an important role in CO oxidation on RuO2. Farkas et al. [31,36] and Blume et al. [55] reported on a surface-phase separation into oxygen-rich and -depleted areas occurring on RuO2 during CO oxidation, with the latter being the phase of enhanced activity. The increased activity of the partially reduced RuO2 surface may even suggest bifunctionality such as that discussed for PdO. Weaver et al. [5] argued that on partially reduced PdO, CO oxidation is most favorable on the metal Pd surface, which is supplied with O from surrounding PdO. The bifunctionality of partially reduced RuO2 would also be in line with the mechanistic arguments regarding too strong or too weak adsorption for CO and O on Ru and RuO2. Boundary regions may offer adsorption sites with intermediary adsorption energies, which would be favorable for CO oxidation, according to the Sabatier principle.
The adsorbed CO species resulting in the 2040 cm−1 band in DRIFTS seemed to be especially active. On the reduced catalyst, this species reacted off at ca. 100 °C under oxidizing conditions, leaving the high- and low-frequency bands in DRIFTS, which were consumed only above 200 °C (cf. Figure 3C). Under reducing conditions, the same species was observed in conjunction with an activity increase for RuO2@TiO2 at 200 °C; this CO species remained observable since excess CO was present in the gas phase. Under reducing conditions, the 2040 cm−1 band was preserved up to 220 °C on reduced RuO2@TiO2 in conjunction with the sample showing significantly higher activity than its oxidized counterpart (cf. Figure 5A,C). In both cases (RuO2@TiO2 and reduced-RuO2@TiO2), the band was consumed at temperatures above 220 °C. The fact that the 2040 cm−1 CO species was stable up to 200 °C under reducing conditions further corroborates that its disappearance at 100 °C under oxidizing conditions cannot have been due to desorption but actually was caused by a higher reactivity of this species. The reappearance of the 2040 cm−1 band when the samples were cooled under reducing conditions (Figure S4) demonstrates that the corresponding sites remained present on the catalyst. A possible assignment of this band is that of CO adsorbed in the boundary regions between surface phases, most likely metallic Ru (with adsorbed O) and RuO2. This would also explain the absence of this band on partially oxidized Ru0 + TiO2 (cf. Figure 2B), as here no RuO2 may be present.
An interesting observation about the low wavenumber band is its variable position (between 1985 cm−1 and 2010 cm−1) and asymmetric shape, whereas the position of the other bands in DRIFTS remained largely constant. This suggests that this band comprised CO species at various adsorption sites whose contributions changed depending on the chemical state of the catalyst. This interpretation would be in line with a varying composition of reduced RuO2, as it is further reduced or re-oxidized. This behavior was especially apparent for reduced RuO2@TiO2 under oxidizing conditions between 120 and 180 °C. Here, the low wavenumber band shifted to higher wavenumbers and became more symmetric with higher reaction temperature (cf. Figure 3C) as the surface oxidized and approached the fully oxidized RuO2.
Based on this discussion, we propose the following assignment of bands for partially reduced RuO2 under CO oxidation conditions:
I.
1985–2030 cm−1: CO on partially reduced RuO2 with shape and position changing according to surface composition
II.
2040 cm−1: CO sitting possibly in boundary region between surface phases with the highest activity.
III.
2075 cm−1: CO on oxide RuO2
IV.
2135 cm−1: carbonyl Rux+(CO)y, which can form on highly under-coordinated Rux+ sites. Reduced RuO2 has been demonstrated to roughen [54,56], which would provide such under-coordinated Rux+ at the edges and corners [3].
Actually, very similar bands were reported by Gao et al. [3] when exposing Ru(0001) and RuO2(110) to oxidizing and reducing reaction conditions, respectively, at 50 Torr and 500 K. For Ru(0001) under oxidizing conditions (O2/CO = 5/1), at first no bands were observed; after 1–1.5 h bands at 2130, 2080, and 2040 cm−1 appeared; and finally, after 2.5 h a single band at 2080 cm−1 remained. This experiment is consistent with the surface going through partial oxidation and finally arriving at an oxide surface, according to our interpretation of the bands. Conversely, for RuO2(110) under reducing conditions (O2/CO = 1/10) the 2080 cm−1 band was dominant at first. After 5 min of reduction the RAIR spectrum showed a weak low wavenumber shoulder and the 2130 cm−1 band. During the next 6 h of reaction time, bands at 2050 and 2020 cm−1 increased in intensity with the 2080 cm−1 band diminishing. Altogether, these RAIRS data [3] on single-crystalline surfaces of Ru/RuO2 are in reasonable agreement with our DRIFTS experiments of Ru-based powder catalysts supported on rutile TiO2.

4. Experimental Details

4.1. Sample Preparation and Characterization

For DRIFTS experiments, we prepared RuO2 supported on rutile TiO2 (RuO2@TiO2) by a modified Pechini synthesis, as described in detail by Khalid et al. [57]. This ensured an even dispersion of the catalytically active oxides, which absorb IR radiation, on the reflective TiO2 matrix. The BET surface area of the used support was 20 m2·g−1, with a mean particle size of 100 nm. Another advantage of this type of preparation is the better comparability of DRIFTS results with the kinetic data of previous work. The RuO2@TiO2 samples were thoroughly characterized by transmission electron microscopy (TEM), X-ray diffraction (XRD), and Raman spectroscopy in a previous study [57].
Two types of samples studied were oxidized and reduced samples of 2 mol% supported RuO2. Two mol% RuO2 on 20 m2/g TiO2 corresponds to an average thickness of 0.24 nm. Since RuO2 is known to grow on TiO2 with a thickness of no less than 3 monolayers or 1.5 nm [58], this corresponds to a surface coverage of maximally 16%. The samples obtained from the Pechini synthesis were first thermally oxidized or reduced by applying O2 or CO at 300 °C. Although the supported RuO2 could not be identified definitively by TEM micrographs, they showed no morphological differences between the oxidized and reduced samples (cf. Figure S5). These samples are referred to as RuO2@TiO2 and reduced RuO2@TiO2, respectively, and are characterized by X-ray photoelectron spectroscopy (XPS). For XPS analysis, a PHI VersaProbe II instrument was used. The data were recorded employing a photon energy of 1486.6 eV (Al Kα line).
DRIFT spectra of purely metallic Ru and purely oxidic RuO2 samples were employed as references to assign the DRIFTS CO bands of RuO2@TiO2 under reaction conditions. Full reduction of our RuO2 samples did not seem to be possible, as can be seen in Figure S1. To obtain the CO adsorption signals of pure metallic samples, we therefore used 33 w% of commercially available Ru (chempur) metal powder mixed with TiO2. These samples were also reductively pretreated to remove any surface oxides that may have formed by applying 4% CO at 300 °C for 4 h. This sample is referred to as Ru0 + TiO2. After this treatment, XPS indicated pure metallic samples, as demonstrated in Figure 1.
Figure 1 also depicts XP spectra of RuO2@TiO2 and Ru0 + TiO2 after being exposed to a reducing reaction feed (4% CO/1% O2/95% Ar) at 300 °C. Quite surprisingly, the spectra of RuO2@TiO2 and Ru0 + TiO2 exhibited both oxide and metal Ru signals. The samples were therefore in a state of partial reduction/oxidation.

4.2. Reaction Conditions

The reactor setup was built in house, and the description of it can be found in a recent publication by our group [10]. It consists of a gas supply controlled by mass flow controllers, a custom designed rector cell made from 1.4742 Ni-free steel, and a mass spectrometer for gas analysis. To derive the conversion from MS data, the CO2 signal (m/z = 44) was normalized by its maximum value (at full conversion). Full consumption of O2 (for reducing conditions) or CO (for oxidizing conditions) was used to determine the point at which full conversion was achieved. For oxidizing conditions, some CO always remained in the MS spectrum due to the cracking pattern of CO2. In this case, full conversion was assumed when no further decrease in m/z = 28 and no further increase in m/z = 44 was observed with rising temperature.
Total flow for all experiments was 50 sccm, whereas the heating ramp was set as 1.8 K∙min−1. The gas compositions for the various experiments are compiled in Table 2. In order to minimize temperature changes induced by the reaction heat, by keeping the concentration of the reactants as small as possible, as well as due to limitations in the MFC flow range, the ratio of reactive gas to carrier gas had to be varied.

5. Conclusions

CO was employed as a probe molecule to study the actual oxidation state of a supported RuO2@TiO2 catalyst during the CO oxidation reaction. To do so, online mass spectrometry (MS) was coupled with operando diffuse reflectance infrared Fourier transform spectroscopy (DRIFTS). The CO DRIFT spectra of the pure oxide RuO2@TiO2 samples and the pure metal Ru0 + TiO2 were governed by a single mode at ca. 2060 cm−1. Partially reduced RuO2@TiO2, on the other hand, was characterized by four distinct band regions in DRIFTS at 2135, 2075, 2040, and 2000 cm−1. The combination of conversion (MS) and vibrational CO data (DRIFTS) revealed higher activity of reduced-RuO2@TiO2 than its oxidized counterpart both under reducing and oxidizing CO oxidation reaction conditions. The catalysts were shown to adopt the catalytically active phase dynamically to the reaction conditions independent of their initial state, only depending on the applied reaction mixture. Most surprisingly, even under oxidizing reaction conditions partial reduction of RuO2@TiO2 was encountered. The CO species at 2040 cm−1 in DRIFTS was shown to be especially reactive.

Supplementary Materials

The following supporting information can be downloaded at: https://www.mdpi.com/article/10.3390/catal13081178/s1, Table S1: XPS fit parameter; Figure S1: Ru 3d XP spectra of oxidized and reduced RuO2; Figure S2: DRIFTS spectrum of CO adsorption on Ru0+TiO2, which has after oxidative pretreatment under 4% O2 at 300 °C for 12h; Figure S3: IR spectra of pre-oxidized TiO2 heated in a CO atmosphere; Figure S4: Operando DRIFT spectra of reduced-RuO2@TiO2 during cool down under reducing (1% O2/4% CO/95% Ar) reaction feed composition; Figure S5: TEM micrographs of RuO2@TiO2 (left) before and (right) after reduction.

Author Contributions

Conceptualization, H.O. and P.T.; methodology, P.T.; XPS investigation, L.G. and T.W.; writing—original draft preparation, P.T. and H.O.; writing—review and editing, P.T., T.W., L.G. and H.O.; funding acquisition, H.O. All authors have read and agreed to the published version of the manuscript.

Funding

The research was funded by the Deutsche Forschungsgemeinschaft (DFG, German Research Foundation-493681475).

Data Availability Statement

The data used to support the findings of this study are included within the article.

Acknowledgments

P.T. and H.O. acknowledge financial support from the DFG (SPP2080—493681475).

Conflicts of Interest

The authors declare no conflict of interest.

References

  1. Schlögl, R. Heterogeneous Catalysis. Angew. Chem. Int. Ed. 2015, 54, 3465–3520. [Google Scholar] [CrossRef] [Green Version]
  2. Over, H.; Balmes, O.; Lundgren, E. Direct Comparison of the Reactivity of the Non-Oxidic Phase of Ru(0001) and the RuO2 Phase in the CO Oxidation Reaction. Surf. Sci. 2009, 603, 298–303. [Google Scholar] [CrossRef]
  3. Gao, F.; Goodman, D.W. CO Oxidation over Ruthenium: Identification of the Catalytically Active Phases at near-Atmospheric Pressures. Phys. Chem. Chem. Phys. 2012, 14, 6688–6697. [Google Scholar] [CrossRef] [PubMed]
  4. Zhang, F.; Pan, L.; Li, T.; Diulus, J.T.; Asthagiri, A.; Weaver, J.F. CO Oxidation on PdO(101) during Temperature-Programmed Reaction Spectroscopy: Role of Oxygen Vacancies. J. Phys. Chem. C 2014, 118, 28647–28661. [Google Scholar] [CrossRef]
  5. Weaver, J.F.; Choi, J.; Mehar, V.; Wu, C. Kinetic Coupling among Metal and Oxide Phases during CO Oxidation on Partially Reduced PdO(101): Influence of Gas-Phase Composition. ACS Catal. 2017, 7, 7319–7331. [Google Scholar] [CrossRef]
  6. Van Spronsen, M.A.; Frenken, J.W.M.; Groot, I.M.N. Surface Science under Reaction Conditions: CO Oxidation on Pt and Pd Model Catalysts. Chem. Soc. Rev. 2017, 46, 4347–4374. [Google Scholar] [CrossRef] [Green Version]
  7. Gustafson, J.; Balmes, O.; Zhang, C.; Shipilin, M.; Schaefer, A.; Hagman, B.; Merte, L.R.; Martin, N.M.; Carlsson, P.A.; Jankowski, M.; et al. The Role of Oxides in Catalytic CO Oxidation over Rhodium and Palladium. ACS Catal. 2018, 8, 4438–4445. [Google Scholar] [CrossRef]
  8. Martin, R.; Kim, M.; Lee, C.J.; Mehar, V.; Albertin, S.; Hejral, U.; Merte, L.R.; Asthagiri, A.; Weaver, J.F. Isothermal Reduction of IrO2(110) Films by Methane Investigated Using in Situ X-ray Photoelectron Spectroscopy. ACS Catal. 2021, 11, 5004–5016. [Google Scholar] [CrossRef]
  9. Abb, M.J.S.; Weber, T.; Langsdorf, D.; Koller, V.; Gericke, S.M.; Pfaff, S.; Busch, M.; Zetterberg, J.; Preobrajenski, A.; Grönbeck, H.; et al. Thermal Stability of Single-Crystalline IrO2(110) Layers: Spectroscopic and Adsorption Studies. J. Phys. Chem. C 2020, 124, 15324–15336. [Google Scholar] [CrossRef]
  10. Timmer, P.; Weber, T.; Glatthaar, L.; Over, H. Operando CO Infrared Spectroscopy and On-Line Mass Spectrometry for Studying the Active Phase of IrO2 in the Catalytic CO Oxidation Reaction. Inorganics 2023, 11, 102. [Google Scholar] [CrossRef]
  11. Weckhuysen, B.M. Determining the Active Site in a Catalytic Process: Operando Spectroscopy Is More than a Buzzword. Phys. Chem. Chem. Phys. 2003, 5, 4351–4360. [Google Scholar] [CrossRef]
  12. Grunwaldt, J.D.; Baiker, A. In Situ Spectroscopic Investigation of Heterogeneous Catalysts and Reaction Media at High Pressure. Phys. Chem. Chem. Phys. 2005, 7, 3526–3539. [Google Scholar] [CrossRef] [PubMed]
  13. Ryczkowski, J. IR Spectroscopy in Catalysis. Catal. Today 2001, 68, 263–381. [Google Scholar] [CrossRef]
  14. Over, H.; Kim, Y.D.; Seitsonen, A.P.; Wendt, S.; Leudgren, E.; Schmidt, M.; Varga, P.; Morgante, A.; Ertl, G. Atomic-Scale Structure and Catalytic Reactivity of the RuO2(110) Surface. Science 2000, 287, 1474–1476. [Google Scholar] [CrossRef] [PubMed] [Green Version]
  15. Goodman, D.W.; Peden, C.H.F.; Chen, M.S. CO Oxidation on Ruthenium: The Nature of the Active Catalytic Surface. Surf. Sci. 2007, 601, 18–20. [Google Scholar] [CrossRef]
  16. Over, H.; Muhler, M.; Seitsonen, A.P. Comment on “CO Oxidation on Ruthenium: The Nature of the Active Catalytic Surface” by D.W. Goodman, C.H.F. Peden, M.S. Chen. Surf. Sci. 2007, 601, 5659–5662. [Google Scholar] [CrossRef]
  17. Rosenthal, D.; Girgsdies, F.; Timpe, O.; Weinberg, G.; Schlögl, R. Oscillatory Behavior in the CO-Oxidation over Bulk Ruthenium Dioxide–The Effect of the CO/O2 Ratio. Z. Phys. Chem. 2011, 225, 57–68. [Google Scholar] [CrossRef] [Green Version]
  18. Seki, K. Development of RuO2/Rutile-TiO2 Catalyst for Industrial HCl Oxidation Process. Catal. Surv. Asia 2010, 14, 168–175. [Google Scholar] [CrossRef]
  19. Over, H.; Schomäcker, R. What Makes a Good Catalyst for the Deacon Process? ACS Catal. 2013, 3, 1034–1046. [Google Scholar] [CrossRef]
  20. Pérez-Ramírez, J.; Mondelli, C.; Schmidt, T.; Schlüter, O.F.K.; Wolf, A.; Mleczko, L.; Dreier, T. Sustainable Chlorine Recycling via Catalysed HCl Oxidation: From Fundamentals to Implementation. Energy Environ. Sci. 2011, 4, 4786–4799. [Google Scholar] [CrossRef]
  21. Over, H. Atomic Scale Insights into Electrochemical versus Gas Phase Oxidation of HCl over RuO2-Based Catalysts: A Comparative Review. Electrochim. Acta 2013, 93, 314–333. [Google Scholar] [CrossRef]
  22. Fabbri, E.; Habereder, A.; Waltar, K.; Kötz, R.; Schmidt, T.J. Developments and Perspectives of Oxide-Based Catalysts for the Oxygen Evolution Reaction. Catal. Sci. Technol. 2014, 4, 3800–3821. [Google Scholar] [CrossRef]
  23. Over, H. Fundamental Studies of Planar Single-Crystalline Oxide Model Electrodes (RuO2, IrO2) for Acidic Water Splitting. ACS Catal. 2021, 11, 8848–8871. [Google Scholar] [CrossRef]
  24. Drochner, A.; Fehlings, M.; Krauß, K.; Vogel, H. A New DRIFTS Cell for the In-Situ Investigation of Heterogeneously Catalyzed Reactions. Chem. Eng. Technol. 2000, 23, 319–322. [Google Scholar] [CrossRef]
  25. Meunier, F.C. Pitfalls and Benefits of: In Situ and Operando Diffuse Reflectance FT-IR Spectroscopy (DRIFTS) Applied to Catalytic Reactions. React. Chem. Eng. 2016, 1, 134–141. [Google Scholar] [CrossRef]
  26. Freund, H.J.; Meijer, G.; Scheffler, M.; Schlögl, R.; Wolf, M. CO Oxidation as a Prototypical Reaction for Heterogeneous Processes. Angew. Chem. Int. Ed. 2011, 50, 10064–10094. [Google Scholar] [CrossRef]
  27. Meunier, F.C. Relevance of IR Spectroscopy of Adsorbed CO for the Characterization of Heterogeneous Catalysts Containing Isolated Atoms. J. Phys. Chem. C 2021, 125, 21810–21823. [Google Scholar] [CrossRef]
  28. Zaera, F. Infrared Absorption Spectroscopy of Adsorbed CO: New Applications in Nanocatalysis for an Old Approach. ChemCatChem 2012, 4, 1525–1533. [Google Scholar] [CrossRef]
  29. Morgan, D.J. Resolving Ruthenium: XPS Studies of Common Ruthenium Materials. Surf. Interface Anal. 2015, 47, 1072–1079. [Google Scholar] [CrossRef]
  30. Peden, C.H.F.; Goodman, D.W.; Weisel, M.D.; Hoffmann, F.M. In-Situ FT-IRAS Study of the CO Oxidation Reaction over Ru(001). I. Evidence for an Eley-Rideal Mechanism at High Pressures? Surf. Sci. 1991, 253, 44–58. [Google Scholar] [CrossRef]
  31. Farkas, A.; Mellau, G.C.; Over, H. Novel Insight in the CO Oxidation on RuO2(110) by in Situ Reflection-Absorption Infrared Spectroscopy. J. Phys. Chem. C 2009, 113, 14341–14355. [Google Scholar] [CrossRef]
  32. Chin, S.Y.; Williams, C.T.; Amiridis, M.D. FTIR Studies of CO Adsorption on Al2O3- and SiO2-Supported Ru Catalysts. J. Phys. Chem. B 2006, 110, 871–882. [Google Scholar] [CrossRef]
  33. Binsted, N.; Evans, J.; Greaves, G.N.; Price, R.J. Characterization of Supported Rhodium and Ruthenium Carbonyl Clusters by EXAFS Spectroscopy. Organometallics 1989, 8, 613–620. [Google Scholar] [CrossRef]
  34. Bogdan, P.L.; Weitz, E. A Transient Infrared Spectroscopy Study of Coordinatively Unsaturated Ruthenium Carbonyls. J. Am. Chem. Soc. 1989, 111, 3163–3167. [Google Scholar] [CrossRef]
  35. Schiffer, A.; Jakob, P.; Menzel, D. The (2CO+O)(2×2)/Ru(001) Layer: Preparation, Characterization, and Analysis of Interaction Effects in Vibrational Spectra. Surf. Sci. 1997, 389, 116–130. [Google Scholar] [CrossRef]
  36. Farkas, A.; Hess, F.; Over, H. “First-Principles” Kinetic Monte Carlo Simulations Revisited: CO Oxidation over RuO2(110). J. Comput. Chem. 2011, 33, 757–766. [Google Scholar] [CrossRef]
  37. Kiss, J.T.; Gonzalez, R.D. Catalytic Oxidation of Carbon Monoxide over Ru/SiO2. An In Situ Infrared and Kinetic Study. J. Phys. Chem. 1984, 88, 892–897. [Google Scholar] [CrossRef]
  38. Assmann, J.; Narkhede, V.; Khodeir, L.; Löffler, E.; Hinrichsen, O.; Birkner, A.; Over, H.; Muhler, M. On the Nature of the Active State of Supported Ruthenium Catalysts Used for the Oxidation of Carbon Monoxide: Steady-State and Transient Kinetics Combined with in Situ Infrared Spectroscopy. J. Phys. Chem. B 2004, 108, 14634–14642. [Google Scholar] [CrossRef]
  39. Goodman, D.W.; Peden, C.H.F.; Chen, M.S. Reply to Comment on “CO Oxidation on Ruthenium: The Nature of the Active Catalytic Surface” by H. Over, M. Muhler, A.P. Seitsonen. Surf. Sci. 2007, 601, 5663–5665. [Google Scholar] [CrossRef]
  40. Gao, F.; Goodman, D.W. Reaction Kinetics and Polarization Modulation Infrared Reflection Absorption Spectroscopy Investigations of CO Oxidation over Planar Pt-Group Model Catalysts. Langmuir 2010, 26, 16540–16551. [Google Scholar] [CrossRef]
  41. Miller, B.K.; Crozier, P.A. Linking Changes in Reaction Kinetics and Atomic-Level Surface Structures on a Supported Ru Catalyst for CO Oxidation. ACS Catal. 2021, 11, 1456–1463. [Google Scholar] [CrossRef]
  42. Over, H.; Knapp, M.; Lundgren, E.; Seitsonen, A.P.; Schmid, M.; Varga, P. Visualization of Atomic Processes on Ruthenium Dioxide Using Scanning Tunneling Microscopy. ChemPhysChem 2004, 5, 167–174. [Google Scholar] [CrossRef] [PubMed]
  43. Over, H.; Balmes, O.; Lundgren, E. In Situ Structure-Activity Correlation Experiments of the Ruthenium Catalyzed CO Oxidation Reaction. Catal. Today 2009, 145, 236–242. [Google Scholar] [CrossRef]
  44. Hess, F.; Sack, C.; Langsdorf, D.; Over, H. Probing the Activity of Different Oxygen Species in the CO Oxidation over RuO2(110) by Combining Transient Reflection-Absorption Infrared Spectroscopy with Kinetic Monte Carlo Simulations. ACS Catal. 2017, 7, 8420–8428. [Google Scholar] [CrossRef]
  45. Madey, T.E.; Albert Engelhardt, H.; Menzel, D. Adsorption of Oxygen and Oxidation of CO on the Ruthenium (001) Surface. Surf. Sci. 1975, 48, 304–328. [Google Scholar] [CrossRef]
  46. Narloch, B.; Held, G.; Menzel, D. Structural Rearrangement by Coadsorption: A LEED IV Determination of the Ru(001)-p(2 × 2)(2O + CO) Structure. Surf. Sci. 1994, 317, 131–142. [Google Scholar] [CrossRef]
  47. Martynova, Y.; Yang, B.; Yu, X.; Boscoboinik, J.A.; Shaikhutdinov, S.; Freund, H.J. Low Temperature CO Oxidation on Ruthenium Oxide Thin Films at Near-Atmospheric Pressures. Catal. Lett. 2012, 142, 657–663. [Google Scholar] [CrossRef]
  48. Seitsonen, A.P.; Kim, Y.D.; Knapp, M.; Wendt, S.; Over, H. CO Adsorption on the Reduced (Formula Presented) Surface: Energetics and Structure. Phys. Rev. B Condens. Matter. Mater. Phys. 2002, 65, 035413-1–035413-9. [Google Scholar] [CrossRef] [Green Version]
  49. Kim, Y.K.; Morgan, G.A.; Yates, J.T. Role of Atomic Step Defect Sites on the Catalytic Oxidation of Carbon Monoxide: Comparison between Ru(001) and Ru(109) Single-Crystal Surfaces. J. Phys. Chem. C 2007, 111, 3366–3368. [Google Scholar] [CrossRef]
  50. Šljivančanin, Ž.; Hammer, B. CO Oxidation on Fully Oxygen Covered Ru(0001): Role of Step Edges. Phys. Rev. B Condens. Matter. Mater. Phys. 2010, 81, 121413-1–121413-4. [Google Scholar] [CrossRef]
  51. Aßmann, J.; Löffler, E.; Birkner, A.; Muhler, M. Ruthenium as Oxidation Catalyst: Bridging the Pressure and Material Gaps between Ideal and Real Systems in Heterogeneous Catalysis by Applying DRIFT Spectroscopy and the TAP Reactor. Catal. Today 2003, 85, 235–249. [Google Scholar] [CrossRef]
  52. Assmann, J.; Narkhede, V.; Breuer, N.A.; Muhler, M.; Seitsonen, A.P.; Knapp, M.; Crihan, D.; Farkas, A.; Mellau, G.; Over, H. Heterogeneous Oxidation Catalysis on Ruthenium: Bridging the Pressure and Materials Gaps and Beyond. J. Phys. Condens. Matter 2008, 20, 184017. [Google Scholar] [CrossRef]
  53. Narkhede, V.; Aßmann, J.; Muhler, M. Structure-Activity Correlations for the Oxidation of CO over Polycrystalline RuO2 Powder Derived from Steady-State and Transient Kinetic Experiments. Z. Phys. Chem. 2005, 219, 979–995. [Google Scholar] [CrossRef]
  54. Rosenthal, D.; Girgsdies, F.; Timpe, O.; Blume, R.; Weinberg, G.; Teschner, D.; Schlögl, R. On the CO-Oxidation over Oxygenated Ruthenium. Z. Phys. Chem. 2009, 223, 183–207. [Google Scholar] [CrossRef] [Green Version]
  55. Blume, R.; Hävecker, M.; Zafeiratos, S.; Teschner, D.; Kleimenov, E.; Knop-Gericke, A.; Schlögl, R.; Barinov, A.; Dudin, P.; Kiskinova, M. Catalytically Active States of Ru(0001) Catalyst in CO Oxidation Reaction. J. Catal. 2006, 239, 354–361. [Google Scholar] [CrossRef] [Green Version]
  56. Over, H.; Seitsonen, A.P.; Lundgren, E.; Schmid, M.; Varga, P. Experimental and Simulated STM Images of Stoichiometric and Partially Reduced RuO2(110) Surfaces Including Adsorbates. Surf. Sci. 2002, 515, 143–156. [Google Scholar] [CrossRef]
  57. Khalid, O.; Spriewald Luciano, A.; Drazic, G.; Over, H. Mixed RuxIr1−xO2 Supported on Rutile TiO2: Catalytic Methane Combustion, a Model Study. ChemCatChem 2021, 13, 3983–3994. [Google Scholar] [CrossRef]
  58. He, Y.; Langsdorf, D.; Li, L.; Over, H. Versatile Model System for Studying Processes Ranging from Heterogeneous to Photocatalysis: Epitaxial RuO2(110) on TiO2(110). J. Phys. Chem. C 2015, 119, 2692–2702. [Google Scholar] [CrossRef]
Figure 1. Ru 3d XP spectra of (A) Ru0 and (C) RuO2@TiO2. The former sample is measured without TiO2, as the signal is too weak otherwise. (B,D) show the respective samples after exposure to reducing CO oxidation conditions (1% O2/4% CO/95% Ar) at 300 °C. Table S1 provides the fit parameters for deconvolution of the experimental spectra (circles). The fit parameters are taken from Morgan et al. [29].
Catalysts 13 01178 g001
Figure 2. DRIFT spectra of CO adsorption are shown for (A) commercial Ru0 + TiO2 containing only purely metallic Ru and RuO2@TiO2 containing only purely oxidic Ru as prepared by Pechini synthesis on the left. (B) Samples after exposure to reducing CO oxidation conditions (1% O2/4% CO/95% Ar) at 300 °C. The spectra are recorded at room temperature.
Catalysts 13 01178 g002
Figure 3. Operando DRIFT spectra of (A) RuO2@TiO2 and (C) reduced RuO2@TiO2 as well as (B) corresponding CO conversion data under oxidizing (2% O2/2% CO/96% Ar) reaction feed composition. For the conversion data, the dark green line corresponds to RuO2@TiO2 and the light green line to reduced RuO2@TiO2. The temperature axis of the conversion plot is marked by dashed lines in the color of the corresponding DRIFT spectra. Spectra are recorded in 20 °C increments. The heating ramp is 1.8 K·min−1.
Catalysts 13 01178 g003
Figure 4. Operando DRIFT spectra of RuO2@TiO2 during cooldown under oxidizing (2% O2/2% CO/96% Ar) reaction feed composition. Spectra are recorded in 20 °C increments. The heating ramp is 1.8 K·min−1.
Catalysts 13 01178 g004
Figure 5. Operando DRIFT spectra of (A) RuO2@TiO2 and (C) reduced RuO2@TiO2, as well as (B) corresponding CO conversion data under reducing (1% O2/4% CO/95% Ar) reaction feed composition. For the conversion data, the dark green line corresponds to RuO2@TiO2 and the light green line to reduced RuO2@TiO2. The temperature axis of the conversion plot is marked by dashed lines in the color of the corresponding DRIFT spectra. Spectra are recorded in 20 °C increments. The heating ramp is 1.8 K·min−1.
Catalysts 13 01178 g005
Figure 6. Operando DRIFT spectra and conversion of RuO2@TiO2 and reduced RuO2@TiO2 under (A) reducing and (C) oxidizing reaction feed composition for the second reaction heat-up. The spectra (B) are recorded after cooling the catalyst to room temperature. The grey conversion curves represent the conversion of the first heat-up for the RuO2@TiO2 and reduced RuO2@TiO2, as shown in Figure 3 and Figure 5, respectively. Regardless of the initial state of the catalyst, spectra and conversion converged in accordance with the reaction feed.
Catalysts 13 01178 g006
Table 1. Vibrational band positions of CO on a Ru-based catalyst, as reported in the literature.
Band Position/cm−1Adsorbed SpeciesSubstrateRef.Remarks
1860–1970COMildly reduced RuO2(110)[31]Bridging CO being the majority species
2070–2080COMildly reduced RuO2(110)[31]On-top and bridging CO couple to a single band
2000–2050[Ru0-CO]-linearRu/Al2O3[32]Terminal CO
2010–2070terminal CO Ru-carbonyl[33,34]Depends on the carbonyl size
2048CORu(001)[30]Measured after exposure to oxidizing conditions; likely partially oxidized
2068(CO+O)(2 × 2)Ru(001)[35]--
2080CORu(001)[30]Measured under strongly oxidizing conditions at 500 K, likely oxidized
2100–2123COStoichiometric RuO2(110)[31]On-top CO on stoichiometric RuO2(110)
2100–2135CO/ORuO2(110)[36]On-top CO being the majority species
2100–2150CO/ORuO2(110)[31]O being the majority species; on-top CO embedded in O matrix
2070, 2130Rux+-(CO)3Ru/Al2O3[32,37]x = 1–3
2134Rux+(CO)yRu/SiO2[38]Linked to oxidation of Ru
2135Rux+(CO)yReduced RuO2(110)[3]x and y undetermined; linked to surface roughening due to reduction
Table 2. Gas compositions for different experiments.
Reaction ConditionsAr/%O2/%CO/%
Oxidizing9622
Reducing9514
CO only96-4
Disclaimer/Publisher’s Note: The statements, opinions and data contained in all publications are solely those of the individual author(s) and contributor(s) and not of MDPI and/or the editor(s). MDPI and/or the editor(s) disclaim responsibility for any injury to people or property resulting from any ideas, methods, instructions or products referred to in the content.

