Article

Synthesis of Ce and Sm Co-Doped TiO2 Nanoparticles with Enhanced Photocatalytic Activity for Rhodamine B Dye Degradation

by
Yassine Slimani
1,*,
Munirah A. Almessiere
1,2,
Mohamed J. S. Mohamed
3,
Essia Hannachi
4,
Serkan Caliskan
5,
Sultan Akhtar
1,
Abdulhadi Baykal
6 and
Mohammed A. Gondal
3,7
1
Department of Biophysics, Institute for Research and Medical Consultations (IRMC), Imam Abdulrahman Bin Faisal University, P.O. Box 1982, Dammam 31441, Saudi Arabia
2
Department of Physics, College of Science, Imam Abdulrahman Bin Faisal University, P.O. Box 1982, Dammam 31441, Saudi Arabia
3
Laser Research Group, Department of Physics, Interdisciplinary Research Center for Hydrogen and Energy Storage (IRC-HES), King Fahd University of Petroleum and Minerals (KFUPM), Dhahran 31261, Saudi Arabia
4
Department of Nuclear Medicine Research, Institute for Research and Medical Consultations (IRMC), Imam Abdulrahman Bin Faisal University, P.O. Box 1982, Dammam 31441, Saudi Arabia
5
Department of Physical and Applied Sciences, University of Houston-Clear Lake, Houston, TX 77058, USA
6
Department of Nanomedicine Research, Institute for Research and Medical Consultations (IRMC), Imam Abdulrahman Bin Faisal University, P.O. Box 1982, Dammam 31441, Saudi Arabia
7
K.A. CARE Energy Research and Innovation Center, King Fahd University of Petroleum & Minerals, Dhahran 31261, Saudi Arabia
*
Author to whom correspondence should be addressed.
Catalysts 2023, 13(4), 668; https://doi.org/10.3390/catal13040668
Submission received: 1 March 2023 / Revised: 25 March 2023 / Accepted: 27 March 2023 / Published: 29 March 2023

Abstract

:
One of the major concerns that receive global attention is the presence of organic pollutants (dyes, pharmaceuticals, pesticides, phenolic compounds, heavy metals, and so on), originating from various industries, in wastewater and water resources. Rhodamine B is widely used in the dyeing of paints, plastics, textiles, and other fabrics, as well as biological products. It is highly persistent, toxic, and carcinogenic to organisms and humans when directly released into the water supply. To avoid this hazard, several studies have been conducted in an attempt to remove Rhodamine B from wastewater. Metal oxide semiconducting materials have gained great interest because of their ability to decompose organic pollutants from wastewater. TiO2 is one of the most effective photocatalysts with a broad range of applications. Several attempts have been made to improve its photocatalytic activity. Accordingly, we have prepared in this work a series of cerium (Ce) and samarium (Sm) co-doped TiO2 nanoparticles (x = 0.00, 0.25, 0.50, 1.00, and 2.00%) using a sol–gel auto-combustion approach. The influence of Ce–Sm concentrations on the structural, morphology, electronic, and optical properties, as well as the photocatalytic activity, was investigated. Structure and elemental mapping analyses proved the presence of Ce and Sm in the compositions as well as the development of the TiO2 anatase phase with a tetragonal structure and crystallite size of 15.1–17.8 nm. Morphological observations confirmed the creation of spherical nanoparticles (NPs). The examination of the electronic structure properties using density functional theory (DFT) calculations and of the optical properties using a UV/Vis diffuse spectrophotometer showed a reduction in the bandgap energy upon Ce–Sm co-doping. The photocatalytic activity of the synthesized products was assessed on the degradation of Rhodamine B dye, and it was found that all Ce–Sm co-doped TiO2 nanoparticles have better photocatalytic activities than pristine TiO2 nanoparticles. Among all of the prepared nanoparticles, the sample with x = 0.50% demonstrated the best photocatalytic activity, with a degradation efficiency of 98% within 30 min and a reaction rate constant of about 0.0616 min−1. h+ and •O2 were determined to be the most important active species in the photocatalytic degradation process. Besides the high photocatalytic degradation efficiency, these photocatalysts are highly stable and could be easily recovered and reused, which indicates their potential for practical applications in the future.

1. Introduction

Environmental pollution stemming mainly from agricultural and industrial activities has become a major issue that threatens human life and all other living beings. Indeed, the arbitrary industrial spread leads to the permanence of toxic substances in nature, water, and soil, causing serious diseases. Remarkably, the detection of numerous toxic organic contaminants and dyes in soil and marine environments has indicated the deterioration of the state of water sources in the world [1,2].
Since the introduction of synthetic dyes to the present day, the textile and dye industries have substantially boosted their output. On the other hand, the discharge of synthetic dyes into various water sources generates several issues for aquatics and humans. Rhodamine B (RB) is a dye that is widely utilized in a variety of sectors, including foods and textiles. However, it is an incredibly toxic material that is mutagenic and carcinogenic to all living organisms [3]. Additionally, RB is highly persistent and presents a major concern over the long term for aquatic species, as it does for plants, because it obstructs the penetration of light, reducing the photosynthetic mechanism and interfering with natural purification processes. Hence, RB must be totally eliminated from wastewater to prevent the potentially harmful impacts of its occurrence in the environment. Therefore, the search for robust strategies that help to remove these environmental hazards is of vital importance, especially when dealing with a very high concentration of contaminants. The traditional procedures for treating wastewater (biological, chemical, and physical routes) employed for the removal of dyes are inept and show significant drawbacks, including poor removal efficiency for resistant and nonbiodegradable organic dyes, as well as the requirement of several post-treatment processes and very long removal periods [3,4]. In recent years, there has been much interest in the use of advanced oxidation processes (AOPs) to purify contaminated wastewater [5,6,7]. AOPs are distinguished by the generation of reactive oxygen species (ROS) such as singlet oxygen ( O 2 ), hydrogen peroxide (H2O2), hydroxyl radical (•OH), and superoxide radical anion (•O2), which could rapidly oxidize and degrade dye molecules found in industrial effluents. Sonocatalysis, sonolysis, photocatalysis, photolysis, ozonation, and Fenton reaction are some examples of AOPs [8,9,10]. Recently, nanomaterials endowed with effective photocatalytic activity have been considered as high-performing candidates for advanced oxidation processes, making it possible to remove even intractable pollutants from wastewater [11,12,13,14].
During recent decades, several compounds such as TiO2, ZnS, ZnO, and CdS, among others, have been classified as materials of high photocatalytic activity and have gained more trust in water purification, healthcare, and food packaging [15,16,17,18]. Of these photoactive materials, titanium dioxide (TiO2) has been widely explored as a promising photocatalyst, enabling both air and water pollution control, organic pollutants’ degradation, and fuel production from water and carbon dioxide [19,20]. Abundance, cheapness, non-toxicity, and stability are among the highly crucial advantages that allowed the emergence of this metal oxide semiconductor in the photocatalysis area and other fields of applications, including supercapacitors, solar energy conversion, and so on [21,22,23,24,25]. On another side, TiO2 exhibits specific properties that are indispensable for photocatalytic purposes, mainly including a suitable redox ability, proper photo-response, and charge mobility [26]. However, the catalytic performance of TiO2 faces some obstacles related to the material’s large bandgap (Eg = 3.2 eV), principally including the quick recombination of photogenerated charge carriers and low interfacial charge transfer rates [27]. As a consequence, the use of this material oxide is restricted to the ultraviolet range, with poor utilization of solar light for TiO2 excitation.
For better photocatalytic efficiency, the light absorption range of TiO2 photocatalysts should be extended to visible light. To achieve this goal, vigorous investigations have been conducted to enhance the properties of TiO2 either by controlling its morphology and crystal structure or by doping. Introducing defects in titanium (Ti) or oxygen (O) sites provides a relevant and effective way to reduce bandgap energy by forming new energy states and enhance the photocatalytic response [28]. It should be noted that the optoelectronic and catalytic properties for target applications as well as the creation of new energy states and defects depend strongly on the synthesis method and the choice of dopant. Sol–gel, chemical vapor deposition, solvothermal, hydrothermal methods, and hydrolysis, among others, are among the available synthesis routes of pristine and doped TiO2 NPs [29,30]. The sol–gel method has been proven to be the most beneficial thanks to its simplicity, low cost, accurate control of composition, purity, homogeneity, and so on.
Several reported results have shown that doping with rare earth (RE) ions such as Sm3+, Nd3+, Gd3+, Pr3+, Ce3+, and La3+ could notably enhance the photocatalytic activity of TiO2 [31,32]. Thanks to their 4f orbital, which allow them to act as electron acceptors when doped into TiO2, these ions afford reliable sites for organic pollutants’ adsorption. They are also characterized by a large ionic radius, making possible their deposition on the surface of TiO2 with a considerable increase in the surface area [32]. Cerium (Ce) is one of the RE elements that has attracted special interest as a TiO2 doping agent thanks to its non-toxicity, cheapness, and potential to boost the light-absorption capability of TiO2. It has been demonstrated that an increase in Ce content leads to the tightening of the TiO2 bandgap and a clear redshift of the absorption has been observed [33]. For instance, Xiu et al. [33] showed that Ce-doped TiO2 is a promising composite catalyst that enhances the degradation of methylene blue under visible light. Likewise, samarium (Sm) has been widely applied to improve TiO2-based photocatalysts. It has been shown that the incorporation of Sm into TiO2 brings important changes, especially the reduction in particle size and the formation of discrete energy levels, which are key reasons to avoid electron–hole pair recombination [34]. In their work, Peng et al. [35] produced Sm-doped TiO2 via the sol–gel approach and reported an efficient photocatalytic activity because of the increase in surface area and the significant improvement in visible light response.
Until now, many investigations have been carried out to develop modified TiO2 photocatalysts by either doping or co-doping routes. To the best of our knowledge, no study has been reported on simultaneous Ce and Sm co-doped TiO2 photocatalysts. Taking into account this lack of research, we report here the synthesis of TiO2 doped simultaneously with Sm and Ce using the sol–gel method. Our aim is to further the design of high-performing TiO2 nano-photocatalysts through an analysis of the structure; morphology; and electronic, optical, and photocatalytic properties of co-doped samples with different dopant percentages.

2. Results and Discussions

2.1. Phase Analysis

X-ray powder diffraction patterns of the prepared Ce–Sm co-doped TiO2 NPs (x = 0.00, 0.25, 0.50, 1.00, and 2.00%) are presented in Figure 1. The pure and Ce–Sm co-doped TiO2 NPs exhibited diffraction peaks at about 25.33°, 37.84°, 48.06°, 53.96°, 55.11°, 62.69°, 68.89°, 70.34°, and 75.15°, which are associated with crystal planes (1 1 0), (0 0 4), (2 0 0), (1 0 5), (2 1 1), (2 0 4), (1 1 6), (2 2 0), and (2 1 5), respectively. All of these peaks correspond to the anatase phase of tetragonal TiO2 without the detection of any undesired phase, which approved the incorporation of Ce and Sm ions within the anatase crystal lattice. Furthermore, no other peaks belonging to brookite or rutile TiO2 phases are detected. The XRD patterns also showed high-intensity peaks, which indicated the crystalline nature of TiO2 NPs. The formation of the anatase TiO2 phase was approved through Rietveld refinement of experimental XRD data by utilizing Match 3 and Fullproof software, as shown in Figure 1.
The calculated structural parameters and average crystallite size (DXRD) are presented in Table 1. It can be observed that the structural parameters a=b and c varied with Ce–Sm co-doping, which are generally influenced by the dissimilarity in ionic radii of different cations, the impurity atoms, the defects, and so on [36]. This would generate a distortion in the lattice structure. The calculated DXRD values were found to be in the range of 17.8–15.1 nm. The crystallite size of TiO2 NPs slightly decreased with the increasing concentration of Ce–Sm co-dopants. This could be ascribed to the inhibition in the growth of TiO2 nanocrystallites by the adsorptions of Ce and Sm ions when increasing the concentration of Ce–Sm co-dopants [37].

2.2. Morphological Observations

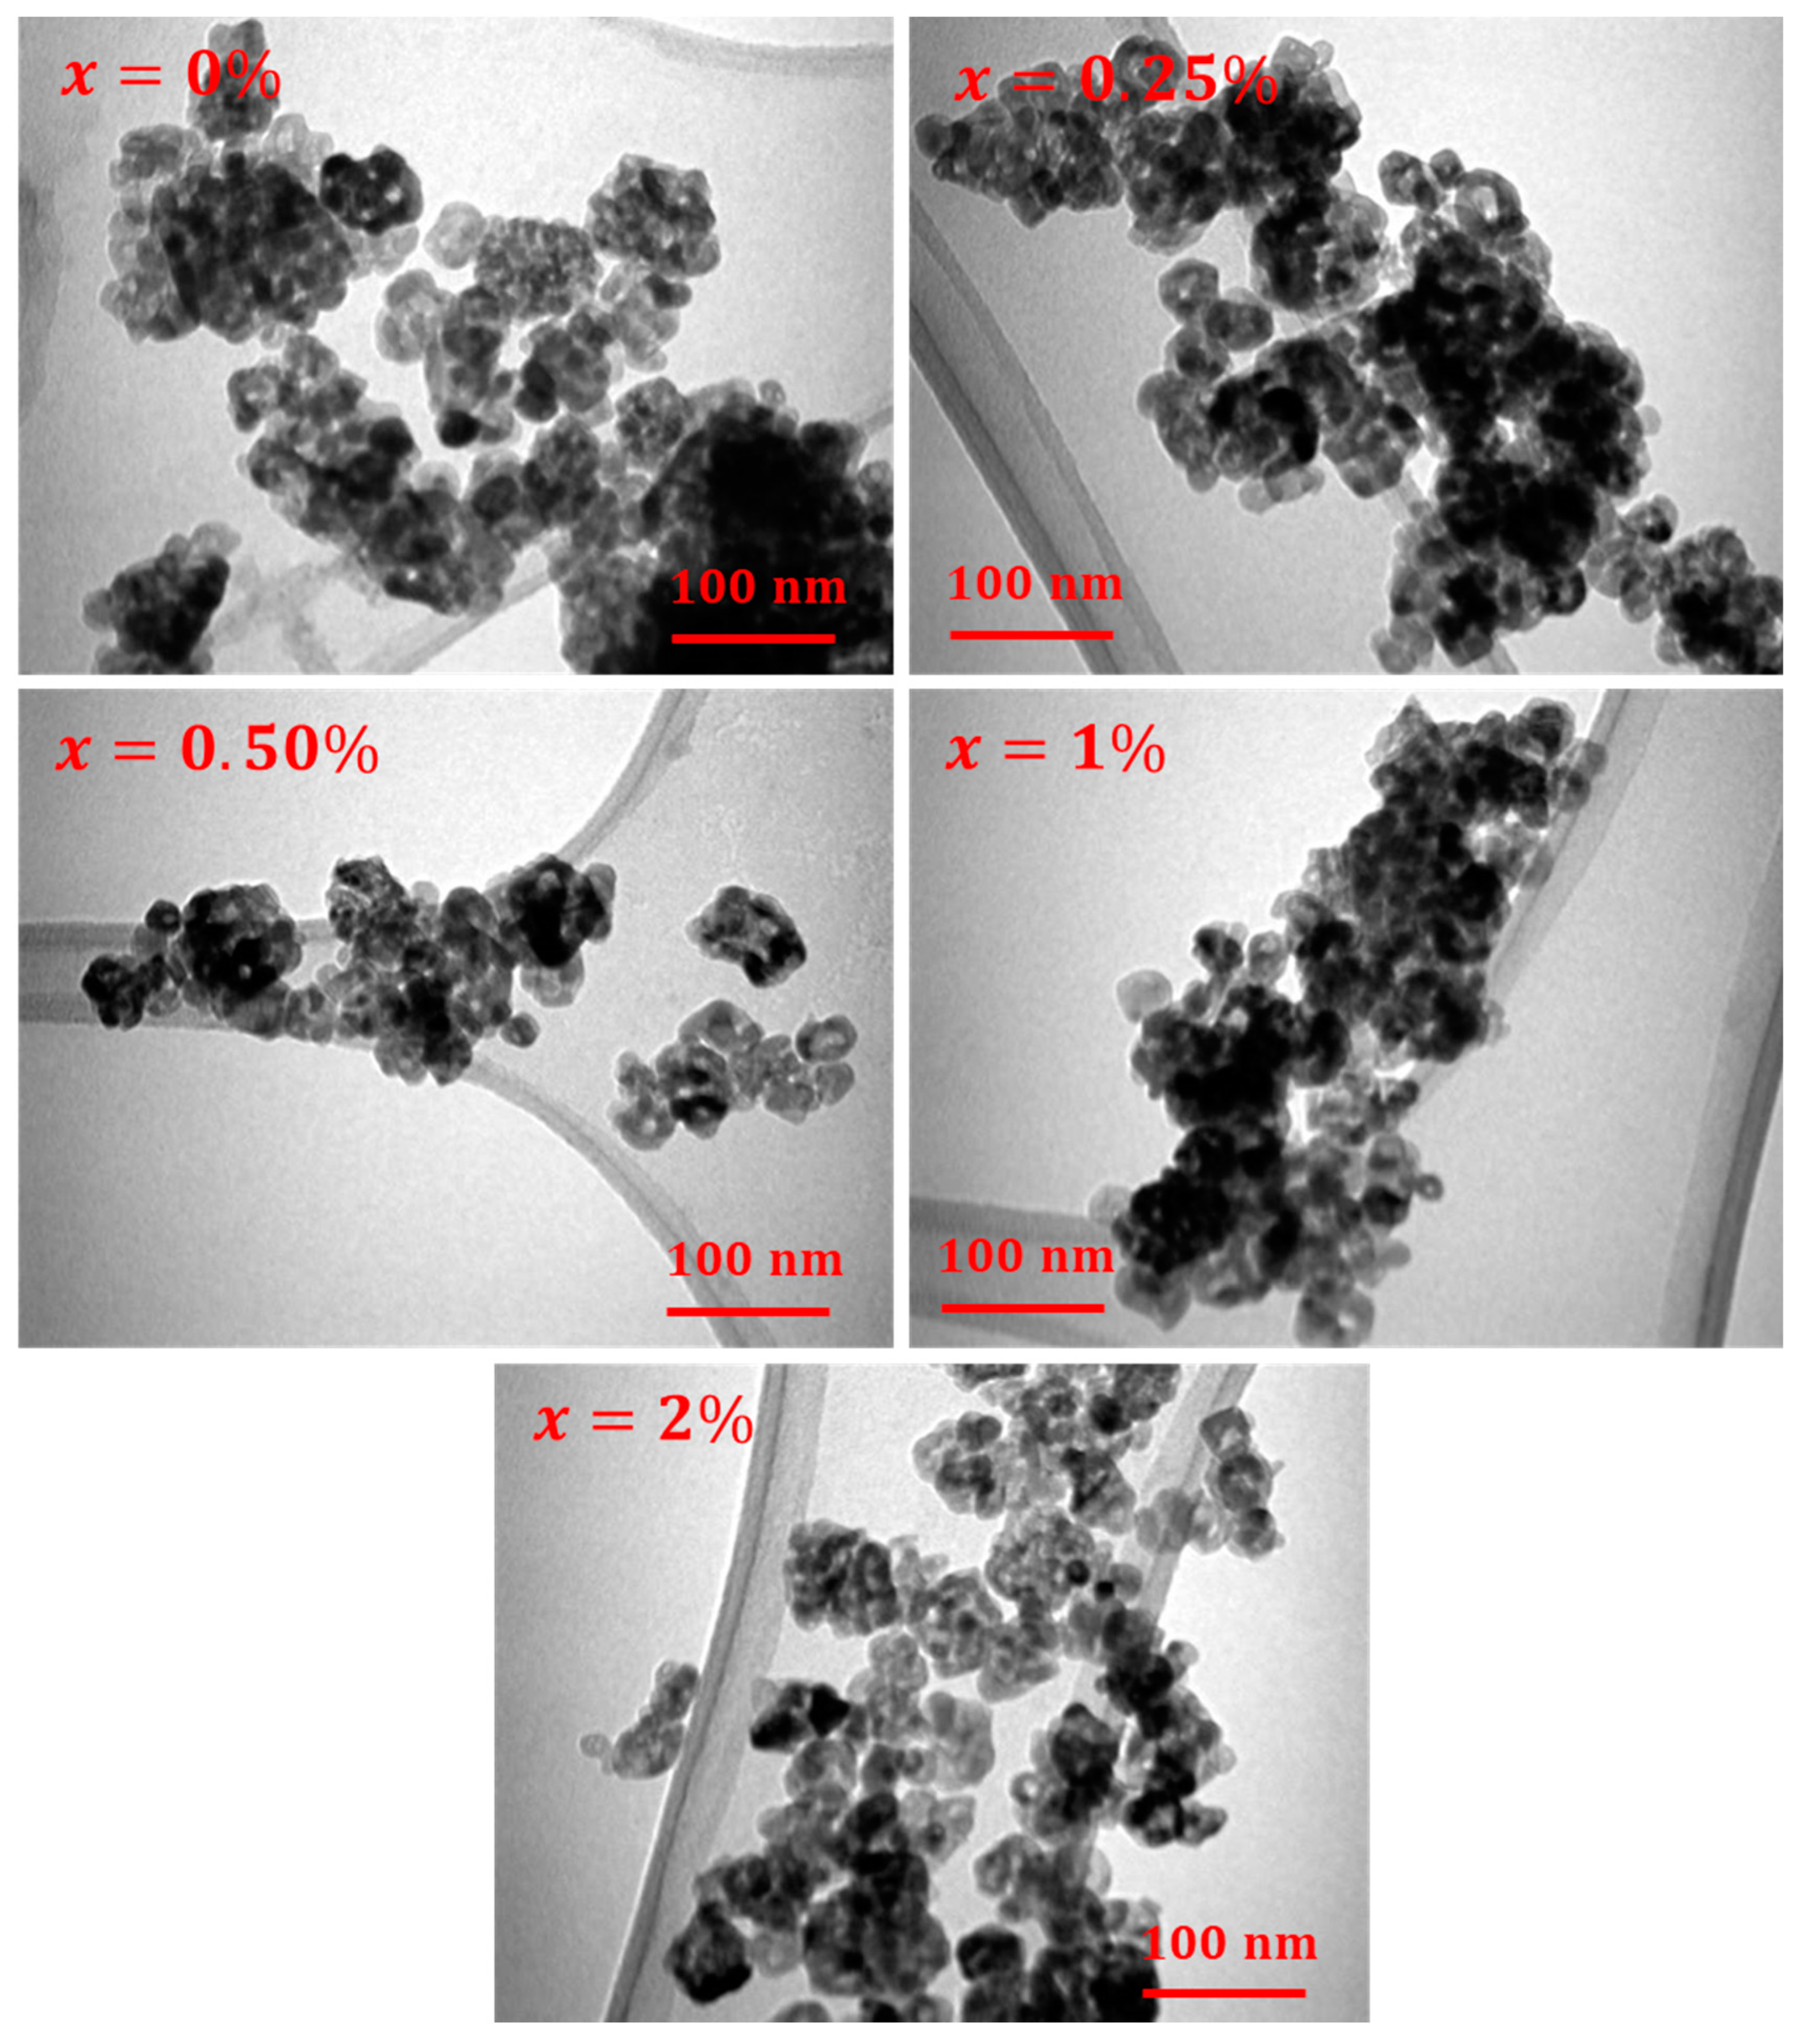
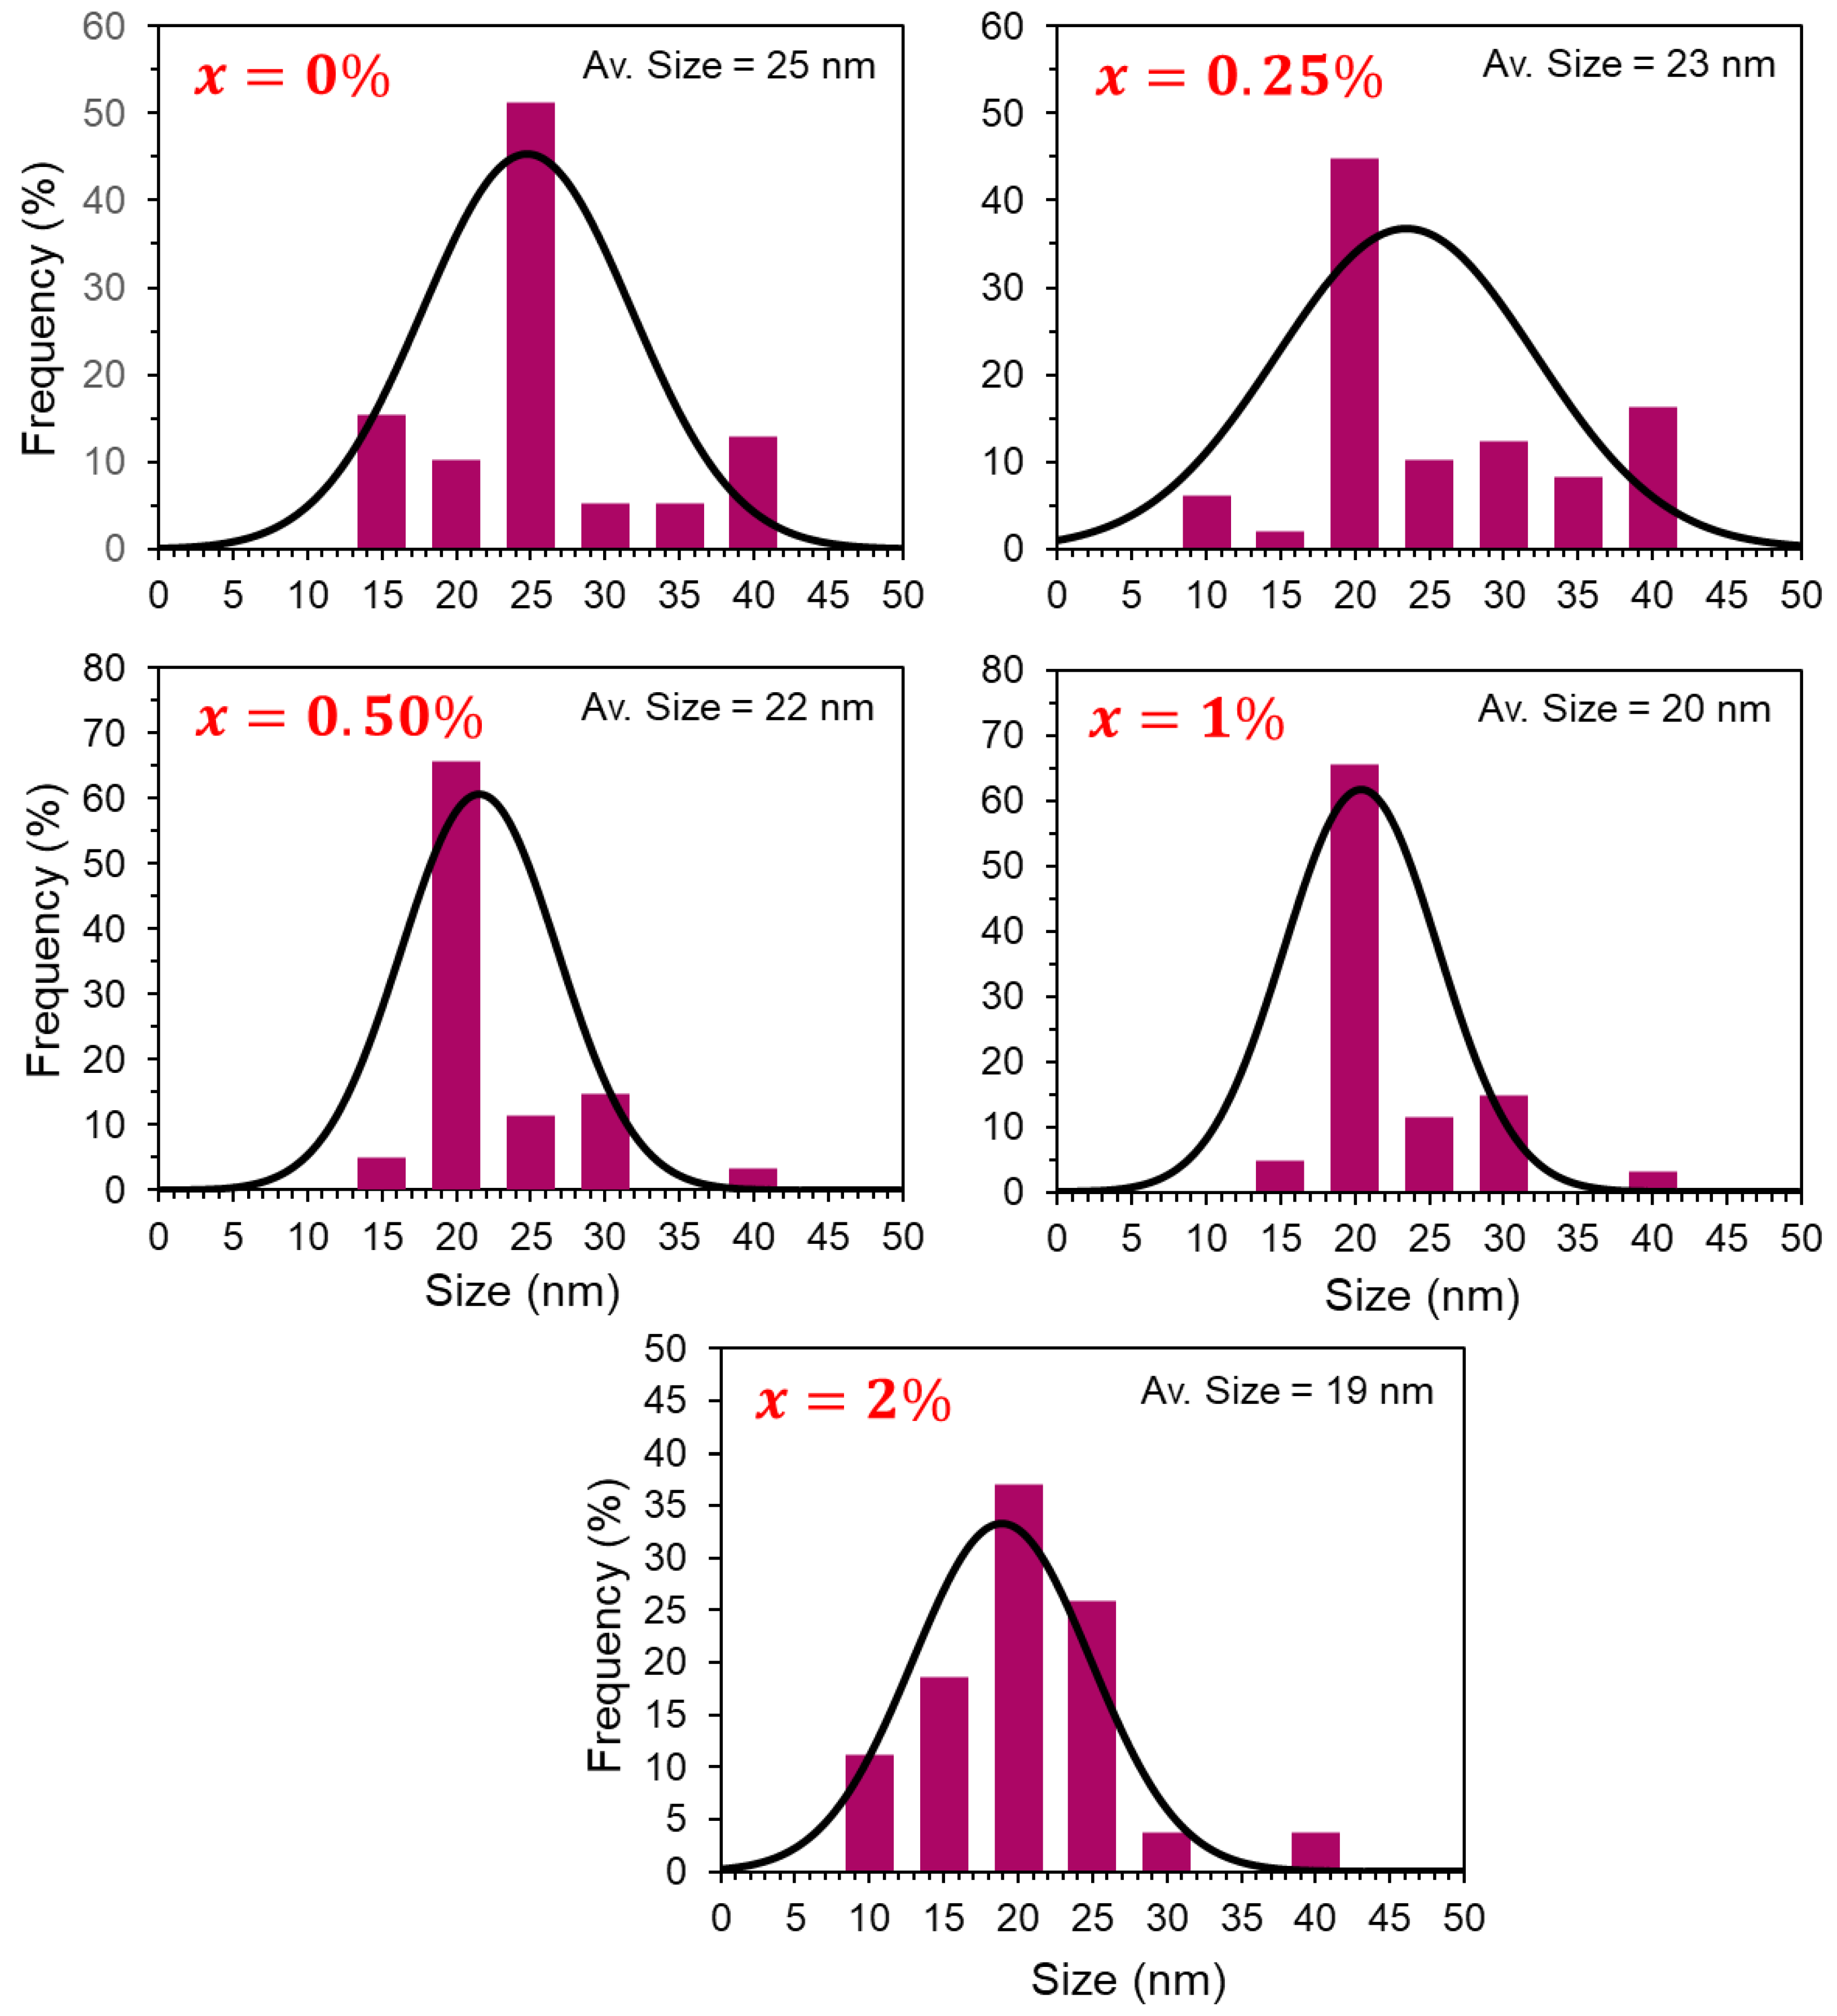
TEM is a valuable technique to assess the size and morphology of nanoparticles. Figure 2 and Figure 3 present the TEM images and the NPs’ size distribution histograms of the pure and Ce–Sm co-doped TiO2 NPs (x = 0.00, 0.25, 0.50, 1.00, and 2.00%), respectively. These images indicate spherical nanoparticles with an average particle size in the interval of 19–25 nm. The median size of nanoparticles is slightly reduced from 25 nm to about 19 nm with the inclusion of Ce and Sm ions. Furthermore, the obtained results indicated a suitably homogenous size distribution for each prepared composition. The obtained findings are in good agreement with the above XRD analyses.
Figure 4 displays the elemental mapping of TiO2 nanoparticles co-added with an x content of 1% of Ce and Sm ions. It clearly shows the presence of Ti, Ce, Sm, and O elements, which are uniformly distributed in the sample. The atomic percentages for O, Ti, Ce, and Sm elements are about 67.87%, 31.44%, 0.39%, and 0.30%, respectively.

2.3. Electronic Structure Properties

Exhibiting the electronic structure characteristics plays a crucial role in the complete understanding of the experimental findings. They are related to the absorption mechanism and accompanying catalytic activity. Density functional theory (DFT) is an appropriate tool to reveal the electronic structure and band gap of nanomaterials. In this context, the combination of experiments and the DFT study provides a better understanding of the mechanisms behind RB dye removal [38]. By employing density functional theory (DFT), we performed numerical calculations to unveil the effect of Sm and Ce co-doping on the electronic structure properties of TiO2. To this end, DFT-based QuantumATK software [39] was employed for the Sm and Ce co-doped TiO2. Its unit cell, composed of 72 atoms (22 Ti, 1 Sm, 1 Ce, and 48 O atoms), is illustrated in Figure 5. The number of dopants employed in the unit cell suggests 2.8% co-doped NPs. This content is higher than the maximum dopant amount (2.0%) used in the experimental work. TiO2′s unit cell (given by lattice parameters a = 11.41 Å , b = 7.61 Å , and c = 9.75 Å ), upon replacing the two Ti atoms by Sm and Ce, was optimized by setting a force tolerance of 0.01 eV/Å. Next, DFT calculation was implemented using spin-dependent generalized gradient approximation (SGGA + U) with the Perdew–Burke–Ernzerhof (PBE) function (SGGAU.PBE) [40] for the exchange and correlation effects of the electrons. Here, U is the Hubbard term providing a band gap correction to the DFT approximation. In this way, the hybridization of RE-4f and Ti-3d atoms can be properly described. The U term was set to 8.5, 1.5, and 1.5 eV for Ti-3d, Sm-4f, and Ce-4f electrons, respectively [41,42]. As for the ion cores, PseudoDojo pseudopotentials [43] were utilized. Ti, Sm, Ce, and O atoms were identified by their valence electrons; Ti: 4s23d2, Sm: 6s24f6, Ce: 6s25d14f1, and O: 2s22p4. A mesh cutoff energy of 125 Hartree with (3,4,3) k-point mesh within the Monkhorst–Pack scheme [44] was employed. To the best of our knowledge, the present work is the first investigation of Ce–Sm co-doped TiO2 material.
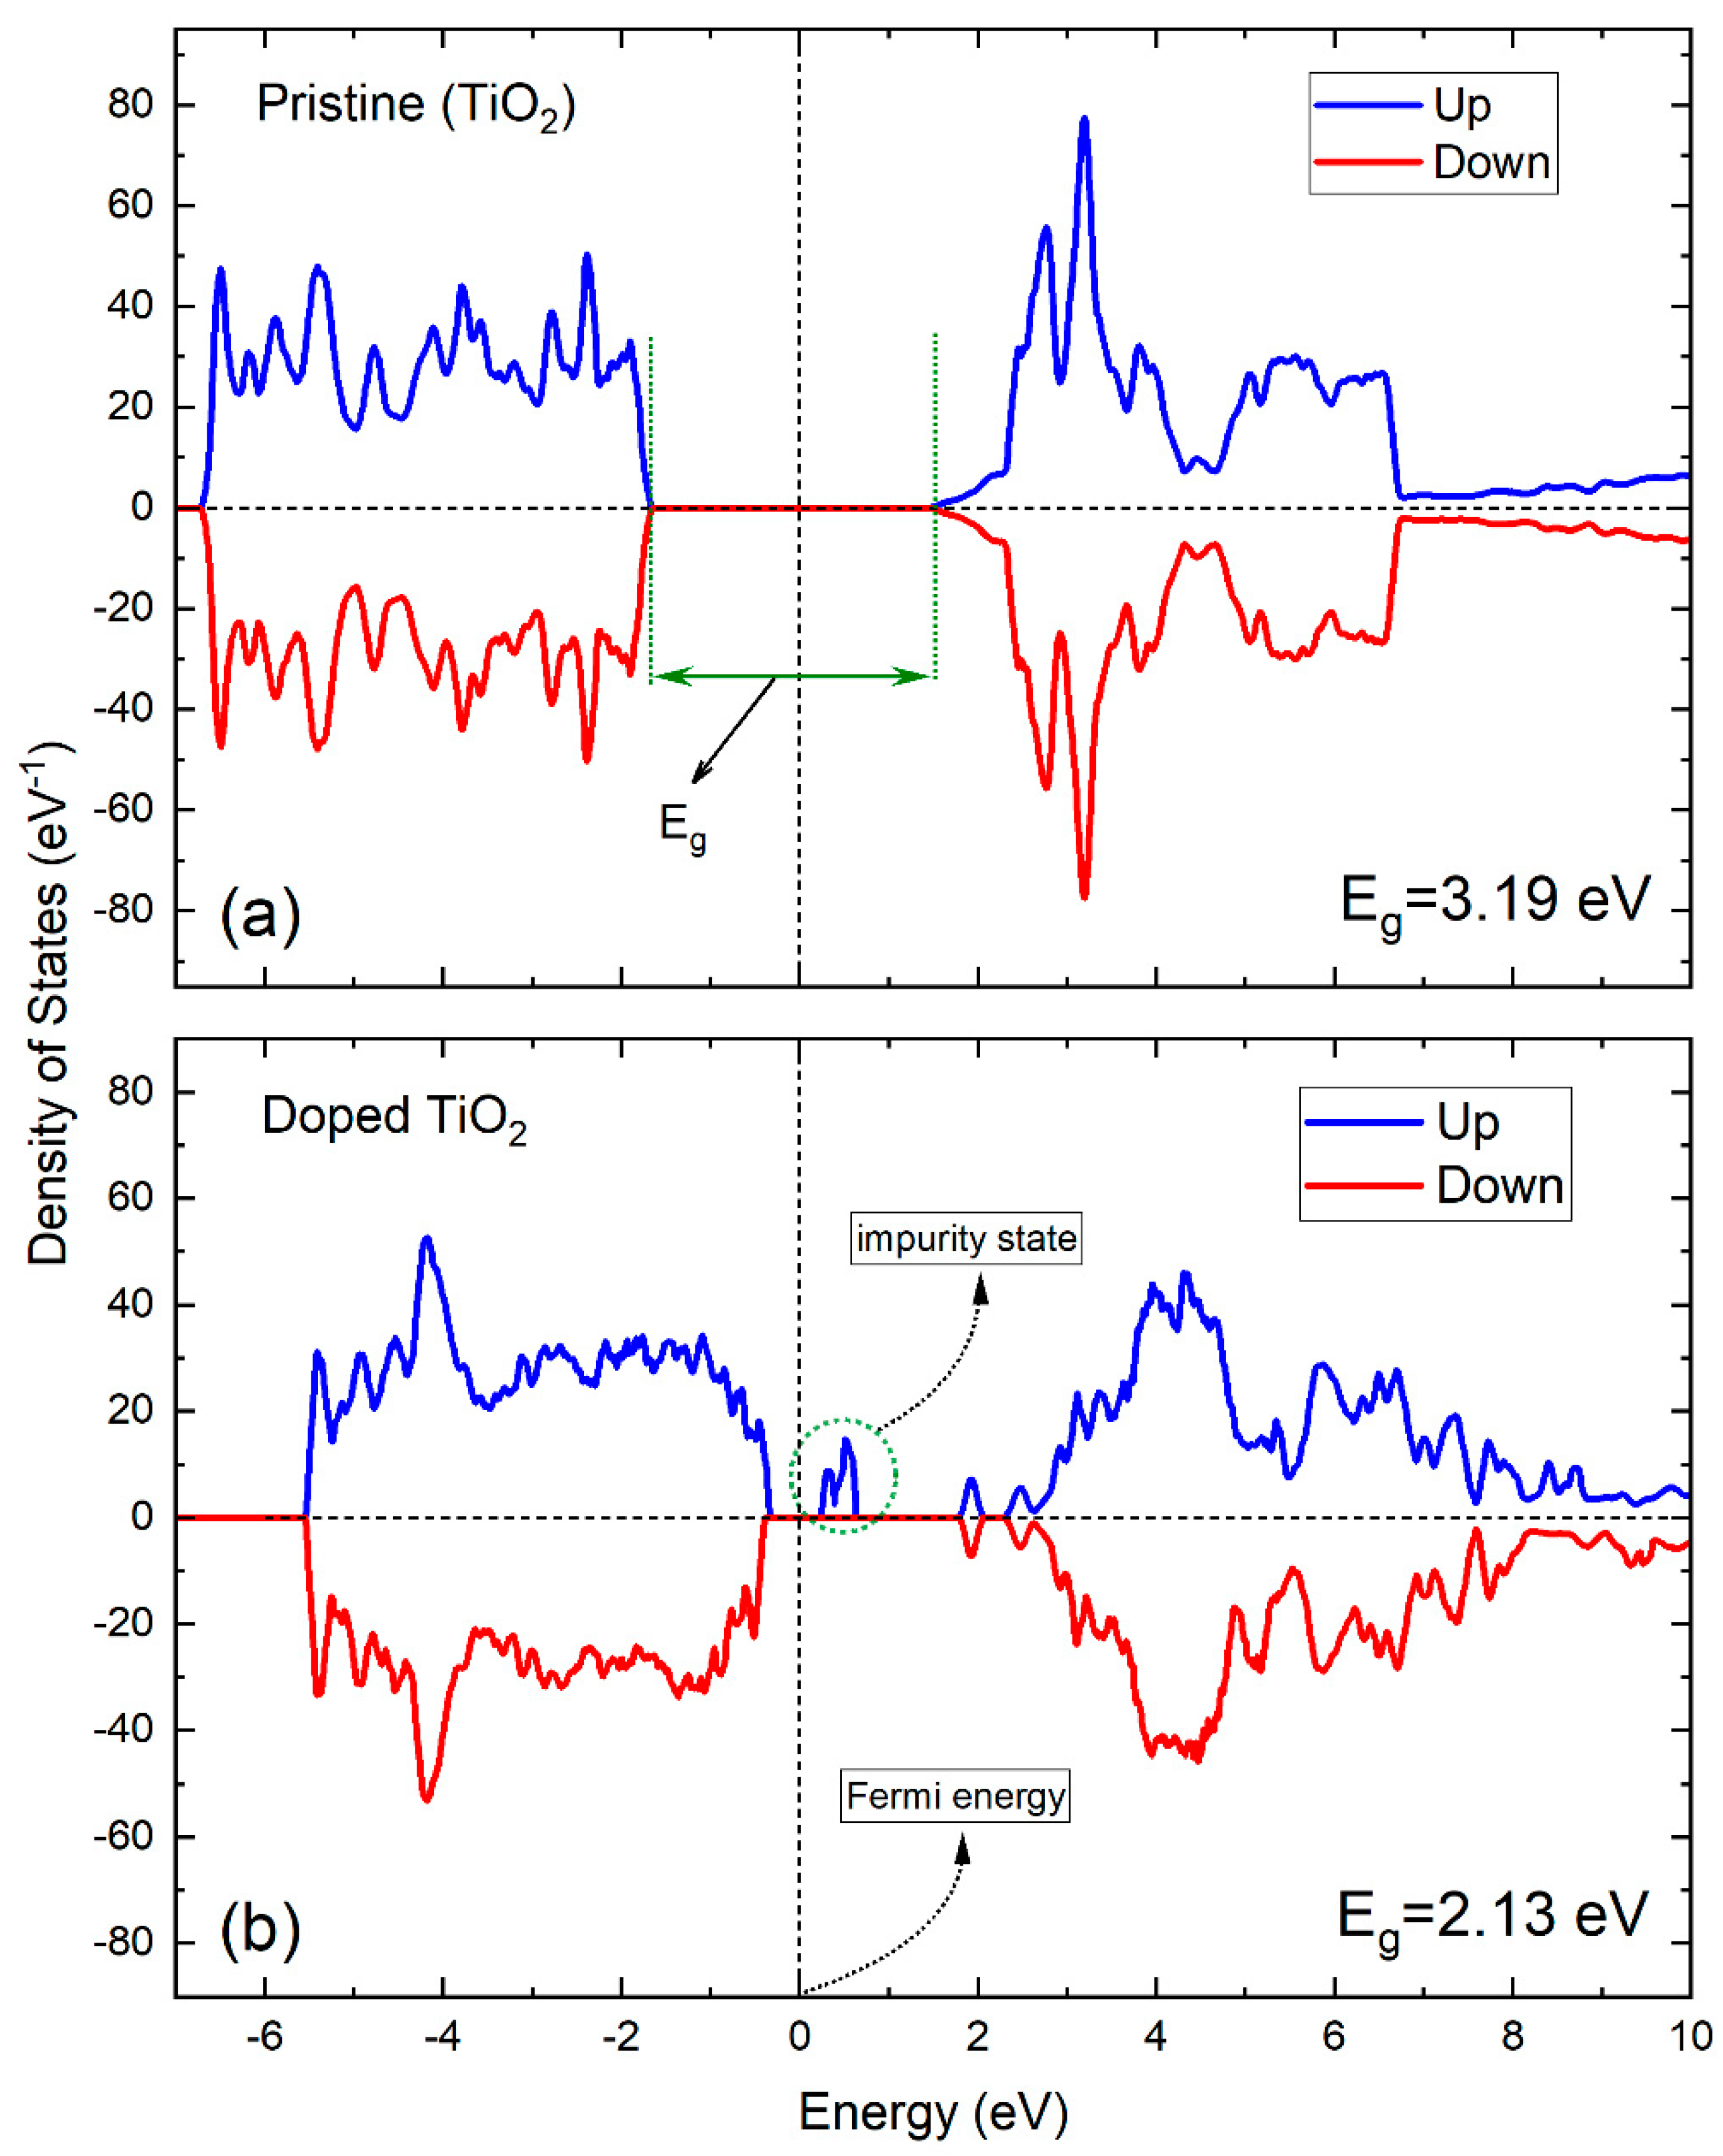
The total density of states (DOS) for both pristine TiO2 and Ce–Sm co-doped TiO2 NPs is illustrated in Figure 6a,b, respectively, where the Fermi energy (EF) is adjusted to zero. The DOS spectra, providing information about the electronic structure, demonstrate that the spin-up (positive variation) and spin-down (negative variation) states are identical. Ce and Sm atoms bring about additional states around the EF, modifying the Ce–Sm co-doped TiO2′s electronic structure properties. This indicates that electronic characteristics can be tuned by the addition of RE atoms, resulting in the alteration of the energy bandgap (Eg). Using the difference between the valence band maximum (negative energy) and conduction band minimum (positive energy), it can be obtained from the DOS spectra, as shown in Figure 6a. TiO2’s Eg was calculated as 3.19 eV. Upon the addition of Ce–Sm dopants, Eg decreases to 2.13 eV and impurity states emerge, as displayed in Figure 6b. Such a drop in Eg is reasonable, as it was reported to be 2.20 eV in earlier experimental work [45] for the Ce-doped TiO2 nanocrystals where the Ce concentration was 10%. It could be ascribed to factors such as the modification of the unit cell (provoking a change in lattice parameters) and new available states in the vicinity of EF (which lowers the band gap) owing to the incorporation of RE ions.

2.4. UV/Visible Spectra Investigation

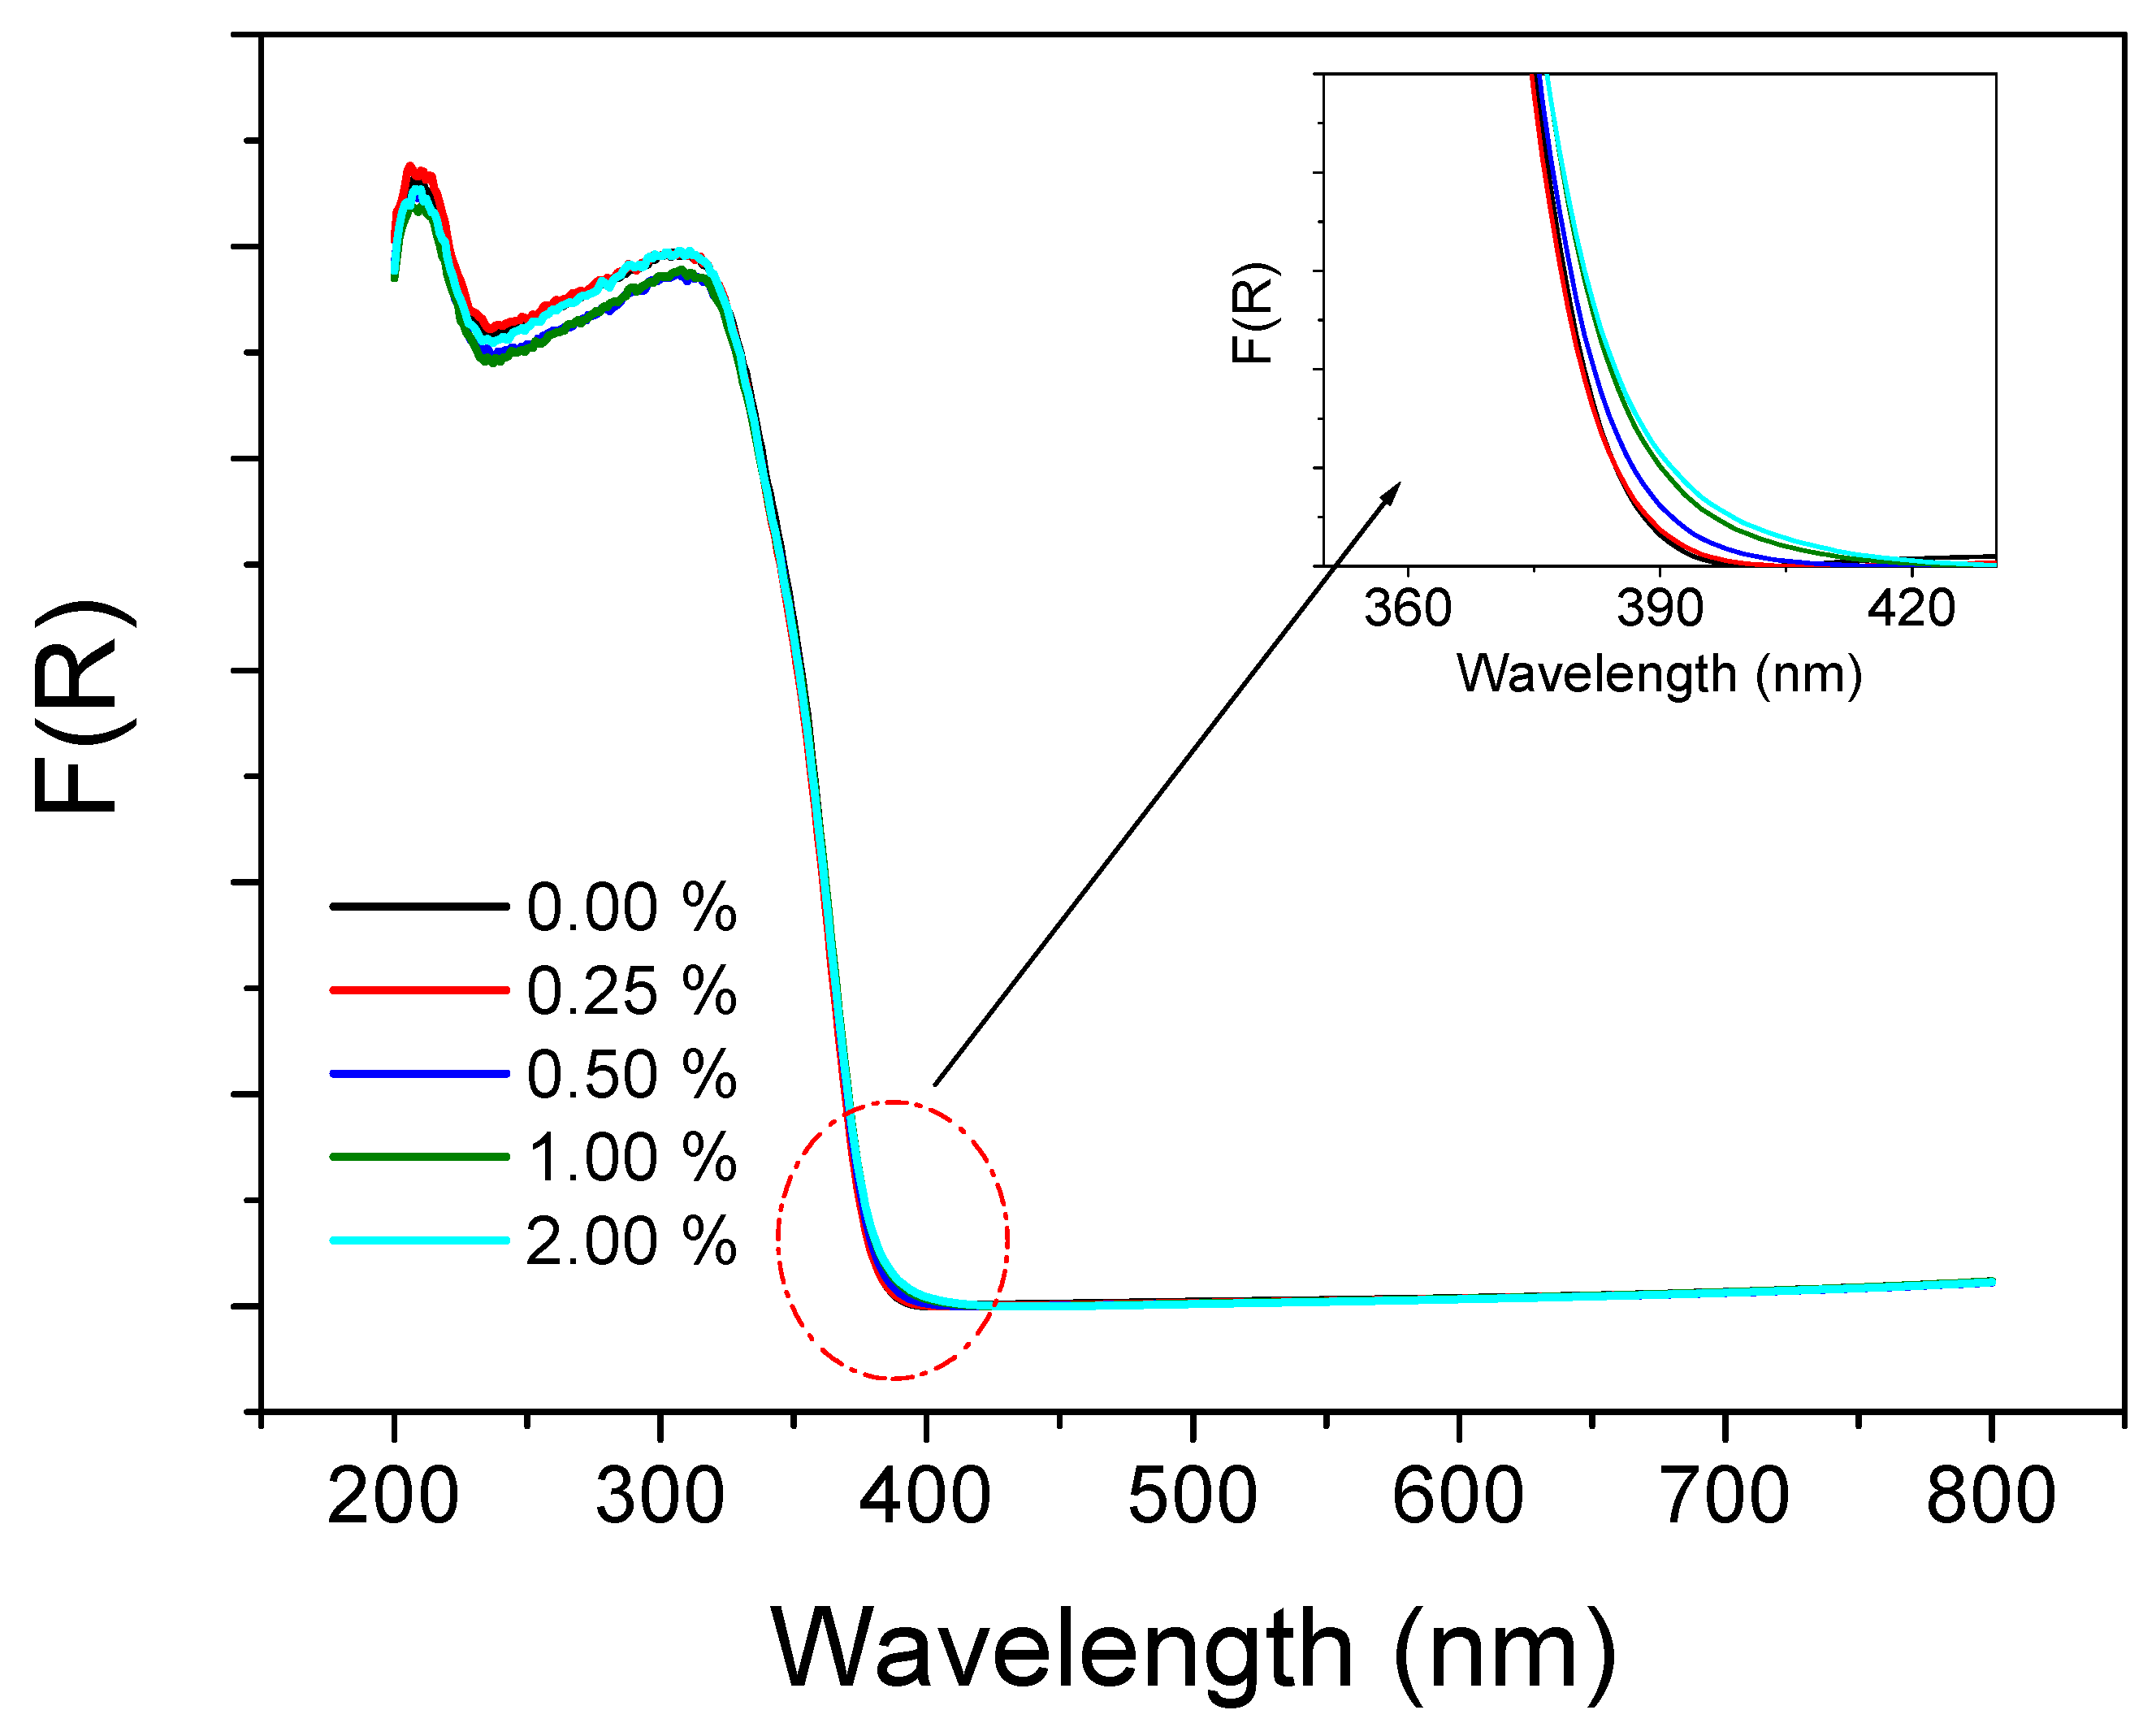
The impact of Ce–Sm co-doping on the UV–visible spectra of TiO2 NPs was studied in a wavelength range of 200–800 nm. The spectra were registered in reflectance mode. From these spectra, F(R) plots were determined by employing the Kubelka–Munk (KM) function, F(R) = (1 − R)2/2R. All of the spectra display almost similar curve shapes (Figure 7). There is no notable variation in the absorption peak position of TiO2 NPs on co-doping. The inset displays the enlarged image of the absorption edges for all compositions. The absorption edge is slightly red-shifted when the concentration of cerium and samarium increases.
The bandgap is frequently determined by plotting [F(R)]2 against hv and [F(R)]1/2 against for the direct band gap and indirect band gap, respectively. In anatase bulk TiO2, the direct transition is prohibited and an indirect bandgap is permitted. This bandgap is due to the phonon-assisted electronic transition from O2p to Ti3d in the MΓ transition in the zone of Brillouin [46]. In our case, we have considered both direct and indirect bandgaps and we have examined the variations in the bandgaps of TiO2 with co-doping Sm and Ce ions. We have plotted [F(R)]1/2 against hv (Figure 8a) and [F(R)]2 against hv (Figure 8b). The dashed lines drawn at the linear fragments of the curves at [F(R)]1/2 → 0 and [F(R)]2 → 0 yield the values of the indirect bandgap (Eg indirect) and direct bandgap (Eg direct), respectively. For all compositions, the magnitude of Eg direct is higher than that of Eg indirect (insets of Figure 8a,b). Similar results have been previously found by Calandra et al. [47] and Reddy et al. [48]. The measured direct and indirect Eg values are 3.23 eV and 3.16 eV, respectively, for pure TiO2 nanoparticles. Choudhury et al. measured the indirect bandgap of pure TiO2 NPs and found a value of 3.24 eV [49]. K.P. Priyanka found an Eg value of 2.88 eV for pure anatase TiO2 nanoparticles [50]. Our Eg direct values are slightly greater than those obtained in bulk TiO2 (Eg = 3.22 eV), while our Eg values are lower than those obtained by Calandra et al., where the authors obtained a value of 4.26 eV and 3.63 eV for the direct and indirect bandgaps, respectively [47]. However, a progressive reduction in both the direct and indirect energy bandgaps of TiO2 NPs was observed as the amount of Sm and Ce elements increased from 0.25 to 2.0%. Similar results were obtained in the case of TiO2 co-doped with Ce–Nd elements [49]. Upon co-doping, the 4f levels of Ce and Sm rare earth can be introduced below the 3d level of Ti, permitting the electronic transition from O2p to Ce and Sm 4f levels [49,51,52]. This eventually led to the shift in the edge of absorption to low energies and a narrowing in the bandgap value of the material. These analyses agree well with the theoretical results discussed above. According to these obtained results, it can be assumed that the cerium and samarium elements surrounding the TiO2 granules can absorb a larger light radiation range and increase the visible light absorption capacity of the nano-photocatalysts.

2.5. Photocatalytic Degradation

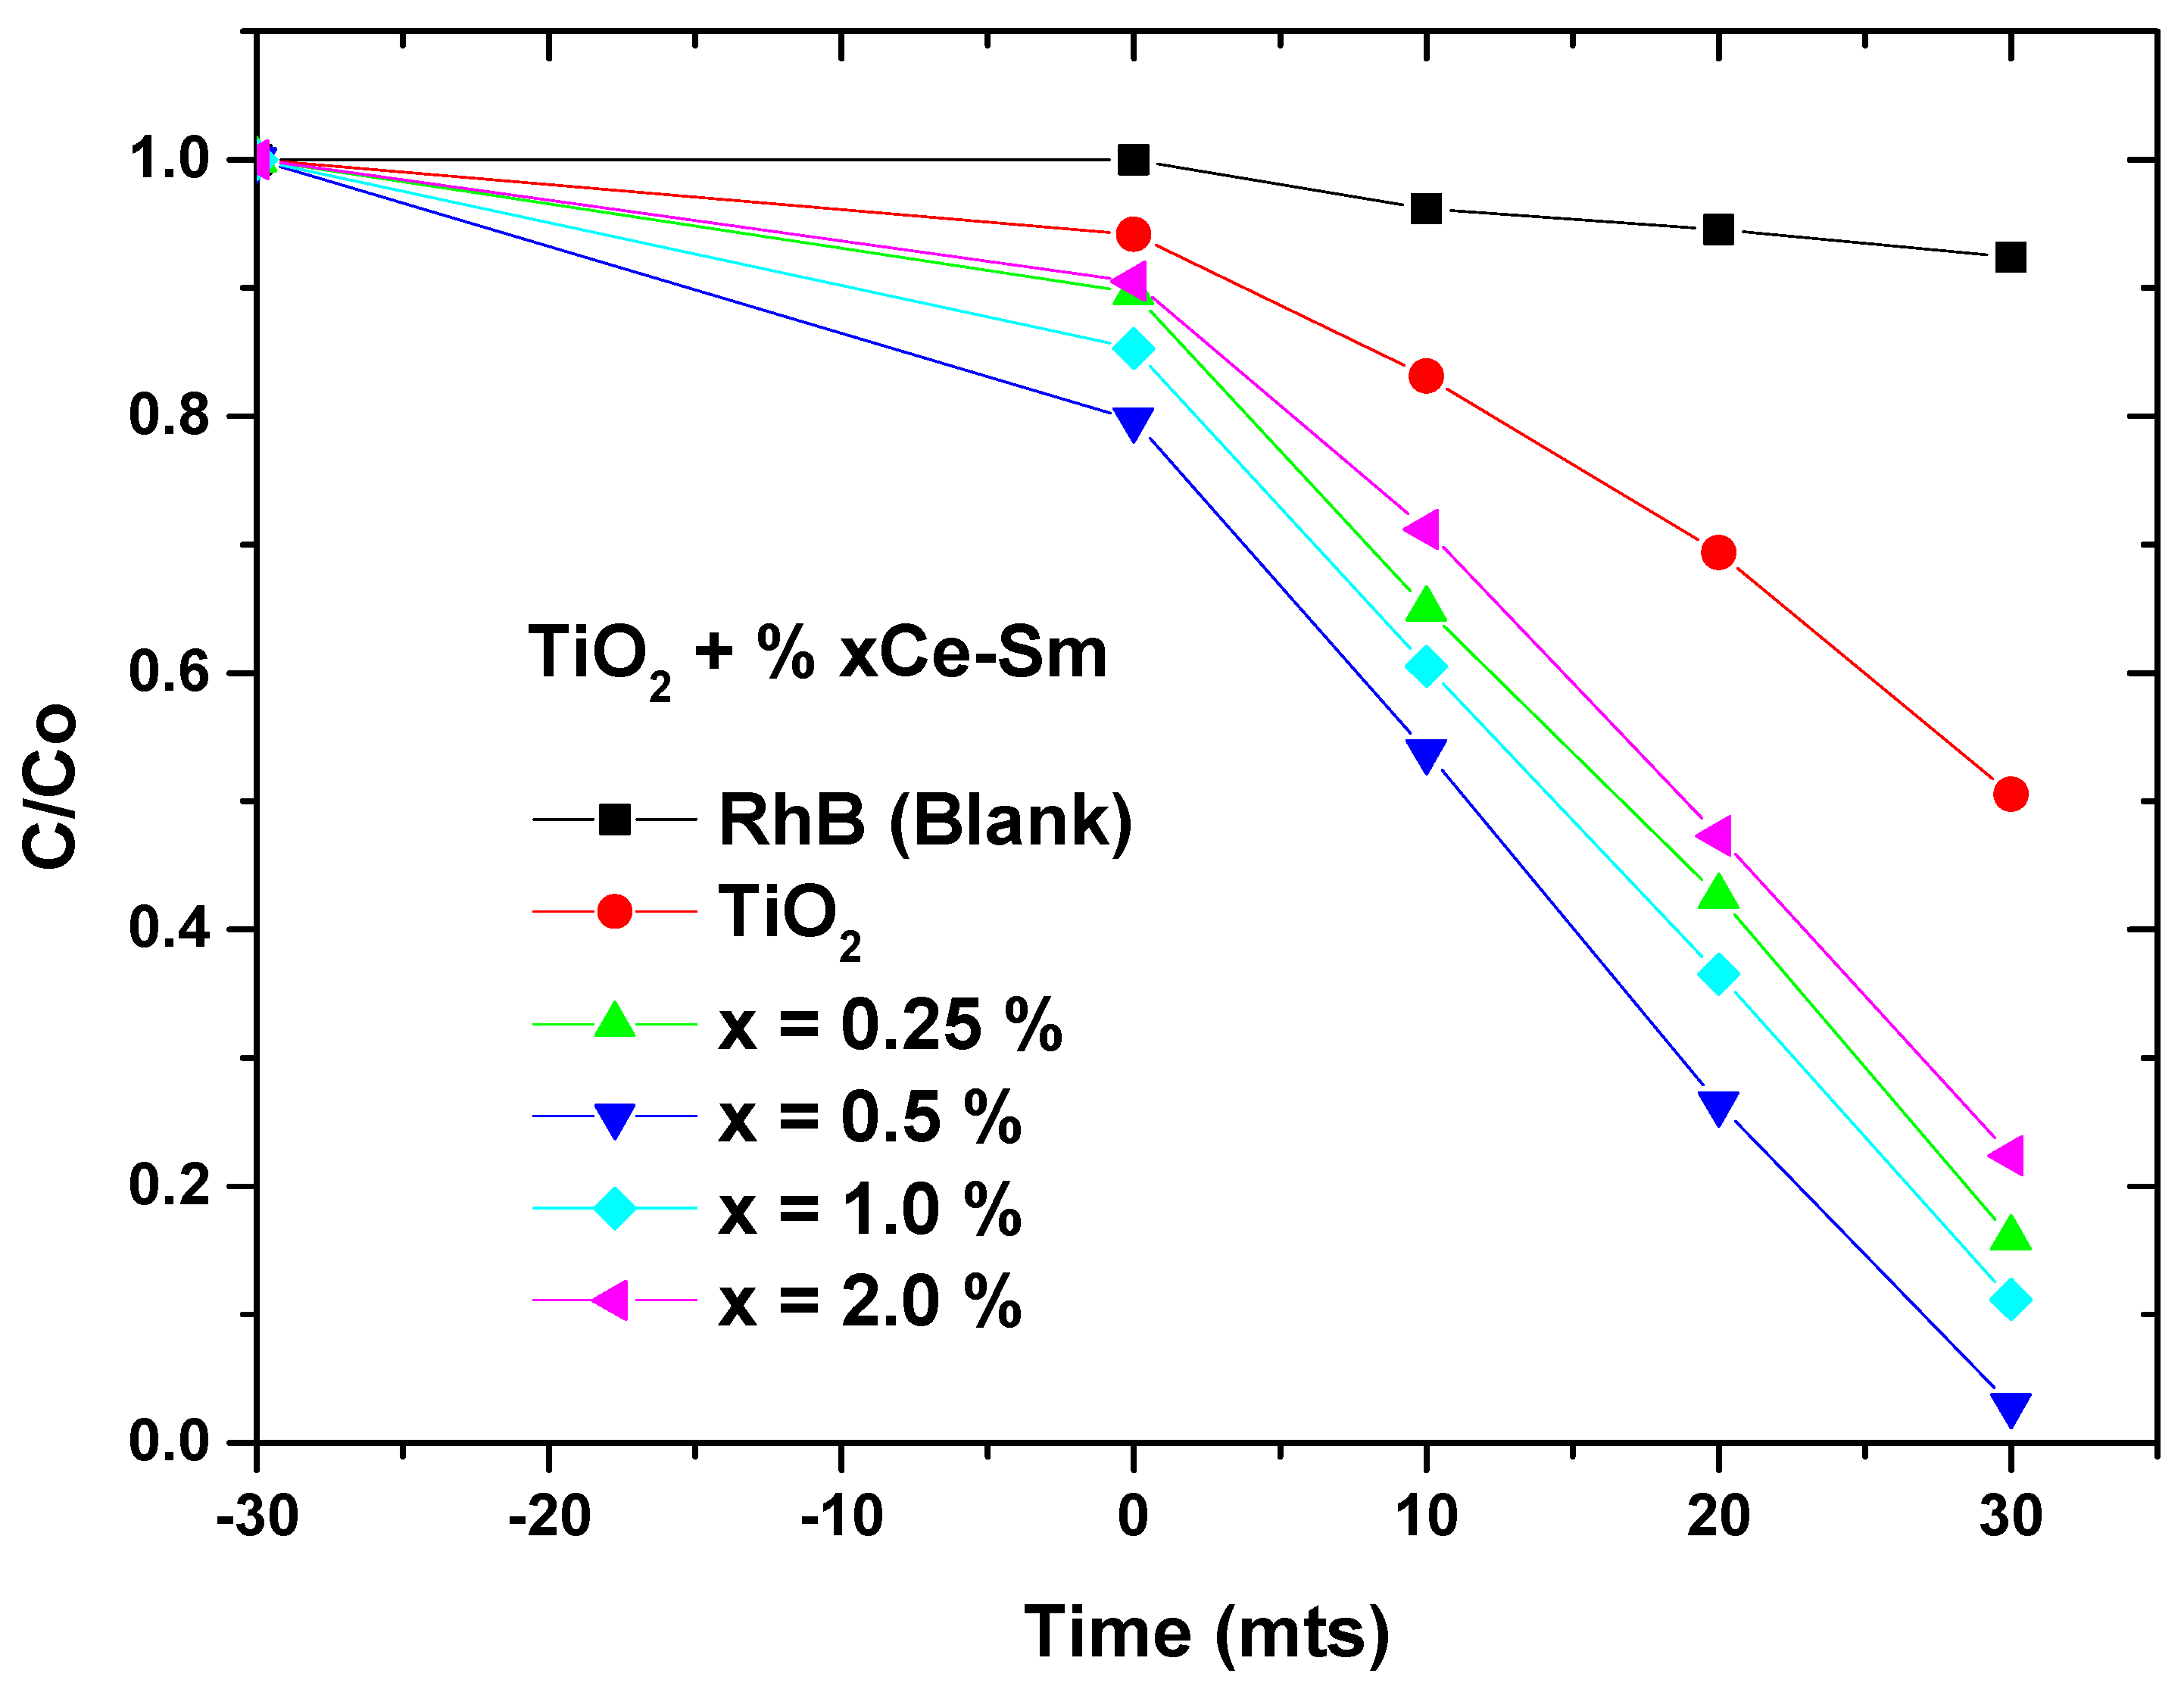
The photocatalytic features of Ce–Sm co-doped TiO2 NPs (x = 0.00, 0.25, 0.50, 1.00, and 2.00%) on the degradation of Rhodamine B (RB) dye as a pollutant were investigated under visible light radiation. As a tracking parameter, the temporal variations in the absorption peak with time (−30, 0, 10, 20, and 30 min) were investigated. Figure 9 illustrates the absorption spectra of blank, pristine TiO2 NPs and Ce–Sm co-doped TiO2 NPs as nano-photocatalysts. It is obvious from Figure 9a that RB dye without a catalyst in the solution is hardly degraded solely by visible light irradiation. In the presence of NPs in the RB dye solution, the intensity of the absorption peak progressively reduces under visible light irradiation, which indicates that the Ce–Sm co-doped TiO2 NPs enhance the dye photo-degradation. This demonstrates that RB was demethylated via the demolition of the chromophore structure of the dye [53]. The pristine TiO2 NPs (Figure 9b) showed an insignificant increase in the degradation of RB dye with a removal efficiency of about 50% after 30 min. However, the degradation of different samples of Ce–Sm co-doped TiO2 NPs showed a significant gradual increase from x = 0.00% to x = 0.50%, and then a gradual decrease at x = 1.0% and x = 2.0% compositions. This occurred because, if the dopant ion concentration exceeds 0.50%, the excess dopants can cover the surface of TiO2, which leads to a decrease in the concentration of the photogenerated charge carrier, and thus the photocatalytic activity decreases, as is clear from Figure 9c–f. It is worth mentioning that the x = 0.5% composition showed the extreme absorption curve of the RB dye solution with the shortest degradation time of 30 min, which indicates that the x = 0.5% composition has a photocatalytic performance better than that of other ratios.
Figure 10 presents the degradation percentage (%) of RB dye against the different concentrations of Ce–Sm co-dopants after 30 min of visible light illumination. It is evident that the presence of NPs helps significantly in degrading the RB dye. The pristine TiO2 NPs showed an RB dye degradation % of about 50% after 30 min. The RB dye degradation % increases gradually with the increasing concentration of Ce–Sm co-dopants to reach a degradation efficiency of about 85% and 98% for x = 0.25% and 0.50%, respectively. With the further increase in the concentration of Ce–Sm co-dopants, the RB dye degradation % decreases to about 90% and 79% for x = 1.00% and 2.00%, respectively. The highest degradation efficiency was noted for TiO2 nanoparticles co-doped with x = 0.50% of Ce and Sm ions with 98% decomposition. Hence, an optimal concentration of Ce–Sm as co-dopants within the structure of TiO2 NPs could enhance the photocatalytic activity against pollutants.
In Table 2, we present some previous photocatalytic results reported for TiO2-based materials in comparison with the present results. As shown in this table, Ce–Sm co-doped TiO2 NPs showed a greatly enhanced photocatalytic activity in comparison with other TiO2-based compositions.
For further investigation, the percent degradation with time for all samples under UV/Vis light was plotted, and the plots are shown in Figure 11 [63,64]. The degradation rate of TiO2 NPs is a bit slow because the band gap is too broad to be excited by visible light [65]. However, the degradation rates of Ce–Sm co-doped TiO2 NPs are much higher because of the inhibition of photogenerated electron–hole recombination [65]. The improvement in the degradation rate rapidly decreased for Ce–Sm co-doped TiO2 NPs with x = 0.50%.
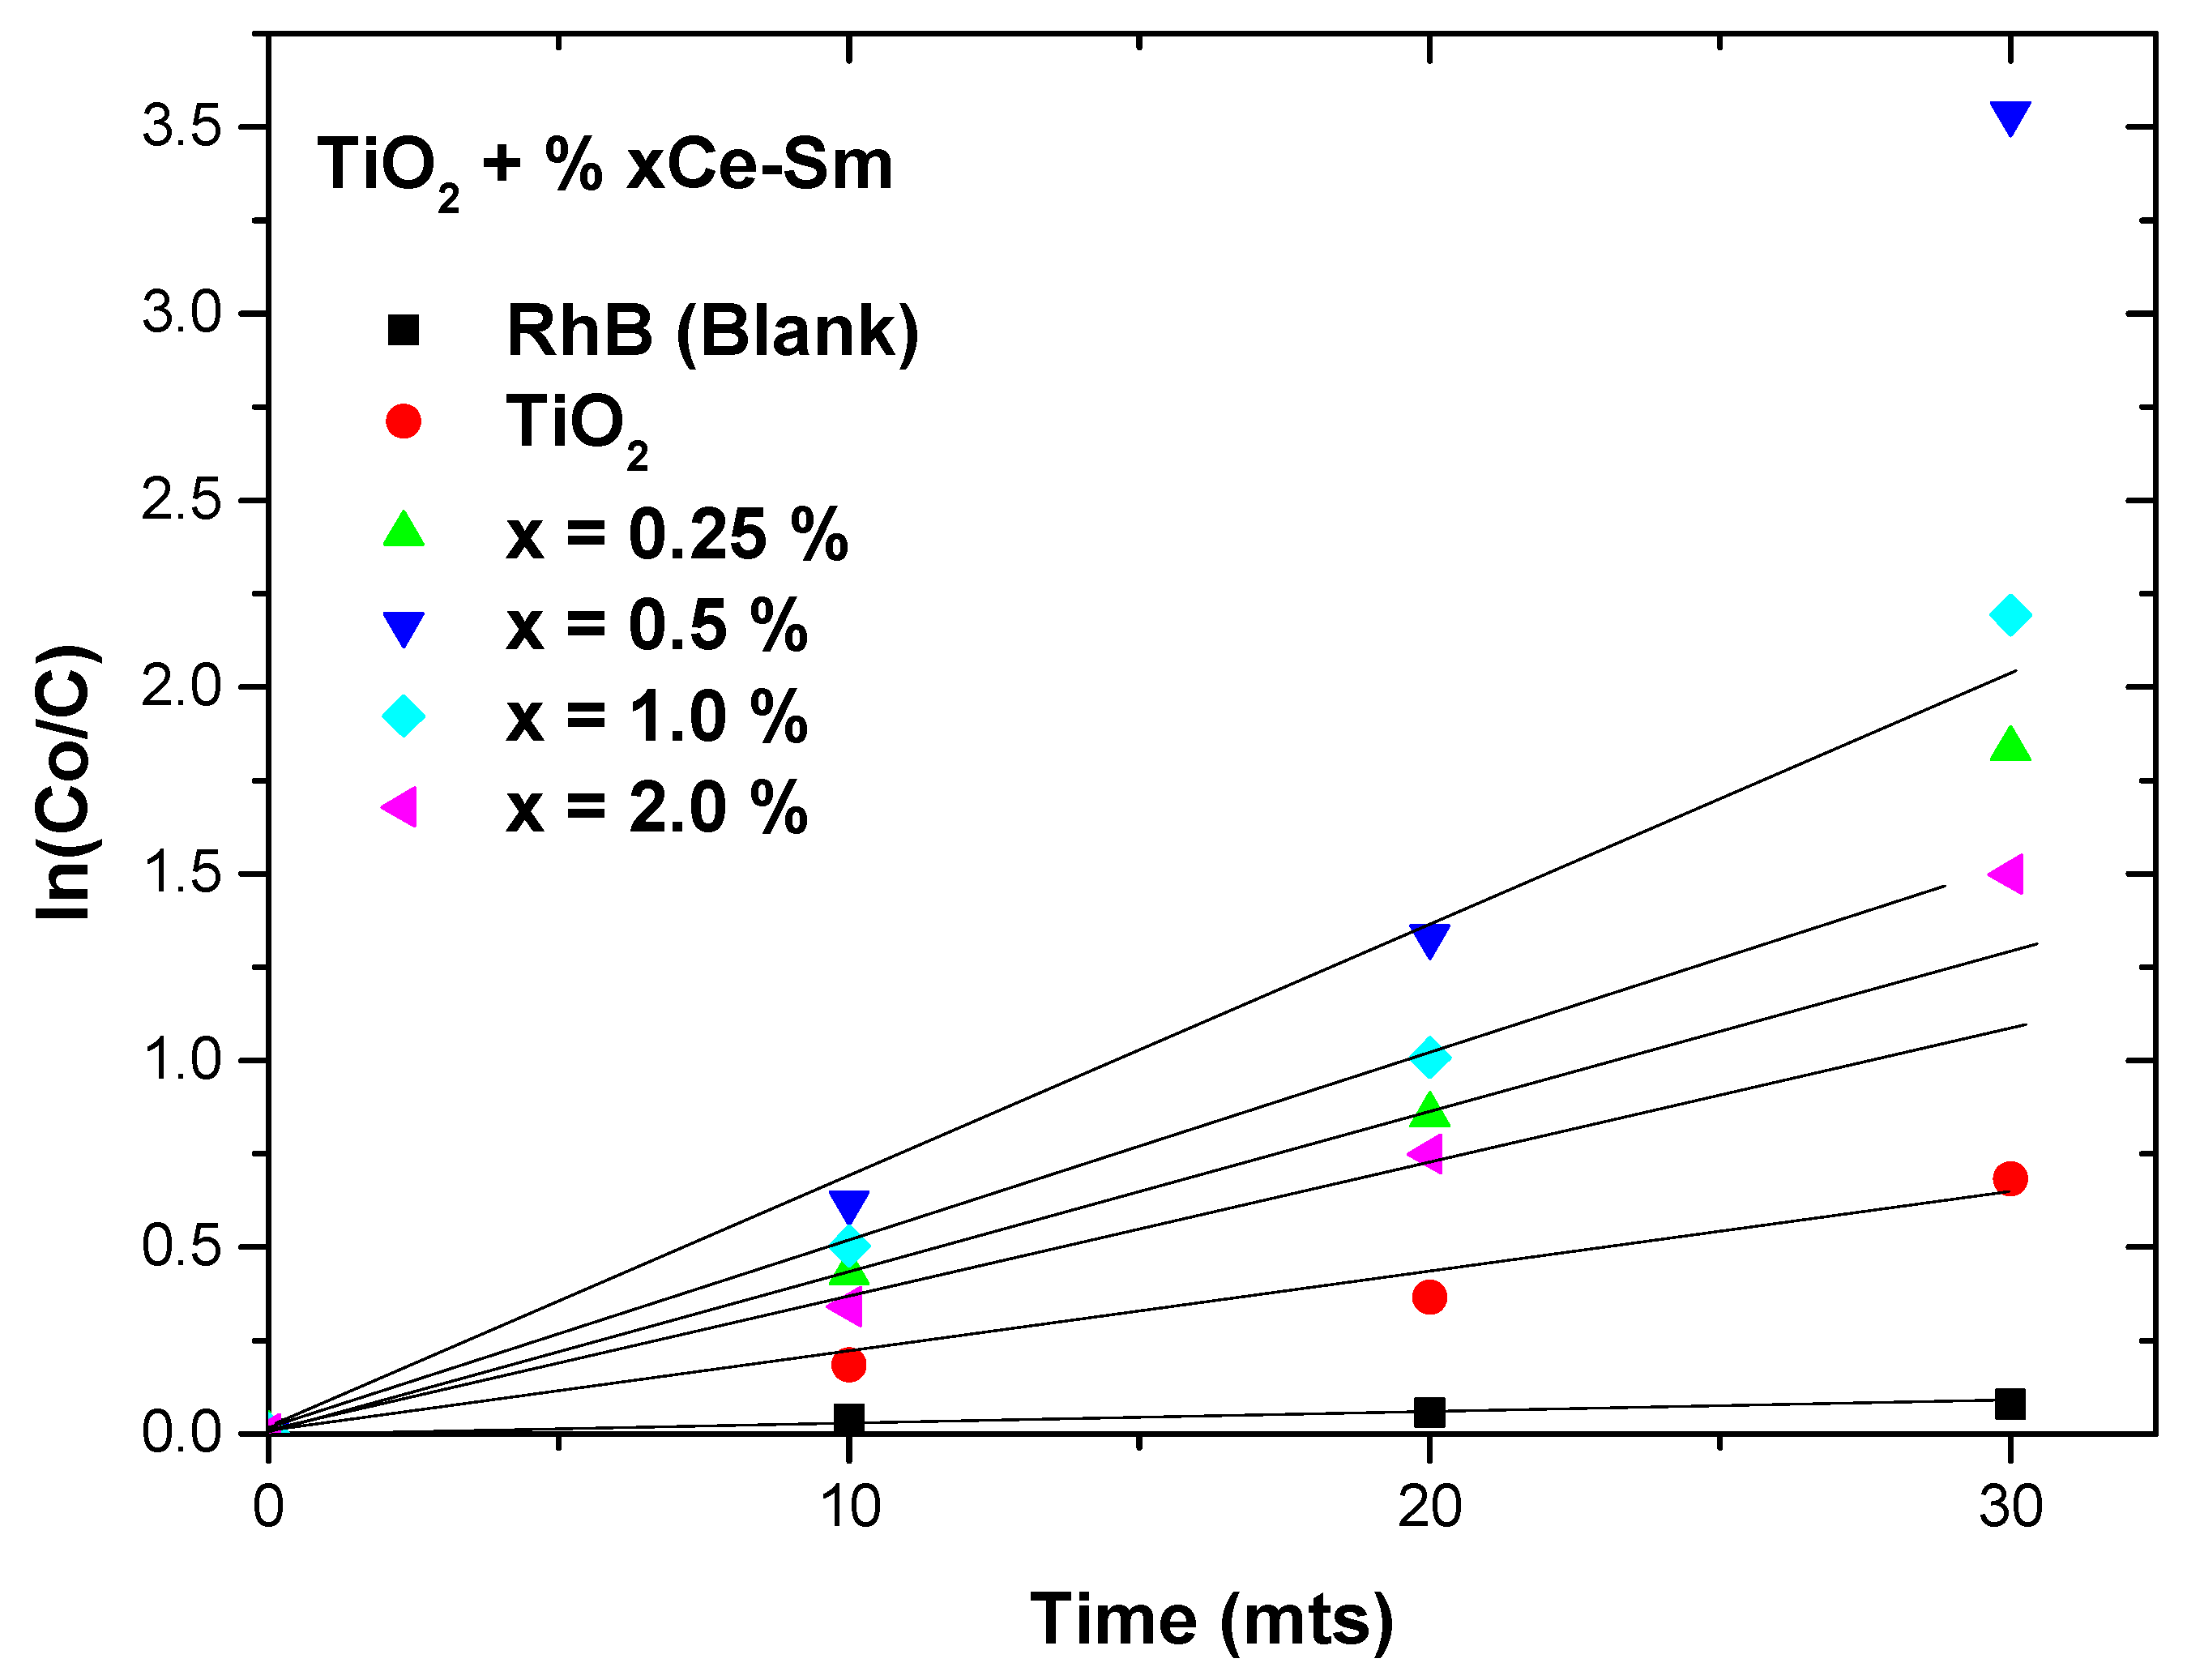
Pseudo-first-order kinetics was applied to calculate the kinetics constant (k) values of Ce–Sm co-doped TiO2 NPs (x = 0.00, 0.25, 0.50, 1.0, and 2.0%). Accordingly, curves of ln(C0/C) versus time were plotted (Figure 12) [66]. The rate constants determined from the slope were used to evaluate the photocatalytic activity of the prepared nanoparticles. The best reaction rate constant was observed for Ce–Sm co-doped TiO2 NPs with x = 0.50% of about 0.0616 min−1, which is almost four times greater than that of pure TiO2 NPs of 0.0149 min−1 after 30 min of visible light illumination. The other compositions revealed rate constants of about 0.0367 min−1, 0.0434 min−1, and 0.0303 min−1 for x = 0.25%, 1.00%, and 2.00%, respectively.
The reusability and stability of the Ce–Sm co-doped TiO2 NPs are among the important factors of nano-photocatalysts for the degradation of dyes. Accordingly, Ce–Sm co-doped TiO2 NPs with x = 0.50% were subjected to consecutive photocatalytic experiments against RB dye under the same starting conditions to verify their stability (Figure 13). After each experiment, centrifugation was used to recover the nanoparticles, which will be then dried in the oven and ground again using agate mortar. These experiments were repeated three times consecutively and the RB dye photocatalytic % was found to be higher than 94%, which is not drastically diminished, as presented in Figure 13. The obtained results suggest that the present nano-photocatalysts display great photocatalytic activities and are highly stable and easily recovered and reused, indicating their potential for practical applications in the future.
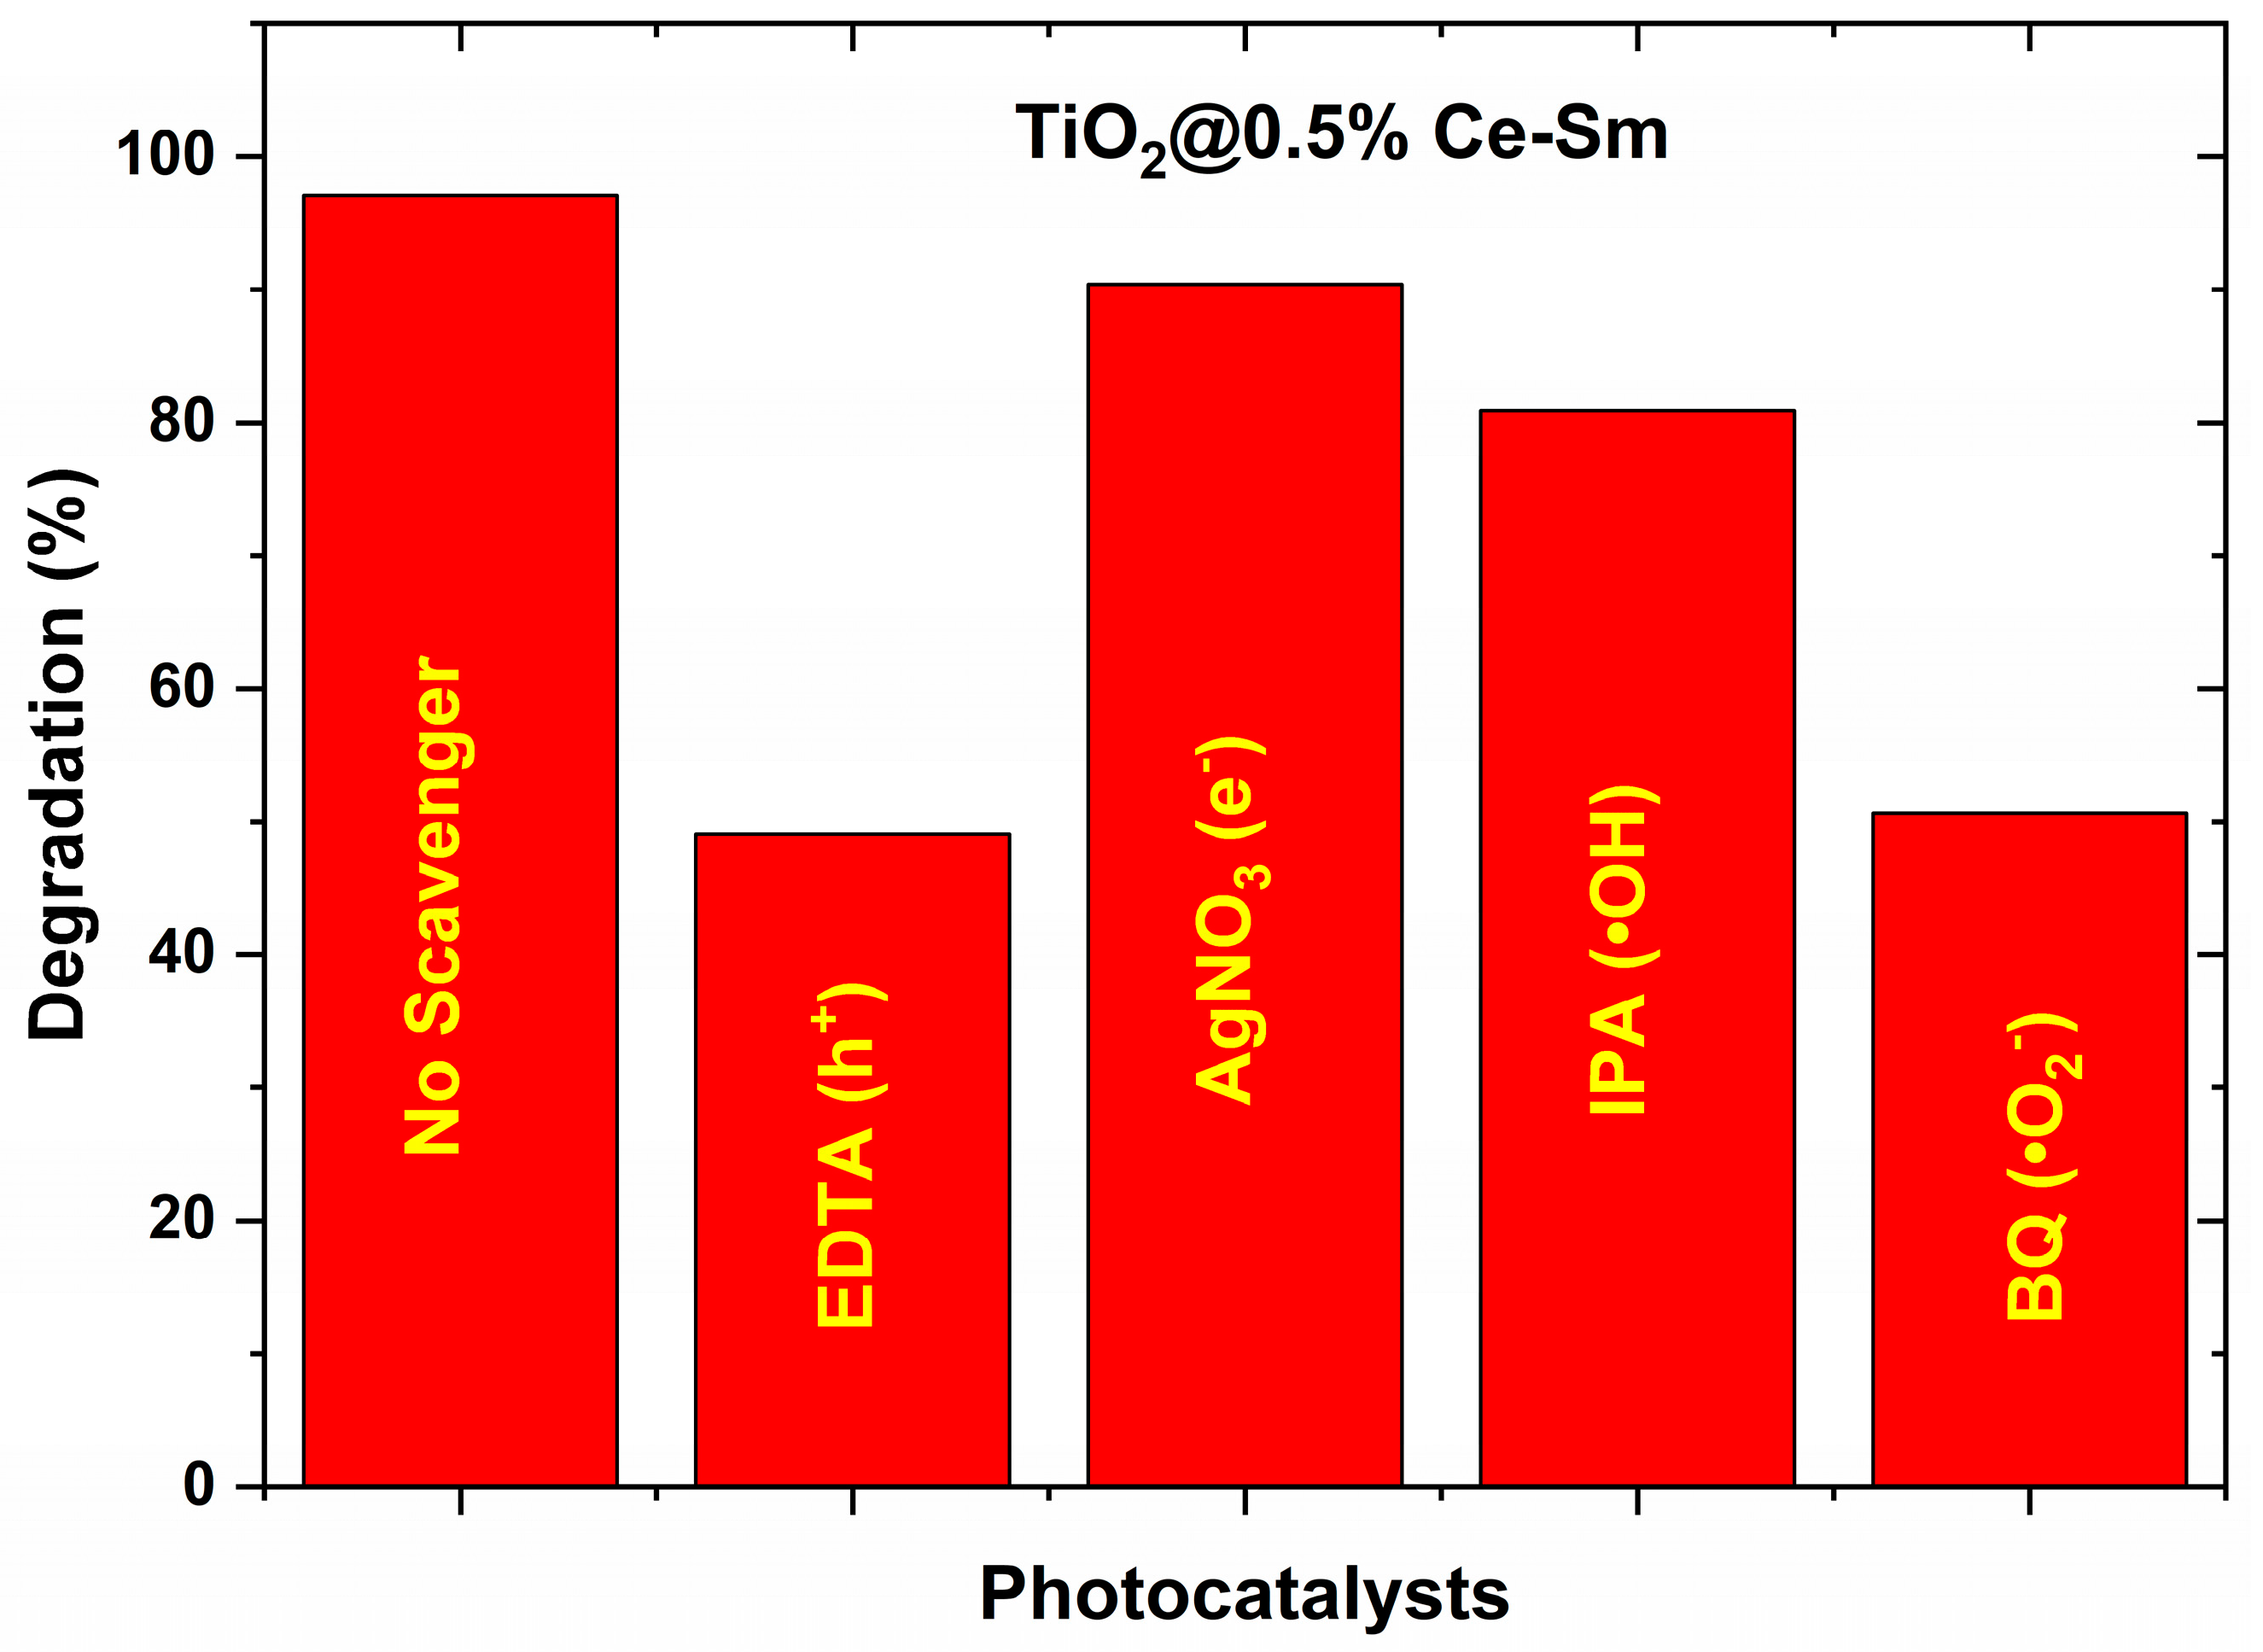
The probable active species involved in the photocatalytic degradation process were examined using various scavengers. In most cases, four active species are involved in the photocatalytic degradation process. These are •O2, •OH, e, and h+; various scavengers were introduced, correspondingly, in the photocatalytic degradation system, and other conditions were the same as those indicated in “2.4. Photocatalytic activity”. The scavengers are isopropanol, IPA (•OH scavenger); ethylenediaminetetraacetic acid, EDTA (h+ scavenger); 1,4-benzoquinone, BQ (•O2 scavenger); and silver nitrate, AgNO3 (e scavenger), respectively. Figure 14 shows that h+ and •O2 play the most critical roles in the degradation of RB, because the inclusion of scavengers for these two active species reduces the degradation capacity significantly. •OH is also shown to be involved in the degradation, as the addition of IPA may also influence the degradation. h+, •O2, and •OH are three highly oxidative species. According to these findings, their significant oxidative activities might be used to degrade RB in this photocatalysis process. It is worth noting that the addition of AgNO3 can promote degradation. The reason is that AgNO3 may consume e as an e scavenger, which reduces the recombination of e–h+ pairs and enhances the photocatalytic activity.
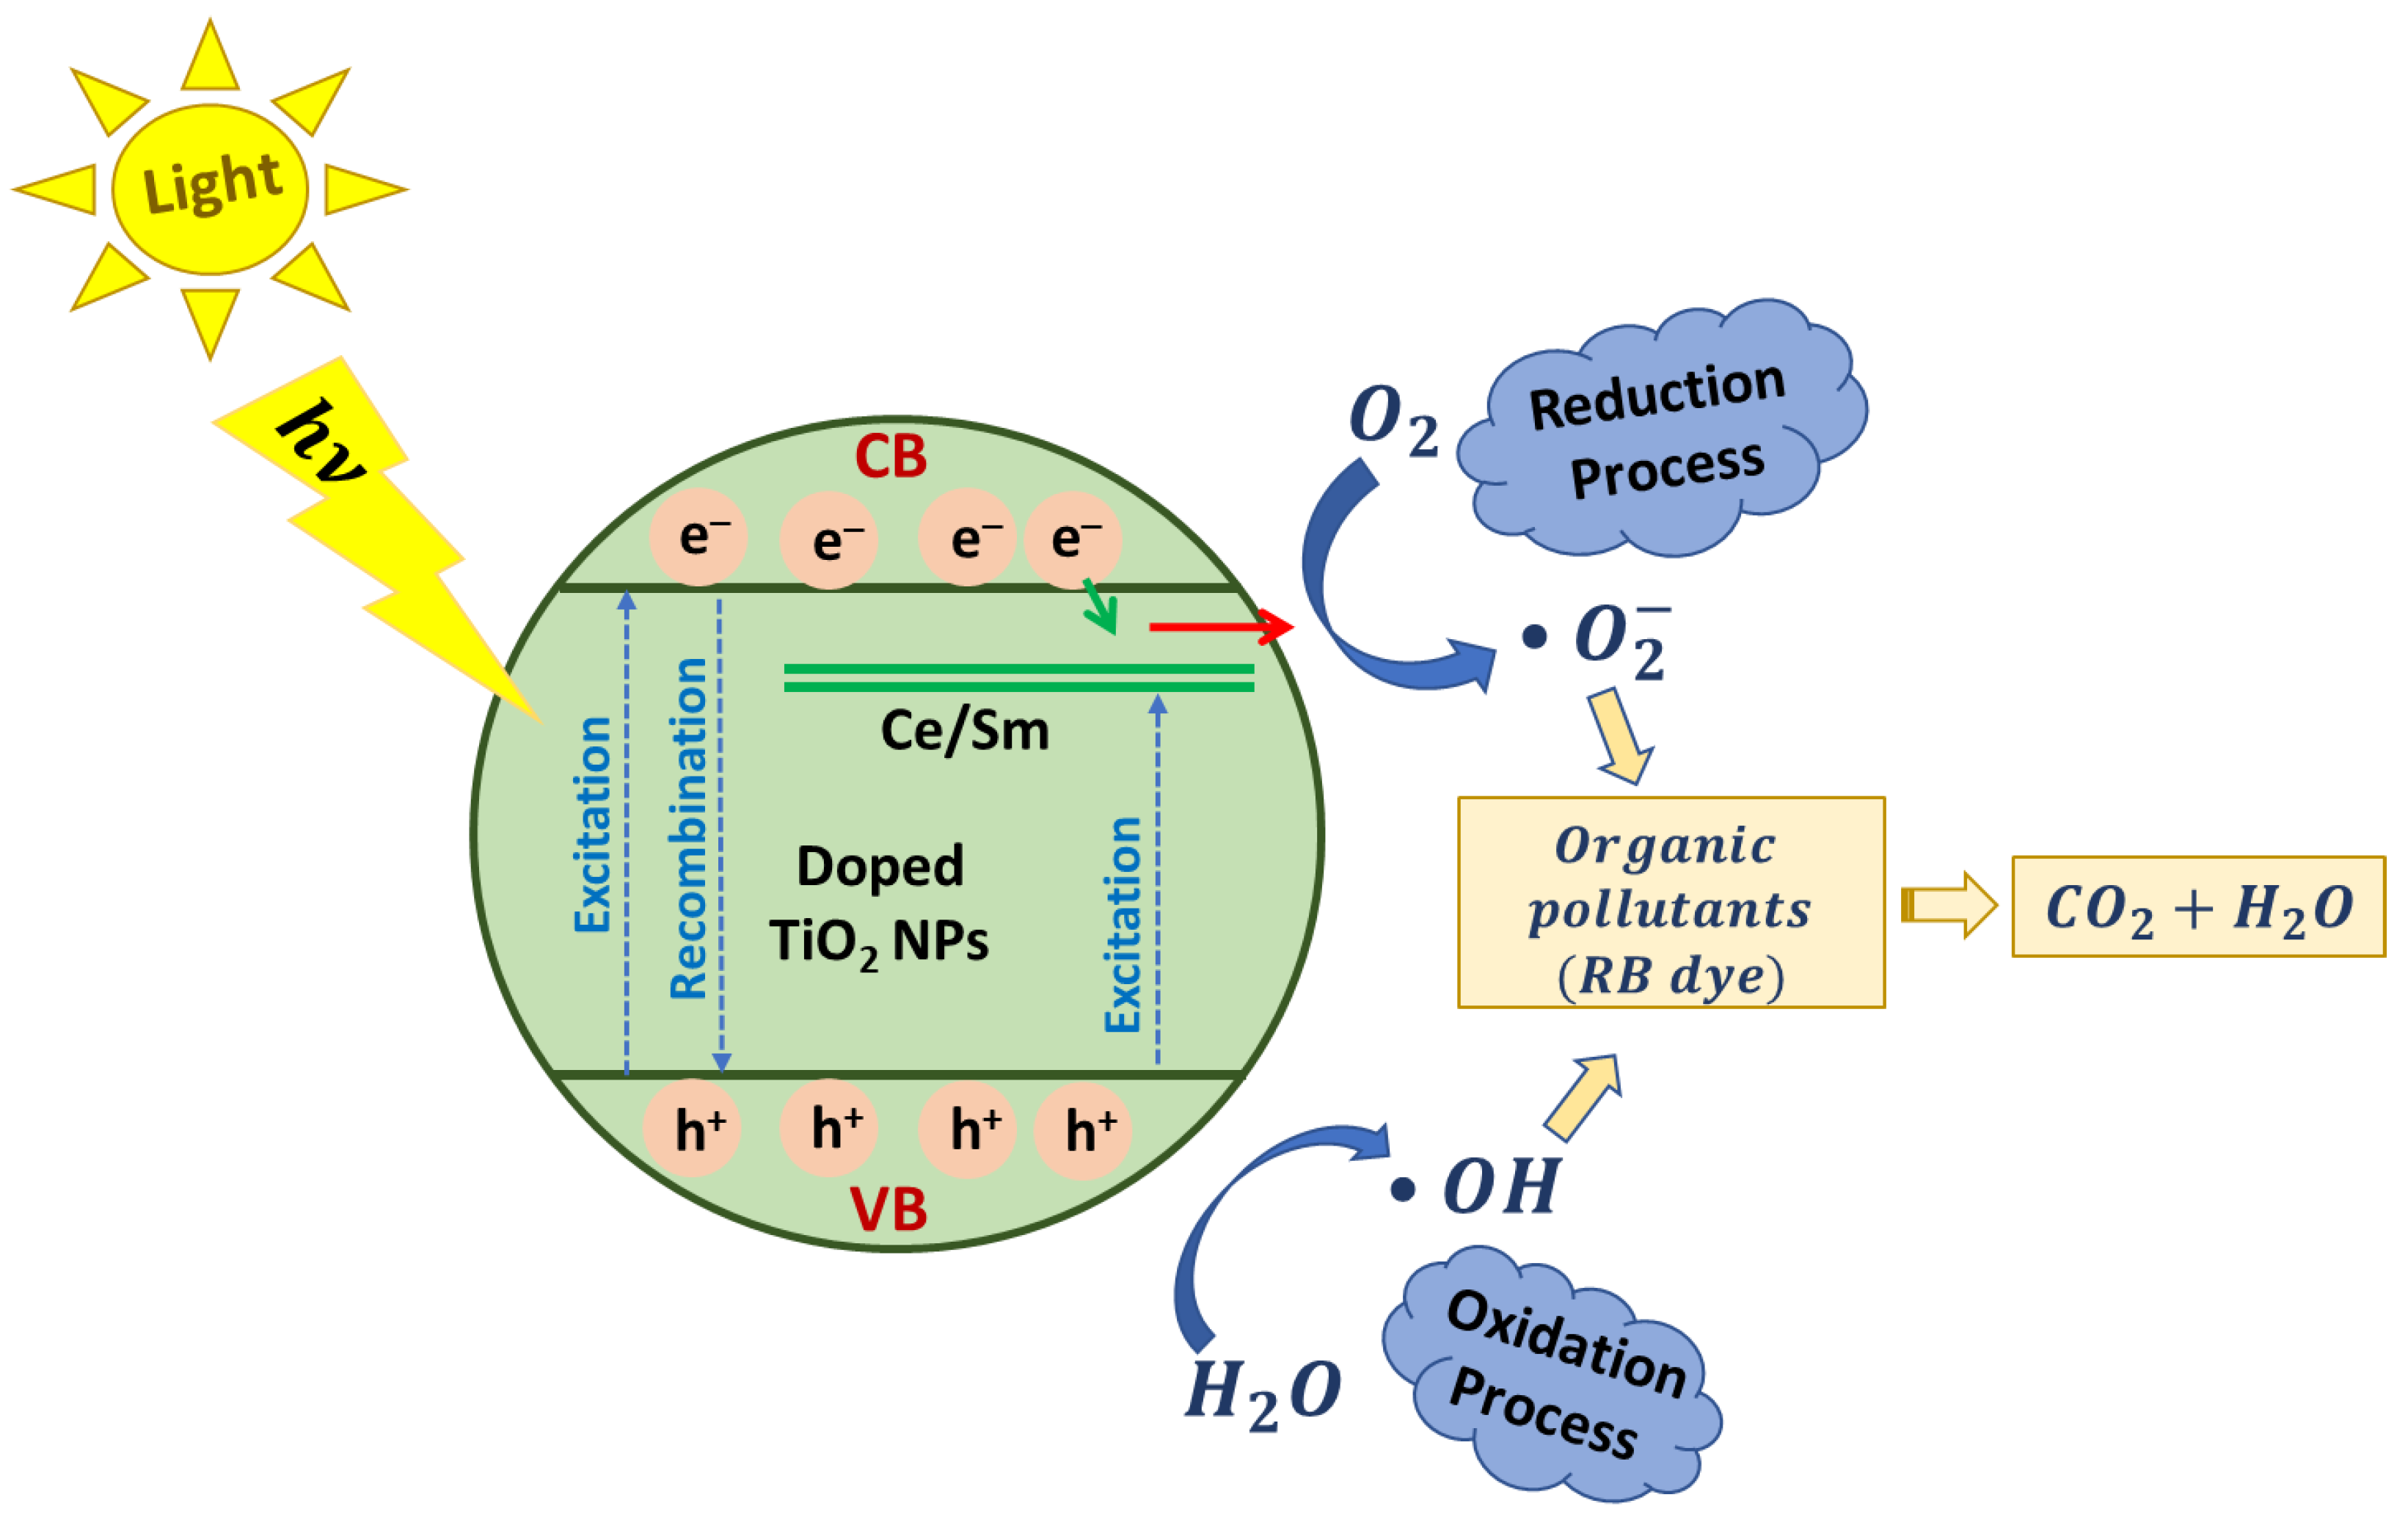
The mechanism can be described as shown in Figure 15. Once the TiO2 NPs are subjected to light illumination, the electrons (e) within the valence band (VB) are excited to the conduction band (CB), generating electron–hole (e–h+) pairs. When the electrons (e) react with the oxygen molecules (O2) to generate superoxide radicals (•O2), the holes (h+) in VB can directly destroy RB molecules or mix with water molecules adsorbed on the surface of the nano-photocatalysts to create hydroxyl radicals ( O H ). These hydroxyl radicals are effective oxidation agents that destroy organic pollutants. This procedure thus causes photo-oxidation of the organic pollutants with the subsequent steps [67]: (a) adsorption of light by the nano-photocatalysts, (b) generation of e–h+ pairs, (c) charge carriers’ recombination, and (d) reactants’ use of charge carriers. On the other hand, the boost in the photocatalytic activities of Ce–Sm co-doped TiO2 NPs is mainly attributable to the dual inclusion of Ce4+ and Sm3+ cations and the defects generated in the TiO2 anatase structure. Ce–Sm co-doped TiO2 NPs would create large amounts of oxygen vacancies because of the existence of Ce4+ and Sm3+ ions. Hence, Ce4+ and Sm3+ ions can act as scavengers for electrons. They may generate interbond defects below CB, acting as traps for the transition of electrons, and thus lowering the recombination process of e–h+ pairs. Consequently, the photocatalytic efficiency of nanoparticles will be enhanced.
Nevertheless, the photocatalytic efficiency is also dependent on the crystal structure of NPs, particle size distribution, and morphology [68]. In summary, depending on the findings, the photocatalytic activities of the present nanoparticles are considerably influenced by many factors, such as the preparation method of co-doped TiO2 NPs using the sol–gel auto-combustion technique, which can lead to a large surface area and agglomerated nanosized particles, which could enhance the photocatalytic efficiency. Moreover, the dual doping of rare earths (Ce and Sm) has been discovered to be helpful in shifting the impurity states and boosting the 4f electrons interface between the TiO2 intrinsic bands and impurity states, leading to a reduction in bandgap energy [69].

3. Experimental Details

3.1. Materials

The chemicals titanium(IV) isopropoxide (C12H28O4Ti; 98%; Thermo Fisher Scientific, Waltham, MA, USA), cerium(III) nitrate hexahydrate (Ce(NO3)3·6H2O; 99.99%; Loba Chemie, Mumbai, India), samarium(III) nitrate hexahydtrate (Sm(NO3)3·6H2O; 99.9%; Sigma Aldrich, St. Louis, MI, USA), citric acid (C6H8O7; 99+%; Aldrich), ammonium hydroxide solution (NH4OH), and absolute ethanol (CH3CH2OH) were used as raw materials without further purification.

3.2. Synthesis of Pristine and Ce–Sm Co-Doped TiO2 NPs

Pristine TiO2 and Ce–Sm co-doped TiO2 NPs were prepared using the sol–gel auto-combustion approach. The procedure could be described as follows. An appropriate amount of titanium isopropoxide was dissolved in a beaker containing an ethanolic solution and citric acid mixture under vigorous stirring. In other beakers, appropriate amounts of rare-earth-based nitrates of Ce and Sm were dissolved in deionized water under stirring. The amounts of doped Sm3+ and Ce3+ ions were x = 0.00, 0.25, 0.50, 1.00, and 2.00%. After a while, the different solutions were mixed into one beaker and left under continuous stirring for 2 h. Then, the pH value was adjusted to about 6–7 with ammonia. Some amount of water was evaporated by heating the solution above a hot plate at a temperature of about 80 °C for 3 h. Under continuous stirring and heating, a precursor gel was then gradually created. Later, the temperature was raised to about 150 °C for 30 min and then to about 280 °C until the sample was auto-ignited. The obtained as-combusted powders were finely ground in an agate mortar and then transferred for calcination at 500 °C for 2 h in a furnace. TiO2 nanoparticles co-doped with different concentrations of Ce–Sm ions (x = 0.00, 0.25, 0.50, 1.00, and 2.00%) were finally obtained. The wight and/or volume of different precursors used is listed in Table 3.

3.3. Characterization Techniques

The crystalline phases of prepared NPs were studied with a benchtop X-ray diffractometer (Miniflex 600, Rigaku, Japan) with Cu Kα radiation of λ = 1.5406 Å and a scan rate of 0.02° per second. The values of crystallite size (DXRD) were estimated from XRD patterns by applying the Scherrer equation [70]:
D X R D = K λ β c o s θ
where λ is the wavelength of X-rays, K is a constant (~0.94), θ is the diffraction angle, and β is the full width at half maximum (FWHM). The morphology and size of the prepared products were observed by a transmission electron microscopy (TEM, FEI Morgagni 268, Czech Republic). The chemical composition by elemental mapping was determined by energy-dispersive X-ray spectrometry (EDXS) coupled with a scanning electron microscopy (SEM, Tescan Vega 3, Tescan Orsay Holding, Brno, Czech Republic). To investigate the electronic properties, density functional theory (DFT) calculations were performed using QuantumATK software (Synopsys, Mountain View, CA, USA, 2021).
The optical properties were studied in a wavelength interval of 200–800 nm by means of an ultraviolet/visible (UV/Vis) spectrophotometer (JASCO V-750, JASCO Corp, Tokyo, Japan). The values of band gap energy (Eg) can be estimated using the Kubelka–Munk function F(R) and Tauc plots [71,72]:
F R = α = 1 R 2 R
α h ν = α ( h ν E g ) n
where R is the reflectance, ν is the frequency, h is the Planck constant, h ν is the photon energy, and α is a constant representing the absorption coefficient. The exponent n specifies the nature of optical transition, where n = 1 / 2 and n = 2 represent direct and indirect band gaps, respectively. Hence, by plotting [F(R)]2 against hv and [F(R)]1/2 against (called Tauc plots), one can determine the values of Eg, direct and Eg, indirect, respectively.

3.4. Photocatalytic Activity

The photocatalytic degradation of Rhodamine B (RB) dye was performed under the irradiation of visible light sources in the presence of nano-catalysts. An amount of the nanocatalyst was dispersed in a solution containing 50 mL of RB (10 ppm) dye. Before light illumination (dark condition), the mixture was constantly stirred for 30 min above the magnetic stirrer to achieve an adsorption/desorption equilibrium in the existence of the nanocatalyst. Then, the solution mixture was irradiated with visible light (250 W, Xenon lamp with a cutoff filter of λ ≤ 400 nm) for 30 min. Throughout the experiments, 2 mL of this solution was collected, and the concentration of RB dye at a wavelength of 554 nm was determined using a UV/Vis spectrophotometer (JASCO V-750, JASCO Corp, Tokyo, Japan) and an examination of the absorption spectra in the wavelength range from 400 to 700 nm, respectively. The following equation was used to calculate the degradation efficiency of the dye [73]:
Degradation efficiency % = (C0C/C0) × 100
Here, ‘C0’ (in mg·L−1) is the initial RB dye concentration and ‘C’ (in mg·L−1) is the residual concentration of RB dye.
The kinetics assessment of RB elimination tended to follow pseudo-first-order kinetics. The following equation was used to calculate the photodecomposition rate (k) constant [74]:
ln(C0/C) = kt
To assess the stability of the photocatalyst, the degradation experiment was repeated for up to three cycles in the same environment. The photocatalyst was separated after each degradation test by washing and filtering the solution for the next photocatalytic activity test.
In addition, to determine the reactive oxygen species (ROS) of the photocatalytic activity, trapping experiments were carried out using various radical scavengers [75] such as isopropanol (IPA, 10 mM), ethylenediaminetetraacetic acid (EDTA, 10 mM), 1,4-benzoquinone (BQ, 1 mM), and silver nitrate (AgNO3, 10 mM), which acted as the scavengers for hydroxyl radicals (•OH), holes (h+), superoxide radicals (•O2), and electrons (e), respectively.

4. Conclusions

In this study, highly photocatalytic active Ce–Sm co-doped TiO2 NPs (x = 0.00, 0.25, 0.50, 1.00, and 2.00%) were successfully synthesized through the sol–gel auto-combustion approach. The analyses using XRD, TEM, and elemental mapping techniques confirmed the development of spherical nanoparticles with a tetragonal anatase TiO2 structure and an average crystallite size of 15.1–17.8 nm. A reduction in particle size was noticed upon the inclusion of Ce–Sm co-dopants. DFT calculations and UV/Vis diffuse spectra showed a reduction in Eg values with Ce–Sm co-doping. The photocatalytic activities of the synthesized nanoparticles were assessed against RB dye. The exploration of absorbance results indicated that the different Ce–Sm co-doped TiO2 nanoparticles display enhanced photocatalytic activities in comparison with pristine TiO2 nanoparticles. Interestingly, the sample co-doped with an x content of 0.50% displayed the best photocatalytic activity among the different prepared nanoparticles, where the photo-degradation efficiency reached about 98% within 30 min. h+ and •O2 are the most important active species in photocatalytic degradation, and •OH is also involved in the degradation. In addition to having good photocatalytic activities, the present nano-photocatalysts are highly stable, easily recovered, and easily reused, indicating their potential for practical applications in the future.

Author Contributions

Conceptualization, Y.S. and E.H.; Methodology, Y.S. and E.H.; Validation, Y.S. and E.H.; Formal analysis, Y.S., M.A.A., M.J.S.M., E.H., S.C., S.A., A.B. and M.A.G.; Investigation, Y.S., M.A.A., M.J.S.M., E.H. and S.A.; Resources, Y.S., M.J.S.M. and M.A.G.; Data curation, Y.S.; Writing—original draft preparation, Y.S., M.A.A., E.H. and S.C.; Writing—review and editing, Y.S., M.J.S.M., E.H., A.B. and M.A.G.; Supervision, Y.S. and E.H. All authors have read and agreed to the published version of the manuscript.

Funding

This research received no external funding.

Data Availability Statement

Not applicable.

Acknowledgments

The authors are thankful to the Institute for Research and Medical Consultations (IMRC) of Imam Abdulrahman Bin Faisal University (Saudi Arabia) for providing laboratory facilities. The authors are also thankful to the King Fahd University of Petroleum and Minerals (KFUPM) for using the laboratory facilities.

Conflicts of Interest

The authors declare no conflict of interest.

References

  1. Hannachi, E.; Slimani, Y.; Nawaz, M.; Trabelsi, Z.; Yasin, G.; Bilal, M.; Almessiere, M.A.; Baykal, A.; Thakur, A.; Thakur, P. Synthesis, characterization, and evaluation of the photocatalytic properties of zinc oxide co-doped with lanthanides elements. J. Phys. Chem. Solids 2022, 170, 110910. [Google Scholar] [CrossRef]
  2. Rizwan, K.; Bilal, M.; Slimani, Y.; Show, P.L.; Rtimi, S.; Roy, A.; Iqbal, H.M.N. Hydrogen-based sono-hybrid catalytic degradation and mitigation of industrially-originated dye-based pollutants. Int. J. Hydrogen Energy 2023, 48, 6597–6612. [Google Scholar] [CrossRef]
  3. Lops, C.; Ancona, A.; Di Cesare, K.; Dumontel, B.; Garino, N.; Canavese, G.; Hérnandez, S.; Cauda, V. Sonophotocatalytic degradation mechanisms of Rhodamine B dye via radicals generation by micro- and nano-particles of ZnO. Appl. Catal. B Environ. 2019, 243, 629–640. [Google Scholar] [CrossRef] [PubMed]
  4. Sadiq, M.M.J.; Shenoy, U.S.; Bhat, D.K. NiWO4-ZnO-NRGO ternary nanocomposite as an efficient photocatalyst for degradation of methylene blue and reduction of 4-nitro phenol. J. Phys. Chem. Solids 2017, 109, 124–133. [Google Scholar] [CrossRef]
  5. Da Silva, W.L.; Hamilton, J.W.J.; Sharma, P.K.; Dunlop, P.S.M.; Byrne, J.A.; Dos Santos, J.H.Z. Agro and industrial residues: Potential raw materials for photocatalyst development. J. Photochem. Photobiol. A 2021, 411, 113184. [Google Scholar] [CrossRef]
  6. Muraro, P.C.L.; Wouters, R.D.; Pavoski, G.; Espinosa, D.C.R.; Ruiz, Y.P.M.; Galembeck, A.; Rech, V.C.; da Silva, W.L. Ag/TiNPS nanocatalyst: Biosynthesis, characterization and photocatalytic activity. J. Photochem. Photobiol. A 2023, 439, 114598. [Google Scholar] [CrossRef]
  7. Wouters, R.D.M.; Muraro, P.C.L.; Druzian, D.M.; Viana, A.R.; de Oliveira Pinto, E.; da Silva, J.K.L.; Vizzotto, B.S.; Ruiz, Y.P.M.; Galembeck, A.; Pavoski, G.; et al. Zinc oxide nanoparticles: Biosynthesis, characterization, biological activity and photocatalytic degradation for tartrazine yellow dye. J. Mol. Liq. 2023, 371, 121090. [Google Scholar] [CrossRef]
  8. Gote, Y.M.; Sinhmar, P.S.; Gogate, P.R. Sonocatalytic Degradation of Chrysoidine R Dye Using Ultrasonically Synthesized NiFe2O4 Catalyst. Catalysts 2023, 13, 597. [Google Scholar] [CrossRef]
  9. Anisuzzaman, S.M.; Joseph, C.G.; Pang, C.K.; Affandi, N.A.; Maruja, S.N.; Vijayan, V. Current Trends in the Utilization of Photolysis and Photocatalysis Treatment Processes for the Remediation of Dye Wastewater: A Short Review. Chem. Eng. 2022, 6, 58. [Google Scholar] [CrossRef]
  10. Ghafoor, A.; Bibi, I.; Ata, S.; Majid, F.; Kamal, S.; Rehman, F.; Iqbal, S.; Aamir, M.; Slimani, Y.; Iqbal, M.; et al. Synthesis and characterization of magnetically separable La1−xBixCr1−yFeyO3 and photocatalytic activity evaluation under visible light. Z. Für. Phys. Chem. 2021, 235, 1413–1431. [Google Scholar] [CrossRef]
  11. Aroh, A.O.; Gimba, C.E.; Omoniyi, K.I.; Abba, H.; Yilleng, M.T. Comparison of photocatalytic degradation of 4-chlorophenol and 3-chlorophenol using silver/palladium nanoparticles doped on TiO2. Int. J. Acad. Res. Bus. Soc. Sci. 2019, 1, 232–254. [Google Scholar]
  12. Aamir, M.; Bibi, I.; Ata, S.; Majid, F.; Alwadai, N.; Almuqrin, A.H.; Albalawi, H.; Slimani, Y.; Bashir, M.; Iqbal, M. Micro-emulsion approach for the fabrication of La1−xGdxCr1−yFeyO3: Magnetic, dielectric and photocatalytic activity evaluation under visible light irradiation. Results Phys. 2021, 23, 104023. [Google Scholar] [CrossRef]
  13. Ajeesha, T.; Ashwini, A.; George, M.; Manikandan, A.; Mary, J.A.; Slimani, Y.; Almessiere, M.A.; Baykal, A. Nickel substituted MgFe2O4 nanoparticles via co-precipitation method for photocatalytic applications. Phys. B 2021, 606, 412660. [Google Scholar] [CrossRef]
  14. Mathiarasu, R.R.; Manikandan, A.; Panneerselvam, K.; George, M.; Raja, K.K.; Almessiere, M.A.; Slimani, Y.; Baykal, A.; Asirii, A.M.; Kamal, T.; et al. Photocatalytic degradation of reactive anionic dyes RB5, RR198 and RY145 via Rare earth element (REE) Lanthanum substituted CaTiO3 perovskite catalysts. J. Mater. Res. Technol. 2021, 15, 5936–5947. [Google Scholar] [CrossRef]
  15. Karthikeyan, C.; Arunachalam, P.; Ramachandran, K.; Al-Mayouf, A.M.; Karuppuchamy, S. Recent advances in semiconductor metal oxides with enhanced methods for solar photocatalytic applications. J. Alloys Compd. 2020, 828, 154281. [Google Scholar] [CrossRef]
  16. Hannachi, E.; Slimani, Y.; Nawaz, M.; Sivakumar, R.; Trabelsi, Z.; Vignesh, R.; Akhtar, S.; Almessiere, M.A.; Baykal, A.; Yasin, G. Preparation of cerium and yttrium doped ZnO nanoparticles and tracking their structural, optical, and photocatalytic performances. J. Rare Earths 2022. [Google Scholar] [CrossRef]
  17. Geetha, G.V.; Sivakumar, R.; Slimani, Y.; Sanjeeviraja, C.; Kannapiran, E. Rare earth (RE: La and Ce) elements doped ZnWO4 nanoparticles for enhanced photocatalytic removal of methylene blue dye from aquatic environment. Phys. B 2022, 239, 414028. [Google Scholar] [CrossRef]
  18. Police, A.K.R.; Vattikuti, S.V.P.; Mandari, K.K.; Chennaiahgari, M.; Sharma, P.; Valluri, D.K.; Byon, C. Bismuth oxide cocatalyst and copper oxide sensitizer in Cu2O/TiO2/Bi2O3 ternary photocatalyst for efficient hydrogen production under solar light irradiation. Ceram. Int. 2018, 44, 11783–11791. [Google Scholar] [CrossRef]
  19. Chand, K.; Cao, D.; Fouad, D.E.; Lakhan, M.N.; Dayo, A.Q.; Sagar, H.J.; Zhu, K.; Mohamed, A.M.A. Photocatalytic and antimicrobial activity of biosynthesized silver and titanium dioxide nanoparticles: A comparative study. J. Mol. Liq. 2020, 316, 113821. [Google Scholar] [CrossRef]
  20. Al Jitan, S.; Palmisano, G.; Garlisi, C. Synthesis and surface modification of TiO2-based photocatalysts for the conversion of CO2. Catalysts 2020, 10, 227. [Google Scholar]
  21. Police, A.K.R.; Vattikuti, S.V.P.; Baik, Y.J.; Chan, B. Eco-friendly, hydrogen fluoride-free, morphology-oriented synthesis of TiO2 with exposed (001) facets. Ceram. Int. 2019, 45, 2178–2184. [Google Scholar]
  22. Musial, J.; Mlynarczyk, D.T.; Stanisz, B.J. Photocatalytic degradation of sulfamethoxazole using TiO2-based materials–Perspectives for the development of a sustainable water treatment technology. Sci. Total Environ. 2023, 856, 159122. [Google Scholar] [CrossRef] [PubMed]
  23. Sadiq, M.M.J.; Shenoy, U.S.; Bhat, D.K. Novel NRGO-CoWO4-Fe2O3 nanocomposite as an efficient catalyst for dye degradation and reduction of 4-nitrophenol. Mater. Chem. Phys. 2018, 208, 112–122. [Google Scholar]
  24. Galstyan, V.; Macak, J.M.; Djenizian, T. Anodic TiO2 nanotubes: A promising material for energy conversion and storage. Appl. Mater. Today 2022, 29, 101613. [Google Scholar] [CrossRef]
  25. Vattikuti, S.V.P.; Devarayapalli, K.C.; Nallabala, N.K.R.; Nguyen, T.N.; Dang, N.N.; Shim, J. Onion-ring-like carbon and nitrogen from ZIF-8 on TiO2/Fe2O3 nanostructure for overall electrochemical water splitting. J. Phys. Chem. Lett. 2021, 12, 5909–5918. [Google Scholar] [CrossRef]
  26. Jeon, J.P.; Kweon, D.H.; Jang, B.J.; Ju, M.J.; Baek, J.B. Enhancing the Photocatalytic Activity of TiO2 Catalysts. Adv. Sustain. Syst. 2020, 4, 2000197. [Google Scholar] [CrossRef]
  27. Dong, H.; Zeng, G.; Tang, L.; Fan, C.; Zhang, C.; He, X.; He, Y. An overview on limitations of TiO2 based particles for photocatalytic degradation of organic pollutants and the corresponding countermeasures. Water Res. 2015, 79, 128–146. [Google Scholar] [CrossRef]
  28. Mikolajczyk, A.; Sizochenko, N.; Mulkiewicz, E.; Malankowska, A.; Nischk, M.; Jurczak, P.; Hirano, S.; Nowaczyk, G.; Zaleska-Medynska, A.; Leszczynski, J.; et al. Evaluating the toxicity of TiO2-based nanoparticles to Chinese hamster ovary cells and Escherichia coli: A complementary experimental and computational approach. Beilstein J. Nanotechnol. 2017, 8, 2171–2180. [Google Scholar] [CrossRef] [Green Version]
  29. Nithya, N.; Bhoopathi, G.; Magesh, G.; Kumar, C.D.N. Neodymium doped TiO2 nanoparticles by sol-gel method for antibacterial and photocatalytic activity. Mater. Sci. Semicond. Process. 2018, 83, 70–82. [Google Scholar] [CrossRef]
  30. Sathiyan, K.; Bar-Ziv, R.; Mendelson, O.; Zidki, T. Controllable synthesis of TiO2 nanoparticles and their photocatalytic activity in dye degradation. Mater. Res. Bull. 2020, 126, 110842. [Google Scholar]
  31. Khade, G.V.; Gavade, N.L.; Suwarnkar, M.B.; Dhanavade, M.J.; Sonawane, K.D.; Garadkar, K.M. Enhanced photocatalytic activity of europium doped TiO2 under sunlight for the degradation of methyl orange. J. Mater. Sci. Mater. Electron. 2017, 28, 11002–11011. [Google Scholar]
  32. Prakash, J.; Kumar, A.; Dai, H.; Janegitz, B.C.; Krishnan, V.; Swart, H.C.; Sun, S. Novel rare earth metal–doped one-dimensional TiO2 nanostructures: Fundamentals and multifunctional applications. Mater. Today Sustain. 2021, 13, 100066. [Google Scholar] [CrossRef]
  33. Xiu, Z.; Xing, Z.; Li, Z.; Wu, X.; Yan, X.; Hu, M.; Cao, Y.; Yang, S.; Zhou, W. Ti3+-TiO2/Ce3+-CeO2 Nanosheet heterojunctions as efficient visible-light-driven photocatalysts. Mater. Res. Bull. 2018, 100, 191–197. [Google Scholar] [CrossRef]
  34. Khade, G.V.; Suwarnkar, M.B.; Gavade, N.L.; Garadkar, K.M. Sol-gel microwave assisted synthesis of Sm-doped TiO2 nanoparticles and their photocatalytic activity for the degradation of Methyl Orange under sunlight. J. Mater. Sci. Mater. Electron. 2016, 27, 6425–6432. [Google Scholar] [CrossRef]
  35. Peng, H.; Guo, R.; Lin, H. Photocatalytic reduction of CO2 over Sm-doped TiO2 nanoparticles. J. Rare Earths 2020, 38, 1297–1304. [Google Scholar] [CrossRef]
  36. Chauhan, R.; Kumar, A.; Chaudhary, R.P. Structural and optical characterization of Zn doped TiO2 nanoparticles prepared by sol–gel method. J. Sol-Gel Sci. Technol. 2012, 61, 585–591. [Google Scholar] [CrossRef]
  37. Tsotetsi, D.; Dhlamini, M.; Mbule, P. Sol-gel synthesis and characterization of Ho3+ doped TiO2 nanoparticles: Evaluation of absorption efficiency and electrical conductivity for possible application in perovskite solar cells. Opt. Mater. 2022, 130, 112569. [Google Scholar] [CrossRef]
  38. Ouardi, Y.E.; Aissouq, A.E.; Chennah, A.; Ouammou, A.; Laatikainen, K. Synthesis, characterization, and DFT investigation of rhodamine B dye removal by activated carbon produced from argan nutshell. Biomass Conv. Bioref. 2022. [Google Scholar] [CrossRef]
  39. QuantumATK Version S-2021.06, Synopsys. Available online: www.synopsys.com/silicon/quantumatk.html (accessed on 30 September 2022).
  40. Perdew, J.P.; Burke, K.; Ernzerhof, M. Generalized gradient approximation made simple. Phys. Rev. Lett. 1996, 77, 3865–3868. [Google Scholar] [CrossRef] [Green Version]
  41. Ney, V.; Ye, S.; Kammermeier, T.; Ollefs, K.; Wilhelm, F.; Rogalev, A.; Lebègue, S.; da Rosa, A.L.; Ney, A. Structural and magnetic analysis of epitaxial films of Gd-doped ZnO. Phys. Rev. B 2012, 85, 235203. [Google Scholar] [CrossRef]
  42. Fabris, S.; de Gironcoli, S.; Baroni, S.; Vicario, G.; Balducci, G. Taming multiple valency with density functionals: A case study of defective ceria. Phys. Rev. B 2005, 71, 041102(R). [Google Scholar] [CrossRef]
  43. van Setten, M.J.; Giantomassi, M.; Bousquet, E.; Verstraete, M.J.; Hamann, D.R.; Gonze, X.; Rignanese, G.M. The PseudoDojo: Training and grading a 85 element optimized norm-conserving pseudopotential table. Comput. Phys. Commun. 2018, 226, 39–54. [Google Scholar] [CrossRef] [Green Version]
  44. Monkhorst, H.J.; Pack, J.D. Special Points for Brillouin-Zone Integrations. Phys. Rev. B 1976, 13, 5188–5192. [Google Scholar] [CrossRef]
  45. Jafari, A.; Khademi, S.; Farahmandjou, M.; Darudi, A.; Rasuli, R. Structural and Optical Properties of Ce3+-Doped TiO2 Nanocrystals Prepared by Sol–Gel Precursors. J. Electron. Mater. 2018, 47, 6901. [Google Scholar] [CrossRef]
  46. Ho, C.H.; Tsai, M.C.; Wong, M.S. Characterization of indirect and direct interband transitions of anatase TiO2 by thermoreflectance spectroscopy. App. Phys. Lett. 2008, 93, 081904. [Google Scholar] [CrossRef]
  47. Calandra, P.; Ruggirello, A.; Pistone, A.; Liveri, V.T. Structural and optical properties of novel surfactant coated TiO2–Ag based nanoparticles. J. Clust. Sci. 2010, 21, 767–778. [Google Scholar] [CrossRef]
  48. Reddy, K.M.; Manorama, S.V.; Reddy, A.R. Bandgap studies on anatase titanium dioxide nanoparticles. Mater. Chem. Phys. 2003, 78, 239–245. [Google Scholar] [CrossRef]
  49. Choudhury, B.; Borah, B.; Choudhury, A. Ce–Nd codoping effect on the structural and optical properties of TiO2 nanoparticles. Mater. Sci. Eng. B 2013, 178, 239–247. [Google Scholar] [CrossRef]
  50. Priyanka, K.P.; Revathy, V.R.; Rosmin, P.; Thrivedu, B.; Elsa, K.M.; Nimmymol, J.; Balakrishna, K.M.; Varghese, T. Influence of La doping on structural and optical properties of TiO2 nanocrystals. Mater. Charact. 2016, 113, 144–151. [Google Scholar] [CrossRef]
  51. Fu, C.; Li, T.; Qi, J.; Pan, J.; Chen, S.; Cheng, C. Theoretical study on the electronic and optical properties of Ce3+-doped TiO2 photocatalysts. Chem. Phys. Lett. 2010, 494, 117–122. [Google Scholar] [CrossRef]
  52. Ahmetović, S.; Vasiljević, Z.Ž.; Rajić, V.; Bartolić, D.; Novaković, M.; Tadić, N.B.; Cvjetićanin, N.; Nikolić, M.V. Examination of the doping effects of samarium (Sm3+) and zirconium (Zr4+) on the photocatalytic activity of TiO2 nanofibers. J. Alloys Compd. 2023, 930, 167423. [Google Scholar] [CrossRef]
  53. Singh, K.; Harish, S.; Kristy, A.P.; Shivani, V.; Archana, J.; Navaneethan, M.; Shimomura, M.; Hayakawa, Y. Erbium doped TiO2 interconnected mesoporous spheres as an efficient visible light catalyst for photocatalytic applications. Appl. Surf. Sci. 2018, 449, 755–763. [Google Scholar] [CrossRef]
  54. Fan, Z.; Meng, F.; Gong, J.; Li, H.; Ding, Z.; Ding, B. One-step hydrothermal synthesis of mesoporous Ce-doped anatase TiO2 nanoparticles with enhanced photocatalytic activity. J. Mater. Sci. Mater. Electron. 2016, 27, 11866–11872. [Google Scholar] [CrossRef]
  55. Keerthana, S.P.; Yuvakkumara, R.; Ravi, G.; Al-Sehemi, A.G.; Velauthapillai, D. Investigation of optimum Mn dopant level on TiO2 for dye degradation. Chemosphere 2022, 306, 135574. [Google Scholar] [CrossRef] [PubMed]
  56. El Mragui, A.; Zegaoui, O.; Esteves da Silva, J.C.G. Elucidation of the photocatalytic degradation mechanism of an azo dye under visible light in the presence of cobalt doped TiO2 nanomaterials. Chemosphere 2021, 266, 128931. [Google Scholar] [CrossRef]
  57. Arasi, S.E.; Madhavan, J.; Raj, M.V.A. Effect of samarium (Sm3+) doping on structural, optical properties and photocatalytic activity of titanium dioxide nanoparticles. J. Taibah Univ. Sci. 2018, 12, 186–190. [Google Scholar] [CrossRef] [Green Version]
  58. Reszczyńska, J.; Grzyb, T.; Sobczak, J.W.; Lisowski, W.; Gazda, M.; Ohtani, B.; Zaleska, A. Visible light activity of rare earth metal doped (Er3+, Yb3+ or Er3+/Yb3+) titania photocatalysts. Appl. Catal. B 2015, 163, 40–49. [Google Scholar] [CrossRef]
  59. Liang, J.; Wang, J.; Song, K.; Wang, X.; Yu, K.; Liang, C. Enhanced photocatalytic activities of Nd-doped TiO2 under visible light using a facile sol-gel method. J. Rare Earths 2020, 38, 148–156. [Google Scholar] [CrossRef]
  60. Bao, R.; Li, R.; Chen, C.; Wu, H.; Xia, J.; Long, C.; Li, H. Biotemplated synthesis of 3D rare earth–doped TiO2 hollow spheres for photocatalytic application. J. Phys. Chem. Solids 2019, 126, 78–84. [Google Scholar] [CrossRef]
  61. Singh, I.; Birajdar, B. Synthesis, characterization and photocatalytic activity of mesoporous Na-doped TiO2 nano-powder prepared via a solvent-controlled non-aqueous sol–gel route. RSC Adv. 2017, 7, 54053–54062. [Google Scholar] [CrossRef] [Green Version]
  62. Cheng, X.Q.; Ma, C.Y.; Yi, X.Y.; Yuan, F.; Xie, Y.; Hu, J.M.; Hu, B.C.; Zhang, Q.Y. Structural, morphological, optical and photocatalytic properties of Gd-doped TiO2 films. Thin Solid Film. 2016, 615, 13–18. [Google Scholar] [CrossRef]
  63. Irshad, A.; Zulfiqar, M.; Ali, H.M.; Shahzadi, N.; Abd El-Gawad, H.H.; Chokejaroenrat, C.; Sakulthaew, C.; Anjum, F.; Suleman, M. Co-substituted Mg–Zn spinel nanocrystalline ferrites: Synthesis, characterization and evaluation of catalytic degradation efficiency for colored and colorless compounds. Ceram. Int. 2022, 48, 29805–29815. [Google Scholar] [CrossRef]
  64. Sadiq, M.M.J.; Shenoy, U.S.; Bhat, D.K. Novel RGO–ZnWO4–Fe3O4 nanocomposite as high performance visible light photocatalyst. RSC Adv. 2016, 6, 61821–61829. [Google Scholar] [CrossRef]
  65. Ren, Z.; Xie, J.; Li, X.; Guo, L.; Zhang, Q.; Wu, J.; Li, Y.; Liu, W.; Li, P.; Fu, Y.; et al. Rational design of graphite carbon nitride-decorated zinc oxide nanoarrays on three-dimensional nickel foam for the efficient production of reactive oxygen species through stirring-promoted piezo–photocatalysis. J. Colloid Interface Sci. 2023, 632, 271–284. [Google Scholar] [CrossRef]
  66. Sadiq, M.M.J.; Shenoy, U.S.; Bhat, D.K. Synthesis of BaWO4/NRGO–g-C3N4 nanocomposites with excellent multifunctional catalytic performance via microwave approach. Front. Mater. Sci. 2018, 12, 247–263. [Google Scholar] [CrossRef]
  67. Akpan, U.G.; Hameed, B.H. The advancements in sol–gel method of doped-TiO2 photocatalysts. Appl. Catal. A Gen. 2010, 375, 1–11. [Google Scholar] [CrossRef]
  68. Guo, B.L.; Han, P.; Guo, L.C.; Cao, Y.Q.; Li, A.D.; Kong, J.Z.; Zhai, H.F.; Wu, D. The Antibacterial Activity of Ta-doped ZnO nanoparticles. Nanoscale Res. Lett. 2015, 10, 336. [Google Scholar] [CrossRef] [Green Version]
  69. Rajoriya, S.; Bargole, S.; George, S.; Saharan, V.K.; Gogate, P.R.; Pandit, A.B. Synthesis and characterization of Samarium and Nitrogen doped TiO2 photo-catalysts for photo-degradation of 4-Acetamidophenol in combination with hydrodynamic and acoustic cavitation. Sep. Purif. Technol. 2019, 209, 254–269. [Google Scholar] [CrossRef]
  70. Hannachi, E.; Almessiere, M.A.; Slimani, Y.; Baykal, A.; Ben Azzouz, F. AC susceptibility investigation of YBCO superconductor added by carbon nanotubes. J. Alloys Compd. 2020, 812, 152150. [Google Scholar] [CrossRef]
  71. Slimani, Y.; Sivakumar, R.; Meena, S.S.; Vignesh, R.; Yasin, G.; Hannachi, E.; Almessiere, M.A.; Trabelsi, Z.; Batoo, K.M.; Baykal, A.; et al. BaTiO3/(Co0.8Ni0.1Mn0.1Fe1. 9Ce0.1O4)x composites: Analysis of the effect of Co0.8Ni0.1Mn0.1Fe1.9Ce0.1O4 doping at different concentrations on the structural, morphological, optical, magnetic, and magnetoelectric coupling properties of BaTiO3. Ceram. Int. 2022, 48, 30499–30509. [Google Scholar] [CrossRef]
  72. Slimani, Y.; Shirsath, S.E.; Hannachi, E.; Almessiere, M.A.; Aouna, M.M.; Aldossary, N.E.; Yasin, G.; Baykal, A.; Ozçelik, B.; Ercan, I. (BaTiO3)1−x+(Co0.5Ni0.5Nb0.06Fe1.94O4)x nanocomposites: Structure, morphology, magnetic and dielectric properties. J. Amer. Ceram. Soc. 2021, 104, 5648–5658. [Google Scholar] [CrossRef]
  73. George, M.; Ajeesha, T.L.; Manikandan, A.; Anantharaman, A.; Jansi, R.S.; Kumar, E.R.; Slimani, Y.; Almessiere, M.A.; Baykal, A. Evaluation of Cu–MgFe2O4 spinel nanoparticles for photocatalytic and antimicrobial activates. J. Phys. Chem. Solids 2021, 153, 110010. [Google Scholar] [CrossRef]
  74. Dinesh, A.; Raja, K.K.; Manikandan, A.; Almessiere, M.A.; Slimani, Y.; Baykal, A.; Alorfi, H.S.; Hussein, M.A.; Khan, A. Sol–gel combustion synthesis and photocatalytic dye degradation studies of rare earth element Ce substituted Mn–Zn ferrite nanoparticles. J. Mater. Res. Technol. 2022, 18, 5280–5289. [Google Scholar] [CrossRef]
  75. Sadiq, M.M.J.; Shenoy, U.S.; Bhat, D.K. Enhanced photocatalytic performance of N-doped RGO-FeWO4/Fe3O4 ternary nanocomposite in environmental applications. Mater. Today Chem. 2017, 4, 133–141. [Google Scholar] [CrossRef]
Figure 1. Refined XRD patterns of Ce–Sm doped TiO2 NPs (x = 0.00, 0.25, 0.50, 1.00, and 2.00%). The dots lines (red lines) and solid lines (black lines) represent the measured and calculated XRD profiles, respectively. The blue lines represent the difference between the experimental and calculated profiles. Bragg reflections are represented by tick marks (green).
Catalysts 13 00668 g001
Figure 2. TEM images for Ce–Sm co-doped TiO2 NPs (x = 0, 0.25, 0.50, 1, and 2%).
Catalysts 13 00668 g002
Figure 3. Histograms representing nanoparticles’ size distribution of Ce–Sm co-doped TiO2 nanoparticles (x = 0, 0.25, 0.50, 1, and 2%).
Catalysts 13 00668 g003
Figure 4. Elemental mapping images of x = 1% composition of Ce–Sm co-doped TiO2 nanoparticles.
Catalysts 13 00668 g004
Figure 5. Unit cell of Ce–Sm co-doped TiO2 nanomaterial composed of 72 atoms.
Catalysts 13 00668 g005
Figure 6. Density of states for (a) pristine TiO2 and (b) Ce–Sm co-doped TiO2 nanomaterials.
Catalysts 13 00668 g006
Figure 7. F(R) plots of Ce–Sm co-doped TiO2 samples. Inset shows an enlarged view of the absorption edges of different compositions.
Catalysts 13 00668 g007
Figure 8. Determination of (a) the indirect bandgap and (b) the direct bandgap of Ce–Sm co-doped TiO2 samples. Insets show the evolutions in the direct and indirect bandgap energies of TiO2 versus Ce–Sm co-doping amounts.
Catalysts 13 00668 g008
Figure 9. Photocatalytic degradation of RB dyes of Ce–Sm co-doped TiO2 NPs ((a) blank (b) x = 0.00%, (c) x = 0.25%, (d) x = 0.50%, (e) x = 1.00%, and (f) x = 2.00%).
Catalysts 13 00668 g009
Figure 10. Degradation of RB dye of Ce–Sm co-doped TiO2 NPs (x = 0.00, 0.25, 0.50, 1.00, and 2.00%).
Catalysts 13 00668 g010
Figure 11. Degradation of RB dyes over time of Ce–Sm co-doped TiO2 NPs (x = 0.00, 0.25, 0.50, 1.00, and 2.00%).
Catalysts 13 00668 g011
Figure 12. Kinetics simulation curve of Ce–Sm co-doped TiO2 NPs (x = 0.00, 0.25, 0.50, 1.00, and 2.00%).
Catalysts 13 00668 g012
Figure 13. Recyclability of Ce–Sm co-doped TiO2 NPs with x = 0.50%.
Catalysts 13 00668 g013
Figure 14. Test of scavenger’s effects of Ce–Sm co-doped TiO2 NPs with x = 0.50%.
Catalysts 13 00668 g014
Figure 15. A scheme illustrating the photocatalytic mechanism for Ce–Sm co-doped TiO2 NPs.
Catalysts 13 00668 g015
Table 1. Refined structural parameters of Ce–Sm co-doped TiO2 NPs (x = 0.00, 0.25, 0.50, 1.00, and 2.00%).
x (%)a = b (Å)c (Å)V3)DXRD (nm)RBraggχ2 (chi2)
0.003.78569.5034136.1917.811.31.3
0.253.78539.5036136.1716.622.34.4
0.503.78469.5027136.1115.726.03.7
1.003.78519.4974136.0615.523.43.4
2.003.78569.5035136.1915.123.63.8
Table 2. List of some TiO2-based materials.
MaterialsIrradiation SourceDyesDegradation %Duration (min)Ref.
Ce–Sm co-doped TiO2 NPsXenon lamp (250 W, λ ≤ 400 nm)RB9830This work
Ce-doped TiO2 nanosheetsUV light (15 W, 365 nm)RB95120[54]
Mn-doped TiO2Tungten halogen lamp (300 W, 500 nm)Malachite green (MG)96105[55]
Cobalt-doped TiO2Fluorescent lamp (23 W, 6400 K, 1311 Lumens)Methyl orange (MO)34.7360[56]
Sm-doped TiO2 NPsUV light (365 nm)MO96120[34]
Sm-doped TiO2 NPsUV source (125 W Hg lamp)RB95.7120[57]
Er3+-doped TiO2 NPsXe lamp (400 W, λ > 450 nm)Phenol75180[58]
Nd-doped TiO2 NPsXe lamp (350 W, λ > 420 nm)MO96.560[59]
La–Gd co-doped TiO2 hollow spheresXe lamp (300 W, PLS-SXE 300/300UV)MO97150[60]
Na-doped TiO2UV lamp (300 W, 365 nm)Methylene blue (MB)92.560[61]
Gd-doped TiO2 filmsUV source (500 W high-voltage mercury lamp)MO4128[62]
Table 3. Weight and/or volume of precursors.
x (%)Titanium Isopropoxide (mL)Cerium Nitrate Hexahydrate (mg)Samarium Nitrate Hexahydtrate (mg)
0.0012.9----
0.2512.949.350.5
0.5012.998.6101
1.0012.9197.2202
2.0012.9394.4404
Disclaimer/Publisher’s Note: The statements, opinions and data contained in all publications are solely those of the individual author(s) and contributor(s) and not of MDPI and/or the editor(s). MDPI and/or the editor(s) disclaim responsibility for any injury to people or property resulting from any ideas, methods, instructions or products referred to in the content.