Article

CO Oxidation Reaction by Platinum Clusters on the Surface of Multiwalled Carbon Nanotubes: Experimental and Theoretical Study of Kinetics in a Wide Range of O2/CO Ratios

1
Boreskov Institute of Catalysis, pr. Lavrentieva 5, 630090 Novosibirsk, Russia
2
Nikolaev Institute of Inorganic Chemistry, pr. Lavrentieva 3, 630090 Novosibirsk, Russia
*
Author to whom correspondence should be addressed.
Catalysts 2023, 13(3), 568; https://doi.org/10.3390/catal13030568
Submission received: 11 January 2023 / Revised: 1 March 2023 / Accepted: 6 March 2023 / Published: 10 March 2023
(This article belongs to the Special Issue Mechanism/Kinetic Modeling Study of Catalytic Reactions)

Abstract

:
This work presents a systematic study of the kinetic aspects of CO oxidation reaction catalyzed by platinum nanoparticles (NPs) supported on the surface of multiwalled carbon nanotubes (MWCNTs). The investigation presented is closely related to the actual practical task of air purification in enclosed spaces. Therefore, the catalytic reaction was carried out in the presence of an excess of oxygen (5 vol.%) and over a wide range of CO concentrations from 50 ppm to 1600 ppm. For the catalyst characterization, transmission electron microscopy (TEM) and X-ray photoelectron spectroscopy (XPS) were applied. Kinetic modelling based on the Langmuir–Hinshelwood and Mars-van Krevelen mechanisms was taken as a basis, using the results obtained on Pt foil. Simulation of CO oxidation reaction on platinum NPs at temperatures above 90 °C was carried out using a kinetic model describing the reaction mechanism on bulk platinum. The description of the kinetics of CO oxidation reaction on Pt NPs over the entire temperature range, including the low temperatures down to −40 °C, required the introduction of the steps characterizing an additional concerted mechanism related to CO-assisted O2 dissociation. Using the presented model, some predictions of the kinetic behaviour of the system were made.

Graphical Abstract

1. Introduction

CO oxidation is the main reaction used for both the informative screening of catalysts’ activity in the temperature-programmed reaction mode (TPR-CO + O2) and detailed kinetic studies [1,2]. The TPR-CO + O2 experiments imply sample heating in a wide temperature range in a stoichiometric or slightly oxygen-rich CO/O2 reaction mixture [3,4]. This method of activity testing is particularly suitable for the analysis of three-way catalysts (TWC) employed for exhaust gas aftertreatment in a wide temperature interval [5]. The catalysts that are used to purify indoor air operate in a large excess of oxygen and at temperatures close to room temperature. Thus, the catalytic activity of these catalysts should be tested in an isothermal mode [6]. It is usually assumed that in both the isothermal experiments with a large excess of O2 and in the TPR-CO + O2 studies, the same catalytic sites and the same mechanisms are involved. This approach can be accepted for the samples based on bulk platinum metals. However, in the case of metal clusters with very different electronic states and structural features compared to the bulk ones, the reaction mechanisms can differ significantly. So, it is necessary to establish these mechanisms for targeted synthesis of the catalysts for particular applications: air purification at room temperature in a large excess of oxygen or exhaust gas aftertreatment over a wide temperature range.
There are many works devoted to the study of the mechanisms of CO oxidation on a platinum surface [7]. The steps of adsorption, desorption, and reaction are usually considered. Some authors also include steps describing modification of the catalyst surface. It is generally accepted that CO oxidation on a polycrystalline Pt surface occurs following the Langmuir-Hinshelwood mechanism and includes dissociative oxygen adsorption and CO molecular adsorption. Carbon dioxide is formed on the surface as a result of the interaction between adsorbed CO and O followed by CO2 desorption [8,9,10]. The high heat of CO adsorption prevents its oxidation at low temperatures. The activity of bulk metal species is determined by both the heat of CO adsorption and the activity of the oxidized metal surface. The high heat of adsorption and the high sticking coefficients of CO on metals lead to the formation of an adsorption layer of CO. This layer hinders the access of gas-phase molecular oxygen to the metal surface and, accordingly, inhibits the chemical reaction [2]. This factor determines the temperature of the reaction ignition. To decrease the ignition temperature, it is necessary to decrease the heat of CO adsorption. This can be achieved by the use of nanosized and cluster forms of the active component [11,12] and their oxidized forms, including isolated ions [13]. Another approach for lowering the ignition temperature of the reaction can be a significant increase in the O2/CO ratio. An increase in the relative oxygen content in the reaction mixture can lead to a rather strong shift of the catalytic activity of metals towards lower temperature ranges. However, an increase in the O2 partial pressure only may not be enough for the reaction ignition at room temperature, and other factors should be considered, such as the size effect and the presence of the oxidized forms of the active component on the support surface.
A decrease in the size of metal particles leads to both an increase in the area of contact between the metal surface and the gaseous reaction medium and changes in the electronic state of the metal. In particular, a decrease in the size of platinum particles leads to a shift in electron levels and a redistribution of the density of states in the valence band, which can be reliably detected by photoelectron spectroscopy [14,15,16]. These factors affect the catalytic activity of the nanosized metals in the CO oxidation reaction. The ultrafine platinum particles deposited on an inert support (carbon) showed a significant increase in catalytic activity compared to bulk platinum [17]. The authors attributed this to the easier oxidation and reduction of dispersed platinum species compared to bulk metal. Earlier we showed that the use of MWCNTs (multiwalled carbon nanotubes) allows stabilizing the unique supported PtOx clusters less than 1 nm, which indicates high activity in the low-temperature CO oxidation reaction [18]. A similar approach for stabilization of dispersed noble metal species using the supports based on metal-organic frameworks (MOF-74) or reduced graphene oxides (rGO@Cu-BTC, rGO@Mg-BTC) is described in [19,20,21]. The catalysts comprising Au0 or Pd0 nanoparticles as active components demonstrated high activity in the CO oxidation reaction at temperatures below 100 °C [19,20,21]. The authors point out the important role of the dispersion of the active component and the influence of the surface oxygen species on the activity of the systems in the CO oxidation reaction [19,21]. However, the authors did not perform modelling of the kinetic data to describe the mechanism of the reaction.
Wojciechowski et al. [22] considered two mechanistic models describing the rates of CO oxidation reaction: the Langmuir–Hinshelwood dual-site molecular adsorption model (MAM) and the Langmuir–Hinshelwood dual-site dissociative adsorption model (DAM). The MAM model provided a better description of the experimental data over the entire range of conditions and compositions of the reaction mixture. Therefore, the authors concluded that the rate-controlling step in this mechanism is a reaction between adsorbed carbon monoxide molecules and adsorbed oxygen atoms.
The study of CO oxidation on platinum clusters deposited on Al2O3 at temperatures above 90 °C showed that the kinetically significant stages of O2 activation include the direct activation of O2* (or O2) in the reaction with chemisorbed CO (CO*). In this case, the reactive intermediates O*-O-C* = O are formed, which decompose with the formation of CO2 and chemisorbed oxygen (O*). These activation steps were proposed instead of unassisted activation involving molecular adsorption and subsequent dissociation of O2 [23].
In this work, we performed a detailed investigation of the kinetic features in CO oxidation reaction over the Pt clusters supported on the MWCNTs. We considered the CO oxidation reaction as proceeding in the temperature-programmed reaction mode and isothermal regime with a variation of the O2/CO ratio in a wide range. Such a detailed study would provide deep insight into understanding the reaction mechanism on Pt clusters. The investigation of the reaction in the temperature-programmed reaction mode demonstrated for the first time the high activity of the Pt/MWCNT catalysts at low temperatures even below 0 °C. The comparison with similar experiments obtained on the bulk Pt foil showed a significantly different behaviour of CO conversion depending on temperature. The main difference was connected with the inability of Pt foil to catalyze CO oxidation at temperatures below 100 °C, which was confirmed by simulation of CO conversion curves on the base of both Langmuir-Hinshelwood and Mars-van Krevelen mechanisms. The comparison of the experimental and simulated data provided insight into understanding the reaction mechanisms on the dispersed platinum species, showing that the description of the kinetic data is possible only within the framework of a combination of several mechanisms including the CO-assisted O2 dissociation mechanism, which is responsible for CO2 formation at low temperatures. The developed mathematical model allowed us to simulate the kinetic curves obtained in the isothermal experiments in a wide range of O2/CO ratios, which has significant practical value for air purification in enclosed spaces.

2. Results and Discussion

2.1. Oxidation State of Platinum and Its Structure in the Pt-C Catalyst

According to TEM data, nanoparticles of platinum with an average size of 2.5 nm are formed on the surface of the MWCNTs (Figure 1a). The interplanar distances measured from high-resolution images correspond to metallic platinum (Figure 1b,c). The particles are located near tube defects such as breaks or bends of the graphene layers. These data are in good agreement with our previous results [24]. We have shown earlier using the X-ray diffraction method that deposition of the platinum species on the MWCNT surface from the (Me4N)2[Pt2(µ-OH)2(NO3)8] complexes results in the formation of the metallic Pt crystallites of about 3 nm in size. HAADF-STEM data (Figure 1c) show that in addition to nanoparticles, a part of platinum is also stabilized as single atoms and highly dispersed clusters consisting of a small number of atoms (up to ~10 pcs). The structure of these clusters is disordered due to their small size, so the periodic contrast is absent in the high-resolution images.
Figure 2 presents the Pt4f spectra of the Pt foil sample and the Pt-C catalyst. The Pt4f spectrum of the Pt foil is characterized by only one spin-orbit split Pt4f7/2-Pt4f5/2 doublet with a binding energy value Eb(Pt4f7/2) = 71.1 eV (Figure 2a), typical for the metallic platinum species [25,26,27]. The Pt4f spectrum of the Pt-C sample also shows the doublet related to the Pt0 species with Eb(Pt4f7/2) = 71.3 eV. A slight positive shift of the Eb value compared to the Pt0 foil indicates the small size of the Pt0 particles in the Pt-C catalyst [14]. Apart from the characteristics of the Pt0 species, the Pt4f spectrum reveals two doublets with the Eb(Pt4f7/2) values of 72.6 and 74.5 eV (Figure 2b), which can be related to Pt2+ and Pt4+ species, respectively [25,26,28]. The fraction of the peaks that correspond to the oxidized platinum species (Pt2+ and Pt4+) to the overall Pt4f spectrum is about 30%.

2.2. Experimental Study of the Kinetics of the CO + O2 Reaction on Bulk (Pt Foil) and Highly Dispersed Platinum (Pt-C)

Figure 3 shows the temperature dependencies of the CO conversion curves for the bulk Pt foil sample and the catalyst with the highly dispersed platinum species (Pt-C) after Ox-Red treatments. The CO conversion for the Pt foil sample starts above 200 °C (Figure 3a). A change of the O2/CO ratio from 0.5 to 5 leads to a shift of the CO conversion curve towards lower temperatures, and the T50 decreases from 350 °C to 280 °C, with an increase in the O2/CO ratio from 0.5 to 5 (Table A1).
Figure 3b shows temperature dependencies of CO conversion at O2/CO = 5 for the Pt foil and the Pt-C-Ox and the Pt-C-Red samples. Both samples exhibit a significantly higher low-temperature activity. The onset temperature is about −30 °C, and T50 is 115 and 90 °C after -Ox and -Red treatment, respectively. In the temperature range below 0 °C, the Pt-C-Ox and Pt-C-Red catalysts are characterized by similar CO conversion. Thus, there is a significant difference in the catalytic activity of bulk platinum and the dispersed Pt species supported on the MWCNTs. The catalytic experiments also reveal an insignificant influence of the oxidative or reductive pretreatments on the activity of the Pt-C catalyst.
Figure 4 (Figure A1) presents the time dependencies of CO conversion and CO2 production for an experiment with an initial CO concentration of 50 ppm. After the switching of the reaction mixture to the reactor, the CO conversion quickly reaches 0.9 and remains stable for 60 min. The CO2 production corresponds to the CO conversion with almost 100% balance. At the same time, the self-sustained oscillations (SOs) are observed on the CO2 production curve after 30 min (Figure 4b and Figure A1b), which indicates implementation of the oxidation/reduction of platinum clusters/nanoparticles in the course of the reaction. Note that SO was observed on bulk platinum species at significantly higher temperatures (about 200 °C) [29,30]. The observation of SO at low temperatures on the Pt-C catalyst is associated with an efficient redox process for the Pt clusters, apparently due to the size effect.
The increase in the initial CO concentration (Figure 4) to 75 ppm leads to a slight decrease in the CO conversion to 0.87. At the same time, the CO2 production curve does not quantitatively correspond to the CO conversion curve: both a decrease and an increase are observed. After 60 min, CO conversion and CO2 production begin to match each other with almost 100% balance. At the CO concentration of 100 ppm, the high CO conversion is observed at the beginning of the experiment, but after 30 min the CO conversion decreases, reaching ~0.35 after 60 min. At higher CO concentrations, similar behaviour of the CO conversion curves is observed, but the interval of the high CO conversion shortens, and the drop becomes more abrupt. The CO2 production curves correspond qualitatively to the CO conversion curves, but there is no quantitative balance between them. The quantitative balance is observed only after the CO conversion reaches low values. It can be assumed that during the CO admission, a nonstationary release of CO2 is taking place. This CO2 release is likely associated with changes in the composition of the adsorption layer and adsorption/desorption characteristics.
Figure 5 shows the CO conversion and the CO oxidation rate depending on the CO exposure. Both the CO conversion and the reaction rate are at their maximum level up to CO exposure ε~3300 ppm × min regardless of the initial CO concentration in the reaction mixture. The CO exposure resulting in a drop of CO conversion to a minimum value can be estimated as the area under the CO uptake curve. This amount is about 220 μmol CO/g, which corresponds to the ratio CO/Pt = 0.71.
Figure A2a presents the time dependence of the CO oxidation reaction rate in the isothermal reaction CO + O2 for various CO concentrations in the reaction mixture. Figure A2b shows the logarithmic dependence of the reaction rate on the initial CO concentration for the initial period of time and after 60 min upon reaching the steady state of the system. The calculated order of the reaction in the initial period of time is 1.0, while the reaction rate does not depend on the concentration of CO after reaching the steady state.
Figure 6a presents the temperature dependencies of CO consumption and CO2 evolution during TPR-CO for the Pt-C catalyst. The CO consumption and the CO2 evolution begin immediately upon the start of heating at −40 °C with a maximum of about 20 °C. It can be concluded that this peak corresponds to the interaction of CO with weakly bounded oxygen of the oxidized platinum species PtOx. The areas of the CO consumption peak and the CO2 evolution peak are about 88 μmol/g, which corresponds to the CO(CO2)/Pt ratio of 0.28 (Table A2). Thus, about 30% of platinum in the catalyst is in the oxidized state, which is in good agreement with the XPS data. With a temperature increase above 190 °C, CO consumption and CO2 evolution are observed with a maximum of about 340 °C. It can be assumed that at these temperatures, the interaction of CO with oxygen species localized directly on the surface of the MWCNTs takes place.
Figure 6b shows CO and CO2 evolution during the TPD-CO experiment for the Pt-C catalyst. At −25 °C, a CO desorption peak is observed. The area of this peak is 4 μmol/g, corresponding to the CO/Pt ratio of 0.013. This means that about 1.3% of Pt is covered by weakly bounded CO. At 125, 175, and 250 °C, three unresolved CO desorption peaks can be seen. The total area of these peaks is 25 μmol/g, which corresponds to the CO/Pt ratio of 0.08. So, about 8% of the platinum species adsorb CO with higher bond strength. The CO2 evolution is observed with a maximum temperature of about 300 °C. The amount of the released CO2 is 3.6 μmol/g, given that the CO2/Pt ratio as 0.012. The CO2 release can be associated with the oxygen species present on the surface of the MWCNTs. The total amount of the desorbed CO and CO2 is 33.1 μmol/g, corresponding to the (CO + CO2)/Pt ratio of 0.11. This means that only 11% of Pt is covered with the adsorbed CO species. To find out which adsorbed CO species can provide CO oxidation at room temperature, the reaction was carried out in the TPR-CO + O2 mode with the low CO concentration—50 ppm.
Figure 7 shows the temperature dependencies of CO conversion and CO2 production during the first and second heating runs. During the first run when switching the reaction mixture to the reactor at −40 °C, CO conversion is about 0.8 and corresponds well with CO2 production. The CO conversion curve practically does not change during heating up to 350 °C, while the CO2 production curve shows a maximum at T~16 °C. With a further increase in the temperature, the production of CO2 exceeds the conversion of CO, and the CO/CO2 balance is less than 80%. During the second heating of the sample in the reaction mixture, the CO conversion curve slightly decreases to 0.6 at low temperatures but then increases to 0.9 with temperature increase. At the same time, the CO2 production curve again reaches a maximum in the temperature range from −13 to 65 °C, with two poorly resolved peaks at T~10 and 32 °C. It should be noted that the maximum production of CO2 is observed at the same temperature region in which there is no release of CO during the TPD-CO experiment (Figure 7b). The peak area of CO2 concentration is 10 μmol/g, which corresponds to the ratio CO2/Pt = 0.0324 (Table A2). This means that in the presence of O2 in the gas phase, the COads species form a coadsorbed (CO-O2)ads complex. This (CO-O2)ads complex decomposes upon heating, with the release of CO2 and atomic oxygen species. Another CO molecule can react with the remaining atomic oxygen to form CO2. So, it can be assumed that at low temperatures and low CO concentrations, the concerted CO-assisted O2 dissociation mechanism takes place, boosting the catalyst activity [23].

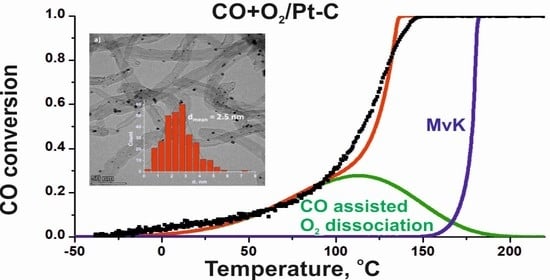
2.3. Results of the Mathematical Modelling: Comparison with the Data of the Kinetic Experiments

To describe the experimental data, we considered the reaction mechanisms based on the law of mass action. The proposed kinetic models of the CO oxidation reaction describe changes in the concentrations of the reagents, the reaction products, and the intermediates formed on the catalyst surface. The dynamics of the partial pressures of the gas-phase species, CO and O2, were described within the framework of the model of a continuous stirred-tank reactor. The limitation of the reaction by heat and mass transfer processes was not taken into account. To describe the kinetic experimental data and estimate the rate constants of the individual stages of the qualitative methods of dynamical systems theory, the methods of solving the initial problems for stiff differential equations implemented in the MATLAB package and the directional descent approach were used.

2.3.1. Mechanism and Mathematical Model of the Reaction over Bulk Pt Foil

As a basic mechanism for the description of the kinetics of CO oxidation over Pt foil, we used the well-known Langmuir–Hinshelwood (LH) mechanism [2,23]. The stages of the reversible CO adsorption, dissociative O2 adsorption, and interaction of the adsorbed CO and O were considered as follows:
CO(g) + * ↔ CO*
O2(g) + 2* → 2O*
O* + CO* → CO2 (g) + 2*
where * is the free adsorption center on the surface of the Pt foil.
Under oxygen excess in the gas phase and at the elevated temperatures, the oxidation of the Pt foil surface takes place [31,32]. Thus, the following stage was considered as well [33]:
O* → Ox
The reduction of the oxidized surface proceeds through the adsorption of the gas-phase CO on the oxidized centre of the platinum surface [34]. Assuming that the rate of Pt oxide reduction by the adsorbed CO is limited by the rate of CO adsorption, the following stage was added:
CO(g) + Ox → CO2(g) + *
Note, the same 5-stage mechanism of CO oxidation on Pt foil was suggested for the first time by Sales et al. [35] and allowed the authors to describe the self-sustained oscillations in this reaction.
The designations of the intermediates on the Pt foil surface that correspond to Stages 1–5 used in our work are presented in Table 1.
The following kinetic model was used to describe the dynamics of θ C O , θ O , and θ O x coverages on the Pt foil surface:
d d t θ C O = k 1 P C O θ f k 1 θ C O k 3 θ O θ C O ,
d d t θ O 2 = 2 k 2 P O 2 θ f 2 k 3 θ O θ C O k 4 θ O ,
d d t θ O x = k 4 θ O k 5 P C O θ O x ,
where k i is the rate constant of the i-th stage, P C O and P O 2 are the partial pressures of CO and O2 in the gas phase, and θ f = 1 θ O θ C O θ O x denotes the coverage of the free adsorption centres on the Pt surface.
During the kinetic experiments, changes in the partial pressures of CO and O2 take place. These changes are determined by the residence time of the reaction mixture inside the reactor and the rates of the stages of the heterogeneous reaction. Thus, the following equations were considered to describe the dynamics of the partial pressures:
d d t P C O = 1 τ P C O i n P C O γ k 1 P C O θ f k 1 θ C O + k 5 P C O θ O x ,
d d t P O 2 = 1 τ P O 2 i n P O 2 γ k 2 P O 2 θ f 2 ,
where τ   is the residence time and where the coefficient γ depends on the adsorption capacity of the catalyst in the unit of the reactor volume. The coefficient γ was calculated as γ = N P t R T V g , where N P t is the amount of Pt on the surface of the catalyst, mol; R is the universal gas constant; T is the temperature; and V g is the volume of the gas in the reactor. Parameters P C O i n and P O 2 i n are the partial pressures of CO and O2 at the reactor inlet.
The rate constants were estimated as k1 = 6.75 × 10⁴ s−1 mbar−1, k 1 = 8 × 10 8 e 13 R T   s−1, k2 = 750 s−1·mbar−1, k 3 = 3 × 10 12 e 27 R T   s−1, k 4 = 10 12 e 25 R T   s−1, k 5 = 1.5 × 10 13 e 25 R T · s−1·bar−1, R = 1.987 × 10 3 kcal/(mol⋅K). Here T is the reaction temperature, K.
Following the abovementioned model, we calculated the temperature dependencies of the CO conversion and the coverages of the catalyst surface by the adsorbed intermediates during the TPR-CO + O2 experiments with O2/CO ratio in the reaction mixture 5 and 0.5 (Figure 8a and Figure 8b, respectively).
Under the considered conditions, the adsorbed CO inhibits the reaction at low temperatures. Heating of the system leads to overcoming of the inhibition effect due to CO desorption and the formation of the free centres available for O2 adsorption and dissociation. As a result, the rate of dissociative O2 adsorption (Stage 2 in the reaction mechanism) and the reaction rate (Stage 3 in the reaction mechanism) increase significantly at the temperature range of 250–300 °C (Figure 8a). At temperatures higher than 300 °C, the high values of CO conversion are ensured by the oxidation reduction of the Pt foil surface (Stages 4 and 5 of the reaction mechanism).
At the CO excess in the gas phase, that is, at O2/CO = 0.5, noticeable increase in the CO conversion is observed only at temperatures more than 300 °C (Figure 8b). This is because in an oxygen-deficient atmosphere at low temperatures, the coverage of the adsorbed oxygen species is small, and the surface is almost completely covered with the adsorbed CO. As the temperature increases, the rates of CO desorption and oxygen adsorption increase. In this case, the adsorbed oxygen interacts almost completely with the adsorbed CO, and oxidation of the platinum surface does not occur.
A comparison of the experimental and theoretically calculated CO conversion curves (Figure 3a and Figure 8, respectively) shows that the proposed kinetic model, based on the traditional mechanism (Stages 1–5), describes the kinetic data of the CO oxidation reaction on the surface of massive platinum foil very well.
To compare the kinetic data obtained for the Pt foil and the Pt-C catalyst, an equal number of active centres should be considered. The estimations show that the number of centres for the Pt-C catalyst is about 104 times higher than in case of the Pt foil catalyst. Figure 9a illustrates the influence of the increase in the number of adsorption centres on the temperature dependence of the CO conversion on the Pt foil catalyst. The simulation results show that the CO conversion curve shifts towards lower temperatures with the increase in the number of adsorption centres. However, the modelling data indicate that the increase in the catalyst surface by 105 or even 106 times does not ensure the CO conversion at temperatures less than 60 °C. Based on the analysis of our model results, we can conclude that at low temperatures the CO conversion is limited by the rate of the interaction of adsorbed CO and O (Stage 3 of the reaction mechanism). Note that there is a shoulder on the CO conversion curve when the number of adsorption centres increases by 104 times (Figure 9a). This feature is caused by the transition from the Langmuir–Hinshelwood (LH) mechanism to the Mars-van Krevelen (MvK) mechanism.
To check whether variation of the O2/CO ratio might increase the efficiency of the low-temperature CO oxidation (CO conversion), we also modelled the CO conversion curve at the O2/CO ratio of 5000 (Figure 9b). It turned out that at O2/CO = 5000, the dependence of the CO conversion on the temperature has asymptotes, and the CO conversion is not observed at temperatures below 90 °C. Thus, the modelling data presented in Figure 9b predict that even with a significant increase in the number of active centres and the O2/CO ratio, the low-temperature activity in the CO oxidation reaction on massive platinum cannot be achieved.

2.3.2. Mathematical Modelling of the Dynamics of CO Oxidation over Pt-C

Based on the modelling of the dynamics of the CO oxidation reaction on the Pt foil, we can conclude that a different or additional reaction mechanism should be considered for the Pt-C catalysts that describe the CO oxidation at low temperatures. Literature data indicate that the activity of the catalyst at low temperatures can be explained by a concerted mechanism that includes the stages of molecular oxygen adsorption and CO adsorption and their interaction with the formation of CO2 and atomic oxygen [23,36].
CO(g) + * ↔ CO*
O2(g) + * → O2*
O2* + CO* → CO2 (g) + O* + *
Similar to the massive platinum, experimental data show that the surface of the catalyst oxidizes with the temperature increase [37]. To describe this process, two stages were introduced, the dissociation of molecular oxygen and the conversion of atomic oxygen into oxide:
O2* + * → 2O*
O* → Ox
Stage 6 of the oxide reduction was added as well:
CO(g) + Ox → CO2 (g) + *
Based on the above mechanism, the following kinetic model describing the dynamics of the θ C O , θ O 2 , θ O , and θ O x coverages of platinum by adsorbed CO, O2, O, and oxide species during the CO oxidation on the Pt-C catalyst was proposed:
d d t θ C O = k 6 P C O θ f k 6 θ C O k 8 θ O 2 θ C O ,
d d t θ O 2   = k 7 P O 2 θ f k 8 θ O 2 θ C O k 9 θ O 2 θ f ,
d d t θ O = 2 k 9 θ O 2 θ f k 10 θ O ,
d d t θ O x = k 10 θ O k 11 P C O θ O x .
Similar to the Pt foil, the following equations were considered to study the dynamics of the partial pressures P C O and P O 2 of CO and O2 in the gas phase:
d d t P C O   = 1 τ P C O i n P C O γ k 6 P C O θ f k 6 θ C O + k 11 P C O θ O x ,
d d t P O 2   = 1 τ P O 2 i n P O 2 γ k 7 P O 2 θ f .
To describe the data of the kinetic experiments, the values of the rate constants of the stages were estimated as k 6   = 6.75 × 10 5   s−1·bar−1, k 6 = 10 13 e 26 R T   s−1, k 7 = 0.0037   s−1·bar−1, k 8 = 1.5 × 10 2 e 7 R T   s−1, k 9 = 10 13 e 19 R T   s−1, k 10 = 10 13 e 29 R T   s−1, k 11 = 75   s−1·bar−1, R = 1.987 × 10 3 kcal/(mol·K), and T = reaction temperature, K.
The results of the modelling of the TPR-CO + O2 experiment (Figure 10) show that for a temperature range below 100 °C, the CO conversion curve can be described quite satisfactorily within the framework of the concerted mechanism (Stages 1–3). In contrast to the Pt foil, the Pt-C catalyst is characterized by large values of surface coverage with adsorbed O2. With a temperature increase, this coverage decreases as a result of the interaction of adsorbed O2 and CO (Stage 3 of the reaction mechanism), while the concentration of atomic oxygen grows due to the reactions described by Stages 3 and 4. The surface coverage with adsorbed CO increases at 120–170 °C because the O2 coverage depletion causes a decrease in the reaction rate (Stage 3). A fast decrease in the CO coverage at temperatures higher than 170 °C is caused by the desorption of CO. At a temperature higher than 150 °C, the atomic oxygen coverage also sharply decreases due to the formation of oxide species (Stage 5 of the reaction mechanism). The high activity of the Pt-C surface at temperatures above 150 °C is directly related to the action of the oxide as a result of Stage 6 of the mechanism under consideration. Within the framework of the reaction mechanisms and the kinetic model under consideration, it was possible to describe the dependence of the CO conversion on CO exposure (Figure 11a). The results show that the CO conversion is close to 100% up to ε~7000 for all analyzed CO concentrations. The presence of the oxidized centres on the surface of the catalyst can explain the high conversion of CO at low CO concentrations in the reaction mixture and at room temperature. Note that the results of the TPR-CO experiments (Figure 6) and XPS data (Figure 2b) indicate that about 30% of platinum in the Pt-C catalyst is in the oxidized state. An observed sharp decrease in the CO conversion at higher CO exposures can be associated with the reduction of the oxidized platinum centres. In this case, the low values of CO conversion are determined by the interaction of CO and O2 adsorbed on the reduced platinum centres (Figure 11c,d). As can be seen from Figure 11b, at times periods when there is a high conversion of CO, the rate of CO2 production is also large, which is consistent with the data of the kinetic experiments (Figure 5b).
The results of the modelling given in Figure A3 also describe a decrease in the catalyst activity for 50 ppm and 10 ppm CO in the reaction mixture. There is a narrowing of the CO exposure range in which the catalyst demonstrates high activity. This result can be explained by a decrease in the CO concentration in the gas phase. The modelling without the introduction of the oxidized centres on the initial catalyst surface shows that for some time the CO conversion is close to 100% (Figure A4). This is due to the adsorption of CO from the gas phase. In addition, there is a significant increase in the surface coverage with adsorbed O2. Because of the interaction of the adsorbed O2 and CO species, the rate of CO2 formation increases.
The results of the modelling of the TPR-CO + O2 experiment under significant oxygen excess, that is, 5 vol.% O2 and 50 ppm CO, demonstrate that the CO conversion is close to 100% (Figure 12a). The result can be explained by the presence of the oxidized centres on the surface of the catalyst; that is, oxidation reduction of the platinum clusters occurs within the whole considered temperature range (Stages 5 and 6 of the reaction mechanism). The presence of a peak on the CO2 production curve is associated with the interaction of adsorbed CO and O2 (Stage 3) during temperature increase (Figure 12b). The mean value of CO2 production during the whole temperature interval equals 1.
The high activity of the Pt-C catalyst is associated with the degree of oxidation of platinum. The study of the contributions of the various stages showed that when the oxide is slowly reduced as a result of Stage 6, the CO conversion values are close to 100%. The fast decrease in the CO conversion is due to a sharp decrease in the rate of CO consumption as a result of the concerted mechanism (Stage 1) (see Figure 13). So, this decrease in CO conversion is related to the switching between the MvK mechanism and the CO-assisted O2 dissociation mechanism. At the same time, adsorbed CO accumulates on the catalyst surface (see Figure 11). Then, there is a slow decrease in CO conversion due to a decrease in the rate of Stage 1.
The simulations of the isothermal experiment at 20 °C in the reaction mixture with 100 ppm CO and 5 vol.% O2 (Figure A5) showed that CO conversion is above 50% for several hours. As can be seen from Figure A5, CO conversion can be close to 100% for a long time. The time interval of high activity is determined by the oxide concentration on the surface of the platinum clusters. For example, when the initial coverage of the oxidized platinum clusters is 0.9, the CO conversion is about 100% for almost 70 h.

3. Materials and Methods

3.1. Synthesis

Synthesis of the MWCNTs and the Catalysts

The MWCNTs were obtained by decomposition of ethylene on 62 wt% Fe-8 wt% Ni-30 wt% Al2O3 catalyst at 700 °C in a flow reactor. The resulting MWCNTs were washed from the catalyst by nitric acid treatment. The details of the MWCNT synthesis procedure are given in [38].
The Pt–MWCNT composites (6 wt% Pt) were prepared using a binuclear nitrate complex (Me4N)2[Pt2(µ-OH)2(NO3)8] synthesized from H2PtCl6 nH2O according to the procedure described in [39,40]. A weighed portion of (Me4N)2[Pt2(µ-OH)2(NO3)8] was dissolved in acetone followed by the addition of the MWCNTs to the resulting solution. The suspension was processed in an ultrasonic bath and left for 12 h in a tightly closed container. The solvent was removed by evaporation until the visible traces of liquid disappeared and then were placed in an oven at 55°C. The dry residue was heated in a helium atmosphere to 350 °C at a rate of 2°C/min and kept at this temperature for 30 min. The sample is designated in the text as Pt-C. The specific surface area of the sample (SBET) was 152 m2/g.

3.2. Physicochemical Methods

Transmission electron microscopy (TEM) data were obtained using a double aberration-corrected Thermo Fisher Scientific Themis Z electron microscope operated at 200 kV. Images with a high atomic number contrast were acquired using a high-angle annular dark field (HAADF) detector in Scanning-TEM (STEM) mode. The samples for the TEM study were dispersed ultrasonically and deposited on copper grids covered with a holey carbon film.
X-ray photoelectron spectroscopy (XPS) experiments were performed on an ES-300 photoelectron spectrometer (KRATOS Analytical, Manchester, UK). The MgKα (hν = 1253.6 eV) X-ray source was employed. The Au4f7/2 and Cu2p3/2 lines of the gold and copper foils with binding energy (Eb) at 84.0 eV and 932.7 eV, respectively, were used for the spectrometer calibration. The C1s core-level spectrum was used as an internal reference, with Eb of the C1s peak maximum at 284.4 eV. This Eb (C1s) value corresponds to the sp2-hybridized graphitic carbon species [41]. The Pt4f spectra were fitted with a Doniach-Šunjić function (in case of the contribution of Pt0 species) or a combination of the Gaussian and Lorentzian functions (in case of the contribution of the oxidized platinum species) after Shirley background subtraction. The experimental spectra were proceeded in the XPS-Calc program [18,28,42].

3.3. Catalytic Properties

3.3.1. Temperature-Programmed Reaction (TPR-CO + O2)

The activity of catalysts in the CO oxidation reaction was studied in a flow reactor by the TPR-CO + O2 method with a heating rate of 10 °C/min [43]. Before catalytic testing, the samples were pretreated in an oxidative (1.0 vol.% O2/He) or reductive (1.0 vol.% H2/He) atmosphere at 350 °C for 2 h (denoted further as -Ox and -Red treatments, respectively). The Pt-C sample with a volume of ~0.4 cm3 and a mass of 0.1 g was heated from −40 to 350 °C. The Pt foil (20 × 15 mm, 99.99% purity, weight of 0.2 g, and the estimated SBET~0.003 m2/g) was rolled around the thermocouple pocket loaded into the reactor so that the space between the lap of the foil, the thermocouple pocket, and the reactor walls was filled with the α-Al2O3 particles of 0.25−0.5 mm in size. In this case, heating was carried out from 100 °C to 500 °C.
A reaction mixture containing 0.2 vol.% CO, 0.1–1 vol.% O2, and 0.5 vol.% Ne in flowing He was supplied at a rate of 1000 cm3/min, which corresponded to the space velocity (SV) 600 and 300 L/g·h for the Pt-C and the Pt foil catalysts, respectively. The concentrations of CO, CO2, O2, H2, and H2O were recorded using a mass spectrometer with a frequency of 0.27 Hz.

3.3.2. Isothermal Experiments

Before the isothermal experiments, the Pt-C catalyst was trained in 1.0 vol.% H2/He at 350 °C for 2 h. A reaction mixture containing 50 ppm CO, 5 vol.% O2, 0.5 vol.% Ne, and He-balance was fed to the catalyst at room temperature at a rate of 100 cm3/min (SV = 60 L/g·h), and the catalyst was kept in this mixture for 60 min. After that, the CO concentration was varied in a wide range: 75, 100, 200, 400, 800, and 1600 ppm. To change the CO concentration, the reaction mixture was sent past the reactor. After a new stationary CO concentration was reached, the reaction mixture was switched again to the reactor and kept for 60 min. The concentrations of CO, CO2, O2, H2, and H2O were recorded during the experiment using a mass spectrometer.
From the experimental data, CO conversion and CO2 production were calculated using the following equations: X C O = C C O i n C C O o u t C C O i n and P C O 2 = C C O 2 o u t C C O i n , where X C O is the CO conversion, P C O 2 is the CO2 production, C C O i n and C C O o u t are the inlet and outlet CO concentration (vol.%), and C C O 2 o u t is the outlet CO2 concentration (vol.%). The reaction rate was calculated using the following equation: W   m m o l   C O m o l   P t × s = C C O I n × X C O × V R M M P t , where C C O I n is the inlet CO concentration ( m m o l   C O c m 3 ), V R M is the reaction mixture rate ( c m 3 s ) , and M P t —Pt is the content (mol). CO exposure was calculated as follows: ε = time × C C O i n , where time is the experiment time (min).
The absence of heat transfer limitations was confirmed by Mears’ criterion. The calculated adiabatic heating at 25 °C was 0.5 °C and 16 °C for 50 and 1600 ppm, respectively (see Table A3 in the appendix for details). External diffusion restrictions were excluded by comparing the concentration of CO in the gas film above the catalyst surface with the CO concentration in the gas phase, and internal diffusion restrictions were excluded based on the Weiss criterion (see Table A3 for details).

3.3.3. Temperature-Programmed Desorption of CO (TPD-CO)

The Pt-C catalyst was pretreated in 1 vol.% H2/He at 350 °C for 1 h and cooled in helium to −40 °C. A gas mixture containing 1 vol.% CO, 0.5 vol.% Ne, and He-balance was fed at a rate of 100 cm3/min at −40 °C. After the CO concentration reached the initial level (1 vol.% CO), the CO supply was switched off, followed by helium feeding at −40 °C for 2 h. After the CO concentration reached the background value, heating was carried out up to 350 °C. During the experiment, the concentrations of CO, CO2, O2, H2 and H2O were recorded using a quadrupole mass spectrometer RGA 200 (Stanford Research Systems, Sunnyvale, CA, USA).

3.3.4. Temperature-Programmed Reaction with CO (TPR-CO)

The Pt-C catalyst was pretreated in 1.0 vol.% O2/He at 350 °C for 1 h and cooled in the same mixture to room temperature. After that, the catalyst was conditioned for 30 min in a continuous helium flow. The reaction mixture containing 1.0 vol.% CO, 0.5 vol.% Ne, and He-balance was fed to the oxidized catalyst cooled to −40 °C at a rate of 100 cm3/min. After the stationary value of CO concentration was reached, the catalyst was heated up to 350 °C. During the experiment, the concentrations of CO, CO2, O2, H2, and H2O were recorded using a mass spectrometer.

4. Conclusions

In this work, we carried out a kinetic study of the CO oxidation reaction on the model catalysts with the highly dispersed platinum species deposited on the multiwalled carbon nanotubes (Pt/MWCNTs). The average size of the Pt nanoparticles according to TEM data was 2.5 nm. It was established by XPS that the main state of Pt particles was metallic. However, some part of the platinum atoms was in the oxidized state, which was associated with the facile oxidation of the small clusters and the surface oxidation of the larger nanoparticles.
Kinetic studies were carried out by two methods. The first one was a standard method of temperature-programmed heating of the catalyst in the reaction mixture (TPR-CO + O2) with the most commonly used ratio of reagents: O2/CO = 5/1. These studies showed that the Pt/MWCNT catalysts were active in the CO oxidation reaction, and CO conversion was observed in a wide temperature range: from −20 °C up to 170 °C. The catalytic testing carried out on a bulk platinum foil, used as a reference sample, showed no conversion at temperatures below 200 °C, which was consistent with the known inhibition effect by adsorbed CO. The resulting comparison demonstrates the effect of the nanoscale state of the platinum on the surface of carbon nanotubes for the implementation of low-temperature CO oxidation.
The second method allowed studying the kinetic behaviour of the catalyst under isothermal conditions in an excess of oxygen in the reaction mixture. Isothermal studies of the reaction kinetics are of great importance for the development of indoor air purification catalysts operating at room temperature in a large excess of oxygen. The isothermal studies performed at room temperature showed high activity of the Pt/MWCNT catalyst, with the CO conversion values close to 100%, indicating the effect of O2 excess in the reaction medium.
To understand the nature of the activity of the Pt/MWCNT catalysts and establish the details of the mechanisms of the CO oxidation reaction, we conducted a mathematical modelling of experimental kinetic data collected both in the TPR-CO + O2 and isothermal modes. The simulation results showed that an almost complete description of the experimental kinetic data for the bulk platinum foil can be achieved within the concepts of LH and MvK mechanisms. However, for the description of the kinetic data of the Pt/MWCNT catalysts, the parameters describing the reaction on the bulk platinum foil in terms of the LH and MvK mechanisms were not suitable. A parametric analysis of the mathematical model, in particular, the dependence of CO conversion on the concentration of active sites and the O2/CO ratio, indicated the necessity of the introduction of an additional concerted mechanism, which is realized through the CO-O2 intermediate by the CO-assisted O2 dissociation route.
Simulation of the reaction in a large excess of O2 made it possible to establish the existence of the long-term nearly quasi-stationary states of the reaction with the high CO conversion under isothermal conditions. This kinetic effect was associated with the existence of facilitated redox transitions for small platinum particles. The time interval of the reduction of the active oxide, when high activity was observed, was inversely proportional to the concentration of CO in the gas phase.
A detailed comparison of the experimental and simulated kinetic data showed that complete modelling of the kinetic data is possible only within the framework of three mechanisms, the contribution of which to the integral reaction rate depends on the concentration of platinum active centres on the catalyst surface, temperature, and the ratio of O2 and CO in the reaction mixture.

Author Contributions

Conceptualization, A.B. and E.L.; methodology, E.S. and E.L.; validation, A.B. and O.P.; formal analysis, E.L.; investigation, L.K., E.S., A.S., O.S., A.Z., O.P. and D.Z.; writing—original draft preparation, E.S. and E.L.; writing—review and editing, A.B., E.S., E.L. and O.S., S.K.; visualization, E.L., L.K., E.S. and O.S.; supervision, S.K.; project administration, A.B.; funding acquisition, A.B. All authors have read and agreed to the published version of the manuscript.

Funding

This research was funded by Russian Science Foundation, grant number 21-13-00094.

Data Availability Statement

The data presented in this study are available on request from the corresponding author.

Acknowledgments

The TEM studies were carried out using facilities of the shared research centre National Center of Investigation of Catalysts at the Boreskov Institute of Catalysis.

Conflicts of Interest

The authors declare no conflict of interest. The funders had no role in the design of the study; in the collection, analyses, or interpretation of data; in the writing of the manuscript; or in the decision to publish the results.

Appendix A

Table A1. Catalytic characteristics of the Pt foil and the Pt-C catalyst.
CatalystO2/COT10, °CT50, °CT90, °C
Pt foil0.5300350375
1.25275315325
2.5265295305
5255280285
Pt-C-Ox525115150
Pt-C-Red5590125
Figure A1. (a) CO conversion and (b) CO2 production versus time for an experiment with initial CO concentration of 50 ppm at 25 °C.
Catalysts 13 00568 g0a1
Figure A2. (a) Time dependencies of CO oxidation reaction rate for various initial CO concentrations and (b) logarithmic dependencies of the initial reaction rates and the steady state rates on the initial CO concentration at 25 °C.
Catalysts 13 00568 g0a2
Figure A3. The calculated dependencies of (a) CO conversion, (b) CO2 production, and (c,d) the coverages of the platinum by the adsorbed CO and O2 on the CO exposure at 20 °C for the Pt-C catalyst at the initial oxide coverage 0.02. The composition of the reaction mixture: 5 vol.% O2 and x ppm CO (x = 10 and 50). C C O i n —is the inlet concentration of CO.
Catalysts 13 00568 g0a3
Table A2. TPR-CO, TPD-CO, and TPR-CO + O2 data.
T, °CCO, μmol/gCO2, μmol/gCO/PtCO2/Pt
TPR-CO2088880.280.28
TPD-CO−254 0.013
125, 175, 25025 0.08
300 3.6 0.012
TPR-CO + O210, 32 10 0.0324
Figure A4. The calculated dependencies of (a) CO conversion, (b) CO2 production, and (c,d) the coverages of the platinum by the adsorbed CO and O2 on the CO exposure at 20 °C for the Pt-C catalyst at the initial oxide coverage 0.02. The composition of the reaction mixture: 5 vol.% O2 and x ppm CO (x = 100, 200 and 400). C C O i n - is the inlet concentration of CO. The surface is reduced at the initial moment of time.
Catalysts 13 00568 g0a4
Figure A5. The dependencies of CO conversion on time at 20 °C, 5 vol.% O2, and 100 ppm CO. The initial oxide coverages of platinum clusters are 0.1, 0.5, and 0.9.
Catalysts 13 00568 g0a5

Appendix A.1. Absence of Mass Transport and Heat Transfer during Kinetic Measurements

The absence of mass transport resistances was checked by Weisz modulus (φ) for internal diffusion [44]: φ   = r o b s × ρ p × d p 2 D e f f × C C O b u l k < 1 . The role of external diffusion limitations can be estimated by comparing the concentration difference of CO over the gas film (ΔCCO) with the bulk concentration of CO ( C C O b u l k ) : Δ C C O = r o b s × d p 2 × ρ p 6 × S h × D A B < C C O b u l k = P C O R × T . If ΔCCO << CCObulk, then external diffusion does not limit the reaction rate.
  • robs = observed reaction rate, mol/kgcat·s;
  • N = reaction order—1;
  • dp = catalyst particle diameter—0.375 mm;
  • ρp = bulk density of catalyst bed—236.6 kg/m3;
  • Deff = effective diffusivity, m2/s;
  • C C O b u l k = bulk gas concentration of CO, mol/m3;
  • Sh is the Sherwood number;
  • DAB = 3.7 × 10⁻⁵ m2 s−1 = the binary gas diffusivity.

Appendix A.2. The Absence of Heat Transfer was Checked by Mears’ Criterion [45]

C M = Δ H r o b s ρ c d p   E a 2 h T 2 R g < 0.15 ,
where ∆H= heat of reaction = −283 kJ/mol; Ea = activation energy = 24.7 kJ/mol; h = heat transfer coefficient between gas and pellet = 6.5 × 10⁻² kJ/m2·s·K; Rg = gas constant = 8.314 × 10⁻³ kJ/mol·K; and T = reaction temperature, K.
Table A3. Calculated parameters for internal and external diffusion and heat transfer at 25 °C.
CCO, ppmrobs, mol/kgcat·sDeff, m2/s C C O b u l k ,   mol / m 3 ϕΔC(CO)CM
503.07 × 10−59.68 × 10−72.94 × 10−30.133.06 × 10−63.6 × 10⁻⁴
16009.82 × 10−49.68 × 10−76.54 × 10−20.139.81 × 10−51.1 × 10⁻²
Therefore, internal and external diffusion effects could be neglected during the kinetic experiments. The heat transfer effect during the kinetic experiment could also be neglected.

Appendix A.3. Calculation of Adiabatic Heating

ΔTad = QpC/(cpρ) = 0.5 °C at 25 °C and CO concentration 50 ppm, conversion 90%
Where Qp [kJ/mol]—heat of reaction = 283
C [mol/m3]—reacted CO concentration = 0.002
cp [kJ/(kg deg)]—specific heat = 1.043
ρ [kg/m3]—gas density—1.123
ΔTad = QpC/(cpρ) = 16 °C at 25 °C and CO concentration 1600 ppm, conversion 95%
Where Qp [kJ/mol]—heat of reaction = 283
C [mol/m3]—reacted CO concentration = 0.068
cp [kJ/(kg deg)]—specific heat = 1.043
ρ [kg/m3]—gas density = 1.123

References

  1. Etim, U.J.; Bai, P.; Gazit, O.M.; Zhong, Z. Low-Temperature Heterogeneous Oxidation Catalysis and Molecular Oxygen Activation. Chem. Rev. 2021, 1–187. [Google Scholar] [CrossRef]
  2. Royer, S.; Duprez, D. Catalytic Oxidation of Carbon Monoxide over Transition Metal Oxides. ChemCatChem 2011, 3, 24–65. [Google Scholar] [CrossRef]
  3. Kota, A.S.; Dadi, R.K.; Luss, D.; Balakotaiah, V. Analysis of light-off during oxidation of reactant mixtures on Pt/Al2O3 using micro-kinetic models. Chem. Eng. Sci. 2017, 166, 320–333. [Google Scholar] [CrossRef]
  4. Haneda, M.; Nakamura, Y.; Yamada, T.; Minami, S.; Kato, N.; Iwashina, K.; Endo, Y.; Nakahara, Y.; Iwachido, K. Comprehensive study of the light-off performance and surface properties of engine-aged Pd-based three-way catalysts. Catal. Sci. Technol. 2021, 11, 912–922. [Google Scholar] [CrossRef]
  5. Wu, X.; Xu, L.; Weng, D. The thermal stability and catalytic performance of Ce-Zr promoted Rh-Pd/[gamma]-Al2O3 automotive catalysts. Appl. Surf. Sci. 2004, 221, 375–383. [Google Scholar] [CrossRef]
  6. Aldridge, J.K.; Smith, L.R.; Morgan, D.J.; Carley, A.F.; Humphreys, M.; Clarke, M.J.; Wormald, P.; Taylor, S.H.; Hutchings, G.J. Ambient Temperature CO Oxidation Using Palladium–Platinum Bimetallic Catalysts Supported on Tin Oxide/Alumina. Catalysts 2020, 10, 1223. [Google Scholar] [CrossRef]
  7. Razon, L.F.; Schmitz, R.A. Intrinsically Unstable Behavior during the Oxidation of Carbon Monoxide on Platinum. Chem. Rev. 1986, 28, 89–164. [Google Scholar] [CrossRef]
  8. Aghalayam, P.; Park, Y.K.; Vlachos, D.G. A detailed surface reaction mechanism for CO oxidation on Pt. Proc. Combust. Inst. 2000, 28, 1331–1339. [Google Scholar] [CrossRef]
  9. Engel, T.; Ertl, G. Elementary Steps in the Catalytic Oxidation of Carbon Monoxide on Platinum Metals. In Advances in Catalysis; Eley, D.D., Pines, H., Weez, P.B., Eds.; Academic Press: Cambridge, MA, USA, 1979; Volume 28, pp. 1–78. [Google Scholar]
  10. Hori, G.K.; Schmidt, L.D. Transient kinetics in CO oxidation on platinum. J. Catal. 1975, 38, 335–350. [Google Scholar] [CrossRef]
  11. Fischer-Wolfarth, J.H.; Farmer, J.A.; Flores-Camacho, J.M.; Genest, A.; Yudanov, I.V.; Rösch, N.; Campbell, C.T.; Schauermann, S.; Freund, H.J. Particle-size dependent heats of adsorption of CO on supported Pd nanoparticles as measured with a single-crystal microcalorimeter. Phys. Rev. B Condens. Matter. 2010, 81, 241416. [Google Scholar] [CrossRef] [Green Version]
  12. Yudanov, I.V.; Matveev, A.V.; Neyman, K.M.; Rösch, N. How the C−O Bond Breaks during Methanol Decomposition on Nanocrystallites of Palladium Catalysts. J. Am. Chem. Soc. 2008, 130, 9342–9352. [Google Scholar] [CrossRef] [PubMed]
  13. DeRita, L.; Dai, S.; Lopez-Zepeda, K.; Pham, N.; Graham, G.W.; Pan, X.; Christopher, P. Catalyst Architecture for Stable Single Atom Dispersion Enables Site-Specific Spectroscopic and Reactivity Measurements of CO Adsorbed to Pt Atoms, Oxidized Pt Clusters, and Metallic Pt Clusters on TiO2. J. Am. Chem. Soc. 2017, 139, 14150–14165. [Google Scholar] [CrossRef] [PubMed]
  14. Mason, M.G. Electronic structure of supported small metal clusters. Phys. Rev. B 1983, 27, 748–762. [Google Scholar] [CrossRef]
  15. Bayindir, Z.; Duchesne, P.N.; Cook, S.C.; MacDonald, M.A.; Zhang, P. X-ray spectroscopy studies on the surface structural characteristics and electronic properties of platinum nanoparticles. J. Chem. Phys. 2009, 131, 244716. [Google Scholar] [CrossRef] [PubMed]
  16. Wang, J.; Sauter, E.; Nefedov, A.; Heißler, S.; Maurer, F.; Casapu, M.; Grunwaldt, J.-D.; Wang, Y.; Wöll, C. Dynamic Structural Evolution of Ceria-Supported Pt Particles: A Thorough Spectroscopic Study. J. Phys. Chem. C 2022, 126, 9051–9058. [Google Scholar] [CrossRef]
  17. Wong, S.; Flytzani-Stephanopoulos, M.; Chen, M.; Hutchinson, T.E.; Schmidt, L.D. Morphologies of Pt catalyst surfaces. J. Vac. Sci. Technol. 1977, 14, 452–455. [Google Scholar] [CrossRef]
  18. Kibis, L.; Zadesenets, A.; Garkul, I.; Korobova, A.; Kardash, T.; Slavinskaya, E.; Stonkus, O.; Korenev, S.; Podyacheva, O.; Boronin, A. Pd-Ce-Ox/MWCNTs and Pt-Ce-Ox/MWCNTs Composite Materials: Morphology, Microstructure, and Catalytic Properties. Materials 2022, 15, 7485. [Google Scholar] [CrossRef]
  19. Altass, H.M.; Morad, M.; Khder, A.E.-R.S.; Mannaa, M.A.; Jassas, R.S.; Alsimaree, A.A.; Ahmed, S.A.; Salama, R.S. Enhanced Catalytic Activity for CO Oxidation by Highly Active Pd Nanoparticles Supported on Reduced Graphene Oxide /Copper Metal Organic Framework. J. Taiwan Inst. Chem. Eng. 2021, 128, 194–208. [Google Scholar] [CrossRef]
  20. Salama, R.S.; Mannaa, M.A.; Altass, H.M.; Ibrahim, A.A.; Khder, A.E.-R.S. Palladium supported on mixed-metal–organic framework (Co–Mn-MOF-74) for efficient catalytic oxidation of CO. RSC Adv. 2021, 11, 4318–4326. [Google Scholar] [CrossRef]
  21. Altass, H.M.; Ahmed, S.A.; Salama, R.S.; Moussa, Z.; Jassas, R.S.; Alsantali, R.I.; Al-Rooqi, M.M.; Ibrahim, A.A.; Khder, M.A.; Morad, M.; et al. Low Temperature CO Oxidation Over Highly Active Gold Nanoparticles Supported on Reduced Graphene Oxide@Mg-BTC Nanocomposite. Catal. Lett. 2023, 153, 876–886. [Google Scholar] [CrossRef]
  22. Wojciechowski, B.W.; Asprey, S.P. Kinetic studies using temperature-scanning: The oxidation of carbon monoxide. Appl. Catal. A: Gen. 2000, 190, 1–24. [Google Scholar] [CrossRef]
  23. Allian, A.D.; Takanabe, K.; Fujdala, K.L.; Hao, X.; Truex, T.J.; Cai, J.; Buda, C.; Neurock, M.; Iglesia, E. Chemisorption of CO and Mechanism of CO Oxidation on Supported Platinum Nanoclusters. J. Am. Chem. Soc. 2011, 133, 4498–4517. [Google Scholar] [CrossRef] [PubMed]
  24. Kibis, L.S.; Korobova, A.N.; Zadesenets, A.V.; Romanenko, A.V.; Kardash, T.Y.; Stonkus, O.A.; Korenev, S.V.; Podyacheva, O.Y.; Slavinskaya, E.M.; Boronin, A.I. Catalysts for Low-Temperature CO Oxidation Based on Platinum, CeO2, and Carbon Nanotubes. Dokl. Phys. Chem. 2022, 505, 115–121. [Google Scholar] [CrossRef]
  25. Peuckert, M.; Bonzel, H.P. Characterization of oxidized platinum surfaces by X-ray photoelectron spectroscopy. Surf. Sci. 1984, 145, 239–259. [Google Scholar] [CrossRef]
  26. Kaushik, V.K. Identification of Mixed Platinum States and Electronic Effects of Support on Platinum in Supported Catalysts. Z. Für Phys. Chem. 1991, 173, 105–113. [Google Scholar] [CrossRef]
  27. Kalinkin, A.V.; Smirnov, M.Y.; Nizovskii, A.I.; Bukhtiyarov, V.I. X-ray photoelectron spectra of platinum compounds excited with monochromatic AgLα irradiation. J. Electron Spectrosc. Relat. Phenom. 2010, 177, 15–18. [Google Scholar] [CrossRef]
  28. Svintsitskiy, D.A.; Kibis, L.S.; Stadnichenko, A.I.; Koscheev, S.V.; Zaikovskii, V.I.; Boronin, A.I. Highly Oxidized Platinum Nanoparticles Prepared through Radio-Frequency Sputtering: Thermal Stability and Reaction Probability towards CO. ChemPhysChem 2015, 16, 3318–3324. [Google Scholar] [CrossRef]
  29. Eiswirth, M.; Ertl, G. Kinetic oscillations in the catalytic CO oxidation on a Pt(110) surface. Surf. Sci. 1986, 177, 90–100. [Google Scholar] [CrossRef]
  30. Vishnevskii, A.L.; Savchenko, V.I. Self-oscillations in the rate of CO oxidation on Pt(110). React. Kinet. Catal. Lett. 1989, 38, 167–173. [Google Scholar] [CrossRef]
  31. Van Spronsen, M.A.; Frenken, J.W.M.; Groot, I.M.N. Observing the oxidation of platinum. Nat. Commun. 2017, 8, 429. [Google Scholar] [CrossRef] [Green Version]
  32. Luo, H.; Park, S.; Chan, H.Y.H.; Weaver, M.J. Surface Oxidation of Platinum-Group Transition Metals in Ambient Gaseous Environments:  Role of Electrochemical versus Chemical Pathways. J. Phys. Chem. B 2000, 104, 8250–8258. [Google Scholar] [CrossRef]
  33. Lashina, E.A.; Chumakova, N.A.; Chumakov, G.A.; Boronin, A.I. Chaotic dynamics in the three-variable kinetic model of CO oxidation on platinum group metals. Chem. Eng. J. 2009, 154, 82–87. [Google Scholar] [CrossRef]
  34. Van Spronsen, M.A.; Frenken, J.W.M.; Groot, I.M.N. Surface science under reaction conditions: CO oxidation on Pt and Pd model catalysts. Chem. Soc. Rev. 2017, 46, 4347–4374. [Google Scholar] [CrossRef] [Green Version]
  35. Sales, B.C.; Turner, J.E.; Maple, M.B. Oscillatory oxidation of CO over Pt, Pd and Ir catalysts: Theory. Surf. Sci. 1982, 114, 381–394. [Google Scholar] [CrossRef]
  36. Garcia-Martinez, F.; García-Fernández, C.; Simonovis, J.P.; Hunt, A.; Walter, A.; Waluyo, I.; Bertram, F.; Merte, L.R.; Shipilin, M.; Pfaff, S.; et al. Catalytic Oxidation of CO on a Curved Pt(111) Surface: Simultaneous Ignition at All Facets through a Transient CO-O Complex. Angew. Chem. Int. Ed. 2020, 59, 20037–20043. [Google Scholar] [CrossRef]
  37. Stakheev, A.Y.; Bokarev, D.A.; Prosvirin, I.P.; Bukhtiyarov, V.I. Chapter 8—Particle-Size Effect in Catalytic Oxidation Over Pt Nanoparticles. In Advanced Nanomaterials for Catalysis and Energy; Sadykov, V.A., Ed.; Elsevier: Amsterdam, The Netherlands, 2019; pp. 295–320. [Google Scholar]
  38. Podyacheva, O.Y.; Suboch, A.N.; Yashnik, S.A.; Salnikov, A.V.; Cherepanova, S.V.; Kibis, L.S.; Simenyuk, G.Y.; Romanenko, A.I.; Ismagilov, Z.R. Effect of Structure and Surface State of Nitrogen Doped Carbon Nanotubes on Their Functional and Catalytic Properties. J. Struct. Chem. 2021, 62, 771–781. [Google Scholar] [CrossRef]
  39. Vasilchenko, D.; Tkachev, S.; Baidina, I.; Korenev, S. Speciation of Platinum(IV) in Nitric Acid Solutions. Inorg. Chem. 2013, 52, 10532–10541. [Google Scholar] [CrossRef]
  40. Vasilchenko, D.; Topchiyan, P.; Berdyugin, S.; Filatov, E.; Tkachev, S.; Baidina, I.; Komarov, V.; Slavinskaya, E.; Stadnichenko, A.; Gerasimov, E. Tetraalkylammonium Salts of Platinum Nitrato Complexes: Isolation, Structure, and Relevance to the Preparation of PtOx/CeO2 Catalysts for Low-Temperature CO Oxidation. Inorg. Chem. 2019, 58, 6075–6087. [Google Scholar] [CrossRef]
  41. Larciprete, R.; Gardonio, S.; Petaccia, L.; Lizzit, S. Atomic oxygen functionalization of double walled C nanotubes. Carbon 2009, 47, 2579–2589. [Google Scholar] [CrossRef]
  42. Kibis, L.S.; Zadesenets, A.V.; Garkul, I.A.; Korobova, A.N.; Kardash, T.Y.; Fedorova, E.A.; Slavinskaya, E.M.; Stonkus, O.A.; Korenev, S.V.; Podyacheva, O.Y.; et al. Pd-Ce-Ox species on MWCNTs surface: Probing the structure-activity correlation in low-temperature CO oxidation. Appl. Surf. Sci. 2023, 611, 155750. [Google Scholar] [CrossRef]
  43. Boronin, A.I.; Slavinskaya, E.M.; Figueroba, A.; Stadnichenko, A.I.; Kardash, T.Y.; Stonkus, O.A.; Fedorova, E.A.; Muravev, V.V.; Svetlichnyi, V.A.; Bruix, A.; et al. CO oxidation activity of Pt/CeO2 catalysts below 0 °C: Platinum loading effects. Appl. Catal. B Environ. 2021, 286, 119931. [Google Scholar] [CrossRef]
  44. Carlsson, P.-A.; Zhdanov, V.; Skoglundh, M. Self-sustained kinetic oscillations in CO oxidation over silica-supported Pt. Phys. Chem. Chem. Phys. 2006, 8, 2703–2706. [Google Scholar] [CrossRef] [PubMed] [Green Version]
  45. Liu, H.-H.; Wang, Y.; Jia, A.-P.; Wang, S.-Y.; Luo, M.-F.; Lu, J.-Q. Oxygen vacancy promoted CO oxidation over Pt/CeO2 catalysts: A reaction at Pt–CeO2 interface. Appl. Surf. Sci. 2014, 314, 725–734. [Google Scholar] [CrossRef]
Figure 1. TEM data for the Pt-C catalyst: (a) TEM image. The Pt particle size distribution is shown in the inset. (b,c) HRTEM images with an indication of the interplanar distances, corresponding to metallic platinum. The FFT pattern of the region marked by the square is shown in the inset (panel b). (d) HAADF-STEM image. Red circular marks indicate single Pt atoms and Pt clusters on the MWCNT surface.
Catalysts 13 00568 g001
Figure 2. Pt4f spectra of (a) Pt foil and (b) Pt-C catalyst.
Catalysts 13 00568 g002
Figure 3. Temperature dependencies of CO conversion for (a) Pt foil at O2/CO = 0.5, 1.25, 2.5 and 5 and (b) Pt foil and Pt-C at O2/CO = 5. Ox, pretreatment in oxidative (1.0 vol.% O2/He), and Red, pretreatment in reductive (1.0 vol.% H2/He) atmospheres at 350 °C for 2 h. The reaction mixture contains 0.2 vol.% CO, 0.1–1 vol.% O2, and 0.5 vol.% Ne and He balance. The reaction mixture rate was 1000 cm3/min, which corresponded to the space velocity (SV) 600 and 300 L/g·h for the Pt-C catalyst and the Pt foil, respectively. The heating rate was 10 °C/min.
Catalysts 13 00568 g003
Figure 4. (a) CO conversion and (b) CO2 production versus time at 25 °C. The reaction mixture contains 50, 75, 100, 200, 400, 800, and 1600 ppm CO, 5 vol.% O2, 0.5 vol.% Ne, and He balance. The reaction mixture rate was 100 cm3/min. SV = 60 L/g·h.
Catalysts 13 00568 g004
Figure 5. Dependencies of (a) CO conversion and (b) CO oxidation rate on CO exposure at 25 °C. The reaction mixture contains 50, 75, 100, 200, 400, 800, and 1600 ppm CO, 5 vol.% O2, 0.5 vol.% Ne, and He balance. The reaction mixture rate was 100 cm3/min. SV = 60 L/g·h.
Catalysts 13 00568 g005
Figure 6. The Pt-C catalyst. (a) Temperature dependencies of CO consumption and CO2 evolution during TPR-CO experiments; (b) Temperature dependencies of CO and CO2 evolution during TPD-CO experiments. The reaction mixture contains 1.0 vol.% CO, 0.5 vol.% Ne, and He balance. The reaction mixture rate was 100 cm3/min. The heating rate was 10 °C/min. TPR-CO: The heating was carried out in the reaction mixture. TPD-CO: After the initial CO concentration (1 vol.% CO) was reached, the CO supply was turned off, followed by helium supply at −40°C for 2 h. The heating was carried out in helium.
Catalysts 13 00568 g006
Figure 7. Temperature dependencies of CO conversion and CO2 production during TPR-CO + O2 experiments: (a) first and (b) second heating runs in the reaction mixture. The reaction mixture contains 50 ppm CO, 5 vol.% O2, 0.5 vol.% Ne, and He balance. The reaction mixture rate was 100 cm3/min. SV = 60 L/g·h.
Catalysts 13 00568 g007
Figure 8. Temperature dependencies of CO conversion and the coverages of the Pt foil surface with adsorbed CO, O and oxide species at the O2/CO ratio (a) 5 and (b) 0.5. The inlet concentration of CO was 0.2 vol.%. The dotted black curves correspond to the CO conversion during the kinetic experiments, while the solid red curves are the results of the CO conversion modelling. The fitted kinetic parameters are k1 = 6.75 × 10⁴ s−1·mbar−1, k 1 = 8 × 10 8 e 13 R T   s−1, k 2 = 750 s−1·mbar−1, k 3 = 3 × 10 12 e 27 R T   s−1, k 4 = 10 12 e 25 R T   s−1, and k 5 = 1.5 × 10 13 e 25 R T   s−1·bar−1.
Catalysts 13 00568 g008
Figure 9. Temperature dependencies of CO conversion at different values of (a) the area of the catalyst surface (S0 is the area of the Pt foil surface) and (b) O2/CO ratio (the inlet CO concentration—0.2 vol%). The fitted kinetic parameters are k1 = 6.75 × 10⁴ s−1 mbar−1, k 1 = 8 × 10 8 e 13 R T   s−1, k2 = 750 s−1·mbar−1, k 3 = 3 × 10 12 e 27 R T   s−1, k 4 = 10 12 e 25 R T   s−1, and k 5 = 1.5 × 10 13 e 25 R T   s−1·bar−1.
Catalysts 13 00568 g009
Figure 10. Temperature dependencies of (a) CO conversion and (b) coverages of the platinum by adsorbed species during the TPR-CO + O2 on the Pt-C catalyst at the ratio O2/CO = 5 (inlet O2 concentration—5 vol.%). The dotted curves correspond to the experimental data, and the solid lines are results of the modelling. The estimated rate constants are k 6 = 6.75 × 10 5   s−1·bar−1, k 6 = 10 13 e 26 R T   s−1, k 7   = 0.0037   s−1·bar−1, k 8 = 1.5 × 10 2 e 7 R T   s−1, k 9 = 10 13 e 19 R T   s−1, k 10 = 10 13 e 29 R T   s−1, and k 11 = 75   s−1·bar−1. The values of the parameters characterizing the experimental conditions are presented in Section 3, Material and Methods.
Catalysts 13 00568 g010
Figure 11. The calculated dependencies of CO conversion, CO2 production, and the coverages of the platinum by the adsorbed CO and O2 on the CO exposure at 20 °C for the Pt-C catalyst at the initial oxide coverage 0.02. The composition of the reaction mixture is 5 vol.% O2 and x ppm CO (x = 100, 200, 400, and 800). C C O i n - is the inlet concentration of CO. The estimated rate constants are k 6 = 6.75 × 10 5   s−1·bar−1, k 6 = 10 13 e 26 R T   s−1, k 7 = 0.0037   s−1·bar−1, k 8 = 1.5 × 10 2 e 7 R T   s−1, k 9   = 10 13 e 19 R T   s−1, k 10 = 10 13 e 29 R T   s−1, and k 11 = 75   s−1·bar−1. The values of the parameters characterizing the experimental conditions are presented in Section 3, Material and Methods.
Catalysts 13 00568 g011
Figure 12. Temperature dependencies of (a) CO conversion and the coverages of the platinum by adsorbed CO, O, O2, and oxide species and (b) CO2 production for the Pt-C catalyst. The concentrations of O2 and CO were 5 vol.% and 50 ppm, respectively. The estimated rate constants are k 6 = 6.75 × 10 5   s−1·bar−1, k 6   = 10 13 e 26 R T   s−1, k 7 = 0.0037   s−1·bar−1, k 8 = 1.5 × 10 2 e 7 R T   s−1, k 9 = 10 13 e 19 R T   s−1, k 10 = 10 13 e 29 R T   s−1, and k 11 = 75   s−1·bar−1. The values of the parameters characterizing the experimental conditions are presented in Section 3, Material and Methods.
Catalysts 13 00568 g012
Figure 13. The dependencies of (a) CO conversion and (b) the rates of Stages 1 and 6 on CO exposure at 20 °C, 100 ppm CO, and 5 vol.% O2 for the Pt-C catalyst. C C O i n is the CO concentration at the reactor inlet. Initial exposition was 250 ppm × min. The estimated rate constants are k 6 = 6.75 × 10 5   s−1·bar−1, k 6 = 10 13 e 26 R T   s−1, k 7 = 0.0037   s−1·bar−1, k 8 = 1.5 × 10 2 e 7 R T   s−1, k 9 = 10 13 e 19 R T   s−1, k 10   = 10 13 e 29 R T   s−1, and k 11 = 75   s−1·bar−1. The values of the parameters characterizing the experimental conditions are presented in Section 3, Material and Methods.
Catalysts 13 00568 g013
Table 1. List of the species on the Pt foil surface and the corresponding coverages ( θ i ).
Free CentreAdsorbed COAdsorbed OOxide
*CO*O*Ox
θ f
θ C O
θ O
θ O x
Disclaimer/Publisher’s Note: The statements, opinions and data contained in all publications are solely those of the individual author(s) and contributor(s) and not of MDPI and/or the editor(s). MDPI and/or the editor(s) disclaim responsibility for any injury to people or property resulting from any ideas, methods, instructions or products referred to in the content.

