Article

Fabrication of High Surface Area TiO2-MoO3 Nanocomposite as a Photocatalyst for Organic Pollutants Removal from Water Bodies

1
Department of Chemistry, University of Sharjah, Sharjah 27272, United Arab Emirates
2
Donaldson Company, Bloomington, MN 55431, USA
3
Department of Biology, Chemistry and Environmental Sciences, American University of Sharjah, Sharjah 26666, United Arab Emirates
4
Sustainable Energy & Power Systems Research Center, RISE, University of Sharjah, Sharjah 27272, United Arab Emirates
5
Program in Environmental and Polymer Engineering, Graduate School of INHA University, 100 Inha-ro, Michuhol-gu, Incheon 22212, Republic of Korea
6
Department of Environmental Engineering, INHA University, 100 Inha-ro, Michuhol-gu, Incheon 22212, Republic of Korea
7
Department of Physics, American University of Sharjah, Sharjah 26666, United Arab Emirates
*
Authors to whom correspondence should be addressed.
Catalysts 2023, 13(2), 362; https://doi.org/10.3390/catal13020362
Submission received: 6 January 2023 / Revised: 27 January 2023 / Accepted: 31 January 2023 / Published: 7 February 2023
(This article belongs to the Special Issue Advances in Photocatalysis for the Degradation of Organic Pollutants)

Abstract

:
A nanocomposite (NC) of titanium (IV) oxide (TiO2) and molybdenum (VI) oxide (MoO3) was synthesized using a hydrothermal route. Detailed analyses using transmission electron microscopy, X-ray diffraction, X-ray fluorescence (XRF), Brunauer–Emmett–Teller (BET) isotherms, X-ray photoelectron spectroscopy, Raman, and diffuse reflectance infrared Fourier transform spectroscopy were carried out and confirmed the successful formation of pure TiO2-MoO3 (Ti-Mo) NC. The Ti-Mo NC possesses sizes in the range of 150–500 nm. XPS, Raman, and DRIFT shift measurements confirmed the formation of mixed oxide linkage in the form of Ti-O-Mo. Sorption of nitrogen isotherms revealed a significant increase in the number and pore widths of mesopores in the NC. Water sorption isotherms revealed enhanced affinity of the nanocomposites for water relative to the pure metal oxides. The BET surface area for Ti-Mo NC from the nitrogen adsorption isotherm was 129.3 m2/g which is much higher than the pure metal oxides (i.e., 37.56 m2/g for TiO2 and 2.21 m2/g for MoO3). The Ti-Mo NC provided suitable adsorption sites that captured the studied carbamates from the solution and promoted their photodegradation process. The photocatalytic degradation of MB in the presence of the catalyst was enhanced by 2.9 and 5.5 folds upon irradiation with white LED and 302 nm UV light sources, respectively.

Graphical Abstract

1. Introduction

Nanomaterials have captured the interest of the scientific community due to their small sizes and tunable structures. One of the most used semiconductor nanomaterials is titanium(IV) oxide (TiO2) which is known to be non-toxic, cheap, and thermally stable [1]. It has a broad bandgap of Eg = 3.2 eV for anatase [1] and is an excellent photocatalyst when irradiated with direct UV light; however, its photocatalytic activity is limited (4%) under sunlight or visible light [1,2]. However, the photocatalytic activity of TiO2 under sunlight or visible lights can be enhanced by combining TiO2 with visible-light-excited materials such as MoO3. Such composition changes the inherent light absorption characteristics of TiO2 [2,3,4,5,6,7,8]. MoO3 is an n-type semiconductor with high chemical stability and unique structural and optical properties [9,10,11]. Combining MoO3 with TiO2 showed synergetic photochemical and photochromic properties making the fabricated nanocomposite a reliable photocatalyst [12,13,14,15]. The TiO2-MoO3 nanocomposite (NC) is widely used in environmental research [8,13,14,15,16], water treatment [2,3,17,18,19], agriculture, color displays, and smart windows [5]. The photocatalytic effect of TiO2-MoO3 NC in water treatment enhanced the degradation of methylene blue (MB) and rhodamine B (RhB) dyes compared with its parent oxides [19,20]. A similar effect was observed in the photodegradation of molasses and the decomposition of the stearic acid film [2,6]. In addition, TiO2-MoO3 NC showed attractive electrochemical properties in lithium-ion batteries [12,14].
TiO2 exists in anatase, rutile, and brookite geometries with anatase being the most utilized geometry [21,22]. The common geometries for MoO3 are orthorhombic and hexagonal [23,24]. Several methods were developed for the synthesis of TiO2-MoO3 NC using femtosecond laser ablation [3], hydrothermal [5,14,15,18,19], sol–gel [2,16], mechanochemical activation [17], and template-assisted microwave [12]. One study reported the fabrication of TiO2-MoO3 nanotube from Ti-Mo alloy via electrochemical anodization [8]. Another study used dry mixing of TiO2 and MoO3 followed by calcination at several temperatures ranging from 290 °C to 1200 °C [7]. The modification of TiO2-MoO3 NC with Ag improved the photoelectrochemical stability by promoting large photo-conversion efficiency, broadening the spectrum of light response, and improving the charge separation efficiency [25]. Similarly, the modification of metal oxides NCs with graphitic carbon nitride (g-C3N4) increased the photogenerated hole/electron separation in individual metal oxides including TiO2 and MoO3 [26,27].
Due to the increasing use of pesticides in food production, it is important to provide strategies to eliminate such toxic chemicals from water bodies. Carbamate pesticides are stable substituted esters of carbamic acid with aliphatic or aromatic substituents on the oxygen and nitrogen atoms. They are a class of pesticides among the most commonly used worldwide to enhance the cultivation of rice, cotton, nuts, fruits, corn, potatoes, and other vegetables [28,29,30,31]. Further, organic dye contaminants from textile factories and home wastewater have recently prompted substantial research interest in water treatment. MB is a highly fluorescent dye that is widely used as a stimulant for pharmaceutical waste contaminated in water bodies.
In this study, we report the adsorption and photocatalytic degradation of MB and two carbamate pesticides using Ti-Mo NC. The significant increase in the surface area of Ti-Mo NC due to the synergetic effect of combining Ti-Mo into one composite produced more active sites on the surface and enhanced the catalytic/photocatalytic activity of the material, promoting a promising catalyst for the organic dyes and pesticides removal.

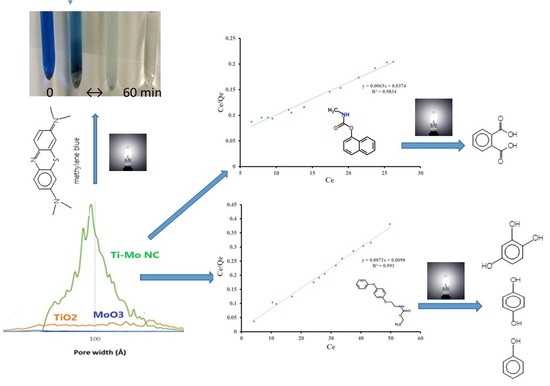
2. Results and Discussion

The obtained Ti-Mo NC powder was analyzed using the SEM/EDX instrument for its morphology and elemental composition. Figure 1 shows the image of the surface of Ti-Mo NC, Figure 1A, and its respective elemental composition, Figure 1B. As shown in Figure 1A, SEM analysis of Ti-Mo NC shows a uniform particle distribution with spherical morphology. In addition, the nanocomposite aggregates are small crystals with regular spherical shapes with sizes within the range of 150–500 nm. EDX analysis presented in Figure 1B shows Ti-Mo NC of 35% Mo, 15% Ti, and 50% oxygen with the formula [TiMoO10]n. For maximum accuracy, EDX analysis was obtained from a total of seven various areas, and the uniformity of Ti-Mo NC was further confirmed.
Figure 2 shows TEM images of MoO3 and Ti-Mo NC. As shown in Figure 2A–C, MoO3 particles with different sizes and shapes were produced. The average size of MoO3 particles is 132 ± 44 nm; however, the size of large MoO3 particles is 501.5 ± 146.8 nm. The measured lattice spacing of 0.38 nm in Figure 2C corresponds to the (110) plane of MoO3 [32]. Moreover, typical diffraction patterns of MoO3 were observed from selective area electron diffraction (SAED) analysis (Figure 2D). As shown in Figure 2E,F for Ti-Mo NC, angular and spherical particles with a size of 278 ± 66 nm were observed. Their shapes are very close to hexagonal or tetragonal. The electron diffraction patterns in Figure 2H produced by SAED analysis confirmed the formation of Ti-Mo NC.
Figure 3 shows the XRD patterns of Ti-Mo NC which are different from the pure oxides. TiO2 powder consists of both anatase and rutile phases. Constituent MoO3 also exhibited a spectrum in line with previously reported high-purity phases. In the panel A of Figure 3, we marked all possible peaks assigned to TiO2 and MoO3. One of the noticeable features in the obtained spectrum is the peak broadening, which can be indicative of the nanocomposite formation. One such example of successful nanocomposite formation is shown in the inset of Figure 3. The (111) peak of MoO3 at 2θ = 25.13° overlaps with the (101) anatase peak of TiO2 at 2θ = 24.68°. The full-width half maximum of the nanocomposite peak is approximately doubled relative to the pure oxides. Such peak merging occurs at all angles marked with (*) in the spectrum. In conclusion, the obtained XRD data reveal a uniform high-quality nanocomposite.
To further characterize and understand the material’s composition and the associated surface properties, we relied on XPS, XRF, FTIR, and Raman techniques. Figure 4 shows the XPS and XRF spectra obtained for the prepared Ti-Mo NC. The results presented in Figure 4 support the formation of ultra-pure Ti-Mo NC with no indication of the presence of any impurities including sodium or chloride ions. Figure 4A shows the XPS spectrum for Ti-Mo NC illustrating the characteristic high-purity peaks obtained for Mo, O, and Ti in the composite material. For example, the Mo 3d3/2 and 3 s peaks appearing at 235.55 and 497.2 eV, respectively, are aligned with the reported binding energy values corresponding to the 3d mode for Mo indicating the presence of Mo(VI) oxidation state [33,34,35]. In addition, the Ti 2p peak appearing at 458.3 eV is aligned with the observed peak for the titanium oxide composite [34]. Finally, the O1s binding energy in Ti-Mo NC is broad and provides 2 unified signals at 528.1 and 530.7 eV which is typical for the oxygen binding to the Ti or Mo ion’s environment. For instance, the O1s peak appears at 530.7 eV for O2− bulk of MoO3 (observed at 531.8 eV) while the 528.1 eV peak is assigned to TiO2 that was observed at 528.6 eV for the pure TiO2 sample. The observed shift supports the presence of the Ti-O-Mo linkage [36]. Similarly, the XRF data presented in Figure 4B indicate the presence of Ti and Mo in the nanocomposite material with no indication of any impurities. As shown in Figure 4B, major bands appear at 4.51 and 4.93 KeV and are assigned to the Ti primary lines Kα and Kβ, respectively. Further, the Mo Kα and Kβ primary lines observed at 17.48 and 19.62 KeV indicate the presence of Mo in the nanocomposite.
Figure 5 shows the Raman (Figure 5A) and diffuse reflectance infrared spectroscopy (DRIFT) spectra (Figure 5B) for the prepared nanocomposite(s). Raman spectra showed vibrational modes associated with the presence of Mo-O and Ti-O bonds. The two vibrational modes that appear at 433 cm−1 and 592 cm−1 are assigned to the B1g and A1g modes in the anatase crystalline phase. These modes were slightly shifted to a higher wavenumber compared with pure anatase titania at 397 cm−1 and 516 cm−1 [37]. Furthermore, the Mo-O stretching modes appear at 817 cm−1, 833 cm−1, and 917 cm−1 corresponding to metal–oxygen molybdate structure on titania, which was shifted to lower wavenumbers from the pattern observed and previously reported for MoO3 [13,20]. To further explore changes in the morphology of the nanocomposite, DRIFT was performed for the Ti-Mo NC and the pure MoO3 and TiO2 samples that were prepared under similar conditions. As presented in Figure 5B, The DRIFT spectrum for Ti-Mo NC showed a high potential to water vapor intake compared with the water adsorbed on pure MoO3 and TiO2. In addition to the high adsorption capacity, water vibrational modes over Ti-Mo NC showed two different broad features in the range 3100–3500 cm−1, indicating variation in the surface modes compared with the pure crystalline materials. Further, the M-OH surface modes at 3590 cm−1 and 3681 cm−1 indicate a shift in the Ti-OH vibrational mode that appears at 3695 cm−1 for the pure TiO2 [38].
Pyridine is a commonly used probe to classify the adsorption sites on metal oxides [39,40,41]. In brief, the C=C and C=N adsorption modes are sensitive to the mode of attraction between pyridine and the acidic sites on the metal oxide surfaces. Figure 5C shows the FTIR spectra of the Ti-Mo NC in the presence of pyridine vapor (curve I) and after evacuation for 2 min (curve II). As shown in Figure 5C (II), the adsorbed pyridine possesses IR bands at 1610 cm−1, 1575 cm−1, 1532 cm−1, 1488 cm−1, and 1446 cm−1. The band appearing at 1610 cm−1 indicates water strongly bound to the surface. The bands at 1575 cm−1, 1488 cm−1, and 1446 cm−1 are assigned for pyridine coordination to the Lewis acidic sites [39,40]. Finally, the weak absorption mode appearing at 1532 cm−1 is aligned to the pyridinium ion formation vis surface hydroxyl modes (BrØnsted acidic sites) [39,40,41]. Given the relative band intensities presented in Figure 5C-II, it clearly shows both the water adsorbed moieties and the Lewis acid sites dominating the surface sensitivities through the observed adsorption behaviors, as presented in the following sections.
Nitrogen adsorption and desorption isotherms were measured for the pure oxides and the nanocomposite, as shown in Figure 6. The adsorption isotherms for all measured samples follow type V. The nitrogen uptake for pure TiO2 is higher than that of pure MoO3 at various relative pressures. When compared with the pure metal oxides, the nitrogen uptake of Ti-Mo NC was higher over the whole adsorption range with a steep uptake at relative pressures greater than 0.8.
Deviations between adsorption and desorption curves were observed for all samples with noticeable hysteresis for Ti-Mo NC and to a lower extent for the pure TiO2. The hysteresis loop for pure TiO2 and Ti-Mo NC follows type H3 hysteresis according to the IUPAC nomenclature [42]. Hysteresis is usually associated with capillary condensation in larger pores demonstrating that a new porous structure has been formed in the Ti-Mo NC. The increase in the number of mesopores for the nanocomposite is expected relative to the pure metal oxides.
The pore size distribution (PSD) curves (Figure 7) support the formation of the mesoporous structure (pores greater than 20 Å) for the nanocomposite. It is worth reporting the relatively higher presence of micropores on the pure TiO2 relative to the other two samples. However, the preparation of Ti-Mo NC from the two pure metal samples resulted in the introduction of relatively larger amounts of mesopores (greater than 20 Å). This is illustrated by the new major peaks for Ti-Mo NC with maxima around 94 Å.
Table 1 shows the structural parameters for the MoO3, TiO2, and Ti-Mo NC samples calculated using BET and DFT methods. The BET surface area (SBET) calculated from the nitrogen adsorption isotherm for the pure MoO3 and TiO2 are 2.21 and 37.56 m2/g. The SBET for Ti-Mo NC is 129.3 m2/g with a significant increase relative to the pure metal oxides. TiO2 showed the highest volumes of both micropores (Vmic) and super micropores (V<10A), while Ti-Mo NC showed the greatest volume of mesopores and the greatest total pore volume.
Water adsorption and desorption isotherms for all samples were measured at 297 K, as shown in Figure 8. Pure metal oxides have little affinity for water at all relative pressures (p/po) with higher uptakes on TiO2 compared with MoO3. A much higher uptake is observed for Ti-Mo NC with a steep increase in the water uptake at p/po greater than 0.75. The existence of bigger pores, particularly mesopores, where condensation is known to occur is likely responsible for the observed increase in water uptake for the nanocomposite. The adsorption isotherms follow type III.
The desorption curves for all samples show significant hysteresis for Ti-Mo NC with an H3 type hysteresis loop. The absence of micropores and the type of slit/wedge-shaped particles (parallel plate-shaped pores), particularly the presence of mesopores (20–500 Å), may be linked to this form of hysteresis. It is worth mentioning that the rates of adsorption and desorption are different. A desorbing fluid takes longer to attain equilibrium than an adsorbing vapor, especially when the adsorbate is polar, as in the case of water.
Table 2 summarizes the moisture loadings on the three samples at five relative pressure conditions as well as the total pore volume calculated from the sorption of water using VDFT volumes. As seen in the water isotherm, water uptake increases with p/po. The nanocomposite showed the highest uptake at all p/po while MoO3 showed the lowest uptake. The water uptake seems to align with the calculated VDFT volumes where excellent correlations are observed at p/po of 0.6 and higher, as shown in Figure 9. The VDFT volumes calculated using water and nitrogen isotherms do not match. This is associated with the difference in the chemistry and size of water and nitrogen molecules in addition to the variation in the surface affinity of the samples.
Increasing the surface area and pore volume of the catalyst is a goal in the production of the catalyst as it leads to better catalytic performance. The literature reported the enhancement of the surface area of the TiO2-MoO3 nanomaterial due to the synergetic effect resulting from the combination of these two metal oxides. Kubiak et al. reported the synthesis of TiO2-MoO3 using a different molar ratio of the metal oxides precursors, and the highest surface area was reported to be 57 m2/g at molar ratios TiO2:MoO3 = 8:2 compared with the other molar ratios (5:5 and 2:8) where the surface areas were 29 m2/g and 11 m2/g, respectively [12]. The same value was reported by Chary et al., 1998, using TiO2 as a base and two different percentages of MoO3, the samples showed surface area values of 57 m2/g and 31 m2/g when MoO3 was added with 6% and 12% wt, respectively [43]. Modifying the synthesis approach showed an increase in the surface area when TiO2 and MoO3 are treated with the air phase forming an inverse opal structure (IO-TiO2-MoO3). A study by Lv et al., 2020, reported a significant increase in the surface area when the structure of TiO2-MoO3 is in an IO that is forming an irregular structure with small halls and a surface area = 147.2 m2/g [44].
The adsorption and photocatalytic properties of the nanocomposite were studied using carbaryl and fenoxycarb insecticides and MB dye. Both carbaryl and fenoxycarb compounds exhibit emission bands due to the intense π-π* transition that the pesticide emits at the given energy. When fenoxycarb was excited at 270 nm, it produced an emission band at 321 nm. Carbaryl, on the other hand, emits strongly at 330 nm when excited at 276 nm. Herein, we used synchronous scan luminescence spectroscopy (SSLS) to monitor the adsorbed amount under the optimized conditions. In the SSLS, both excitation and emission wavelengths were changed at a constant wavelength difference [45]. Figure 10 shows the SSLS (with ∆λ  =  50 nm) of the 60 ppm carbaryl and fenoxycarb pesticide solutions before and after mixing various volumes with 50 mg of Ti-Mo NC for 5 min. As shown in Figure 10, the emission intensity of the pesticide solutions decreased as the relative amount of Ti-Mo NC in the solution increased; hence, the number of adsorbed molecules increased.
Plots of Ce/Qe versus Ce of the two pesticides revealed a linear fit to the Langmuir adsorption model, indicating that monolayer adsorption occurs where the solute binds to a finite number of active sites with uniform adsorption energy. As depicted in the plotted Langmuir isotherms, the monolayer capacities obtained for carbaryl and fenoxycarb on the adsorbent are 158.73 mg/g and 138.89 mg/g. Further, the adsorption constants for carbaryl and fenoxycarb on the Ti-Mo NC are 0.168 L/mol and 0.735 L/mol.
Because of the acidic character of the Ti-Mo NC surface associated with the presence of active hydroxyl surface modes (see Figure 5C) along with Bronsted and Lewis acid sites and the basic nature of the investigated carbamates (pH = 7.6–7.8), the carbamates have a remarkable propensity to be adsorbed on the Ti-Mo NC surface. Interestingly, the adsorbed carbamates irradiated with 75 W LED visible light for 60 min produced the expected oxidized products as presented in Scheme 1.
To better understand the obtained adsorption profiles, we studied the adsorption of MB (10 ppm aqueous solution) as an example of a neutral organic pollutant on the Ti-Mo NC surface. Interestingly, compared with the high adsorption potential of the previously mentioned carbamates, the MB adsorption on the Ti-Mo NC was around 20% of the 10 ppm initial [MB]. This was expected because the MB solution is neutral to slightly acidic in an aqueous solution at pH 6.5–7.0. The photodegradation process was also carried out on MB in the presence of Ti-Mo NC which served as a liquid–solid heterogeneous interface. Compared with the parent metal oxides, we expected the decomposition of MB over the Ti-Mo NC to be enhanced due to accelerating the charge separation that generates electrons that may move to the TiO2 surface as illustrated in Scheme 2.
The MB was irradiated with 302 nm UV and white LED irradiation sources in the presence and absence of the Ti-Mo NC catalyst for various durations and monitored via SSLS and UV-visible spectroscopy. As shown in Figure 11 (A), the SSLS band at 680 nm possesses a clear and gradual reduction upon irradiation with a 302 nm UV light for various periods with no indication of the formation of any new luminescent product(s). A similar result is shown in Figure 11 (B) where the UV profiles illustrate a gradual reduction in the MB broad absorption band between 580–600 nm, but the degradation is associated with a clear and strong enhancement in the absorption that occurs in the UV region. This indicates the degradation of MB to less conjugated product(s) that are not emissive as confirmed by the identified products as illustrated in Scheme 1. The plot of [MB] versus irradiation time(s) revealed a zero-order rate, as shown in Figure 11 (C). The photodegradation rate constant of irradiated MB under 75 W LED white light in the absence of a catalyst was 0.0227 s−1 ppm, but the photodegradation rate constant of MB irradiated in the presence of Ti-Mo NC was 0.067 s−1 ppm, showing a threefold increase in the photodegradation. Further, the use of 302 nm UV as the irradiation source demonstrated a clear enhancement in the photodegradation rate where the measured rate constants are 0.028 s−1 ppm and 0.1529 s−1 ppm, in the absence and presence of the Ti-Mo NC catalyst, respectively. The photodegradation of MB in the presence of the catalyst was doubled when the system was irradiated for 302 nm UV light compared with the LED white irradiation source.

3. Instrumentation

3.1. Chemicals

Carbaryl and fenoxicarb pesticides were purchased from the Crescent Chemical Company (Indiana, NY, USA) and used as received (99.5% purity). Methylene blue, TiCl4, MoCl5, and methanol (HPLC) grades were obtained from Sigma-Aldrich (St. Louis, MO, USA) and used as received without further purification.

3.2. Synthesis of Ti-Mo NC

A 1.88 g weight (4.0 mmol) of MoCl5 was transferred to a stainless-steel reactor chamber under a nitrogen atmosphere. A 0.76 g weight (4.0 mmol) of TiCl4 was transferred to the MoCl5 sample. The two chloride salts were mixed for 2 h at −4 °C. Water vapor was slowly injected into the mixture and was brought to a supersaturated NaCl solution under continuous mechanical stirring for 5 h. Water was progressively evaporated, and the temperature was gradually increased to 950 °C at a rate of 5 °C/min after which it was stabilized for 4 h in a sealed chamber with enough oxygen. The reaction was allowed to cool slowly before the crystalline solid was milled and immersed in ultrapure Millipore water to remove NaCl. The removal process was conducted by several successive washing steps with the Ti-Mo NC solid being isolated using a centrifugal force at 4500 rpm. The obtained white to very light yellow-green Ti-Mo NC powder was dried at 150 °C for 2 h. The same procedure was followed to prepare the pure oxides.

3.3. Methods

The nanocomposites were characterized using scanning electron microscopy coupled with energy-dispersive X-ray spectroscopy (SEM/EDX, Tescan Vega 3 LMU, Brno-Kohoutovice, Czech Republic). Samples were mounted onto a carbon tape and placed inside the SEM column for SEM/EDX analysis. Surface morphologies were analyzed by scanning electron microscope (Tescan Vega 3 LMU, tungsten-heated cathode electron gun, accelerating voltage 0.2–30 kV, Brno-Kohoutovice, Czech Republic). Surface composition was evaluated by an energy-dispersive x-ray detector (Oxford Instruments, Japan, X-ACT EDX/S detector; EDX resolution 127 eV, 10 mm detector size).
XPS analyses were carried out using a unique controlled atmosphere photoelectron spectrometer (CAPES, Orono, ME, USA) which permits surface characterization by XPS in ambient atmospheres at pressures on the order of one torr. The system consists of a commercial XPS instrument modified by the addition of a differentially pumped movable aperture assembly. The instrument can be used as a UHV XPS instrument (p < 10−9 torr) or, after insertion of the aperture, to analyze materials at ambient pressures of up to 1 torr.
X-ray fluorescence (XRF) spectra were recorded with an X-ray analytical microscope, XGT-7200 (Horiba Scientific, Glasgow, UK). X-ray powder diffraction (XRD) data were collected in the 2θ range of 20°–90° using CuKα radiation (λ = 1.54 Å) with a step size of 0.025° using an X’Pert3 Powder X-ray diffractometer (XRD) by PANalytical. Raman spectra were recorded using a Renishaw spectrometer (Renishaw Inc, West Dundee, IL, USA) equipped with an inVia Raman microscope RE 02.514 nm laser as the excitation source. The measuring parameters were accumulation 5, exposure time 10 s, and laser power 50%. A JEOL JEM 2100 high-resolution transmission electron microscope (HR-TEM, JEOL Ltd., Tokyo, Japan) was used to investigate the morphological properties of the synthesized samples. The samples were immobilized on a TEM grid (Formvar carbon film FCF-400-Cu, Electron Microscopy Science).
To evaluate the carbamates adsorption on Ti-Mo NC, adsorption isotherms were determined by mixing a constant mass of the samples with different initial concentrations of carbamate pesticides. The equilibrium adsorption capacity of the carbaryl and fenoxycarb pesticides on Ti-Mo NC was determined using Equations (1)–(3):
Q e = ( C o C e )   V / W
where Qe is the amount of pesticide adsorbed per gram of an adsorbent at equilibrium, and Co (mg/L) and Ce (mg/L) are the initial and equilibrium concentrations, respectively. V (L) and W (g) are the volume of the solution and the weight of the adsorbent, respectively. The carbamate pesticide’s removal efficiency, η %, is determined as follows:
η   % = ( C o C e ) / C o × 100
The adsorption isotherms generated were fitted to the Langmuir adsorption isotherm model using Equation (3) [46]:
C e / Q e = 1 / ( Q m   K ) + C e / Q m
where Qe is the equilibrium concentration of pesticide on the adsorbent, Qm is the monolayer capacity of the adsorbent, K is the adsorption constant, and Ce is the equilibrium concentration of pesticide in the solution.
To identify the photocatalytic degradation products, GC–MS analysis was performed using a GC–MS (QP 2010 ultra, Shimadzu, Kyoto, Japan). GC separation was conducted using a general-purpose nonpolar crossband dimethylpolysiloxane RTX-1 column (30 m long with 0.25 mm internal diameter) from RESTEK Company (Centre County, PA, USA). Initially, the temperature was held at 80 °C for 2 min, then it was ramped to 300 °C at a heating rate of 5 °C/min and held at 300 °C for 10 min. The temperature of the injector was set at 280 °C. Helium was used as the carrier gas with a flow rate of 0.9 mL/min. The corresponding mass spectrum for each identified GC peak was analyzed based on GC–MS solution Wiley-9 and NIST-14 libraries with a 90% match or higher.

3.4. Photochemical Reaction Cell

Methylene blue, carbaryl, and fenoxicarb were used as received in 99.5% purity. A 60 ppm solution of each pesticide was prepared in 10 v% methanol: 90 v% water mixed solvent. Given the strong absorption of MB, a 10 ppm MB solution was prepared using deionized water. All solutions were irradiated with 302 nm UV and 75 W LED white light sources in quartz tubes with 1 mm thickness. Each tube was 100 mm long with an inside diameter of 12.5 mm. The distance from the light source to the middle of the sample was 3.8 cm.

4. Conclusions

The nanocomposites of TiO2 and MoO3 have attracted great scientific interest due to their enhanced photochromic and photocatalytic activity. We synthesized a TiO2-MoO3 NC using a hydrothermal procedure. Scanning electron microscopy analysis coupled with EDX spectroscopy revealed the successful formation of the Ti-Mo NC with uniform chemical compositions and spherical morphology with sizes ranging between 150 nm and 500 nm. X-ray diffraction analysis indicated a uniform Ti-O-Mo NC structure as confirmed by results obtained from XPS analysis of binding energies that exposed oxygen binding to the Ti or Mo ion’s environment. Consistent with X-ray photoelectron studies, such a linkage between the Ti-O-Mo was observed in the Raman and DRIFT shift measurements of the fabricated nanocomposites.
The calculated SBET for the Ti-Mo mixed oxide from the nitrogen adsorption isotherm was 129.3 m2/g, which is much higher than the pure metal oxides which were prepared using a similar procedure (calculated values for TiO2 and MoO3 are 37.56 m2/g and 2.21 m2/g). While the pure metal oxides have little affinity for water at all relative pressures (p/po) with higher uptakes on TiO2 compared with MoO3, a much higher uptake is observed for Ti-Mo NC with a steep increase in the water uptake at p/po greater than 0.75 relative pressures.
We found that the emission intensity of the pesticide solutions decreased as the relative amount of Ti-Mo NC in the solution increased; hence, the number of adsorbed species increased. Plots of Ce/Qe versus Ce of the pesticide revealed a linear fit to the Langmuir adsorption model for both pesticides, indicating that monolayer adsorption occurred. Our results indicate a significant enhancement for the photocatalytic activity of the studied organic pollutants in Ti-Mo NCs upon irradiation for 302 nm under UV and LED white light sources.

Author Contributions

All authors contributed to the study conception and design. Material preparation, data collection, and analysis were performed by all authors. The first draft of the manuscript was written by F.A. and S.K. and all authors commented on previous versions of the manuscript. All authors have read and agreed to the published version of the manuscript.

Funding

This work was funded by the Research Office at the American University of Sharjah (FRG22-C-S77) and partially supported by the University of Sharjah competitive grants 160-2142-029-P and 150-2142-017-P. It was also supported by the National Research Foundation of Korea (NRF) grant funded by the Korean government (MSIT) (No. 2021R1A2C1093183) and (No.2021R1A4A1032746).

Data Availability Statement

All the data is enclosed in the manuscript.

Acknowledgments

This work was funded by the Research Office at the American University of Sharjah and partially supported by the University of Sharjah competitive grants 160-2142-029-P and 150-2142-017-P. C.H. acknowledges the support of the National Research Foundation of Korea (NRF) grant funded by the Korean government (MSIT) (No. 2021R1A2C1093183) and (No. 2021R1A4A1032746).

Conflicts of Interest

The authors have no relevant financial or non-financial interests to disclose.

References

  1. Dong, H.; Zeng, G.; Tang, L.; Fan, C.; Zhang, C.; He, X.; He, Y. An Overview on Limitations of TiO2-based Particles for Photocatalytic Degradation of Organic Pollutants and the Corresponding Countermeasures. Water Res. 2015, 79, 128–146. [Google Scholar] [CrossRef]
  2. Navgire, M.; Yelwande, A.; Tayde, D.; Arbad, B.; Lande, M. Photodegradation of Molasses by a MoO3-TiO2 Nanocrystalline Composite Material. Chin. J. Catal. 2012, 33, 261–266. [Google Scholar] [CrossRef]
  3. Khan, A.; Yuan, S.; Niu, S.; Zheng, L.; Li, W.; Zeng, H. Synthesis of Molybdenum Oxide-Titanium Dioxide Nanocompositeswith Ultrashort Laser Ablation in Water. Opt. Express 2017, 25, A539. [Google Scholar] [CrossRef]
  4. Konstantinova, E.; Minnekhanov, A.; Kokorin, A.; Sviridova, T.; Sviridov, D. Determination of the Energy Levels of Paramagnetic Centers in the Band Gap of Nanostructured Oxide Semiconductors Using EPR Spectroscopy. J. Phys. Chem. C 2018, 122, 10248–10254. [Google Scholar] [CrossRef]
  5. Li, N.; Li, Y.; Li, W.; Ji, S.; Jin, P. One-Step Hydrothermal Synthesis of TiO2@MoO3 Core-Shell Nanomaterial: Microstructure, Growth Mechanism, and Improved Photochromic Property. J. Phys. Chem. C 2016, 120, 3341–3349. [Google Scholar] [CrossRef]
  6. Natori, H.; Kobayashi, K.; Takahashi, M. Fabrication and Photocatalytic Activity of TiO2/MoO3 Particulate Films. J. Oleo. Sci. 2009, 58, 203–211. [Google Scholar] [CrossRef] [PubMed]
  7. Silvestri, S.; Kubaski, E.; Sequinel, T.; Pianaro, S.; Varela, J.; Tebcherani, S. Optical Properties of the MoO3-TiO2 Particulate System and its use as a Ceramic Pigment. Part Sci. Technol. 2013, 31, 466–473. [Google Scholar] [CrossRef]
  8. Yang, M.; Zhang, L.; Jin, B.; Huang, L.; Gan, Y. Enhanced Photoelectrochemical Properties and Water Splitting Activity of Self ordered MoO3-TiO2 Nanotubes. Appl. Surf. Sci. 2016, 364, 410–415. [Google Scholar] [CrossRef]
  9. Chithambararaj, A.; Bose, A. Hydrothermal Synthesis of Hexagonal and Orthorhombic MoO3 Nanoparticles. J. Alloys Compd. 2011, 509, 8105–8110. [Google Scholar] [CrossRef]
  10. Manivel, A.; Lee, G.; Chen, C.; Chen, J.; Ma, S.; Horng, T.; Wu, J. Synthesis of MoO3 Nanoparticles for Azo Dye Degradation by Catalytic Ozonation. Mater. Res. Bull. 2015, 62, 184–191. [Google Scholar] [CrossRef]
  11. Salari, H. Efficient Photocatalytic Degradation of Environmental Pollutant with Enhanced Photocarrier Separation in Novel Z-scheme a-MnO2 Nanorod/a-MoO3 Nanocomposites. J. Photochem. Photobiol. A Chem. 2020, 401, 112787. [Google Scholar] [CrossRef]
  12. Kubiak, A.; Wojciechowska, W.; Kurc, B.; Pigłowska, M.; Synoradzki, K.; Gabała, E.; Moszyński, D.; Szybowicz, M.; Siwińska-Ciesielczyk, K.; Jesionowski, T. Highly Crystalline TiO2-MoO3 Composite Material Synthesized via a Template-Assisted Microwave Method for Electrochemical Application. Crystals 2020, 10, 493. [Google Scholar] [CrossRef]
  13. Liu, K.; Huang, X.; Pidko, E.; Hensen, E. MoO3-TiO2 Synergy in Oxidative Dehydrogenation of Lactic Acid to Pyruvic Acid. Green Chem. 2017, 19, 3014–3022. [Google Scholar] [CrossRef]
  14. Wang, C.; Wu, L.; Wang, H.; Zuo, W.; Li, Y.; Liu, J. Fabrication and Shell Optimization of Synergistic TiO2-MoO3 Core-Shell Nanowire Array Anode for High Energy and Power Density Lithium-Ion Batteries. Adv. Funct. Mater. 2015, 25, 3524–3533. [Google Scholar] [CrossRef]
  15. Wang, Q.; Zhou, C.; Yan, X.; Wang, J.; Wang, D.; Yuan, X.; Cheng, X. TiO2 Nanoparticles Modified MoO3 Nanobelts as Electrode Materials with Superior Performances for Supercapacitors. Energy Technol. 2018, 6, 2367–2373. [Google Scholar] [CrossRef]
  16. Boboriko, N.; Bobrikov, I.; Lapchuk, N.; Sviridov, D. The Role of Structural Features in Heterogeneous Catalytic Oxidation of H2 on TiO2: MoO3 Nanocomposites. J. Solid State Chem. 2019, 275, 181–186. [Google Scholar] [CrossRef]
  17. Kokorin, A.; Sviridova, T.; Kolbanev, I.; Sadovskaya, L.; Degtyarev, E.; Vorobieva, G.; Treletskii, D. Structure and Photocatalytic Properties of TiO2/MoO3 and TiO2/V2O5 Nanocomposites Obtained by Mechanochemical Activation Russ. J. Phys. Chem. B 2018, 12, 330–335. [Google Scholar] [CrossRef]
  18. Lu, M.; Shao, C.; Wang, K.; Lu, N.; Zhang, X.; Zhang, P.; Zhang, M.; Li, X.; Liu, Y. P-MoO3 Nanostructures/n-TiO2 Nanofiber Heterojunctions: Controlled Fabrication and Enhanced Photocatalytic Properties. ACS Appl. Mater. Interfaces 2014, 6, 9004–9012. [Google Scholar] [CrossRef]
  19. Zhao, Y.; Sun, Q.; Luo, J.; Chen, H.; Cai, W.; Su, X. Hydrothermal Fabrication of TiO2-MoO3 Nanocomposites with Superior Performance for Water Treatment. Nano-Struct. Nano-Objects 2018, 13, 93–99. [Google Scholar] [CrossRef]
  20. Sari, F.; Yen, D.; Ting, J. Enhanced Photocatalytic Performance of TiO2 through a Novel Direct Dual Z-scheme Design. Appl. Surf. Sci. 2020, 533, 147506. [Google Scholar] [CrossRef]
  21. Ranade, M.; Elder, S.; Navrotsky, A. Energetics of Nanoarchitectured TiO2-ZrO2 and TiO2 MoO3 Composite Materials. Chem. Mater. 2002, 14, 1107–1114. [Google Scholar] [CrossRef]
  22. Tripathy, S.; Jo, J.; Wu, X.; Yoon, J.; Yu, Y. Synthesis and Photocatalytic Property of Metal@SnO2 Core-shell Structure Nanocomposites. J. Nanosci. Nanotechnol. 2011, 11, 453–457. [Google Scholar] [CrossRef] [PubMed]
  23. Liu, H.; Lv, T.; Zhu, C.; Zhu, Z. Direct Bandgap Narrowing of TiO2/MoO3 Heterostructure Composites for Enhanced Solar-Driven Photocatalytic Activity. Sol. Energy Mater. Sol Cells 2016, 153, 1–8. [Google Scholar] [CrossRef]
  24. Zhang, B.; Sun, S.; Shi, N.; Liao, X.; Yin, G.; Huang, Z.; Chen, X.; Pu, X. Spaced TiO2 Nanotube Arrays for Electrodeposition of MoO3 to Achieve High Electrochemical Performance. J. Alloys Compd. 2020, 820, 153066. [Google Scholar] [CrossRef]
  25. Yao, Y.; Sun, M.; Zhang, Z.; Lin, X.; Gao, B.; Anandan, S.; Liu, W. In Situ Synthesis of MoO3 /Ag/TiO2 Nanotube Arrays for Enhancement of Visible-light Photoelectrochemical Performance. Int. J. Hydrog. Energy 2019, 44, 9348–9358. [Google Scholar] [CrossRef]
  26. Amirhossein Alaghmandfard, A.; Ghandi, K. A Comprehensive Review of Graphitic Carbon Nitride (g-C3N4)–Metal Oxide-Based Nanocomposites: Potential for Photocatalysis and Sensing. Nanomaterials 2022, 12, 294. [Google Scholar] [CrossRef]
  27. Rui-Zhi Zhang, R.; Chen, Q.; Lei, Y.; Zhou, J. Growth of MoS2 nanosheets on TiO2/g-C3N4 nanocomposites to enhance the visible-light photocatalytic ability. J. Mat. Sci. Mat. Electron. 2019, 30, 5393–5403. [Google Scholar] [CrossRef]
  28. Ahern, J.; Kanan, S.; Sara, Z.; Job, T.; Alnaizy, R.; Abu Farha, N.; Patterson, H. Photocatalysis of Fenoxycarb over Silver-Modified Zeolites. Environ. Sci. Pollut. Res. 2015, 22, 3186–3192. [Google Scholar] [CrossRef]
  29. Kanan, S.; Malkawi, A. Mixed Silver–Zinc Encapsulated Zeolite-Y Powders Toward the Photodegradation of Aqueous Fenoxycarb Solutions. Desalin. Water Treat. 2017, 100, 281. [Google Scholar] [CrossRef]
  30. Kanan, S.; Moyet, M. Fabricated Metal Zeolites as Photocatalysts for the Degradation of Organic Pollutants. Res. Chem. Intermed. 2021, 47, 433–458. [Google Scholar] [CrossRef]
  31. Kanan, S.; Moyet, M.; Arthur, R.; Patterson, H. Recent Advances on TiO2-based Photocatalysts Toward the Degradation of Pesticides and Major Organic Pollutants from Water Bodies. Catal. Rev. 2020, 62, 1–65. [Google Scholar] [CrossRef]
  32. Kang, J.; Kim, J.; Lee, J.; Son, J.; Chung, Y.; Park, S.; Jeong, J.; Yoo, J.M.; Shin, H.; Choe, H.; et al. Electrochemically Synthesized Nanoporous Molybdenum Carbide as a Durable Electrocatalyst for Hydrogen Evolution Reaction. Adv. Sci. 2018, 5, 1700601. [Google Scholar] [CrossRef] [PubMed]
  33. Baltrusaitis, J.; Mendoza-Sanchez, B.; Fernandez, V.; Veenstra, R.; Dukstiene, N.; Roberts, A.; Fairley, N. Generalized Molybdenum Oxide Surface Chemical State XPS Determination via Informed Amorphous Sample Model. Appl. Surf. Sci. 2015, 326, 151–161. [Google Scholar] [CrossRef]
  34. Gao, Y.; Wu, X.; Ran, R.; Si, Z.; Ma, Z.; Wang, B.; Weng, D. Effects of MoOx on Dispersion of Vanadia and Low-Temperature NH3-SCR activity of Titania Supported Catalysts: Liquid Acidity and Steric Hindrance. Appl. Surf. Sci. 2022, 585, 152710. [Google Scholar] [CrossRef]
  35. Sivakumar, R.; Gopinath, C.; Jayachandran, M.; Sanjeeviraja, C. An Electrochromic Device (ECD) Cell Characterization on Electron Beam Evaporated MoO3 Films by Intercalating/Deintercalating the H+ ions. Curr. Appl. Phys. 2007, 7, 76–86. [Google Scholar] [CrossRef]
  36. Ren, R.; Wen, Z.; Cui, S.; Hou, Y.; Guo, X.; Chen, J. Controllable Synthesis and Tunable PhotocatalyticProperties of Ti3+-doped TiO2. Sci. Rep. 2015, 5, 10714. [Google Scholar] [CrossRef]
  37. Du, Y.; Deng, Y.; Zhang, M. Variable-Temperature Raman Scattering Study on Anatase Titanium Dioxide Nanocrystals. J. Phys. Chem. Solids 2006, 67, 2405–2408. [Google Scholar] [CrossRef]
  38. Ping, L.; Nan, H. Layer-by-layer Construction of the Heparin/Fibronectin Coatings on Titanium Surface: Stability and Functionality. Phys. Procedia 2011, 18, 112–121. [Google Scholar] [CrossRef]
  39. Griffiths, D. Infrared study of the adsorption of water on to the surface of rutile. J. Chem. Soc. Faraday Trans. 1 1977, 73, 1510. [Google Scholar] [CrossRef]
  40. Kanan, S.; Lu, Z.; Tripp, C. A comparative study of the adsorption of chloro- and non-chloro-containing organophosphorus compounds on WO3. J. Phys. Chem. B 2002, 106, 9576–9580. [Google Scholar] [CrossRef]
  41. Akuo Kataoka, A.; Dumesic, J. Acidity of unsupported and silica-supported vanadia, molybdena, and titania as studied by pyridine adsorption. J. Catal. 1988, 112, 66–79. [Google Scholar] [CrossRef]
  42. Thommes, M.; Kaneko, K.; Neimark, A.; Olivier, J.; Reinoso, F.; Rouquerol, J.; Sing, K. Physisorption of Gases, with Special Reference to the Evaluation of Surface Area and Pore Size Distribution (IUPAC Technical Report). Pure. Appl. Chem. 2015, 87, 1051–1069. [Google Scholar] [CrossRef]
  43. Chary, K.; Bhaskar, T.; Kishan, G.; Vijayakumar, V. Characterization of MoO3/TiO2 (Anatase) Catalysts by ESR, 1H MAS NMR, and Oxygen Chemisorption. J. Phys. Chem. B 1998, 102, 3936–3940. [Google Scholar] [CrossRef]
  44. Lv, C.; Wang, L.; Liu, X.; Zhao, L.; Lan, X.; Shi, J. An Efficient Inverse Opal (IO)-TiO2-MoO3-x for Photocatalytic H2 Evolution and RhB Degradation—The Synergy Effect of IO Structure and Plasmonic MoO3-x. Appl. Surf. Sci. 2020, 527, 146726. [Google Scholar] [CrossRef]
  45. Kanan, S.; Omary, M.; Patterson, H.; Matsuoka, M.; Anpo, M. Characterization of the Excited States Responsible for the Action of Silver(I)-Doped ZSM-5 Zeolites as Photocatalysts for Nitric Oxide Decomposition. J. Phys. Chem. B 2000, 104, 3507–3517. [Google Scholar] [CrossRef]
  46. Ayawei, N.; Ebelegi, A.; Wankasi, D. Modelling and Interpretation of Adsorption Isotherms. J. Chem. 2017, 2017, 3039817. [Google Scholar] [CrossRef] [Green Version]
Figure 1. (A) SEM image of Ti-Mo NC and (B) a representative EDX spectrum obtained from individual particles.
Catalysts 13 00362 g001
Figure 2. (AC) TEM images of MoO3, (EG) Ti-Mo NC, (D) SAED patterns of MoO3, and (H) Ti-Mo NC.
Catalysts 13 00362 g002
Figure 3. (A) X-ray diffraction pattern of Ti-Mo NC; inset: zoomed-in view of lower angle ranges for clarification of the peak broadening. The (B,C) show the reference spectra of constituent TiO2 and MoO3 powders.
Catalysts 13 00362 g003
Figure 4. Surface analyses for Ti-Mo NC (A) XPS and (B) XRF spectra.
Catalysts 13 00362 g004
Figure 5. Surface analyses for Ti-Mo NC: (A) Raman spectroscopy, (B) DRIFT spectroscopy, and (C) FTIR spectroscopy for thin film surface exposed to pyridine vapor (I) followed by evacuation for 2 min (II).
Catalysts 13 00362 g005
Figure 6. Sorption of nitrogen isotherms for the pure oxides and Ti-Mo NC.
Catalysts 13 00362 g006
Figure 7. Pore size distribution of the as-prepared metal oxide samples.
Catalysts 13 00362 g007
Figure 8. Sorption of water isotherms for the pure oxides and Ti-Mo NC.
Catalysts 13 00362 g008
Figure 9. Correlation between the volumes of water adsorbed at different relative pressures and the total pore volume.
Catalysts 13 00362 g009
Figure 10. SSLS of the studied pesticides along with the Langmuir adsorption profile obtained for (A) carbaryl and (B) fenoxycarb.
Catalysts 13 00362 g010
Figure 11. MB irradiated with 75 W LED white and 302 UV lights: (A) The SSLS of MB in the presence of Ti−Mo NC irradiated with 302 nm light for various times; (B) UV−Vis spectra of the MB/Ti−Mo NC ir-radiated with 302 nm UV for various times; and (C) photodegradation profile of MB alone irra-diated 75 W LED (a) and 302 nm (b) lights along with the MB/Ti−Mo NC irradiated with LED light (c) and 302 nm UV (d).
Catalysts 13 00362 g011aCatalysts 13 00362 g011b
Scheme 1. Photodegradation products obtained for the studied organic pollutants.
Catalysts 13 00362 sch001
Scheme 2. Schematic for the photocatalytic mechanism for MB degradation of the Ti−Mo NC.
Catalysts 13 00362 sch002
Table 1. Surface Structural Parameters.
SampleV<10A (mm3/g)Vmic
(mm3/g)
Vt
(mm3/g)
SBET
(m2/g)
SDFT
(m2/g)
MoO30.090.254.082.212.41
TiO22.193.45133.8037.5644.09
Ti-Mo Oxide1.131.13323.19129.33124.37
Table 2. Moisture loading of sorbents at various relative humidity conditions.
p/poMoisture Loading of Sorbents at STP (mg H2O/g Sorbent)
Ti-Mo OxideTiO2MoO3
0.218.46.00.4
0.431.88.30.9
0.650.311.31.5
0.8101.316.62.4
0.95226.443.64.3
Vt (mm3/g)283.466.17.5
Disclaimer/Publisher’s Note: The statements, opinions and data contained in all publications are solely those of the individual author(s) and contributor(s) and not of MDPI and/or the editor(s). MDPI and/or the editor(s) disclaim responsibility for any injury to people or property resulting from any ideas, methods, instructions or products referred to in the content.

