Article

Au-Deposited Ce0.5Zr0.5O2 Nanostructures for Photocatalytic H2 Production under Visible Light

by
Shaeel Ahmed Al Thabaiti
1,
Zaheer Khan
1,
Khloud Saeed Al-Thubaiti
1,
Salem Mohamed Bawaked
1,
Soad Zahir Al-Sheheri
1,
Mohamed Mokhtar
1,
Maqsood Ahmad Malik
2 and
Katabathini Narasimharao
1,*
1
Chemistry Department, Faculty of Science, King Abdulaziz University, P.O. Box 80203, Jeddah 21589, Saudi Arabia
2
Department of Chemistry, Faculty of Sciences, Jamia Millia Islamia, New Delhi 110025, India
*
Author to whom correspondence should be addressed.
Catalysts 2023, 13(10), 1340; https://doi.org/10.3390/catal13101340
Submission received: 18 September 2023 / Revised: 29 September 2023 / Accepted: 2 October 2023 / Published: 4 October 2023
(This article belongs to the Section Catalytic Materials)

Abstract

:
Pure Ce0.5Zr0.5O2 and Au (0.1–1.0 wt.%)-deposited Ce0.5Zr0.5O2 nanomaterials were synthesized via hydrothermal and non-aqueous precipitation methods using gold acetate as a chloride-free Au precursor. The synthesized nanostructures exhibited enhanced photocatalytic activity for hydrogen production via aqueous bioethanol photoreforming under visible light. Different characterization tools such as powder XRD, HRTEM, FT-IR, DR UV-vis, XPS and N2 gas adsorption were used to analyze the physicochemical properties of the synthesized photocatalysts. The band gap value was lowered from 3.25 eV to 2.86 eV after Au nanoparticles were deposited on the surface of Ce0.5Zr0.5O2. The 1.0 wt.% Au-deposited Ce0.5Zr0.5O2 sample exhibited the highest photocatalytic activity for H2 production (3210 μmol g−1) due to its low band gap, the presence of more oxygen vacancies and its porous character. The EIS results reveal that the deposition of 1.0 wt.% Au nanoparticles is responsible for the highest charge separation efficiency with an increased lifetime of photogenerated e/h+ species compared to the other samples. In addition, the presence of plasmonic Au is responsible for the effectiveness of the electron trap in improving the rate of H2 formation.

1. Introduction

Hydrogen gas (H2) is considered a clean secondary energy that could be used in a carbon-free-hydrogen society in the future, but the industrial production of H2 still depends mostly on fossil fuels [1]. The utilization of renewable energies such as solar energy is a way to improve the sustainability and global energy balance of H2 production [2]. Bioethanol is considered a renewable feedstock because it is produced from several plants. In addition, ethanol has an H-to-C ratio of 3, producing more H2 per unit volume in liquid phase [3]. The production of H2 via photocatalytic processes using renewable bioethanol and visible light at an ambient temperature is one of the most desirable processes. Although important research has recently been reported on this topic, the hydrogen yield obtained is not adequate and much work is needed to develop stable, efficient photocatalysts [4]. Many researchers are looking for suitable catalysts, such as metal-oxide-based semiconductors, which deposit with noble metal nanoparticles and produce H2 from bioethanol via photocatalytic processes with visible light. Several metals and metal oxides (both noble and transition elements) were deposited on different semiconductor surfaces to tune their photocatalytic properties [5]. This is because a Schottky barrier could form at the interface between the metal and semiconductor, leading to e trapping and reducing the e/h+ recombination rate [6]. Among different noble metals, Au and Pt are widely used to develop stable photocatalysts for hydrogen production [7].
Various types of Au-deposited semiconductors, such as Au/Cu2O [8,9], Au/SnO2 [10], Au/MoS2 [11], Au/NiSx [12], Au/TiO2 [13] and Au/CdS [14], have been used for photocatalytic H2 production. Jiménez-Calvo et al. [15] obtained efficient plasmonic and Z-scheme heterojunctions utilizing a combination of TiO2, g-C3N4 and Au to improve hydrogen production, as Au/TiO2/g-C3N4 can be used as multifunctional photocatalysts to enhance H2 production. Zirconium oxide (ZrO2) and cerium oxides (CeO2) are well-known p-type and n-type semiconductors with a wide band gap (3.15–3.26 eV) that changes with crystal structure and synthesis conditions [16]. However, bare ZrO2 or CeO2 alone are not appropriate photocatalysts because the quick recombination of photogenerated e/h+ and the visible light adsorption are limited [17]. Fabricating heterojunctions is a practical approach to overcoming the problems associated with bare ZrO2 and CeO2 semiconductors. Therefore, synthesizing and utilizing the CeO2-ZrO2 p-n heterojunction represent an effective option for developing active photocatalysts under visible light. It was previously reported that a Ce-Zr mixed oxide in an equal atomic ratio (Ce0.5Zr0.5O2) could be obtained and utilized as a photocatalyst due to its low band gap (2.79 eV) [18]. It is well known that introducing Zr into the CeO2 crystal lattice produces crystal defects responsible for high oxygen species mobility [19]. Hao et al. [20] utilized 3D Ag/CeO2-ZrO2 nanocomposites as an efficient photocatalyst. Recently, Narasimharao and Aramice [21] synthesized Ag nanoparticle-deposited Ce0.5Zr0.5O2 nanofibers and used them as an effective photocatalyst for degrading p-NP under visible light. In another report, Bo et al. [22] indicated that Y, La and Mn doping enhanced the visible light absorption and photocatalytic activity of TiO2/Ce0.5Zr0.5O2 photocatalysts.
This research aims to synthesize nanosized Au-Ce0.5Zr0.5O2 catalysts and use the synthesized materials as photocatalysts for effective H2 production via the photoreforming of aqueous bioethanol under visible light. In addition, the existence of Au nanoparticles on the surface of Ce0.5Zr0.5O2 can induce the surface plasmon resonance (SPR) phenomenon and enhance photocatalytic function [23]. Chloroacetate (HAuCl4) is a commonly used gold precursor for manufacturing catalysts containing gold. However, the precursor’s chlorine ions (Cl) are responsible for coagulating gold nanoparticles, poisoning active sites and the corrosion of support material [24]. Many researchers have used methods such as co-precipitation or deposition–precipitation to deposit a well-dispersed Au nanoparticle on a supporting material [25]. However, incomplete washing may result in residual chlorine ions. Non-aqueous synthesis methods have been widely used in preparing different catalysts because they are a simple and flexible way to introduce dopants, adjust the composition scale and maintain high purity [26]. In this contribution, a non-aqueous precipitation technique was adapted to synthesize Au/Ce0.5Zr0.5O2 nanocomposites by using gold acetate (Au(CH3COO)3) as a chloride ion-free precursor and tetra propyl ammonium hydroxide as a non-aqueous precipitating agent.

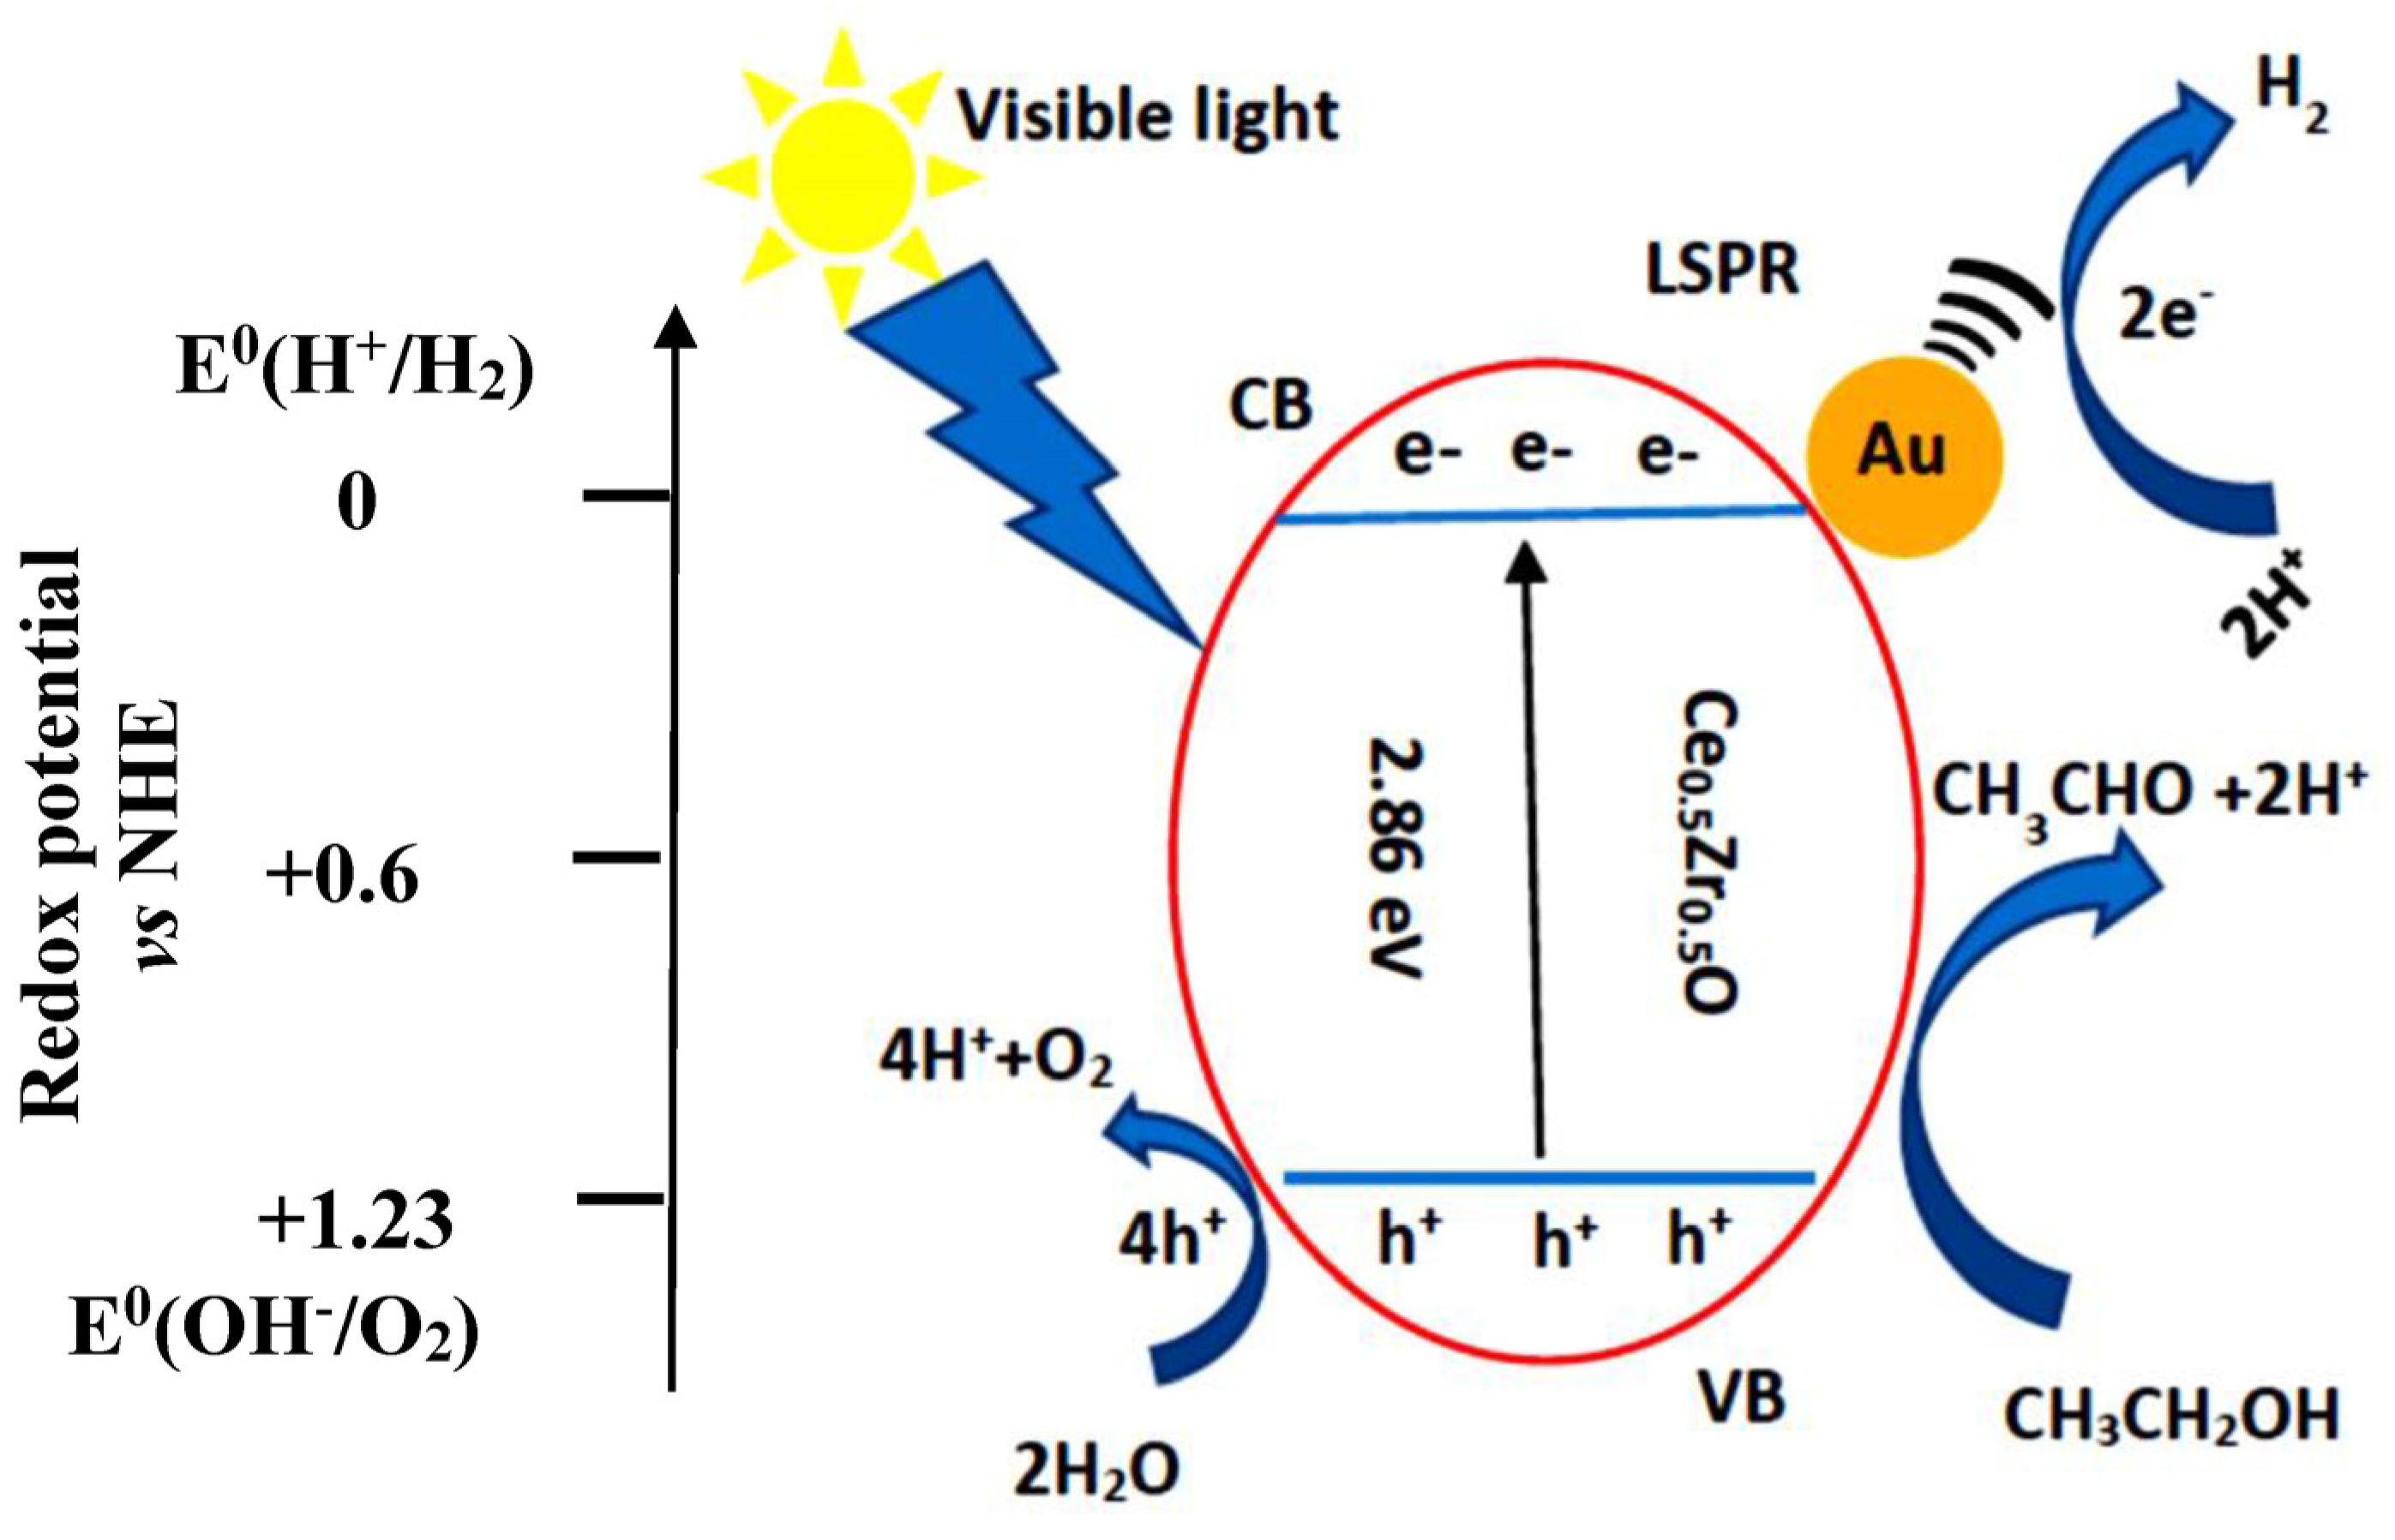
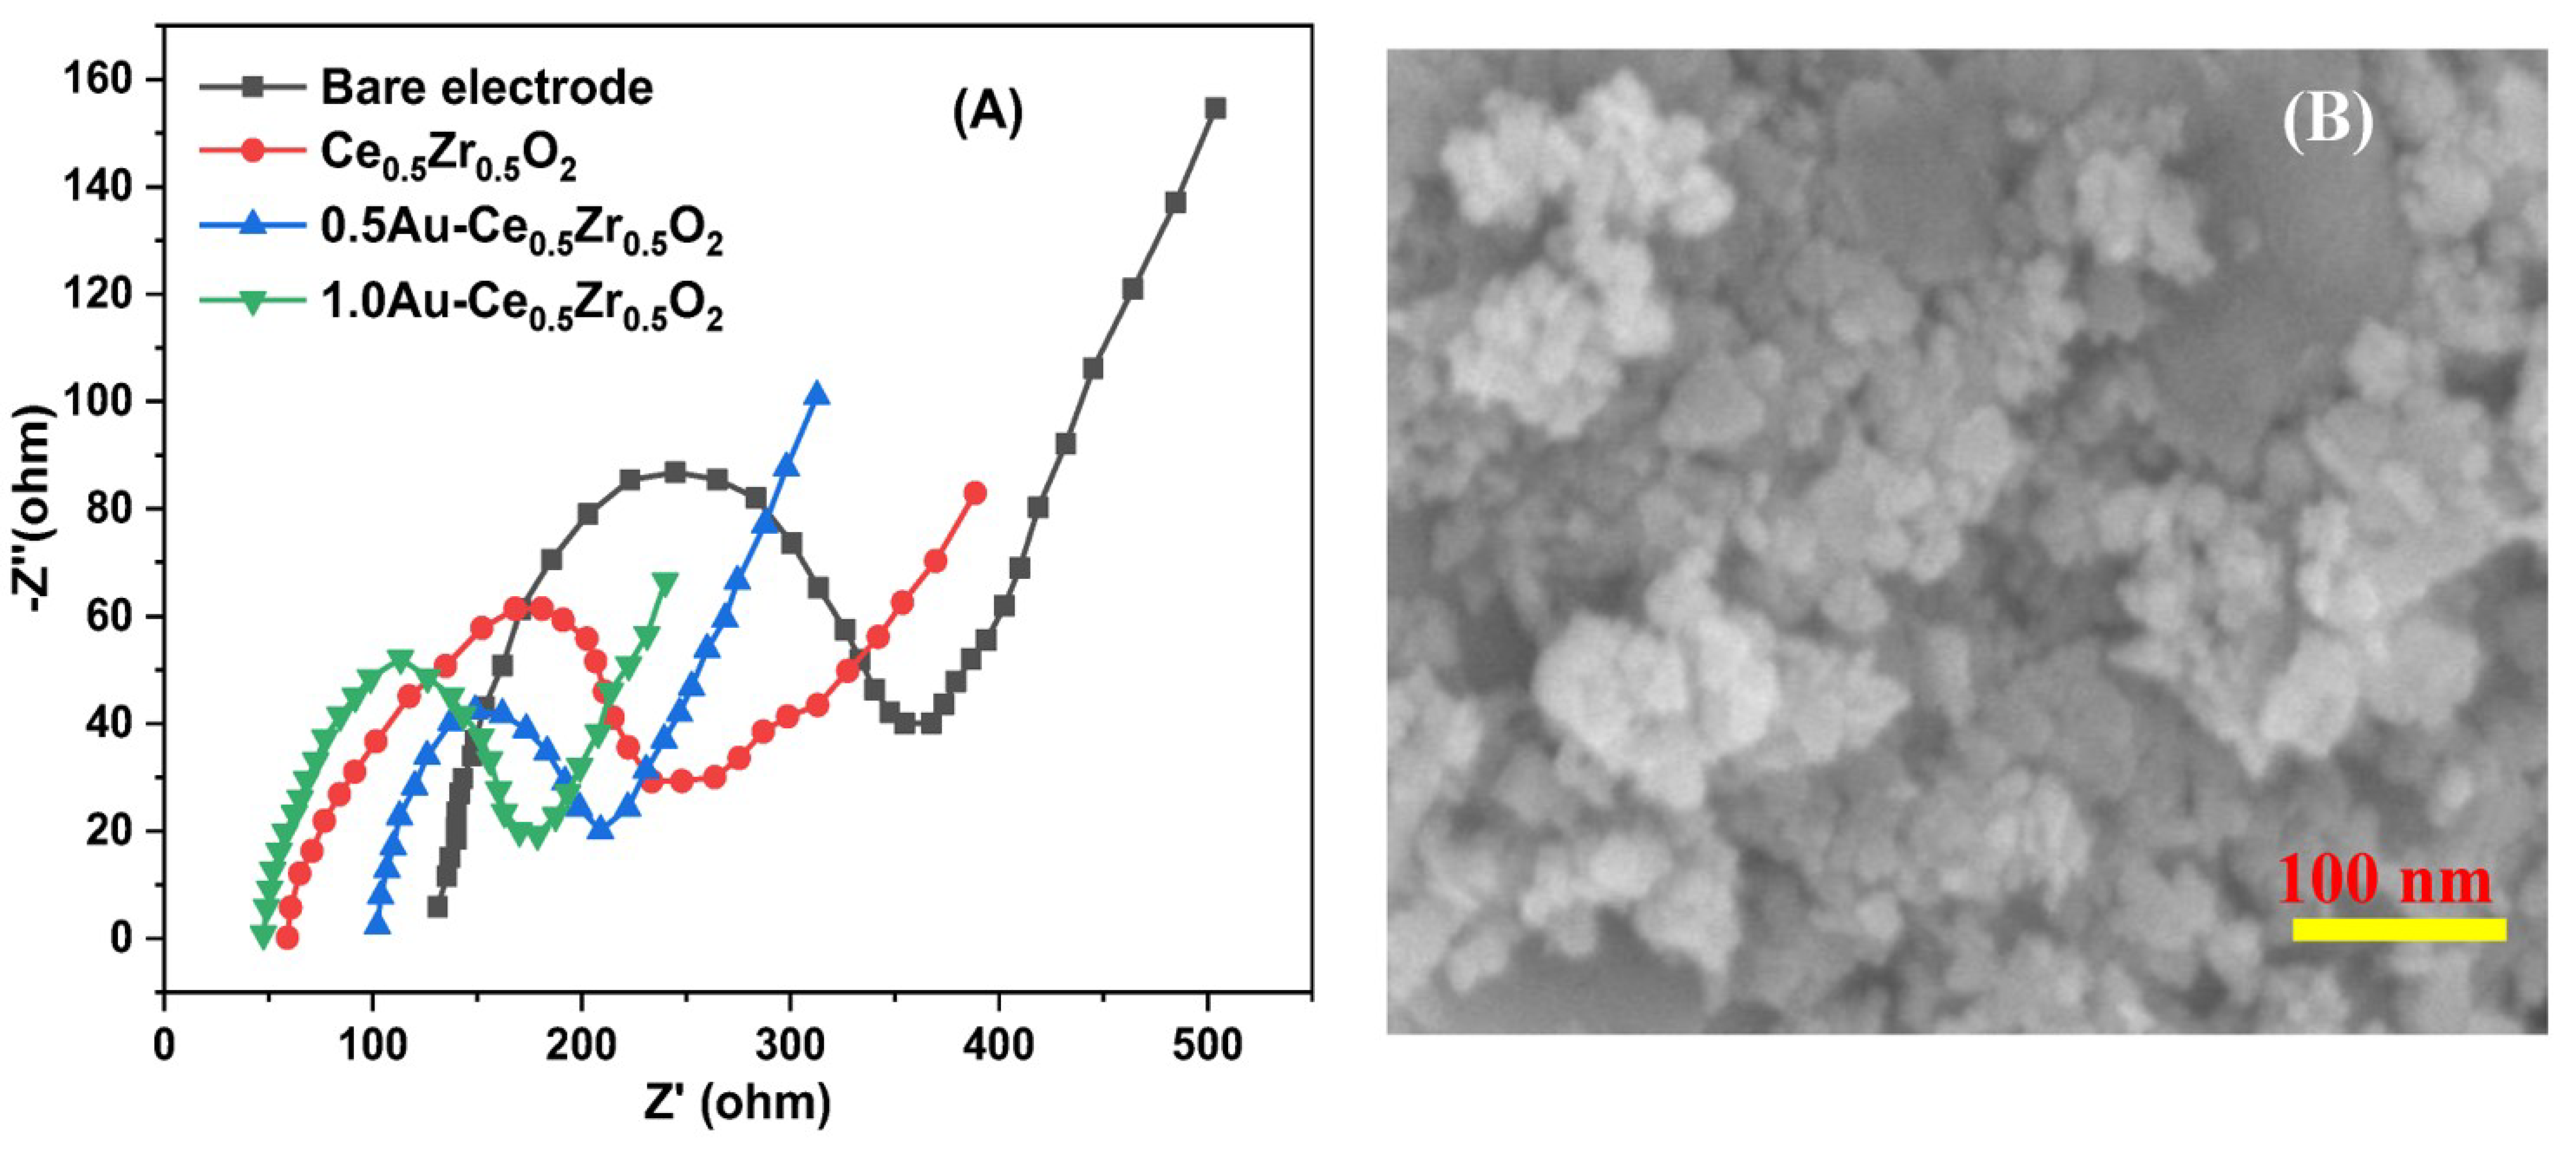
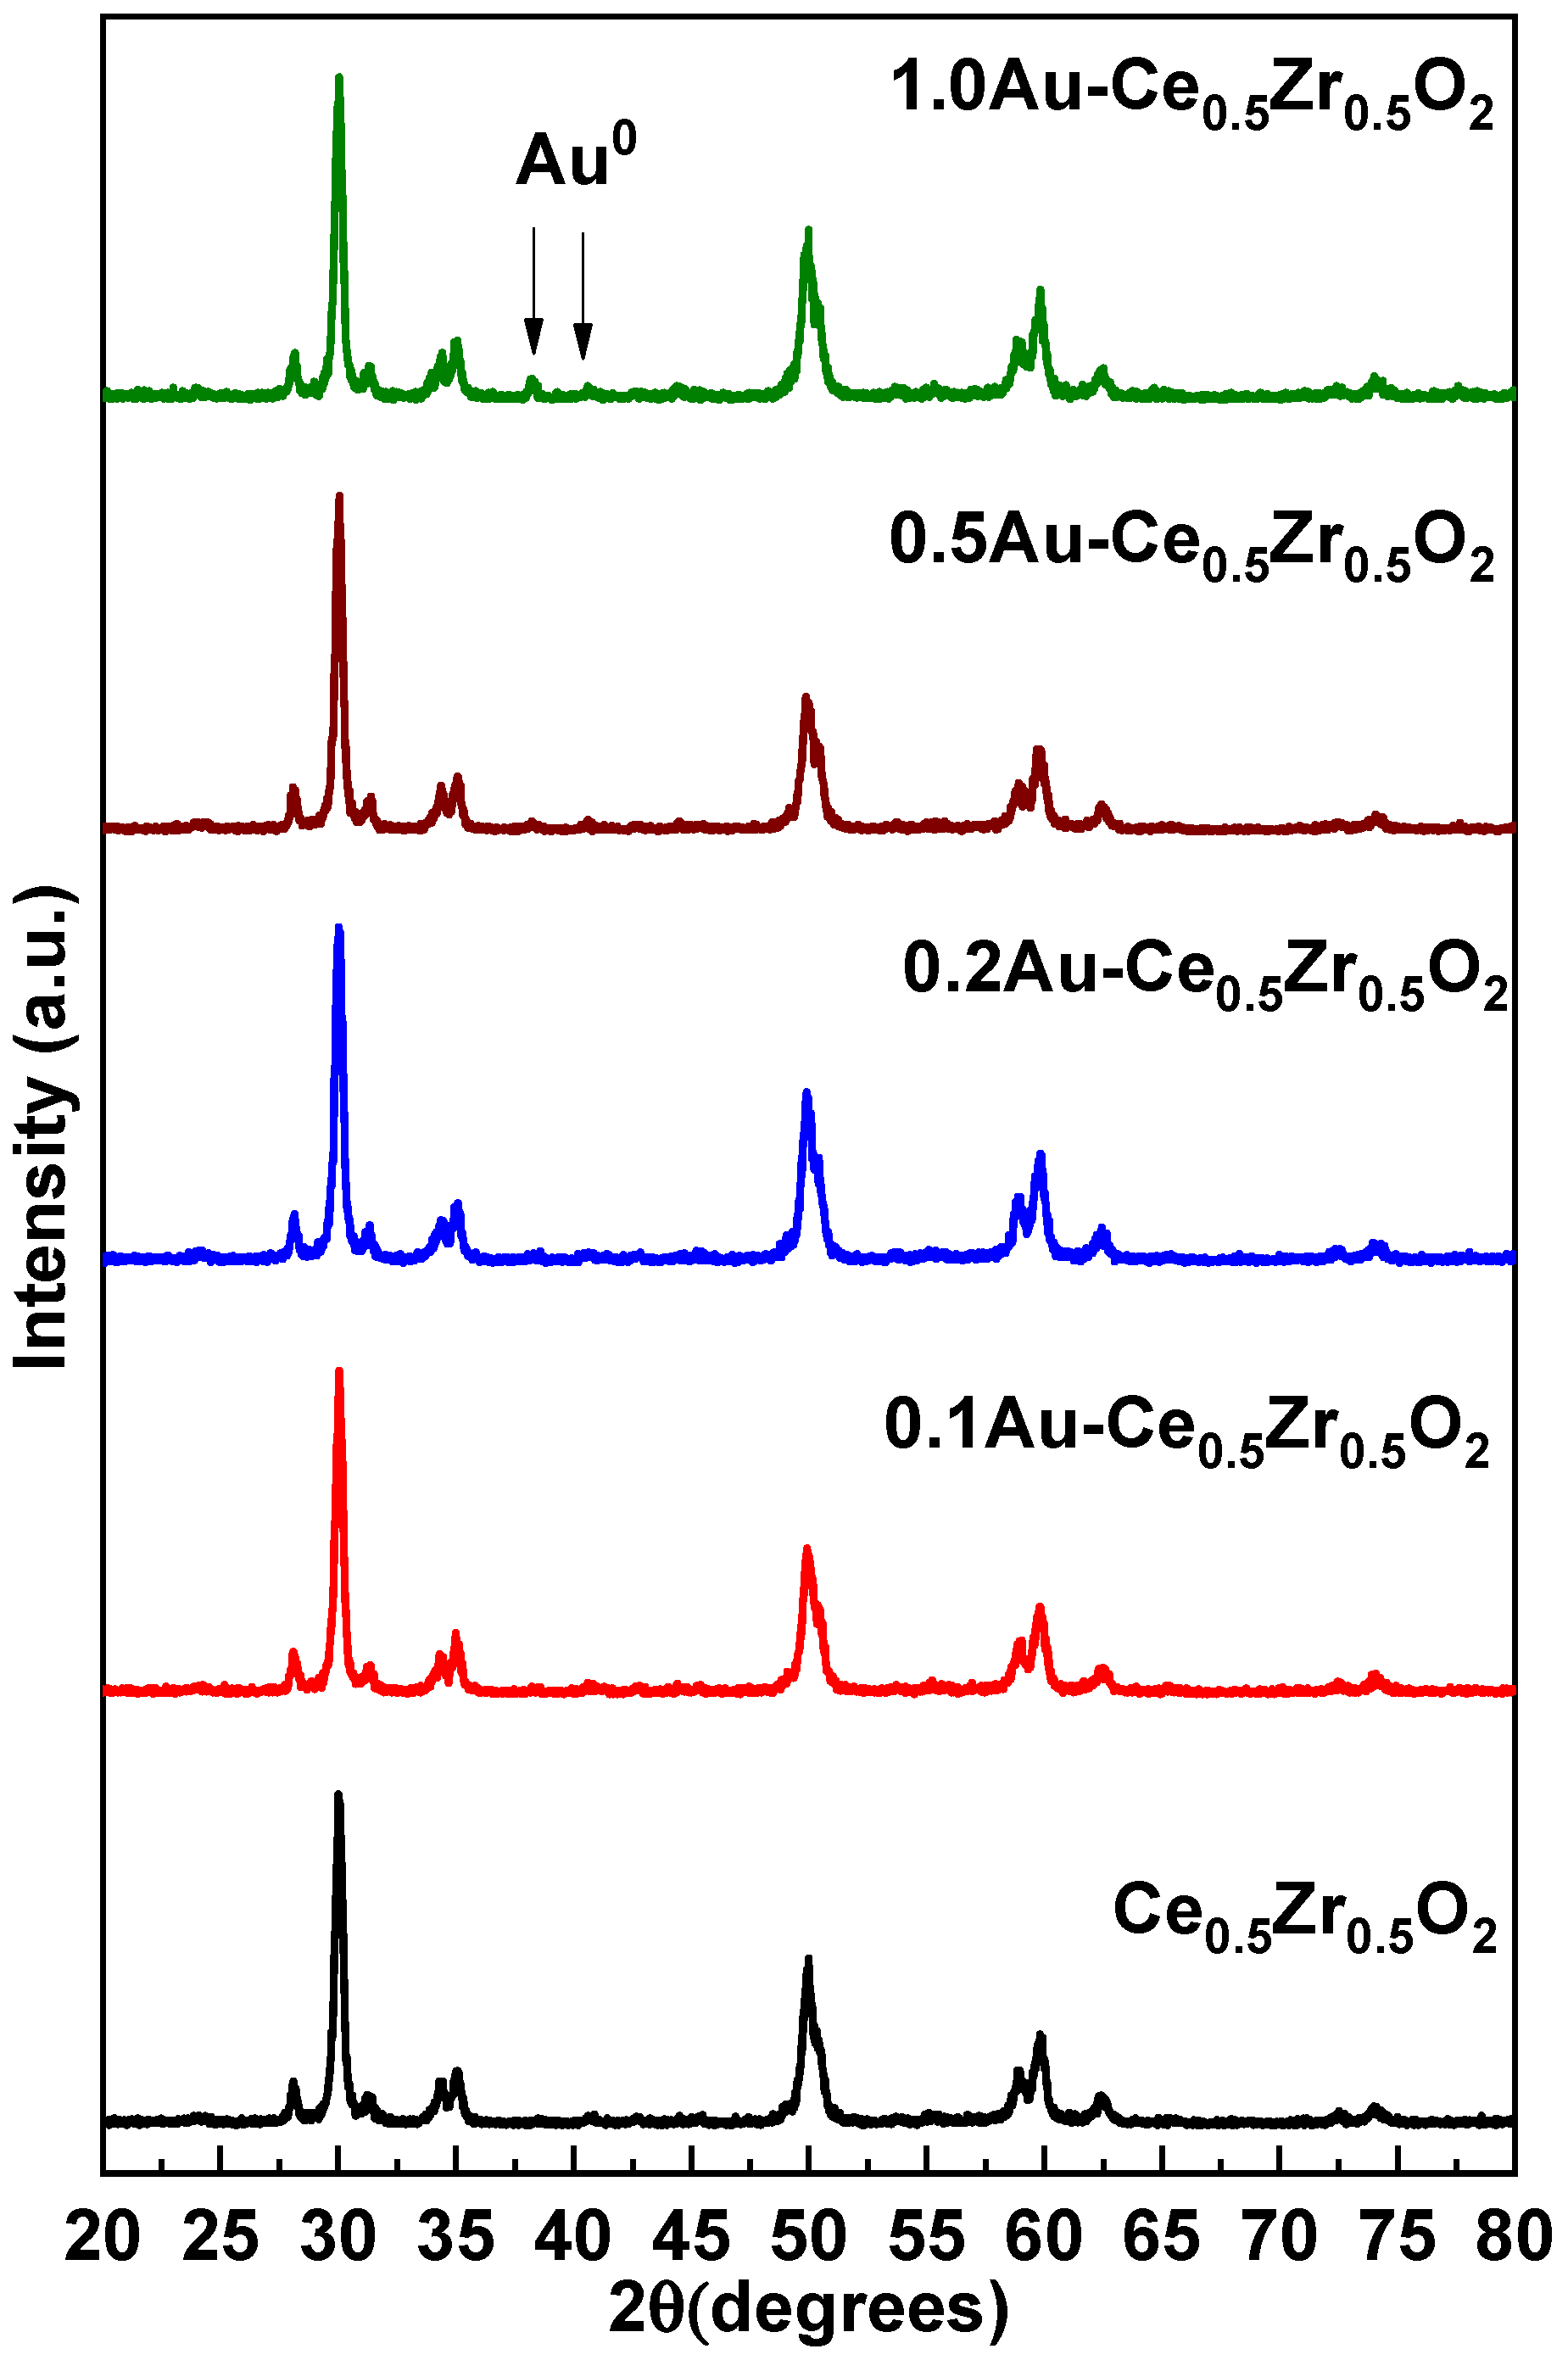
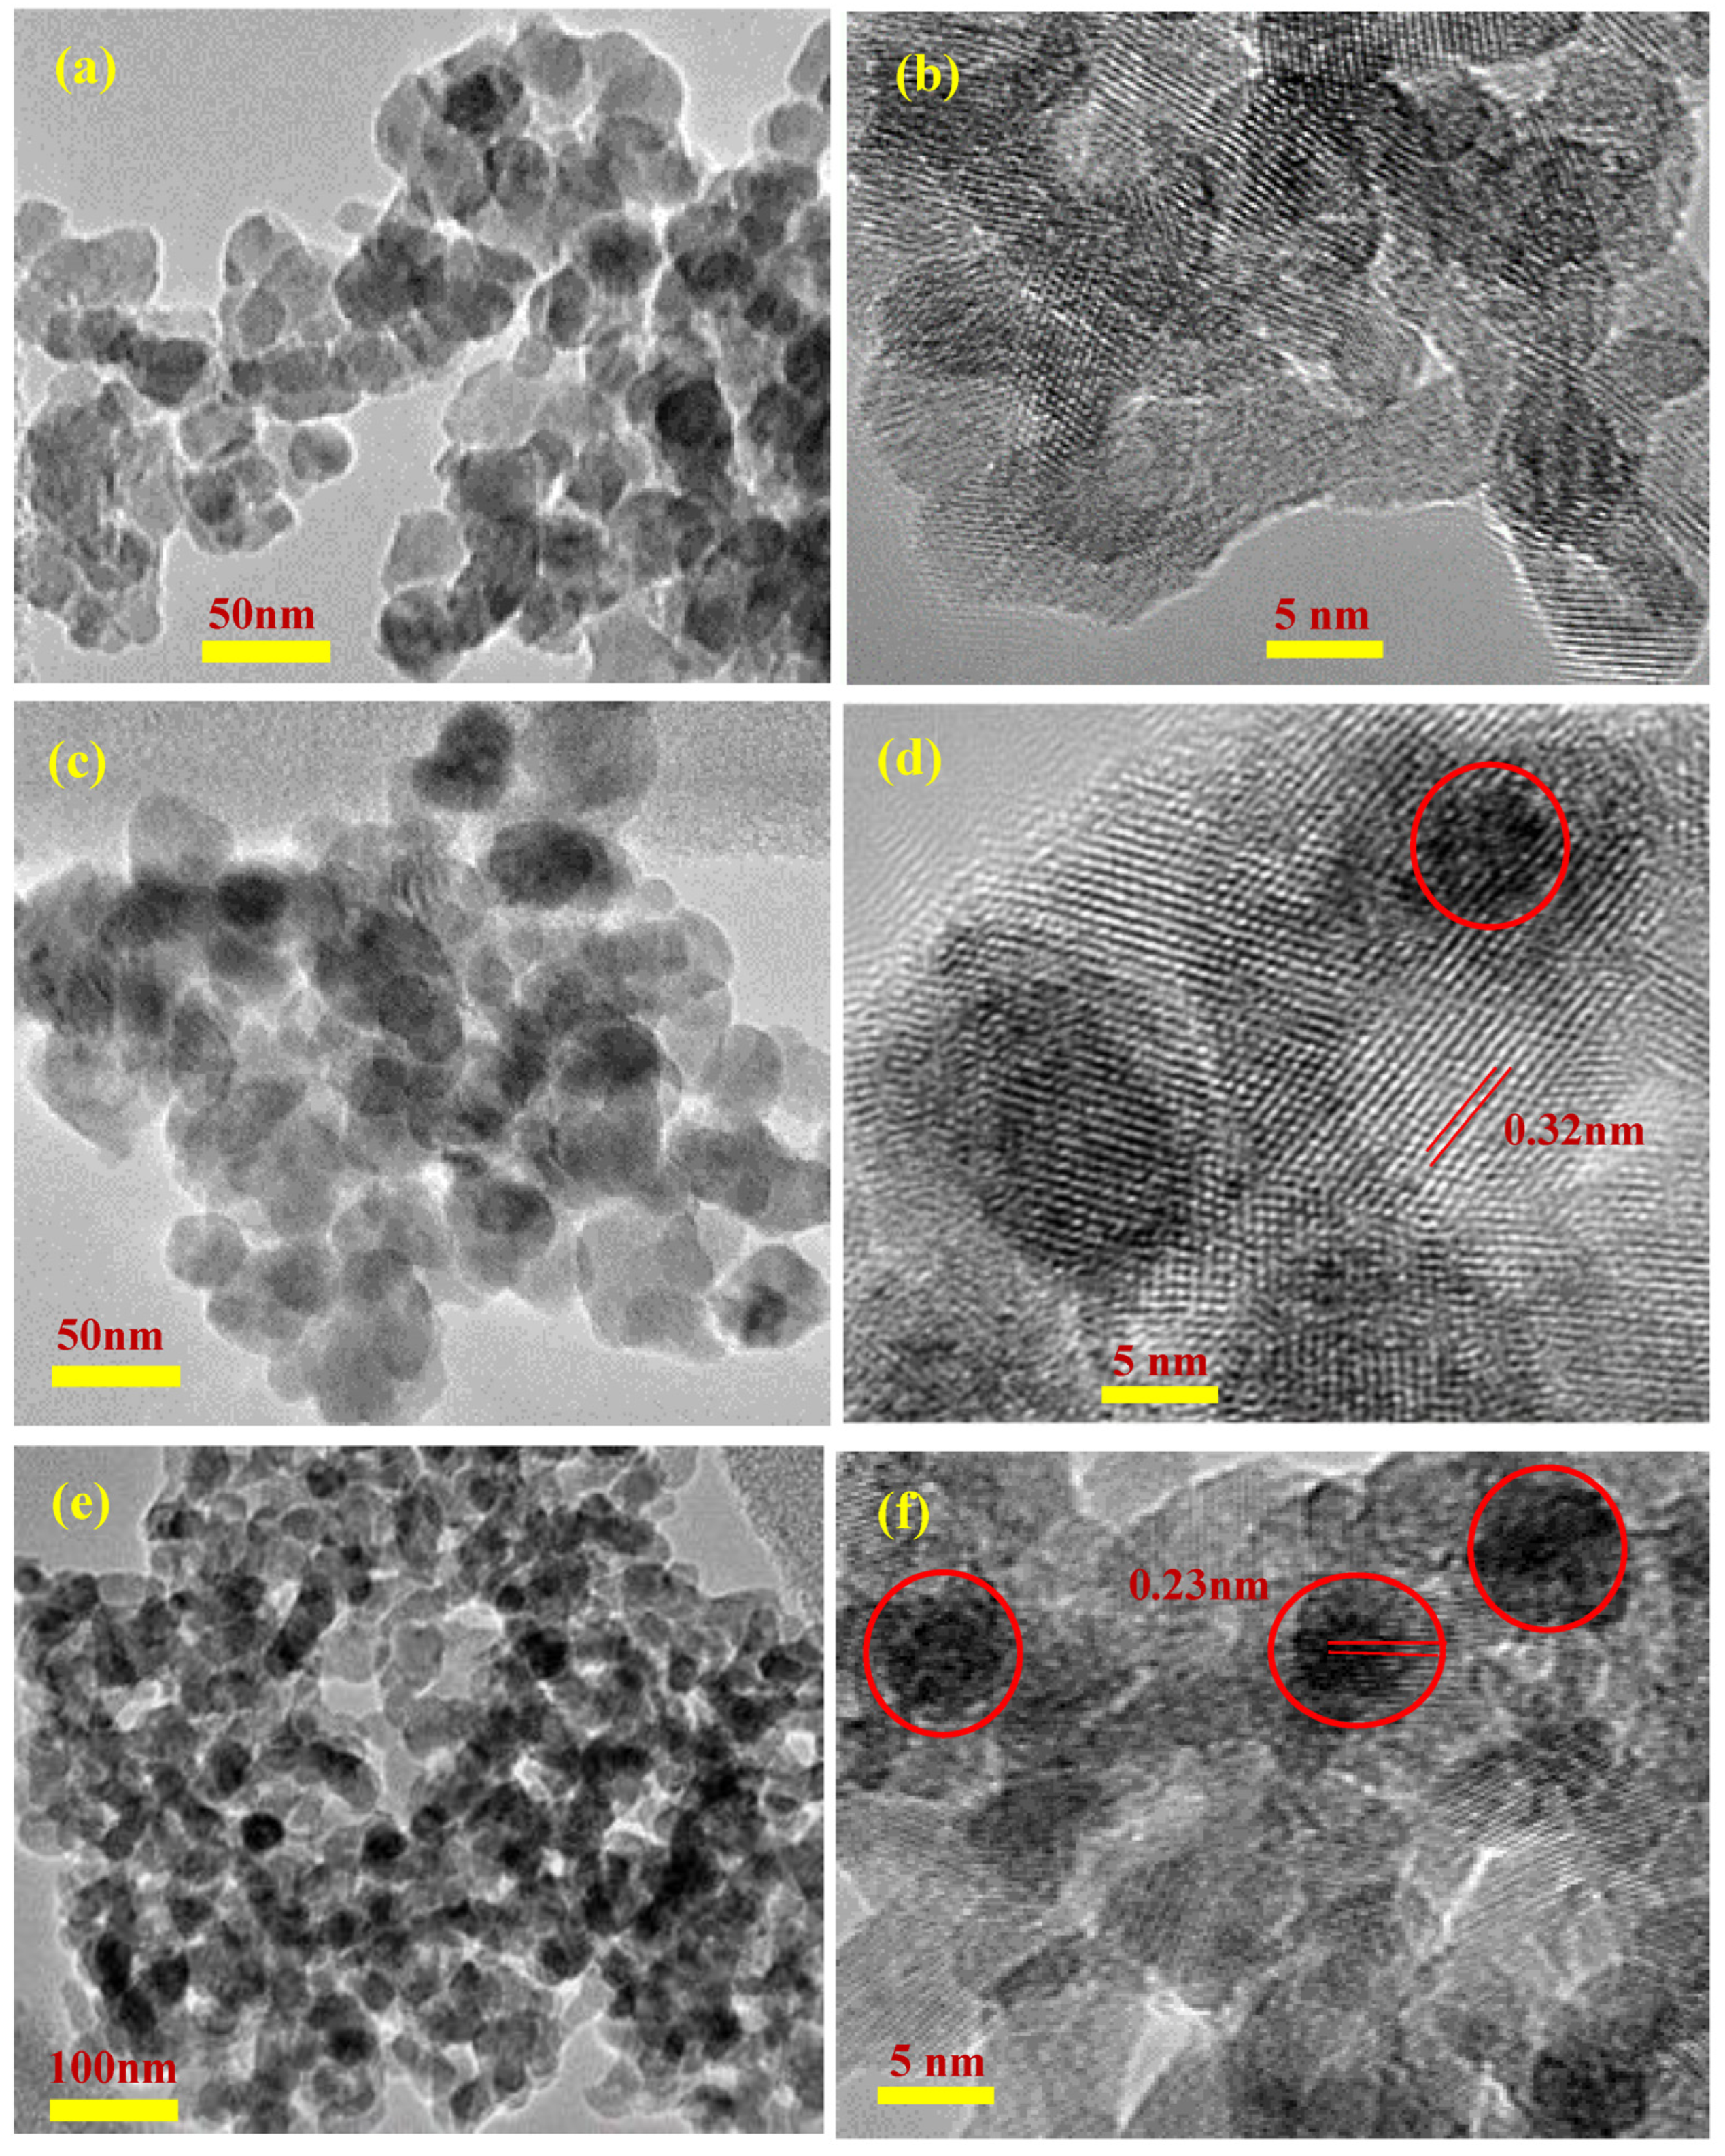
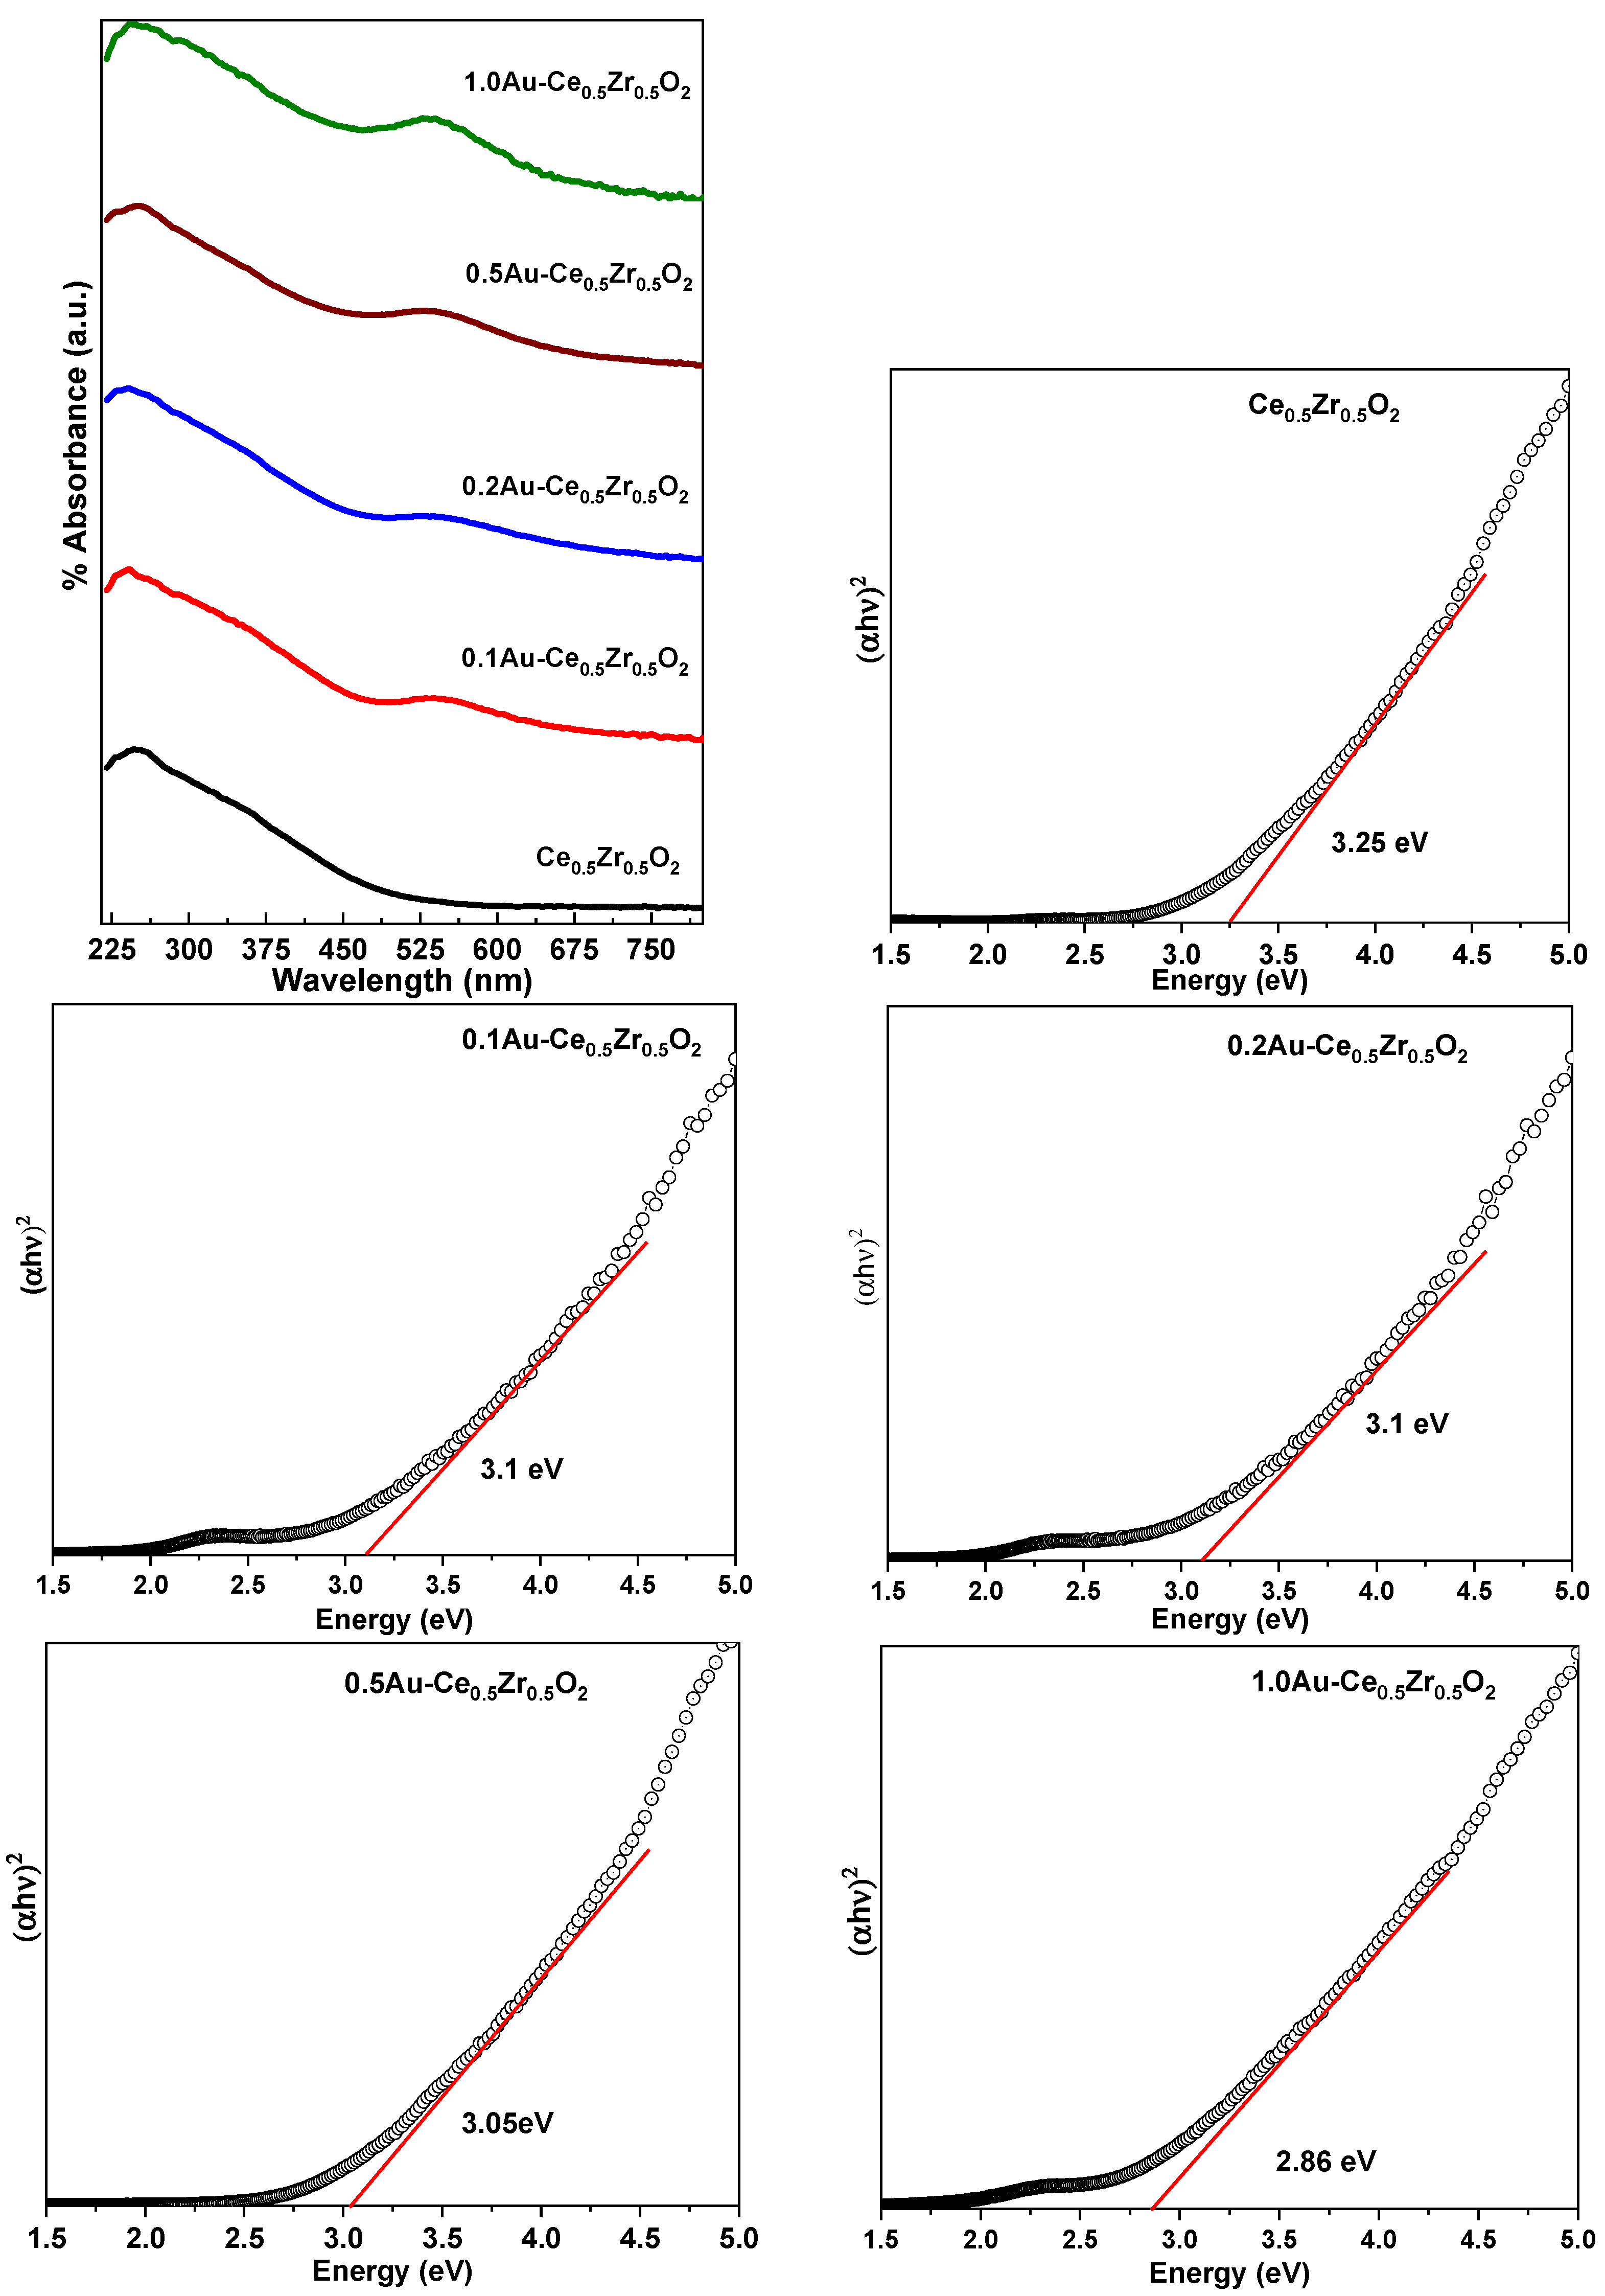
2. Results and Discussion

The powder XRD patterns for bare and Au-deposited Ce0.5Zr0.5O2 catalysts are presented in Figure 1. The XRD pattern of the bare Ce0.5Zr0.5O2 sample follows the pattern observed for the CexZr1−xO2 solid solution [27]. All XRD reflections attributed to the (111), (200), (220), (311), (222), (400), (331) and (420) planes for the fluorite-type cubic crystal structure (JCPDS: 00-028-0271) are similar to those of the CeO2 structure. The XRD pattern clearly shows the presence of a homogeneous CeO2-ZrO2 solid solution, as the splitting of XRD reflections is not observed [28].
The XRD patterns for the Au-deposited Ce0.5Zr0.5O2 samples exhibit similar reflections to the bare Ce0.5Zr0.5O2 sample. The peak position and intensities of the XRD reflections are the same after the Au deposition, which indicates that the crystal structure of Ce0.5Zr0.5O2 is intact in the Au-deposited samples. Interestingly, low-intensity XRD reflections are detected at 2θ = 38.2°, corresponding to the Au0 phase (JCPDS file # 04-0784) in 0.5Au-Ce0.5Zr0.5O2 and 1.0Au-Ce0.5Zr0.5O2 materials. In contrast, no XRD reflections of the Au0 phase are observed in the case of 0.1Au-Ce0.5Zr0.5O2 and 0.2Au-Ce0.5Zr0.5O2 samples, revealing that these samples might possess highly dispersed smaller-sized Au crystallites (<5 nm) [29]. In a previous report, Prasad et al. [29] observed a shift in XRD reflections to lower angles and a minor increment in the lattice parameter when a metal was doped in the CeO2 structure.
To study the effect of the deposition of Au on the crystal structure of Ce0.5Zr0.5O2, lattice parameters for the samples were obtained using reflection due to the (111) plane, and the observed values are tabulated in Table 1. It is clear that there is no considerable alteration observed in the lattice parameter of Ce0.5Zr0.5O2 after the Au deposition. For instance, the lattice parameters for the bare Ce0.5Zr0.5O2, 0.5Au-Ce0.5Zr0.5O2 and 1.0Au-Ce0.5Zr0.5O2 samples are 0.514, 0.515 and 0.516 nm, respectively. In addition, the average sizes of the Ce0.5Zr0.5O2 and Au crystallites were determined by using the Scherrer equation. The crystallite sizes in the bare Ce0.5Zr0.5O2 and Au-deposited Ce0.5Zr0.5O2 samples are estimated to be between 50 and 60 nm. The average size of the Ce0.5Zr0.5O2 crystallites are not changed after Au deposition. The size of the Au crystallites is in the range of 25–35 nm for the 0.5Au-Ce0.5Zr0.5O2 and 1.0Au-Ce0.5Zr0.5O2 samples. The size of the Au crystallites was not determined for the 0.1Au-Ce0.5Zr0.5O2 and 0.2Au-Ce0.5Zr0.5O2 samples due to the disappearance of XRD reflections due to the Au metallic phase.
The FT-IR spectra of the bare and Au-deposited Ce0.5Zr0.5O2 materials are presented in Figure 2. The IR absorption bands at 3411 cm−1 and 1630 cm−1 shown in the spectrum are due to O-H stretching vibrations and the H2O molecules being physically absorbed, respectively [30]. In addition, all samples show IR absorption bands of 560 cm−1 and 465 cm−1, because of the presence of Ce-O and Zr-O stretching vibrations, respectively [31]. These observations clearly indicate the formation of a Ce-Zr solid solution. The FT-IR spectrum of the synthetic sample shows no significant changes after Au deposition, indicating that the crystal structure of Ce0.5Zr0.5O2 is preserved. However, the band intensity increases at 1035 cm−1, while the band intensity related to the O-H stretching vibration decreases as Au loading increases from 0.1 to 1.0 wt.%, mainly because of the presence of Au species on the surface of Ce0.5Zr0.5O2.
To investigate the surface morphology and size of the nanoparticles of the synthesized materials, TEM analysis was performed, and the obtained images are shown in Figure 3. The TEM image of the bare Ce0.5Zr0.5O2 sample clearly shows the Ce0.5Zr0.5O2 particle with a relatively spherical shape. TEM images can be used to study the changes in the morphology of Ce0.5Zr0.5O2 particles after Au loading. After the Au deposition, it is clear that the morphology of the Ce0.5Zr0.5O2 particles changes slightly, and the particles have non-uniform spherical and rod-shaped morphologies of discrete sizes. The formation of a rod-shaped particle is probably due to the agglomeration of Ce0.5Zr0.5O2 particles during thermal treatment. The HRTEM images of the bare and Au-deposited Ce0.5Zr0.5O2 samples provide other evidence of the existence of Ce0.5Zr0.5O2 and Au nanoparticles. The presence of lattice fringes in Ce0.5Zr0.5O2 and Au nanoparticles were also investigated. The lattice fringes with d spacing of 0.32 nm, corresponding to the (111) plane of the fluorite cubic structure of Ce0.5Zr0.5O2 phase, confirms solid-solution formation. In addition, we can see the formation of crystalline particles with the exposed (111) plane with d = 0.23 nm of fcc gold metal particles in the Au-Ce0.5Zr0.5O2 sample. The Miller index face, such as (111), is more stable than the others due to its denser atomic packing [32]. The Au nanoparticles are well dispersed on the surface of the Ce0.5Zr0.5O2 semiconductor. The TEM image of the sample 0.5Au-Ce0.5Zr0.5O2 shows the presence of Au nanoparticles (dark spots) with an average size of 20 nm, while the size of the Au particles increases to 24 nm after the deposition of 1.0 wt.% Au, and more Au particles are dispersed in this sample. The HRTEM images do not show the presence of Au particles in the 0.1Au-Ce0.5Zr0.5O2 or 0.2Au-Ce0.5Zr0.5O2 samples. This is possibly due to the low concentration and high dispersion of Au species on the surface of the Ce0.5Zr0.5O2 semiconductor. The Ce0.5Zr0.5O2 particle size is about 36 nm, while the Au particle size is 26–28 nm. The sizes of the Ce0.5Zr0.5O2 and Au particles observed in the TEM images are smaller compared to the crystal size obtained from XRD analysis, possibly due to an irregular distribution of the nanoparticles.
DRUV-vis spectroscopy is utilized to study the surface coordination and oxidation states of metal species in synthesized materials by determining the d-d and f-d transitions and the oxygen–metal CT peaks [33]. Figure 4 shows the investigated sample’s DRUV-vis spectrum, and the UV region’s peak appears as a peak of the CeO2 and ZrO2 samples due to their n-type semiconductor nature [34]. The UV absorption observed in CeO2 may be due to the charge transfer transition between the O2p and Ce4f states [35]. It is also reported that the inclusion of Zr4+ species into the CeO2 lattice allows the sample to absorb UV-vis light. Figure 4 shows that the bare Ce0.5Zr0.5O2 sample exhibits three absorption peaks at 255, 285 and 340 nm, attributed to the CT of O2−→ Ce3+ and of O2−→ Ce4+ CT, and inter band transitions, respectively [36]. The observed absorption peaks are at higher wavelengths than bare CeO2 [35], indicating the presence of the Ce-Zr solid solution. The formation of the solid solution influences the charge transfer and optical characteristics [37]. It is evident from Figure 4 that the DRUV-vis spectrum of the Au-deposited Ce0.5Zr0.5O2 samples has a new peak of 560 nm, which could be attributable to the SPR peak of the Au nanoparticle. The peak intensity of the SPR in the 1.0Au-Ce0.5Zr0.5O2 sample is higher than that in the other samples, which may be due to the high concentration of Au nanoparticles on the sample’s surface [38,39]. Furthermore, the direct band gap value of the sample was obtained using a Tauc plot (Figure 4). The bare Ce0.5Zr0.5O2 sample shows a band gap of 3.25 eV, which indicates that the Ce0.5Zr0.5O2 semiconductor could absorb lots of UV light. However, after the Au deposit, the band gap gradually decreased to 2.86 eV (1.0Au-Ce0.5Zr0.5O2). This observation reveals that the Au-Ce0.5Zr0.5O2 samples could effectively absorb visible light. The highest light absorption capacity is observed in the case of the 1.0Au-Ce0.5Zr0.5O2 sample. It was previously reported that the deposition of noble metals such as Pt and Au into semiconductor materials could improve their light absorption properties [40]. The deposited Au on Ce0.5Zr0.5O2 led to a shift in the absorption edge to a higher wavelength, indicating a reduction in the band gap. In the case of TiO2 catalysts doped with Au, the band gap has been found to be reduced with increased Au loading [41].
The texture properties of the prepared catalysts were investigated by using N2 physisorption measurements (Figure 5). The adsorption–desorption isotherms of the bare and Au-deposited Ce0.5Zr0.5O2 catalysts are like type III isotherms and have a H2 hysteresis loop as a classification for the IUPAC [42]. This observation reveals that the preparation material has macropores, and the existence of H2 hysteresis loops indicates that the sample contains narrow inkpot-shaped pores [42]. The Au-deposited samples show levelling of the hysteresis loop due to decreased pore volume. However, a uniform pore size distribution can be observed from the pore size distribution patterns. From Table 2, the surface area of the catalysts decreases from 58 m2g−1 to 40 m2g−1 after the Au deposition, as suggested in previous studies [21]. However, the average pore diameter and pore volume increase from 1.90 to 2.10 nm and 0.102 to 0.113 cm3/g, respectively. These observations indicate that the materials are macroporous in nature, and all the materials have similar structures.
The XPS measurements of the synthesized samples were carried out to investigate synthesized catalysts’ valence states and surface element composition. The deconvoluted Ce3d, Zr3d and O1s XPS spectra for the bare Ce0.5Zr0.5O2 sample are shown in Figure 6. It is known that Ce compounds exhibit unique XPS spectra because of valence 4f orbital hybridization with ligand orbitals [43]. As shown in Figure 6, the Ce3d spectrum of the Ce0.5Zr0.5O2 sample shows 3d3/2 and 3d5/2 spin-orbit components. The XPS peaks corresponding to the Ce3+states are annotated as u1 (903.7 eV) and v1 (885.5 eV); however, those belonging to the Ce4+states are represented by v (883.9 eV), u (902.4 eV), v11 (889.3 eV), u11 (908.2 eV), v111 (899.4 eV) and u111 (917.6 eV) [44]. The elemental quantification results from the XPS analysis are summarized in Table 3. The ‘v’ peak of 883.8 eV indicates that electrons are transferred from a filled O2p orbital to an empty Ce4f orbital [45]. The appearance of a ‘u’ peak in the XPS spectrum reveals that the synthesized catalyst possesses few oxygen vacancies and reduces the Ce species. Therefore, Ce exists together as Ce3+ and Ce4+ species in the Ce0.5Zr0.5O2 sample. Previously, it was observed that the concentration of oxygen vacancies in Ce0.5Zr0.5O2 semiconductors depends on the particle size, and small particles generally have more oxygen vacancies [46]. A high concentration of oxygen vacancies exists in the synthesized Au-deposited Ce0.5Zr0.5O2 samples due to the nanosized Ce0.5Zr0.5O2 crystallites.
The Zr 3d XPS spectrum of the Ce0.5Zr0.5O2 catalyst shows two contributions at 182.2 eV and 184.4 eV due to contributions of Zr3d5/2 and Zr3d3/2, respectively. The BE values for the two spin-orbit XPS peaks in Zr3d spectra reveal the existence of Zr4+ions [46] in the case of the bare Ce0.5Zr0.5O2 sample. The O1s spectra of all the catalysts show peaks at 528 eV and 530 eV due to oxygen vacancies and lattice oxygen in the Ce0.5Zr0.5O2 phase. The third peak that appears at 532 eV could be assigned to oxygen in the -OH species on the surface of the Ce0.5Zr0.5O2 semiconductor [47]. Interestingly, after Au deposition, the XPS peak related to the Ce3d, Zr3d, Au4f and O1s components shifts towards lower binding energy values (Table S1), probably due to an interaction between Au and Ce0.5Zr0.5O2. The deconvoluted Ce3d, Zr3d, O1s and Au4f XPS spectra for 1.0Au-Ce0.5Zr0.5O2 sample are shown in Figure 6. The Ce3d, Zr3d and O1s spectrum of the 1.0Au-Ce0.5Zr0.5O2 sample is very similar to that of the bare Ce0.5Zr0.5O2 sample; however, the Au4f XPS spectrum shows a doublet due to Au4f7/2 and Au4f5/2 contributions at 83.8 eV and 87.5 eV, respectively [48]. The literature indicates that Au4f7/2 contributions appear at 84.0 eV for Au0, while it shows that they appear at 84.6 eV and 86.6 eV for Au+ and Au3+ species [48]. Therefore, the observed Au4f peaks confirm the presence of Au0 and Au3+ species in the 1.0Au-Ce0.5Zr0.5O2 sample. Thus, the Au species present on the sample surface are mainly metallic. The small area for the Ce3+ peak (903.8 eV) and the high area corresponding to the Ce4+ peak at 883.8 eV after the Au deposition, and the presence of peaks because of oxidic Au species (86.6 eV), strongly emphasizes the Au-Ce0.5Zr0.5O2 interaction in the Au-deposited samples. In addition, the quantitative analysis (Table 3) indicates that the ratio of O/O2− for Au-deposited Ce0.5Zr0.5O2 catalysts is slightly changed with Au deposition. It is clear that the 1.0Au-Ce0.5Zr0.5O2 sample is composed of more surface-adsorbed oxygen species, suggesting that this sample has more oxygen vacancies, which could be beneficial for photocatalysis [49]. The obtained bulk and surface elemental composition (Table 3) for the samples indicates the samples’ successful Au deposition and homogenous nature. The surface Au compositions of the Au-deposited Ce0.5Zr0.5O2 samples are slightly lower compared to the bulk composition, probably due to the incorporation of a minor quantity of Au species into the pores of the Ce0.5Zr0.5O2 semiconductor.
The photocatalytic activity of synthesized bare and Au-deposited Ce0.5Zr0.5O2 samples was evaluated via the photoreforming of aqueous bioethanol to produce H2. Reaction conditions such as reaction time, bioethanol concentration, the mass of the catalyst, the pH of the solution and the temperature of the reaction were examined to establish suitable reaction conditions to obtain the highest activity (Figure 7). Initially, the role of reaction time on H2 production rate over the prepared samples was assessed, and the results can be seen in Figure 7A. The figure provides the quantities of H2 produced under previously optimized reaction conditions over the bare and Au-deposited Ce0.5Zr0.5O2 samples. The reaction was performed continuously for 12 h, and the highest amount of H2 was produced over the 1.0Au-Ce0.5Zr0.5O2 sample. After 12 h, the activity of the catalysts does not decrease considerably. The H2 yields are negligible when only water is used; however, the H2 yields are increased with an increase in bioethanol volume, and the H2 production reaches the maximum at 20 vol.% in all Au-deposited Ce0.5Zr0.5O2 samples (Figure 7B).
The increase in bioethanol volume above 20 vol.% does not result in any considerable increase in H2 production. All the Au-deposited Ce0.5Zr0.5O2 samples exhibit similar behavior, although the Au content in the catalysts is different. The deposition of Au nanoparticles enhances H2 production significantly. The reported studies revealed that an increased volume of ethanol could lead to the formation of ethanol multilayers on the semiconductor surface, blocking the exposure of light to reach catalytically active sites, leading to lower H2 yields. Thus, an optimum bioethanol concentration was established for synthesized Au-deposited Ce0.5Zr0.5O2 samples. It is observed that the 1.0Au-Ce0.5Zr0.5O2 sample exhibits the highest H2 production of 3210 μmol g−1. The photocatalytic activity tests performed without sacrificing the agent (bioethanol) over the 1.0Au-Ce0.5Zr0.5O2 catalyst under optimized reaction exhibits H2 production of 130 µmolg−1h−1 after one hour of reaction. This result clearly reveals the importance of the addition of bioethanol as a sacrificing agent in the reactor feed to obtain high H2 yields. The electrostatic interactions between the semiconductor surface and reactants influence the catalytic functionality of the photocatalyst. To investigate the role of the pH of the reactants on catalyst performance, different aqueous bioethanol mixtures with a pH between 2 and 10 were utilized for the photoreforming tests. The obtained results (Figure 7C) reveal that all the synthesized catalysts show photocatalytic activity with the solutions at a pH in the range of 7–8, as the pH at the point of zero charge (pHpzc) of Ce0.5Zr0.5O2 is around 7. The pzc for Au-deposited Ce0.5Zr0.5O2 samples is not expected to change significantly as the major portion of the synthesized nanomaterials is composed of Ce0.5Zr0.5O2; thus, it is not expected that any change will be required from the optimum pH value to obtain high H2 yields. A similar observation was reported previously in the case of Ag-deposited Ce0.5Zr0.5O2 nanofibers as these materials offered high photocatalytic activity for the degradation of p-nitrophenol at a neutral pH [21]. It is clear that change in the pH of the reactants (acidic or basic) influenced the H2 yields significantly in both the bare and Au-deposited Ce0.5Zr0.5O2 samples. The surface hydroxyl groups over the Ce0.5Zr0.5O2 semiconductor assist in ethanol molecule adsorption via hydrogen bonding [50]. The Au-deposited Ce0.5Zr0.5O2 samples, which consist of Au and Ce0.5Zr0.5O2 nanoparticles, show high photoreforming activity due to the presence of large number of hydroxyl groups and their mesoporous nature. The reformation of alcohols propagates stepwise via the generation of some reaction intermediates [51]. In acidic pH, the formation of major intermediate [CH3CHO] from CH3CH2OH is low, and thus, the production of H2 is also low. While in basic pH, the CH3COOH could undergo oxidation to generate CO2 due to deprotonation. It was previously reported that Ce0.5Zr0.5O2 is amphoteric in nature and a change in pH led to a change in the surface acid-base character of the Au-Ce0.5Zr0.5O2 photocatalyst, as the pH could influence the surface functionality of the semiconductor [50]. In basic solution, the negatively charged Ce0.5Zr0.5O2 surface leads to a lower extent of interaction between the ethanol and Ce0.5Zr0.5O2, which is subsequently responsible for the lower production of H2 [52].
Figure 7D shows the results of experiments related to the role of catalyst mass in the photocatalytic performance of bioethanol to produce H2 over the bare and Au-deposited Ce0.5Zr0.5O2 samples using 20 vol.% aqueous bioethanol at pH = 7.0. It can be seen that a gradual increase in the H2 generation is noticed with an increase in catalyst mass from 50 mg to 150 mg; however, the photoactivity is stable with a further increase in catalyst mass to 200 mg. The obtained results indicate that 150 mg is the optimum catalyst mass for the highest activity of photocatalytic H2 production in the case of synthesized Au-deposited Ce0.5Zr0.5O2 samples. This is possibly due to the lack of change in the number of exposed catalytic active sites to adsorb the ethanol molecules with the high amount of catalyst (greater than 150 mg). There is another possibility that visible light is not available to catalytically active sites due to presence of large amount catalyst, which could be responsible for enhanced light scattering. Slight agglomeration of the catalyst particles is also observed when the catalyst mass is beyond optimum, which could also result in a decrease in the active surface area of the catalyst [53].
Further, we studied the effect of reaction temperature on the activity of catalysts in photocatalytic H2 production in the temperature range of 25–85 °C (Figure 7E). A gradual change in H2 production is observed in the case of all catalysts when the reaction temperature increases from 25 °C to 85 °C. In our previous reports [54,55], it was our observation that H2 yields are proportional to the reaction temperature in the case of Pt- and Au-deposited nanocomposite catalysts, as reaction temperature showed a great influence on the yield of the products due to the enhancement in product desorption from the surface of the photocatalyst. The photocatalytic activity patterns for Au-deposited Ce0.5Zr0.5O2 catalysts are similar to those previously reported Pt- and Au-deposited semiconductors. The photoreforming of bioethanol was not performed beyond 85 °C due to the fact that at high temperatures, the adsorption of ethanol molecules on the surface of the semiconductor decreases [56]. The investigation of the stability of catalysts under practical reaction conditions is a significant area of study due to the possibility of the photo-corrosion of catalysts under optimized reaction conditions. The most active catalyst (1.0Au-Ce0.5Zr0.5O2) was chosen to study the stability of synthesized photocatalysts. To investigate the recyclability of the 1.0Au-Ce0.5Zr0.5O2 catalyst, we filtered the catalyst powder via vacuum filtration after performing the first cycle; then, we washed and dried the catalyst powder at 80 °C for 60 min and utilized the catalyst powder for the next cycle of the reaction. The recycled catalyst powder was reused for a total of five cycles, as shown in Figure 7F. The 1.0Au-Ce0.5Zr0.5O2 catalyst shows photocatalytic activity without a substantial decrease in H2 yield. The stability of the 1.0Au-Ce0.5Zr0.5O2 catalyst is mainly due to the structural stability and high resistance to photo-corrosion of Ce0.5Zr0.5O2 mixed oxide under the studied reaction conditions.
It is well known that the high surface area and pore volume of the semiconductor could enable the high dispersion of noble metal species, which could lead to superior H2 production [57]. In our previous reports [54,55,58], it was observed that the dispersion of noble metal species played an important role in the development of a photocatalyst that offers high H2 production. The 1.0Au-Ce0.5Zr0.5O2 catalyst, which offered the highest H2 formation, possessed highly dispersed Au species (TEM and XPS analyses) among the prepared samples with a relatively high surface area and pore volume. These results coincide with the previous reported observations that highly dispersed nanosized Au metal species are favorable for high H2 production via the photocatalytic reforming of bioethanol. The band gap calculations for the prepared samples indicated that the bare Ce0.5Zr0.5O2 sample possessed a band gap of 3.25 eV, while the band gap decreased to 2.86 eV, when 1.0 wt.% Au was deposited on the Ce0.5Zr0.5O2 surface; thus, the 1Au-Ce0.5Zr0.5O2 catalyst could generate e/h+ pairs effectively when it was exposed to visible light. The edge positions for VB (EVB) and CB (ECB) for the 1.0Au-Ce0.5Zr0.5O2 catalyst were calculated using the formulas EVB = X–− Ee + (0.5)Eg and ECB = EVB–− Eg, where, X is the electronegativity for Ce0.5Zr0.5O2 is 5.73 eV; Ee is the energy of electrons on the NHE scale (4.5 eV), and Eg is the band gap calculated from the Tauc plot. It was determined that the EVB of the 1.0Au-CeZr catalyst was 2.66 eV vs. NHE, and the corresponding ECB is 0.2 eV vs. NHE. The catalyst characterization results indicate that the Au species are highly dispersed on Ce0.5Zr0.5O2’s surface. It appears that in the case of Au-deposited Ce0.5Zr0.5O2 catalysts, the interface between Au and Ce0.5Zr0.5O2 nanoparticles is responsible for the absorption of photoenergy and generation of charge carriers under the visible region. A shift in emission position due to the charge transfer between the Au nanoparticles and the CB of the Ce0.5Zr0.5O2 semiconductor is clearly observed. The decrease in the band gap assists in increasing the photocatalytic efficiency of Au-deposited Ce0.5Zr0.5O2 catalysts under visible light irradiation. The photoreformation of bioethanol is initiated by the excitation of the Ce0.5Zr0.5O2 semiconductor, resulting in the generation of an electron (e) from the VB to the CB of Ce0.5Zr0.5O2 (Scheme 1), consequently, a hole (h+) is created in the VB of Ce0.5Zr0.5O2. The generated e/h+ pair can then transport to the Ce0.5Zr0.5O2 surface and initiate the redox reactions with adsorbed ethanol and water molecules. The recombination of charge carriers is a normal process, and it is largely responsible for the low activity of photocatalytic processes. However, the e/h+ pairs that are not recombined normally transport to the Ce0.5Zr0.5O2 surface, where e reduces H+ to produce H2 gas and h+ could oxidize H2O to produce O2 gas. It is well known that in the absence of suitable traps or scavengers, the photogenerated e/h+ recombine easily. The enhanced H2 production activity observed in the case of Au-deposited Ce0.5Zr0.5O2 catalysts is mainly because of localized surface plasmon resonance (LSPR) on the Au nanoparticles under visible light. Moreover, the transport of the photogenerated e is faster due to the formation of the Au-Ce0.5Zr0.5O2 interface, which could be responsible for the highly photocatalytic H2 production [59]. The LSPR-enhanced transported e due to presence of Au nanoparticles is illustrated in Scheme 1. The Au-deposited Ce0.5Zr0.5O2 samples exhibit strong visible light absorption due to the LSPR-excited Au nanoparticles effectively generating photoelectrons.
Recently, Van Dao et al. [60] used 3D finite-difference time-domain (3D FDTD) simulations to understand how the SPR phenomenon contributed to photocatalytic H2 production over Au/Pt-CeO2 catalysts. The authors observed intense hot spots corresponding to electric fields generated at the metal (Au)–semiconductor interface. Thus, it was concluded that the superior photocatalytic activity is due to the effective charge carrier generation and transfer in Au/Pt-containing photocatalysts. Further, electrochemical impedance (EIS) spectra were obtained to investigate the e/h+ recombination rate because it is essential in photocatalytic performance. The observed results are presented in Figure 8 of the revised manuscript. Figure 8 depicts the EIS plots of the bare electrode, Ce0.5Zr0.5O2, 0.5Au-Ce0.5Zr0.5O2 and 1.0Au-Ce0.5Zr0.5O2 samples. The semicircle that appears in the middle region can be correlated with interfacial charge transfer resistance (Rct). The lowest semicircle indicates the fastest interfacial e transfer and enhanced e/h+ separation [61]. The 1.0Au-Ce0.5Zr0.5O2 sample exhibits the smallest semicircle, indicating faster interfacial e transfer compared to other samples. It is important to note that the 1.0Au-Ce0.5Zr0.5O2 sample shows a redox current higher than that of the 0.5Au-Ce0.5Zr0.5O2 sample. This is possibly because of the optimum Au loading and e/h+ recombination rate and high electrical conductivity compared to the other samples. These observations reveal that the 1.0Au-Ce0.5Zr0.5O2 sample contained the highest charge separation efficiency with an increased lifetime of photogenerated e/h+ species compared to the other samples. Thus, the 1.0Au-Ce0.5Zr0.5O2 sample is efficient for the photocatalytic reformation of bioethanol process.
The product analysis revealed the formation of different types of gaseous and liquid products during the photocatalytic reformation. The Au-deposited Ce0.5Zr0.5O2 samples mostly generated H2 and small yields of CO, CO2, CH4 and C2 hydrocarbons (Table S2, MS analysis). Bioethanol could undergo oxidation with the help of photogenerated holes (h+); on other hand, the electrons (e) participate in the reduction of H+ to H2 [62].
C2H5OH + 3H2O + 12h+ → CO2 + 12H+
H+ + 2e → H2
The production of considerable amounts of CO2 was observed in some cases due to subsequent oxidation process; however, controlling the reaction conditions, such as the water/ethanol ratio, and tuning the catalyst characteristics, such as surface area, could suppress the undesired oxidation process. The analysis of liquid products indicated the formation of acetaldehyde, which is normally formed from 1-hydroxyethyl radicals, as shown in Equation (4) [63]. In addition, the presence of small amounts of 2,3-butanediol and acetic acid was observed in the product due to dehydrogenative oxidation of acetaldehyde and the combination of two 1-hydroxyethyl radicals [62]. The synthesized Au-deposited Ce0.5Zr0.5O2 catalysts possessed relatively high surface areas with a high pore volume, enhancing the adsorption/desorption processes and increasing the rates of photocatalytic H2 production.
C2H5OH + h+ → *CH(OH)CH3 + H+
*CH(OH)CH3 + h+ → CH3CHO
CH3CHO + H2O + 2h+ → CH3COOH + 2H+
2 *CH(OH)CH3 → CH3CH(OH)CH(OH)CH3
The morphological investigation of the 1.0Au-Ce0.5Zr0.5O2 sample after the recyclability tests was performed using SEM analysis. The SEM image is shown in Figure 8B; the morphology of the 1.0Au-Ce0.5Zr0.5O2 catalyst was not changed significantly after five cycles of the photocatalytic reaction. Slight aggregation of the particles was observed due to the mechanical attrition and exposure of photoenergy for a long period.

3. Experimental Section

3.1. Preparation of Catalysts

3.1.1. Ce0.5Zr0.5O2 Nanoparticles

The Ce0.5Zr0.5O2 nanoparticles were synthesized via a hydrothermal synthesis method. Calculated amounts of Ce(NO3)3·6H2O (99.0%, Fluka) and ZrO(NO3)2·xH2O (99.9%, Merck) were taken to maintain a molar ratio of Zr/Ce = 1:1 (the molar ratios H2O/(Ce + Zr salts) = 30). The pH of the hydrolyzing solution was maintained at 3.0 by adding 0.1 M HNO3 solution. After hydrolysis, the obtained gel-type contents were transferred into a Teflon vessel and subjected to hydrothermal treatment at 120 °C for 24 h. Then, the obtained solid was washed and dried for 12 h at 100 °C and thermally treated at 500 °C for 4 h under static conditions.

3.1.2. Au-Deposited Ce0.5Zr0.5O2 Samples

Au-deposited Ce0.5Zr0.5O2 nanocomposites with Au loadings of 0.1, 0.2, 0.5 and 1.0 wt.% were prepared by following a non-aqueous precipitation technique. The calculated amount of commercial Au(CH3COO)3 powder was dissolved into ethanol-acetic acid (50:50 volume ratio) solvent and ultrasonicated for 30 min to form a light-brownish-colored dispersion. The pH of the contents was maintained at around 10–11 by adding tetrapropyl ammonium hydroxide solution. To this, a calculated amount of Ce0.5Zr0.5O2 support was added under constant stirring, and the stirring was continued for one hour; then, the excess solvent was removed via vacuum filtration. The obtained powders were dried in air at 120 °C for 12 h and finally calcined in air at 500 °C for 5 h. The catalysts were denoted as xAu-Ce0.5Zr0.5O2, where x is the Au loading in wt.%.

3.2. Characterization of Synthesized Nanomaterials

The elemental composition of the synthesized materials was determined using an ICP-AES Optima 7300DV (PerkinElmer, Waltham, MA, USA) instrument. The XRD patterns of the powders were collected using a PANalytical X’pert Pro diffractometer. The crystallite size of the obtained materials was determined by applying the Debye–Scherer equation. The TEM measurements of the samples were carried out using a JEOL 2100HT microscope (JEOL, Akishima, Tokyo, Japan) equipped with a 200 kV accelerating voltage, and images were captured using a Gatan digital camera. The X-ray photoelectron spectra of the samples were collected using Thermo-Scientific Escalab 250 Xi XPS instrument with Al Kα X-rays with a spot size of 650 mm. The peak shift due to charge compensation was corrected using the binding energy of the C1s peak. The data were acquired using a pass energy of 100 eV, a dwell time of 200 ms with a step size of 0.1 eV, and 10–30 scans. The textural properties of the samples were obtained from N2-physisorption experiments, which were conducted using a Quantachrome ASiQ adsorption system. Optical properties were measured using a Thermo Scientific evolution UV-vis spectrophotometer equipped with an integrating sphere in a wavelength range of 200–800 nm to measure the absorbance spectra of the samples. Tauc plots were used to determine the band gap of the samples using Tauc’s relation [(αhν)] = A[(hν − Eg)]q, where ‘α’ is the optical absorption, ‘hν’ is the incident photon energy, ‘A’ is a constant and ‘q’ characterizes the optical absorption process with a value equal to 2 or 0.5, to allow for indirect and direct electronic transitions to the determination of the direct and indirect band gap values, respectively [64]. The band gap values were obtained by extrapolating the linear region of the plot. EIS experiments were performed by utilizing 5 mM Fe(CN)63−/Fe(CN)64−, applying a potential with an amplitude of 5 mV in a frequency range from 0.1 to 1 × 10⁻⁵ Hz, and applying a potential of 0.22 V.

3.3. Photocatalytic Reforming of Bioethanol to Hydrogen

Batch-type photocatalytic reactions were performed in a Pyrex round-bottom flask under an argon atmosphere. The catalyst (150 mg) was dispersed in 120 mL of a 20 vol% aqueous bioethanol solution via stirring at 500 rpm at 25 °C for 30 min in the dark to ensure a uniform catalyst suspension. The reactor was then subjected to visible light irradiation utilizing a 300 W Xe lamp, providing a flux of approximately 125 mW cm−2 in the reaction zone for 1 h. Evolved gases flowed into the gas chromatograph sample loop through a closed gas circulation. The product analysis for H2 was carried out using a Varian 3300 gas chromatograph with a thermal conductivity detector and a 2 m MS 13X column. The liquid products were continuously condensed in the reactor using a condenser kept at 15 °C at the outlet. At the end of the photocatalytic test, the liquid phase was analyzed using a gas chromatograph equipped with both flame ionization and mass detectors

4. Conclusions

Au plasmonic nanoparticles (0.1 to 1.0 wt.%) were deposited on a nanosized Ce0.5Zr0.5O2 semiconductor via a non-aqueous precipitation method using gold acetate as a Au precursor. The synthesized samples were utilized for the photocatalytic reforming of bioethanol to produce H2 under visible light. The Ce0.5Zr0.5O2 with 1.0 wt.% Au loading produced 3210 μmol g−1 of hydrogen, higher than that of bare and other Au-deposited Ce0.5Zr0.5O2 samples. The enhancement in the H2 production rate was largely due to the presence of plasmonic Au metal nanoparticles, which substantially increased visible light absorption and bioethanol conversion. Different characterization tools, such as powder XRD, TEM, FT-IR, DRUV-vis, XPS, EIS and N2 gas adsorption, were used to analyze the physicochemical properties of the synthesized photocatalysts. The characterization results indicate that the low band gap (2.86 eV); relatively high surface area (40 m2/g); and greater number of catalytically active sites, such as Ce3+, and oxygen vacancies are also responsible for the superior activity of the Au-deposited Ce0.5Zr0.5O2 photocatalysts. Moreover, the plasmonic Au nanoparticles enhanced the photogenerated electron trap to minimize the e/h+ recombination rate to improve the H2 yields. This work provides a basis for the design and fabrication of Ce0.5Zr0.5O2 semiconductors with plasmonic metal species for H2 production under visible light.

Supplementary Materials

The following supporting information can be downloaded at: https://www.mdpi.com/article/10.3390/catal13101340/s1, Table S1: The binding energy values for Ce3d, Zr3d, Au4f and O1s components of different samples, Table S2: Product distribution in the photocatalytic reforming of aqueous bioethanol (20 vol.%) over 1.0Au-Ce0.5Zr0.5O2 catalyst.

Author Contributions

Conceptualization, S.A.A.T., Z.K., M.M. and K.N.; Writing—review and editing, S.A.A.T. and K.N.; methodology, M.A.M., S.M.B., S.Z.A.-S., K.S.A.-T. and K.N.; writing—review and editing, S.A.A.T., Z.K. and K.N; project administration, S.A.A.T., M.M., K.N.; funding acquisition, S.A.A.T.; M.M., K.N., Supervision, M.A.M., S.M.B. and S.Z.A.-S.; formal analysis, K.S.A.-T.; investigation, S.Z.A.-S., S.M.B. and K.S.A.-T.; data curation, M.A.M., S.M.B., K.S.A.-T. and K.N. All authors have read and agreed to the published version of the manuscript.

Funding

This research was funded by Deputyship for Research and Innovation, Ministry of Education, Saudi Arabia through project number IFPNC-001-130-2020.

Data Availability Statement

The data presented in this study is available in the electronic supplementary information.

Acknowledgments

The authors extend their appreciation to the Deputyship for Research and Innovation, Ministry of Education, Saudi Arabia, for funding this research work through project number IFPNC-001-130-2020, and the Deanship of Scientific Research (DSR), King Abdulaziz University, Jeddah, Saudi Arabia.

Conflicts of Interest

The authors claim that they do not have any known conflicting financial interests or personal affiliations that may seem to have impacted the work presented in this study.

References

  1. Huang, W.; Xue, W.; Hu, X.; Fan, J.; Tang, C.; Shi, Y.; Liu, E.; Sun, T. A S-scheme heterojunction of Co9S8 decorated TiO2 for enhanced photocatalytic H2 evolution. J. Alloys Compd. 2023, 930, 167368. [Google Scholar] [CrossRef]
  2. Li, T.; Tsubaki, N.; Jin, Z. S-scheme heterojunction in photocatalytic hydrogen production. J. Mater. Sci. Technol. 2024, 169, 82–104. [Google Scholar] [CrossRef]
  3. Idriss, H.; Scott, M.; Llorca, J.; Chan, S.C.; Chiu, W.; Sheng, P.-Y.; Yee, A.; Blackford, M.A.; Pas, S.J.; Hill, A.J.; et al. A Phenomenological Study of the Metal-Oxide Interface: The Role of Catalysis in Hydrogen Production from Renewable Resources. ChemSusChem 2008, 1, 905–910. [Google Scholar] [CrossRef] [PubMed]
  4. Tashie-Lewis, B.C.; Nnabuife, S.G. Hydrogen Production, Distribution, Storage and Power Conversion in a Hydrogen Economy-A Technology Review. Chem. Eng. J. Adv. 2021, 8, 100172. [Google Scholar] [CrossRef]
  5. Liu, K.; Zhang, B.; Zhang, J.; Lin, W.; Wang, J.; Xu, Y.; Xiang, Y.; Hisatomi, T.; Domen, K.; Ma, G. Synthesis of Narrow-Band-Gap GaN:ZnO Solid Solution for Photocatalytic Overall Water Splitting. ACS Catal. 2022, 12, 14637–14646. [Google Scholar] [CrossRef]
  6. Mayer, K.M.; Hafner, J.H. Localized Surface Plasmon Resonance Sensors. Chem. Rev. 2011, 111, 3828–3857. [Google Scholar] [CrossRef] [PubMed]
  7. Shen, R.; Zhang, L.; Li, N.; Lou, Z.; Ma, T.; Zhang, P.; Li, Y.; Li, X. W–N Bonds Precisely Boost Z-Scheme Interfacial Charge Transfer in g-C3N4/WO3 Heterojunctions for Enhanced Photocatalytic H2 Evolution. ACS Catal. 2022, 12, 9994–10003. [Google Scholar] [CrossRef]
  8. Zhang, G.; Ma, Y.; Liu, F.; Tong, Z.; Sha, J.; Zhao, W.; Liu, M.; Zheng, Y. Seeded Growth of Au@CuxO Core–Shell Mesoporous Nanospheres and Their Photocatalytic Properties. Front. Chem. 2021, 9, 671220. [Google Scholar] [CrossRef] [PubMed]
  9. Naz, G.; Shamsuddin, M.; Butt, F.K.; Bajwa, S.Z.; Khan, W.S.; Irfan, M.; Irfan, M. Au/Cu2O core/shell nanostructures with efficient photoresponses. Chin. J. Phys. 2019, 59, 307–316. [Google Scholar] [CrossRef]
  10. Fu, X.; Li, G.G.; Villarreal, E.; Wang, H. Hot carriers in action: Multimodal photocatalysis on Au@SnO2 core–shell nanoparticles. Nanoscale 2019, 11, 7324–7334. [Google Scholar] [CrossRef]
  11. Yang, L.; Guo, S.; Li, X. Au nanoparticles@MoS2 core-shell structures with moderate MoS2 coverage for efficient photocatalytic water splitting. J. Alloys Compd. 2017, 706, 82–88. [Google Scholar] [CrossRef]
  12. Lv, Y.; Duan, S.; Zhu, Y.; Guo, H.; Wang, R. Interface control and catalytic performances of Au-NiS heterostructures. Chem. Eng. J. 2019, 382, 122794. [Google Scholar] [CrossRef]
  13. Murdoch, M.; Waterhouse, G.I.N.; Nadeem, M.A.; Metson, J.B.; Keane, M.A.; Howe, R.F.; Llorca, J.; Idriss, H. The effect of gold loading and particle size on photocatalytic hydrogen production from ethanol over Au/TiO2 nanoparticles. Nat. Chem. 2011, 3, 489–492. [Google Scholar] [CrossRef] [PubMed]
  14. Yu, G.; Wang, X.; Cao, J.; Wu, S.; Yan, W.; Liu, G. Plasmonic Au nanoparticles embedding enhances the activity and stability of CdS for photocatalytic hydrogen evolution. Chem. Commun. 2016, 52, 2394–2397. [Google Scholar] [CrossRef] [PubMed]
  15. Jiménez-Calvo, P.; Caps, V.; Keller, V. Plasmonic Au-based junctions onto TiO2, g-C3N4, and TiO2-g-C3N4 systems for photocatalytic hydrogen production: Fundamentals and challenges. Renew. Sustain. Energy Rev. 2021, 149, 111095. [Google Scholar] [CrossRef]
  16. Basahel, S.N.; Ali, T.T.; Mokhtar, M.; Narasimharao, K. Influence of crystal structure of nanosized ZrO2 on photocatalytic degradation of methyl orange. Nanoscale Res. Lett. 2015, 10, 73. [Google Scholar] [CrossRef] [PubMed]
  17. García-López, E.; Marcì, G.; Pomilla, F.; Paganini, M.; Gionco, C.; Giamello, E.; Palmisano, L. ZrO2 Based materials as photocatalysts for 2-propanol oxidation by using UV and solar light irradiation and tests for CO2 reduction. Catal. Today 2018, 313, 100–105. [Google Scholar] [CrossRef]
  18. Wang, X.; Zhai, B.; Yang, M.; Han, W.; Shao, X. ZrO2/CeO2 nanocomposite: Two step synthesis, microstructure, and visible-light photocatalytic activity. Mater. Lett. 2013, 112, 90–93. [Google Scholar] [CrossRef]
  19. Reddy, B.M.; Reddy, G.K.; Katta, L. Structural characterization and dehydration activity of CeO2–SiO2 and CeO2–ZrO2 mixed oxides prepared by a rapid microwave-assisted combustion synthesis method. J. Mol. Catal. A Chem. 2010, 319, 52–57. [Google Scholar] [CrossRef]
  20. Hao, Y.; Li, L.; Liu, D.; Yu, H.; Zhou, Q. The synergy of SPR effect and Z-scheme of Ag on enhanced photocatalytic performance of 3DOM Ag/CeO2-ZrO2 composite. Mol. Catal. 2018, 447, 37–46. [Google Scholar] [CrossRef]
  21. Narasimharao, K.; Malkhasian, A.Y. Ag/Ce0.5Zr0.5O2 nanofibers: Visible light photocatalysts for degradation of p-nitrophenol. Mol. Catal. 2022, 524, 112309. [Google Scholar] [CrossRef]
  22. Bo, Z.J.; Lintao; Maochu, G.; Li, W.J.; Min, L.Z.; Ming, Z.; Chen, Y. Effect of metal doping into Ce0.5Zr0.5O2 on photocatalytic activity of TiO2/Ce0.45Zr0.45M0.1OX (M=Y, La, Mn). J. Hazard. Mater. 2007, 143, 516–521. [Google Scholar] [CrossRef]
  23. Tesler, A.B.; Chuntonov, L.; Karakouz, T.; Bendikov, T.A.; Haran, G.; Vaskevich, A.; Rubinstein, I. Tunable Localized Plasmon Transducers Prepared by Thermal Dewetting of Percolated Evaporated Gold Films. J. Phys. Chem. C 2011, 115, 24642–24652. [Google Scholar] [CrossRef]
  24. Zanella, R.; Giorgio, S.; Henry, C.R.; Louis, C. Alternative Methods for the Preparation of Gold Nanoparticles Supported on TiO2. J. Phys. Chem. B 2002, 106, 7634–7642. [Google Scholar] [CrossRef]
  25. Haruta, M. Catalysis of Gold Nanoparticles Deposited on Metal Oxides. CATTECH 2002, 6, 102–115. [Google Scholar] [CrossRef]
  26. Vasylkiv, O.; Sakka, Y. Nonisothermal Synthesis of Yttria-Stabilized Zirconia Nanopowder through Oxalate Processing: I, Characteristics of Y-Zr Oxalate Synthesis and Its Decomposition. J. Am. Ceram. Soc. 2004, 83, 2196–2202. [Google Scholar] [CrossRef]
  27. Katta, L.; Sudarsanam, P.; Thrimurthulu, G.; Reddy, B.M. Doped nanosized ceria solid solutions for low temperature soot oxidation: Zirconium versus lanthanum promoters. Appl. Catal. B Environ. 2010, 101, 101–108. [Google Scholar] [CrossRef]
  28. Thompson, D. Report on AURICAT Workshop, Gandia, Spain, 11–13 May 2005. Gold Bull. 2005, 38, 135–137. [Google Scholar] [CrossRef]
  29. Prasad, P.D.H.; Park, S.Y.; Ji, H.I.; Kim, H.R.; Son, J.W.; Kim, B.K.; Lee, H.W.; Lee, J.H. Structural Characterization and Catalytic Activity of Ce0.65Zr0.25RE0.1O2−δ Nanocrystalline Powders Synthesized by the Glycine-Nitrate Process. J. Phys. Chem. C 2012, 116, 3467–3476. [Google Scholar] [CrossRef]
  30. Zhang, L.; Pan, L.; Ni, C.; Sun, T.; Zhao, S.; Wang, S.; Wang, A.; Hu, Y. CeO2–ZrO2 promoted CuO/ZnO catalyst for methanol steam reforming. Int. J. Hydrogen Energy 2013, 38, 4397–4406. [Google Scholar] [CrossRef]
  31. Babitha, K.K.; Sreedevi, A.; Priyanka, K.P.; Sabu, B.; Varghese, T. Structural characterization and optical studies of CeO2 nanoparticles synthesized by chemical precipitation. Indian J. Pure Appl. Phys. 2015, 53, 596–603. Available online: http://nopr.niscpr.res.in/handle/123456789/32128 (accessed on 4 September 2023).
  32. Castillo-López, D.N.; Pal, U. Green synthesis of Au nanoparticles using potato extract: Stability and growth mechanism. J. Nanoparticle Res. 2014, 16, 2571. [Google Scholar] [CrossRef]
  33. Rao, G.R.; Sahu, H.R. XRD and UV-Vis diffuse reflectance analysis of CeO2-ZrO2 solid solutions synthesized by combustion method. J. Chem. Sci. 2001, 113, 651–658. [Google Scholar] [CrossRef]
  34. Nandi, M.; Talukdar, A.K. Ceria–zirconia solid solution loaded hierarchical MFI zeolite: An efficient catalyst for solvent free oxidation of ethyl benzene. Arab. J. Chem. 2019, 12, 3753–3763. [Google Scholar] [CrossRef]
  35. Amoresi, R.A.C.; Oliveira, R.C.; Marana, N.L.; de Almeida, P.B.; Prata, P.S.; Zaghete, M.A.; Longo, E.; Sambrano, J.R.; Simões, A.Z. CeO2 Nanoparticle Morphologies and Their Corresponding Crystalline Planes for the Photocatalytic Degradation of Organic Pollutants. ACS Appl. Nano Mater. 2019, 2, 6513–6526. [Google Scholar] [CrossRef]
  36. Xuan, Y.; Duan, H.; Li, Q. Enhancement of solar energy absorption using a plasmonic nanofluid based on TiO2/Ag composite nanoparticles. RSC Adv. 2014, 4, 16206–16213. [Google Scholar] [CrossRef]
  37. Kurochkina, M.; Konshina, E.; Oseev, A.; Hirsch, S. Hybrid structures based on gold nanoparticles and semiconductor quantum dots for biosensor applications. Nanotechnol. Sci. Appl. 2018, 11, 15–21. [Google Scholar] [CrossRef]
  38. Gaspar, D.; Pimentel, A.C.; Mateus, T.; Leitão, J.P.; Soares, J.; Falcão, B.P.; Araújo, A.; Vicente, A.; Filonovich, S.A.; Águas, H.; et al. Influence of the layer thickness in plasmonic gold nanoparticles produced by thermal evaporation. Sci. Rep. 2013, 3, 1469. [Google Scholar] [CrossRef]
  39. Antony, J.; Bandyopadhyay, S.; Yang, J.; Rønning, M. Optimizing the shape anisotropy of gold nanoparticles for enhanced light harvesting and photocatalytic applications. Photochem. Photobiol. Sci. 2022, 22, 773–781. [Google Scholar] [CrossRef]
  40. Abed, J.; Rajput, N.S.; El Moutaouakil, A.; Jouiad, M. Recent Advances in the Design of Plasmonic Au/TiO2 Nanostructures for Enhanced Photocatalytic Water Splitting. Nanomaterials 2020, 10, 2260. [Google Scholar] [CrossRef]
  41. Rahulan, K.M.; Ganesan, S.; Aruna, P. Synthesis and optical limiting studies of Au-doped TiO2 nanoparticles. Adv. Nat. Sci. Nanosci. Nanotechnol. 2011, 2, 025012–025017. [Google Scholar] [CrossRef]
  42. Sing, K.S.W.; Williams, R.T. Physisorption Hysteresis Loops and the Characterization of Nanoporous Materials. Adsorpt. Sci. Technol. 2004, 22, 773–782. [Google Scholar] [CrossRef]
  43. Słoczyński, J.; Grabowski, R.; Kozłowska, A.; Olszewski, P.; Lachowska, M.; Skrzypek, J.; Stoch, J. Effect of Mg and Mn oxide additions on structural and adsorptive properties of Cu/ZnO/ZrO2 catalysts for the methanol synthesis from CO2. Appl. Catal. A Gen. 2003, 249, 129–138. [Google Scholar] [CrossRef]
  44. Wandelt, K. Photoemission studies of adsorbed oxygen and oxide layers. Surf. Sci. Rep. 1982, 2, 1–121. [Google Scholar] [CrossRef]
  45. Dongare, M.K.; Dongare, A.M.; Tare, V.; Kemnitz, E. Synthesis and characterization of copper-stabilized zirconia as an anode material for SOFC. Solid State Ionics 2002, 152–153, 455–462. [Google Scholar] [CrossRef]
  46. Navío; Hidalgo; Colón, G.; Botta, S.G.; Litter, M.I. Preparation and Physicochemical Properties of ZrO2 and Fe/ZrO2 Prepared by a Sol−Gel Technique. Langmuir 2000, 17, 202–210. [Google Scholar] [CrossRef]
  47. Wu, G.-S.; Wang, L.-C.; Liu, Y.-M.; Cao, Y.; Dai, W.-L.; He, H.-Y.; Fan, K.-N. Implication of the role of oxygen anions and oxygen vacancies for methanol decomposition over zirconia supported copper catalysts. Appl. Surf. Sci. 2006, 253, 974–982. [Google Scholar] [CrossRef]
  48. Reddy, B.M.; Thrimurthulu, G.; Katta, L.; Yamada, Y.; Park, S.-E. Structural Characteristics and Catalytic Activity of Nanocrystalline Ceria−Praseodymia Solid Solutions. J. Phys. Chem. C 2009, 113, 15882–15890. [Google Scholar] [CrossRef]
  49. Shen, M.; Ding, T.; Rackers, W.H.; Tan, C.; Mahmood, K.; Lew, M.D.; Sadtler, B. Single-Molecule Colocalization of Redox Reactions on Semiconductor Photocatalysts Connects Surface Heterogeneity and Charge-Carrier Separation in Bismuth Oxybromide. J. Am. Chem. Soc. 2021, 143, 11393–11403. [Google Scholar] [CrossRef]
  50. Topka, P.; Klementová, M. Total oxidation of ethanol over Au/Ce0.5Zr0.5O2 cordierite monolithic catalysts. Appl. Catal. A Gen. 2016, 522, 130–137. [Google Scholar] [CrossRef]
  51. Sola, A.C.; Homs, N.; de la Piscina, P.R. Photocatalytic H2 production from ethanol (aq) solutions: The effect of intermediate products. Int. J. Hydrog. Energy 2016, 41, 19629–19636. [Google Scholar] [CrossRef]
  52. Behravesh, E.; Melander, M.M.; Wärnå, J.; Salmi, T.; Honkala, K.; Murzin, D.Y. Oxidative dehydrogenation of ethanol on gold: Combination of kinetic experiments and computation approach to unravel the reaction mechanism. J. Catal. 2020, 394, 193–205. [Google Scholar] [CrossRef]
  53. Pellegrino, F.; Pellutiè, L.; Sordello, F.; Minero, C.; Ortel, E.; Hodoroaba, V.-D.; Maurino, V. Influence of agglomeration and aggregation on the photocatalytic activity of TiO 2 nanoparticles. Appl. Catal. B Environ. 2017, 216, 80–87. [Google Scholar] [CrossRef]
  54. Alqurashi, G.K.; Alshehri, A.; Narasimharao, K. Noble Metals (Ag, Au, Pd and Pt) Decorated ZnBiVO4 Nanostructures for Enhanced Photocatalytic H2 Production. Top. Catal. 2022, 66, 533–545. [Google Scholar] [CrossRef]
  55. Althabaiti, S.A.; Khan, Z.; Bawaked, S.M.; Al-Sheheri, S.Z.; Mokhtar, M.; Malik, M.A.; Narasimharao, K. PtOx deposited Fe3O4-ZnO/TiO2 nanocomposites for photocatalytic H2 production under visible light. J. Environ. Chem. Eng. 2023, 11, 110615. [Google Scholar] [CrossRef]
  56. Bartolomé, J.; Taeño, M.; Martínez-Casado, R.; Maestre, D.; Cremades, A. Ethanol gas sensing mechanisms of p-type NiO at room temperature. Appl. Surf. Sci. 2022, 579, 152134. [Google Scholar] [CrossRef]
  57. Hou, L.; Zhang, M.; Guan, Z.; Li, Q.; Yang, J. Effect of platinum dispersion on photocatalytic performance of Pt-TiO2. J. Nanoparticle Res. 2018, 20, 60. [Google Scholar] [CrossRef]
  58. Jawhari, A.H.; Hasan, N.; Radini, I.A.; Malik, M.A.; Narasimharao, K. Pt-Ag/Ag3PO4-WO3 nanocomposites for photocatalytic H2 production from bioethanol. Fuel 2023, 344, 127998. [Google Scholar] [CrossRef]
  59. Ramírez-Ortega, D.; Guerrero-Araque, D.; Acevedo-Peña, P.; Reguera, E.; Calderon, H.A.; Zanella, R. Enhancing the photocatalytic hydrogen production of the ZnO-TiO2 heterojunction by supporting nanoscale Au islands. Int. J. Hydrogen Energy 2021, 46, 34333–34343. [Google Scholar] [CrossRef]
  60. Van Dao, D.; Nguyen, T.T.D.; Le, T.D.; Kim, S.-H.; Yang, J.-K.; Lee, I.-H.; Yu, Y.-T. Plasmonically driven photocatalytic hydrogen evolution activity of a Pt-functionalized Au@CeO2 core–shell catalyst under visible light. J. Mater. Chem. A 2020, 8, 7687–7694. [Google Scholar] [CrossRef]
  61. Alebachew, N.; Murthy, H.C.A.; Gonfa, B.A.; von Eschwege, K.G.; Langner, E.H.G.; Coetsee, E.; Demissie, T.B. Nanocomposites with ZrO2@S-Doped g-C3N4 as an Enhanced Binder-Free Sensor: Synthesis and Characterization. ACS Omega 2023, 8, 13775–13790. [Google Scholar] [CrossRef] [PubMed]
  62. Bamwenda, G.R.; Tsubota, S.; Nakamura, T.; Haruta, M. Photoassisted hydrogen production from a water-ethanol solution: A comparison of activities of Au-TiO2 and Pt-TiO2. J. Photochem. Photobiol. A Chem. 1995, 89, 177–189. [Google Scholar] [CrossRef]
  63. Lu, H.; Zhao, J.; Li, L.; Gong, L.; Zheng, J.; Zhang, L.; Wang, Z.; Zhang, J.; Zhu, Z. Selective oxidation of sacrificial ethanol over TiO2-based photocatalysts during water splitting. Energy Environ. Sci. 2011, 4, 3384–3388. [Google Scholar] [CrossRef]
  64. Makuła, P.; Pacia, M.; Macyk, W. How To Correctly Determine the Band Gap Energy of Modified Semiconductor Photocatalysts Based on UV–Vis Spectra. J. Phys. Chem. Lett. 2018, 9, 6814–6817. [Google Scholar] [CrossRef]
Figure 1. XRD patterns of bare and Au-deposited Ce0.5Zr0.5O2 samples.
Catalysts 13 01340 g001
Figure 2. FT-IR spectra of synthesized bare and Au-deposited Ce0.5Zr0.5O2 samples.
Catalysts 13 01340 g002
Figure 3. TEM images of (a,b) Ce0.5Zr0.5O2, (c,d) 0.5Au-Ce0.5Zr0.5O2 and (e,f) 1.0Au-Ce0.5Zr0.5O2 samples.
Catalysts 13 01340 g003
Figure 4. DR UV-vis spectra and the Tauc plots for synthesized samples.
Catalysts 13 01340 g004
Figure 5. (A) N2 adsorption–desorption isotherms and (B) pore size distribution patterns for bare and Au-deposited Ce0.5Zr0.5O2 samples.
Catalysts 13 01340 g005
Figure 6. The deconvoluted XPS spectra for Ce0.5Zr0.5O2, 0.5Au-Ce0.5Zr0.5O2 and 1.0Au-Ce0.5Zr0.5O2 samples.
Catalysts 13 01340 g006
Figure 7. Photocatalytic conversion of bioethanol over Au-Ce0.5Zr0.5O2 catalysts. (A) Role of reaction time, (B) role of concentration of bioethanol, (C) role of pH of the solution, (D) role of catalyst mass, (E) role of reaction temperature and (F) recyclability of 1.0Au-Ce0.5Zr0.5O2 catalyst.
Catalysts 13 01340 g007
Scheme 1. Schematic representation of photoreforming of aqueous bioethanol to produce H2 over Au-Ce0.5Zr0.5O2 photocatalyst.
Catalysts 13 01340 sch001
Figure 8. (A) EIS-Nyquist plots for the representative synthesized samples. (B) SEM image of spent 1.0Au-Ce0.5Zr0.5O2 sample after recycling experiments.
Catalysts 13 01340 g008
Table 1. The data obtained from XRD analysis of the synthesized samples.
SampleCrystal Size (nm)Cell Parameter
(nm)
Ce0.5Zr0.5O2Au
Ce0.5Zr0.5O250-a = 0.514
0.1Au-Ce0.5Zr0.5O258-a = 0.515
0.2Au-Ce0.5Zr0.5O257-a = 0.515
0.5Au-Ce0.5Zr0.5O25925a = 0.515
1.0Au-Ce0.5Zr0.5O25935a = 0.516
Table 2. Textural properties of the samples measured from N2-physisorption experiments.
CatalystSBET
(m2/g)
Pore Volume
(cm3/g)
Pore Diameter (nm)
Ce0.5Zr0.5O2580.1021.90
0.1Au-Ce0.5Zr0.5O2550.1071.90
0.2Au-Ce0.5Zr0.5O2510.1101.95
0.5Au-Ce0.5Zr0.5O2450.1162.00
1.0Au-Ce0.5Zr0.5O2400.1132.10
Table 3. Elemental analysis from ICP-AES and XPS measurements.
SampleElemental Composition (Mass %)
Bulk aSurface b
CeZrAuCeZrAuO
Ce0.5Zr0.5O247.631.1-45.730.4-23.9
0.1Au-Ce0.5Zr0.5O247.131.00.0945.630.20.0723.9
0.2Au-Ce0.5Zr0.5O246.630.70.1845.530.60.1723.8
0.5Au-Ce0.5Zr0.5O246.330.20.4843.930.70.4623.9
1.0Au-Ce0.5Zr0.5O245.430.00.9843.830.90.9623.8
a ICP-AES, b XPS measurements.
Disclaimer/Publisher’s Note: The statements, opinions and data contained in all publications are solely those of the individual author(s) and contributor(s) and not of MDPI and/or the editor(s). MDPI and/or the editor(s) disclaim responsibility for any injury to people or property resulting from any ideas, methods, instructions or products referred to in the content.

