Article

Detection and Degradation Studies of Nile Blue Sulphate Using Electrochemical and UV-Vis Spectroscopic Techniques

1
Department of Chemistry, Quaid-i-Azam University, Islamabad 45320, Pakistan
2
National Centre of Excellence in Physical Chemistry, University of Peshawar, Peshawar 25120, Pakistan
3
NUTECH School of Applied Science & Humanities, National University of Technology, Islamabad 44000, Pakistan
*
Author to whom correspondence should be addressed.
Catalysts 2023, 13(1), 141; https://doi.org/10.3390/catal13010141
Submission received: 11 November 2022 / Revised: 1 January 2023 / Accepted: 4 January 2023 / Published: 7 January 2023
(This article belongs to the Special Issue Trends in Environmental Applications of Advanced Oxidation Processes)

Abstract

:
An efficient and reliable electrochemical sensing platform based on COOH-fMWCNTs modified GCE (COOH-fMWCNTs/GCE) was designed for the detection of nanomolar concentration of Nile Blue Sulphate (NBS). In comparison to the bare GCE, the electrochemical sensing scaffold considerably enhanced the peak current response of NBS dye as confirmed from the results of voltammetric investigations. The electrochemical approach of detecting NBS in the droplet of its solution dried over the surface of modified electrode validated, the role of modifier in enhancing the sensing response. Under optimized conditions, the designed electrochemical platform demonstrated a wide linearity range (0.03–10 μM) for NBS, with LOD of 1.21 nM. Moreover, COOH-fMWCNTs/GCE was found reproducible and stable as confirmed by repeatability and inter-day durability tests. The selectivity of the designed sensing matrix was ensured by anti-interference tests. The photocatalytic degradation of NBS dye was carried out by using TiO2 nanoparticles as photocatalyst in the presence of H2O2. UV-visible spectroscopic studies revealed 95% photocatalytic degradation of NBS following a pseudo-first-order kinetics with a rate constant of 0.028 min−1. These findings were supported electrochemically by monitoring the photocatalytically degraded dye at the designed sensing platform. The color variation and final decolorization of the selected dye in water served as a visual indicator of the degradation process. To conclude, the designed sensing platform immobilized with COOH-fMWCNTs imparted improved selectivity and sensitivity to detect and to, monitor the photocatalytic degradation of NBS.

1. Introduction

The population of the world is continuously soaring. As a result of this increase, the world is confronting environmental problems along with concomitant health, security, and food issues [1,2,3,4,5,6]. Environmental pollution is one of the major threats to the world. Developing countries are affected the most; they use 80% of the polluted water for cultivation and fertilization purposes. Although industrial development has created innovation and convenience in human life, it has also resulted in harmful health effects and environmental pollution. Since the industrial revolution, pollution has reached an alarming level affecting both developed and developing countries and hence has become a universal challenge that has gripped the world’s attention [7,8,9].
Almost 80 million tonnes of dyes are produced annually worldwide by industries that dump a significant amount of it into waterbodies as wastewater that disturbs the stability of the ecosystems. Approximately 10–15% of the total dye produced in any industry is lost to water during its manufacturing and dyeing stages, and owing to their high solubility and persistent nature, it is challenging to remove them from water. Even though these dyes are released in water in trace amounts, they are still very harmful to humans (even less than 1 ppm) and other aquatic life [10,11]. When released in water, dyes adversely affect the photosynthetic process of aquatic life. Additionally, dyes also have mutagenic and teratogenic effects on fish species. Their hazardous effects include cancers, allergies, and renal complexities. Hence, there is globally a dire need to develop inexpensive and green methods to remove such pollutants from water and make water reusable [12]. Numerous methods have been proposed for treating dye-contaminated wastewater, including adsorption, incineration, foam flotation, physicochemical methods, and biochemical techniques [13,14]. However, since most of the organic dyes are non-biodegradable and thermally stable, they render these conventional methods ineffective. Thus in the present research work, NBS is sought to be removed from wastewater through the photocatalytic degradation process because it is effective, inexpensive, simple, and rapid compared to other methods [8].
Several semiconductors, including titania, vanadium pentoxide, zinc oxide, ferric oxide, cadmium oxide, cadmium sulfide, and alumina, have been used as photocatalysts for the degradation of different colored organic pollutants such as dyes. Among these, TiO2 is the most commonly employed photocatalyst. The current research work focuses on light-assisted catalytic degradation of Nile Blue Sulphate (NBS) dye using TiO2 nanoparticles as it possesses very high mechanical strength, nontoxicity, chemical, and thermal stability [15]. However, owing to its band gap of 3.2 eV, the recombination of the electron-hole pair and absorption in the UV region limits its utility. To hinder the recombination of generated electron-hole pair, H2O2 was used for enhancing the practical utility of TiO2 nanoparticles by abstracting the photogenerated electron and avoiding its recombination with the hole. Different free radicals like OH, O2−/OOH (reactive oxygen species) are generated from H2O2 at the surface of the catalyst that enhance the TiO2 capability of degrading the organic dye molecule in wastewater [16].
But before even its removal, its detection is important. Various techniques, including chromatography, mass spectroscopy, capillary electrophoresis, spectrophotometry, and voltammetry, have been utilized to detect NBS dye. The pre-existing methods, such as chromatography and surface-enhanced Raman spectroscopy are expensive, time-consuming, require calibration, and extensive sample preparation. Industrial effluents are rich in different components which hinder the detection of lower concentrations of NBS using the above mentioned techniques. Electrochemical techniques are preferred owing to their simplicity, reliability and fast responsiveness, yet the structure of NBS is complex offering steric hindrances which impart it with orientational restrictions, making it difficult to be detected using electrochemical techniques [17]. Interestingly the orientational restrictions can be avoided by using a smart approach of skipping the diffusion step by drop casting the analyte on the surface of the modified electrode and detecting it electrochemically. Hence, in this work, a voltammetric method for the detection of NBS was employed owing to its sensitivity, reliability, potential selectivity, and ease of operation compared to all other methods. The electrochemical detection method is based on the principle of sensitivity of the electrode’s surface towards the targeted analyte. Thus, an electrochemical sensor was designed by immobilizing the COOH-fMWCNTs at the surface of the glassy carbon electrode (GCE) to impart sensitivity for detecting trace-level concentrations of the selected analyte. CNTs are used as electrode modifiers because of their high surface-to-volume ratio, chemical stability, electrical, and thermal properties which make them the best choice for modifying the electrode surface [18,19]. The surface of CNTs is susceptible to analytes’ adsorption, which leads to the formation of the most efficient sensors [20,21].
In this study, a COOH-fMWCNTs modified glassy carbon electrode is developed for ultra-sensitive and selective detection of NBS using square wave voltammetry (SWV), electrochemical impedance spectroscopy (EIS), and cyclic voltammetry (CV). The designed electrochemical sensor is also utilized for voltammetric monitoring of the photocatalytic degradation of NBS along with spectroscopic study. The COOH-fMWCNTs-based recognition layer has been employed for the first time in the current study for the detection of NBS. A smart unconventional approach was adopted to improve the sensing ability of the designed sensing platform, wherein a drop of dye was cast on the surface of the modified electrode, which enhanced the ease of orientation of analyte molecules towards the surface of the electrode as witnessed by better resolution of peak and enhancement in peak current value as compared to the conventional approach of dye detection in solution. The approach also offers a very small amount of target analyte to be used which makes the diffusion of bulky dye molecules toward the electrode surface expedient. Thus the approach is promising for dye detection in water for abatement of dyes in wastewater and allows the water to be purified.

2. Results and Discussion

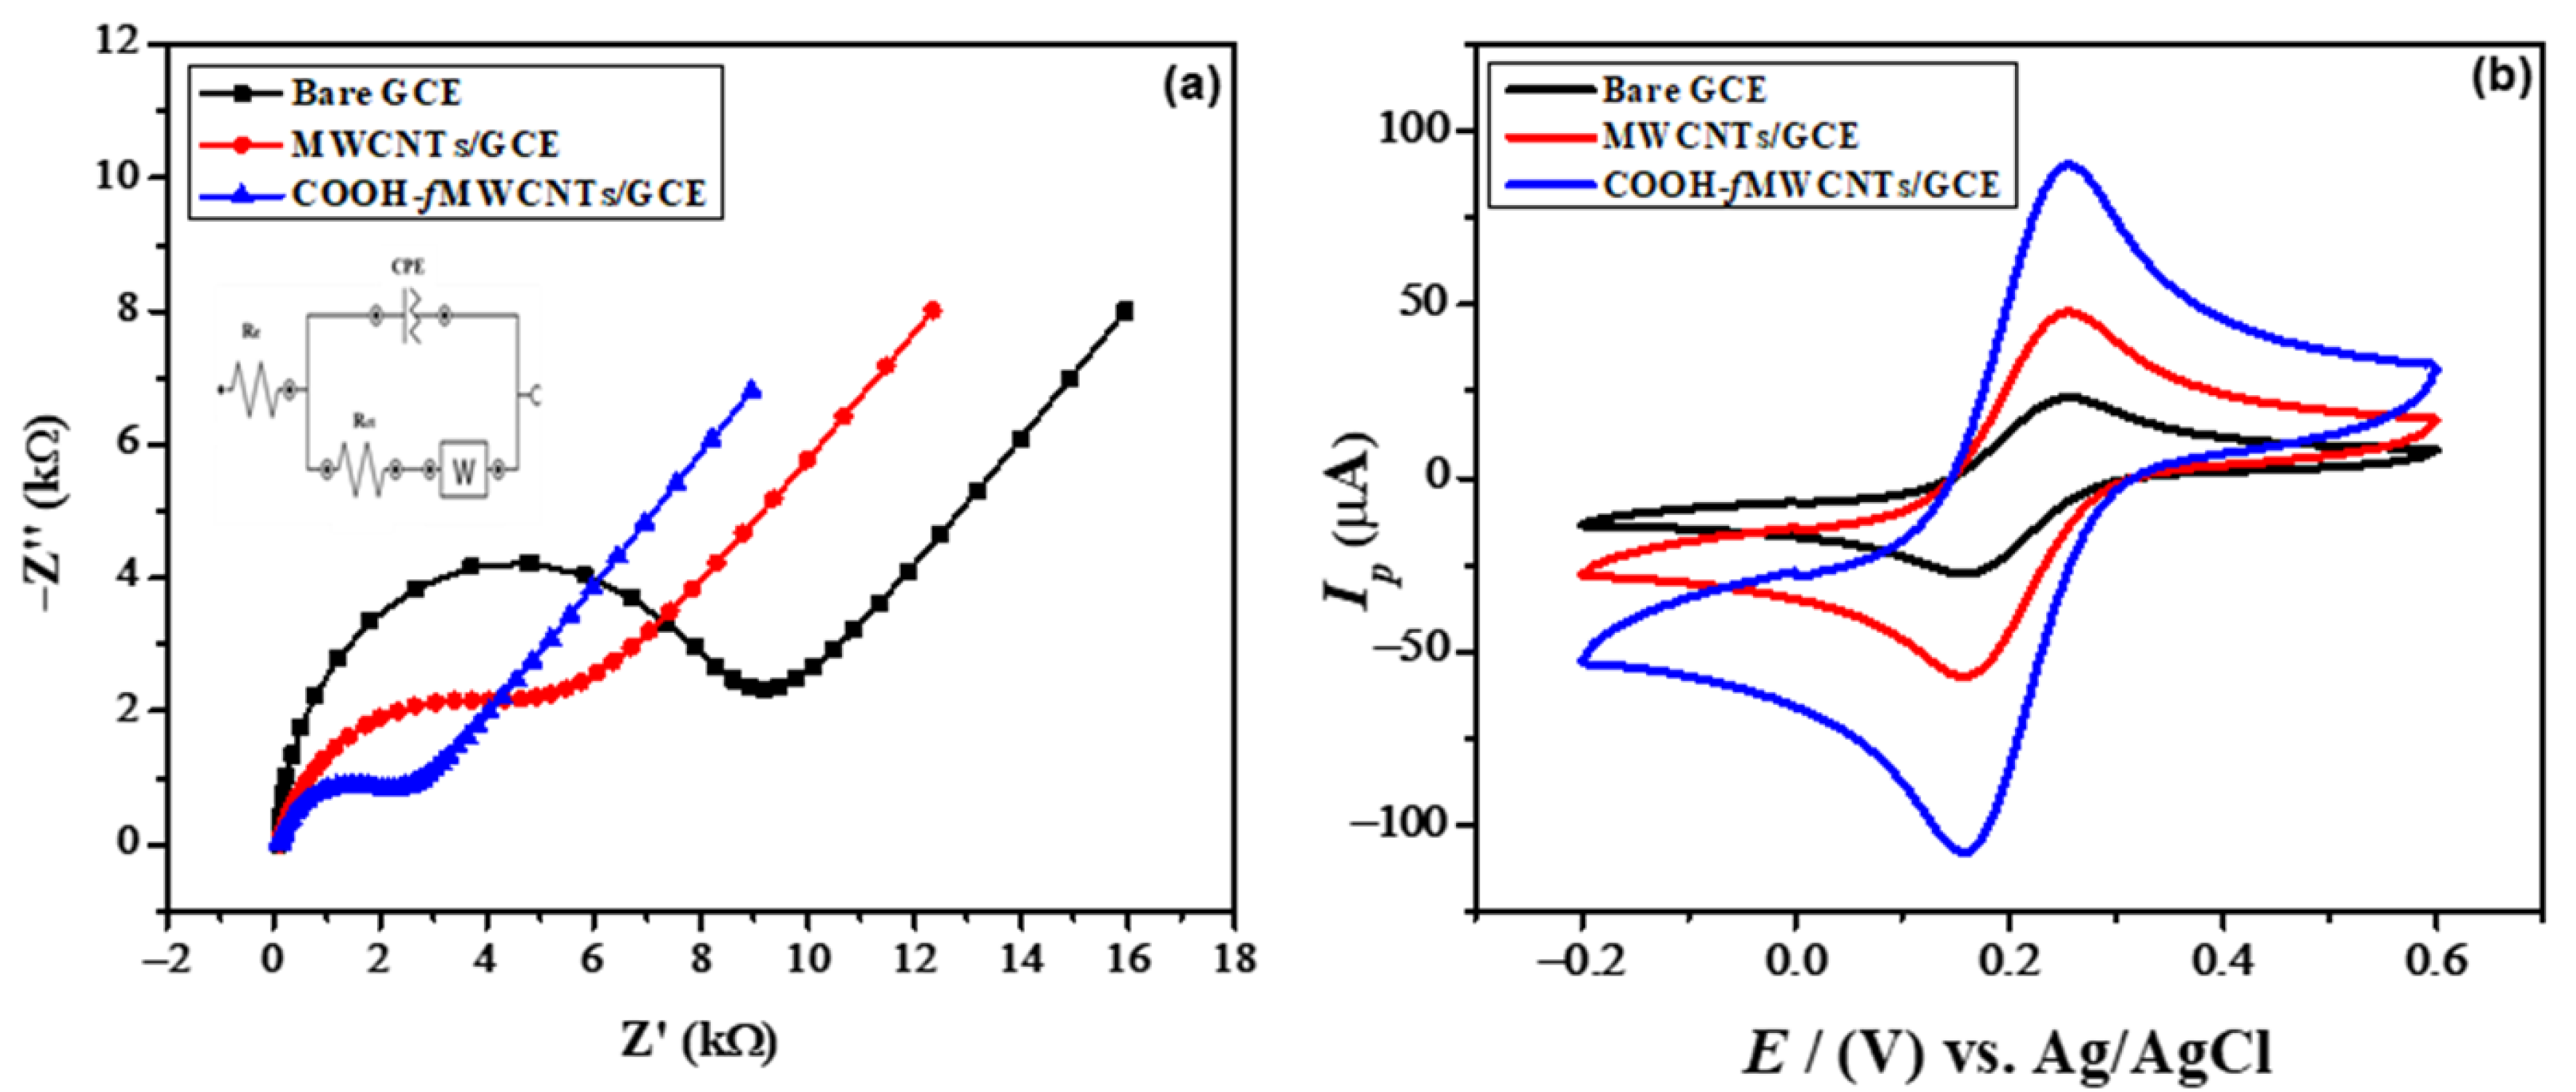
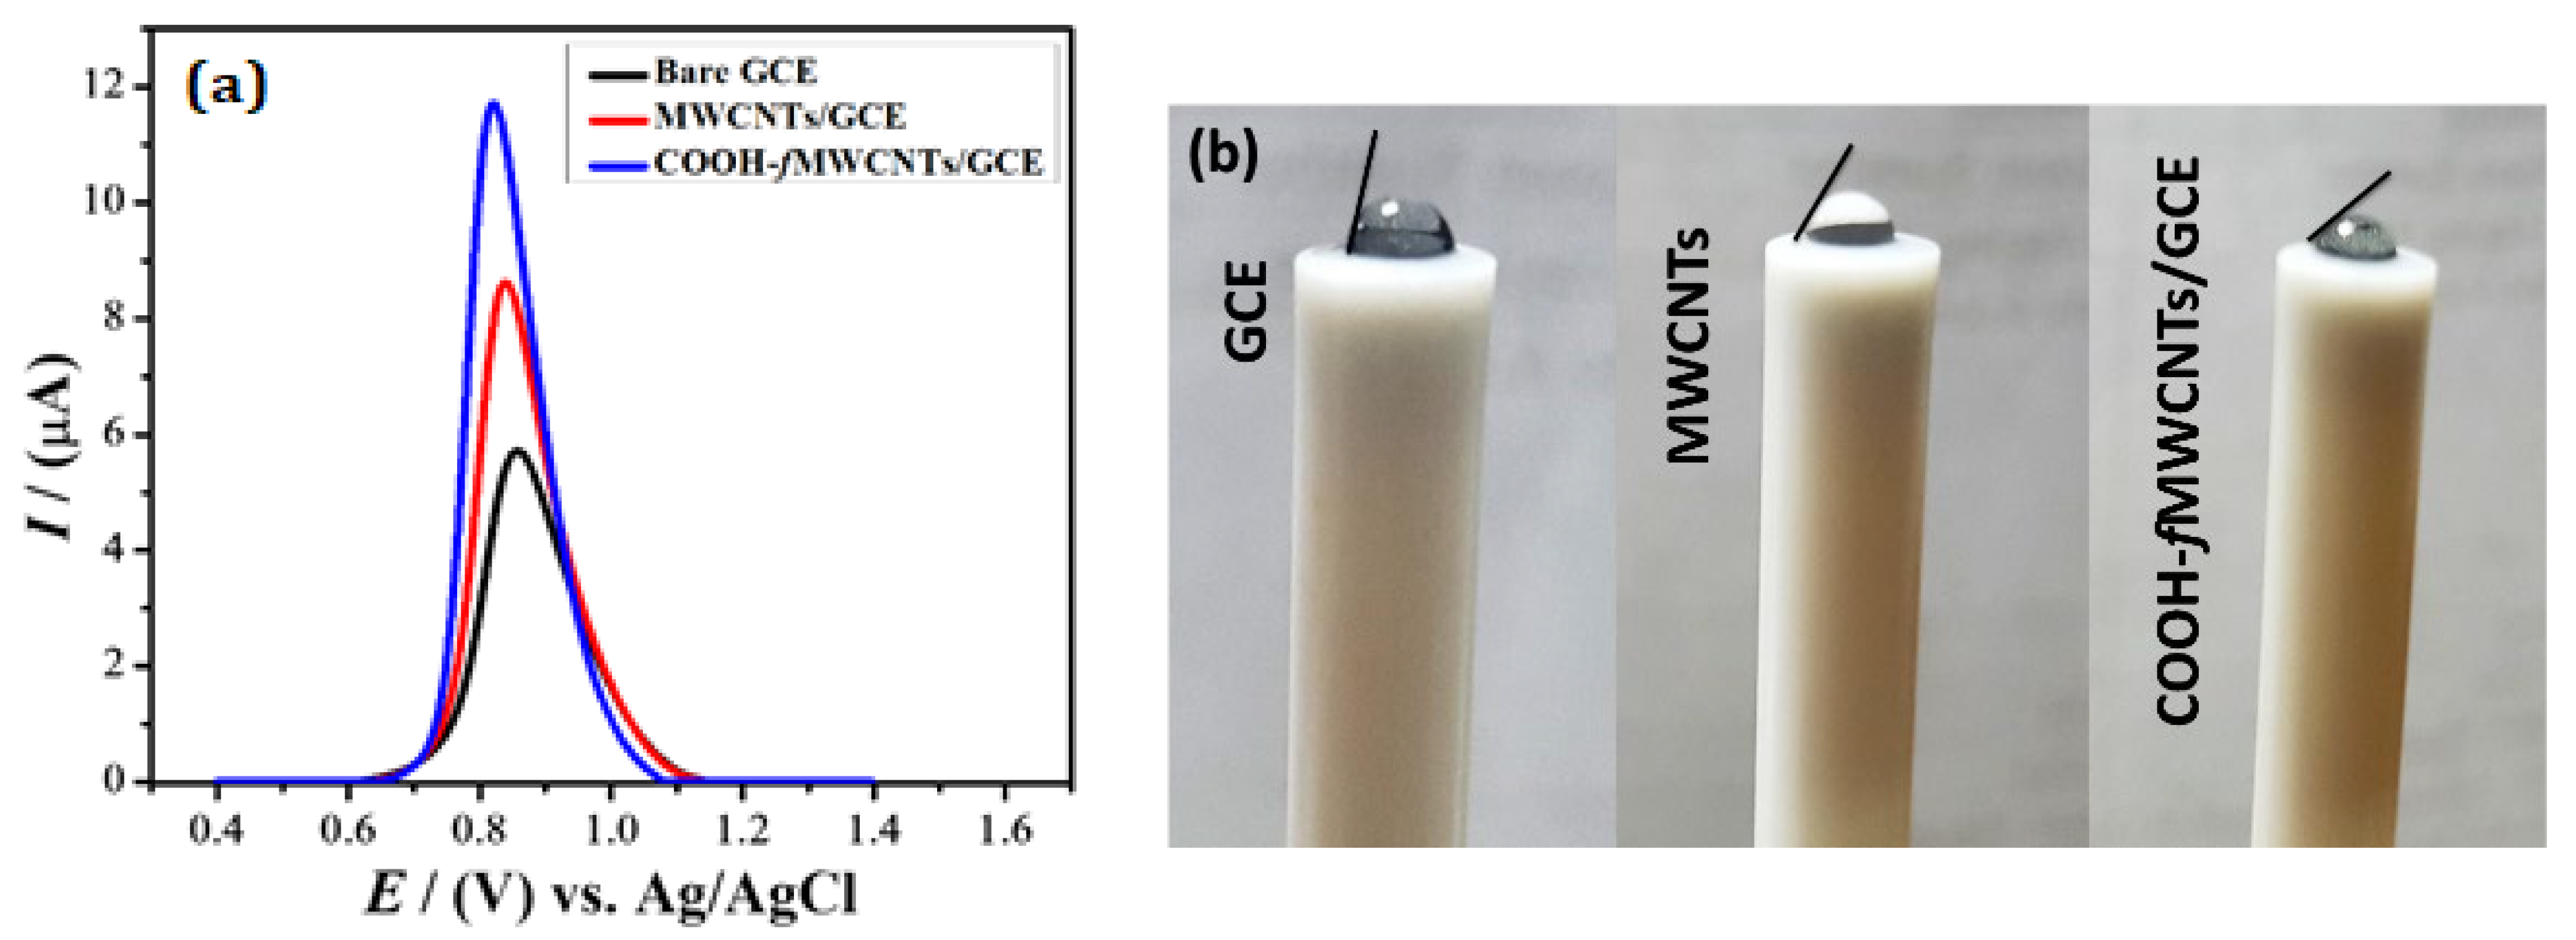
2.1. Electrochemical Characterization

EIS is a non-destructive and effective technique that was employed to reveal the interfacial properties and extent to which the electrode’s surface was modified by using Nyquist plot. EIS was performed in an electrochemical cell consisting of 5 mM potassium ferricyanide (K3[Fe(CN)6]) and 0.1 M potassium chloride (KCl) solution as a supporting electrolyte. Nyquist plots of bare and modified GCEs are depicted in Figure 1a. The Nyquist plot consists of two parts, a semicircle part at higher frequencies that reveals the charge transfer resistance (Rct). At the same time, the diffusional limited process is characterized in the second linear part of the Nyquist plots at lower frequencies [22]. Rct can be calculated via the diameter of a semicircle in Nyquist plots at higher frequencies [23,24]. The decrease in Rct causes enhanced electrical properties which are lower for COOH-fMWCNTs/GCE in comparison to MWCNT/GCE and bare GCE. This is attributed to increased surface area that affords more binding sites for the analyte at the modified electrode and hence improved conductivity. Furthermore, the heterogeneous rate constant k was calculated (Table S1) by using equation (k = RT/(nF)2C0ARct) for bare, MWCNTs, and COOH-fMWCNTs modified GCE [25,26,27].
As shown in Table S1, low charge transfer resistance values and higher values of heterogeneous rate constant indicate excellent conductivity and superior electrochemical kinetics for COOH-fMWCNTs modified GCE compared to others in solution of K3[Fe(CN)6] and KCl [28,29]. The EIS parameters in Table S1 were obtained from Randles equivalent circuit.
CV was used to investigate the working proficiency of the designed sensing platform by comparing the peak current responses of bare and modified GCE in 5 mM K3[Fe(CN)6 and 0.1 M KCl. The electroactive surface area of the electrode strongly affects the peak current response [30]. This was determined using the Randles-Sevcik equation ( I p = 2.69 × 10 5 n 3 / 2 A D 1 / 2 ν 1 / 2 C ) where D represents diffusion coefficient, C the concentration of analyte and the rest of the symbols stand for their usual notation [31]. Figure 1b illustrates the current responses of bare, MWCNTs, and COOH-fMWCNTs modified GCEs.
Considering D = 7.6 × 10⁻⁶ cm2s−1, n = 1, and C = 5 mM for K3[Fe(CN)6], the calculated electroactive surface area of the bare, MWCNTs modified and COOH-fMWCNTs modified GCE is enlisted in Table S2 and demonstrate that the sensing platform based on COOH-fMWCNTs has the greatest electroactive surface area (0.08 cm2) compared to the bare GCE and MWCNTs/GCE. Owing to its greater surface area, the COOH-fMWCNTs-based sensing platform exhibits enhanced peak current response as seen in Figure 1b. The COOH-fMWCNTs sensing platform owing to its increased surface area has several active sites available for binding with the analyte, thus facilitating the electron transfer process and corroborating the results of EIS in Figure 1a. These results show good agreement with EIS results, which indicate the successful modification of GCE for obtaining a selective and sensitive electrochemical platform for detecting NBS in water.
Additionally the “double layer capacitor” on real cells often behaves like a CPE (ref to Figure 1a inset), and not as an ideal capacitor due to surface inhomogenities of the interface between the modified electrode and electrolyte. These inhomogenities may include surface roughness, “leaky” capacitor, non-uniform current distribution, etc. that account for the non-ideal behaviour of the double layer. The impedance of the CPE is given as
1 Z C P E = Q ( i ω ) n
where Q is a prefactor for CPE with units of capacitance, i is an imaginary number and n represents the exponent of CPE ranging in value from 0–1 and is used to indicate the surface roughness of the electrolyte-electrode interface [32]. When n = 0 the CPE represents resistance and when n = 1 the behaviour is that of an ideal capacitor.
Furthermore, if the value of n is 1 or close to 1, it means the interface surface is homogenous and smooth [33]. As the value of n decreases, the surface inhomogeneity increases that pertains to increased roughness of the surface. As seen in Table S1, the value of n is decreasing as the surface of GCE is modified with MWCNT and COOH-fMWCNTs due to increase in surface roughness. Thus, creation of more active sites leads to increased preconcentration of the analyte. This corroborates well with results of NBS (see Figure 2a) showing enhanced signals on GCE modified with COOH-fMWCNTs due to more active sites and consequent increase in electroactive surface area as presented in Table S2.

2.2. Square Wave Voltammetric Analysis of NBS

Compared to CV, SWV is much more sensitive and can remarkably differentiate between the faradaic and non-Faradaic current [34]. It is a reliable electroanalytical technique that produces results with enhanced resolution. Therefore, in the present work, SWV was employed for the electrochemical sensing of NBS. The intensity of peak current response of NBS at bare and modified GCE was investigated in PBS of pH 6.0 at a scan rate of 100 mV s−1 keeping frequency and pulse amplitude 20 Hz and 20 mV, respectively. The oxidation peak of NBS was obtained at 0.86 and 0.84 V at bare and MWCNTs modified GCE respectively. After modification with COOH-fMWCNTs, it was shifted to a lower potential of 0.82 V. This negative shift in the potential shows the electrocatalytic behavior of the sensing platform. The peak current of NBS was also enhanced to 8.63 µA and 11.7 µA at MWCNTs and COOH-fMWCNTs respectively, as presented in Figure 2a [35,36]. The current value for COOH-fMWCNTs/GCE is almost twice that of the bare which supports our proposition of availability of more active sites for interaction of analyte. The surface features of the electrodes were distinguished from contact angle analysis as shown in Figure 2b. The contact angle (angle measured in liquid) of the water droplet on bare GCE with a value of 80° shows a slight hydrophilic character of the GCE surface. The hydrophilicity of GCE was increased when modified with MWCNTs as demonstrated by the 60° contact angle of the water droplet. Modification of the GCE surface with COOH-fMWCNTs led to additional enhancement in hydrophilicity as witnessed by further reduction in contact angle (45°) of water droplet. Hence, analyte in the droplet of aqueous solution placed at the GCE surface modified with COOH-fMWCNTs should have closer accessibility to the electrode due to more hydrophilic nature of the surface. This behaviour is consistent with the most intense oxidation signal of the NBS at COOH-fMWCNTs/GCE as obvious from observation of Figure 2a which is a direct consequence of maximum surface coverage.
This enhancement in peak current in SWV response is in good agreement with EIS and CV findings, and this is because of the increase in the electrode’s electroactive surface area by using COOH-fMWCNTs, as a modifier. Here, the modifier acts as a bridge between the analyte and the transducer (GCE) to facilitate electron transfer. Thus, the NBS transfers electrons through COOH-fMWCNTs to GCE for boosting the oxidation current via the electron hopping mechanism. Moreover, the boosted surface area results in enhanced interaction between the dye molecules and modifier that leads to increased preconcentration of dye molecules near the electrode surface. The preconcentration of the dye molecule at the modified electrode surface may also be the reason for peak current enhancement [35,37].

2.3. Effect of Various Scan Rates

The nature of the reaction, whether diffusion-controlled or surface-controlled, was investigated by obtaining cyclic voltammograms of NBS at different scan rates ranging from 25 mV s−1 to 150 mV s−1 on the modified electrode. Figure S1 illustrates that with the increase in scan rate, anodic peak potential shifted towards a higher potential [38]. According to reported work [39], if the slope of the plot between the log Ip vs. log v is equal to 0.5, then the electrochemical process is suggested to be diffusion controlled. In contrast, if the slope is equal to 1, then the process should be adsorption controlled. In the plot depicted in Figure S2, the slope was found to be 0.764, which suggested the involvement of both diffusion as well as adsorption control processes [40]. The R2 value of the plot of Ip vs. v is higher (Figure S3) than the R2 value of the plot between Ip vs. v1/2 (Figure S4), depicting that the adsorption process is more dominant as compared to the diffusion-controlled process [38].

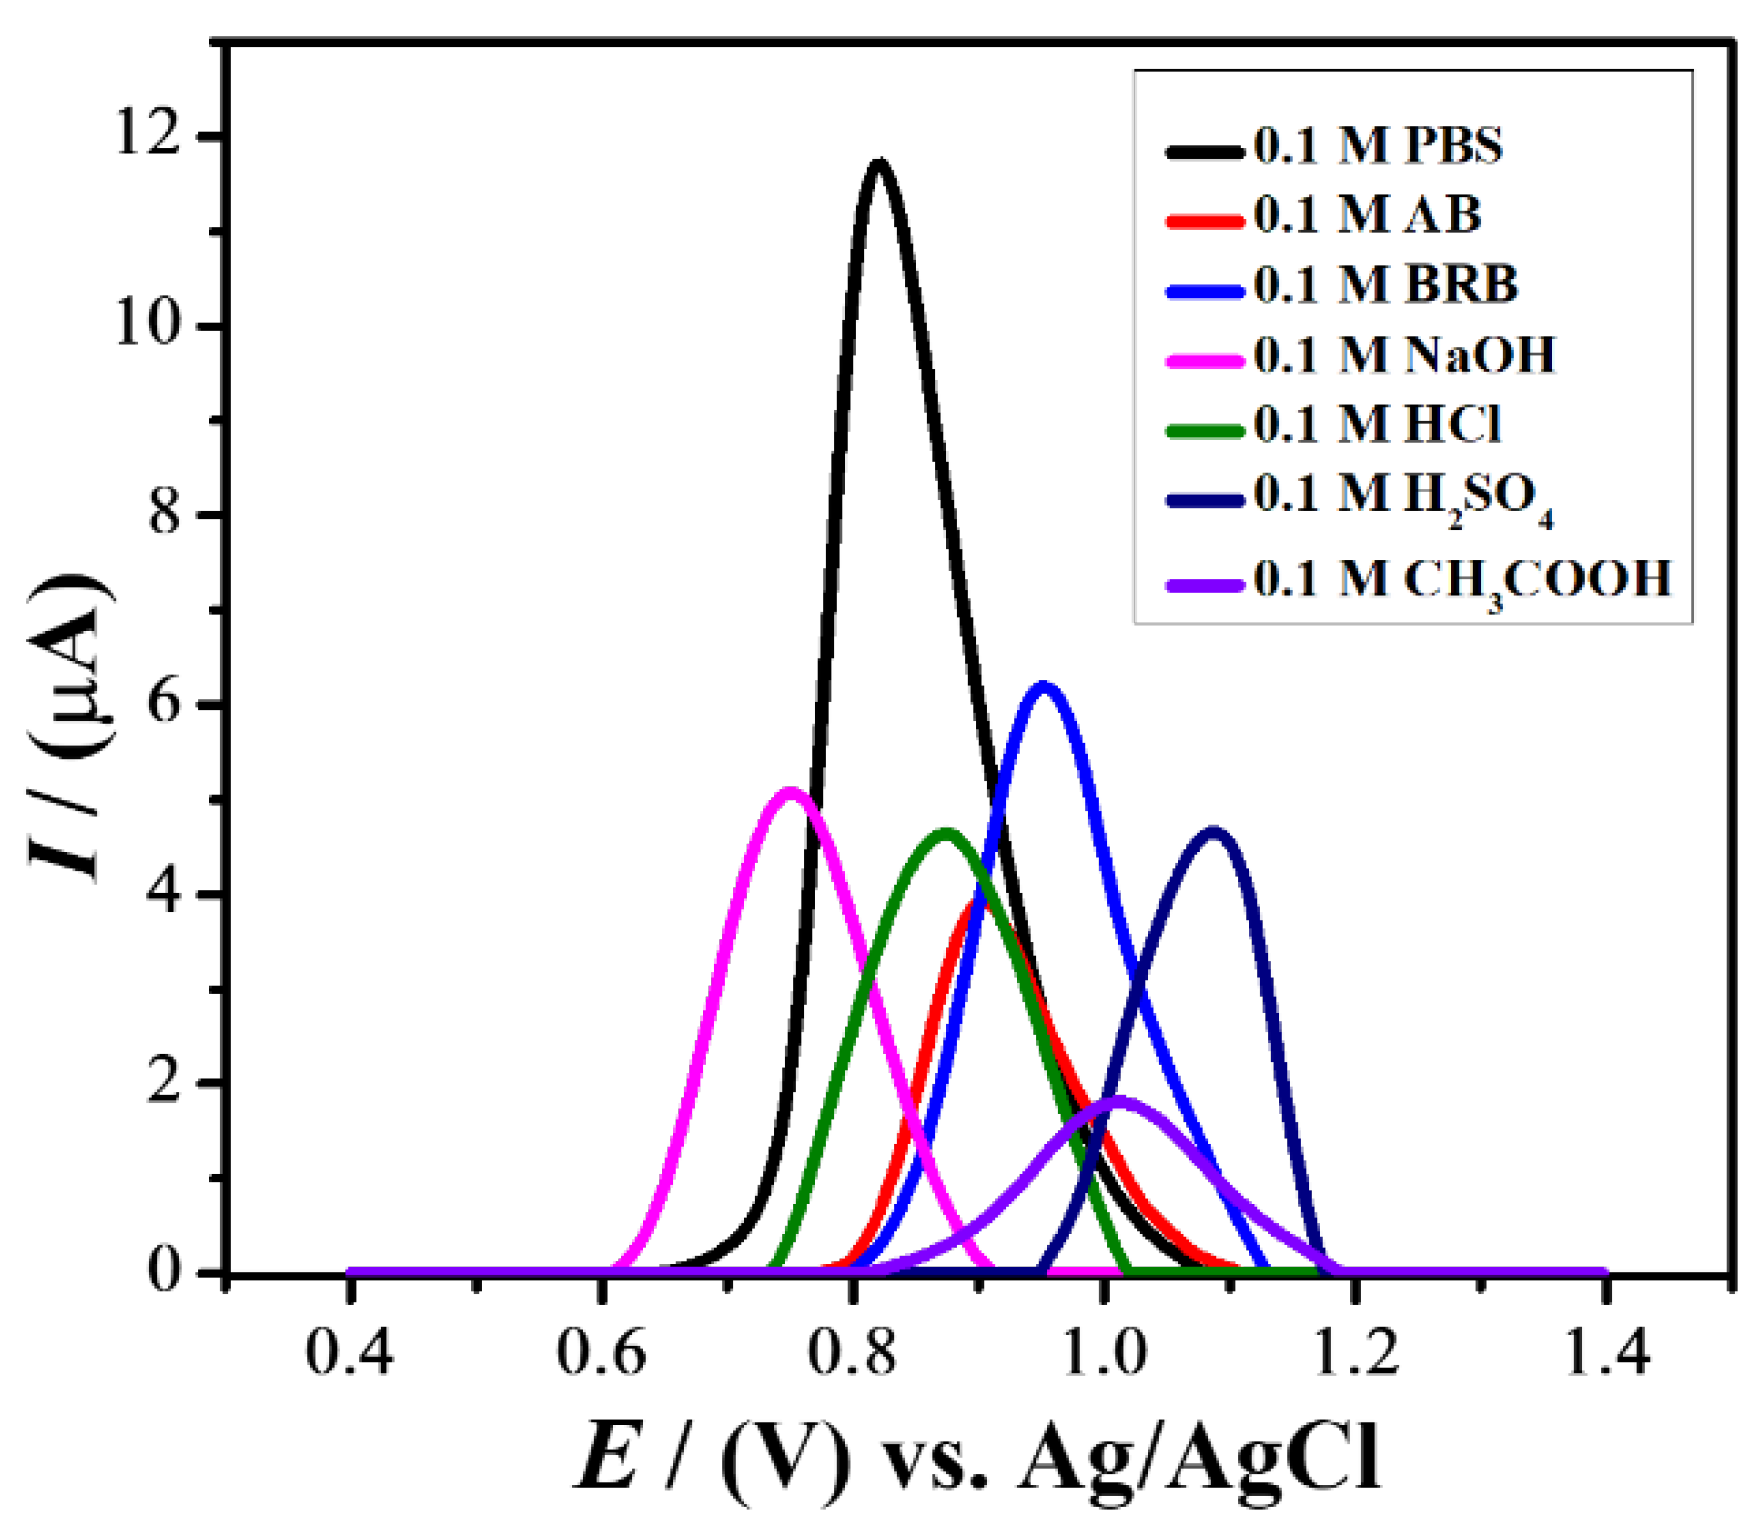
2.4. Optimization of Experimental Parameters

To achieve further enhanced signals of NBS at the COOH-fMWCNTs/GCE, several parameters such as supporting electrolyte, pH, deposition potential, and deposition time were optimized by employing the SWV technique.
The choice of supporting electrolyte is one of the crucial steps in electrochemical analysis because it controls the decrease in the Ohmic drop or IR drop effect [30]. The supporting electrolyte strongly affects the peak shape, current, and its position. Hence, to obtain enhanced anodic peak current response, the SWV of the targeted analyte using COOH-fMWCNTs modified GCE was performed in a variety of electrolytes such as PBS, acetate buffer, Britton Robinson Buffer, NaOH, KOH, HCl, H2SO4, and CH3COOH. A well-defined peak shape with a maximum peak current was observed in PBS compared to other supporting electrolytes depicted in Figure 3 and Figure S5. Therefore, PBS was selected as an appropriate electrolyte and was used for further electrochemical investigations [41].
The pH of the electrolytic solution also affects the peak current, peak shape, and peak potential as the response of many functional moieties is pH-dependent. Several voltammograms were recorded at different pH ranges from 3 to 10 to obtain a well-defined peak with the maximum anodic peak current response of the targeted analyte. It was found as depicted in Figure 4a that PBS of pH 6.0 showed maximum peak current response. Therefore, 0.1 M PBS of pH 6.0 was utilized for further studies.
As the pH of 0.1 M PBS supporting electrolyte varied from 3 to 10, peak potential shifted toward less potential. This shift in the peak potential by varying pH showed the involvement of protons during the electron transfer reaction of the targeted analyte which can be calculated by the using equation (ΔEppH = 2.303 mRT/nF). Considering the calibration plot depicted in Figure 4b, the value of the slope for the NBS was calculated to be 55 mV/pH, which is in close agreement with the Nernstian theoretical value (58 mV/pH), indicating the involvement of an equal number of protons and electrons in the redox process.
To investigate the impact of accumulation potential on peak current, it was varied ranging from −0.4 V to 0.2 V. Figure S6 illustrated that the anodic peak current intensity increased with the increment in the deposition potential up to −0.2 V. As the deposition potential increases, the number of active sites on the modified GCE increases, which results in maximum interactions between modifier and analyte moieties. Figure S7 revealed that at −0.2 V deposition potential, maximum peak current was recorded, while the peak current decreased with a further increase in deposition potential because of active site saturation at the GCE. Thus, −0.2 V deposition potential was opted as the optimized potential for further electrochemical investigations.
Various voltammetric responses of the designed sensing platform were recorded at different accumulation times ranging from 5 s to 35 s at a deposition potential of −0.2 V in PBS of pH 6.0 as the supporting electrolyte to investigate the influence of accumulation time on anodic peak current intensity. The maximum oxidative peak current response was observed in 20 s, as illustrated in Figures S8 and S9. Dye molecules are bulky in size, and they need some time to orient properly to get oxidized at the surface of modified GCE, yet orientation at the surface COOH-fMWCNTs/GCE is optimum at 20 s by having close accessibility to the electrode when drop casted instead of being in solution. This is evidenced by a maximum peak current response. The saturation of dye molecules and hence interference to properly orient NBS at the surface of the electrode result in plummeting of peak current at higher deposition times.

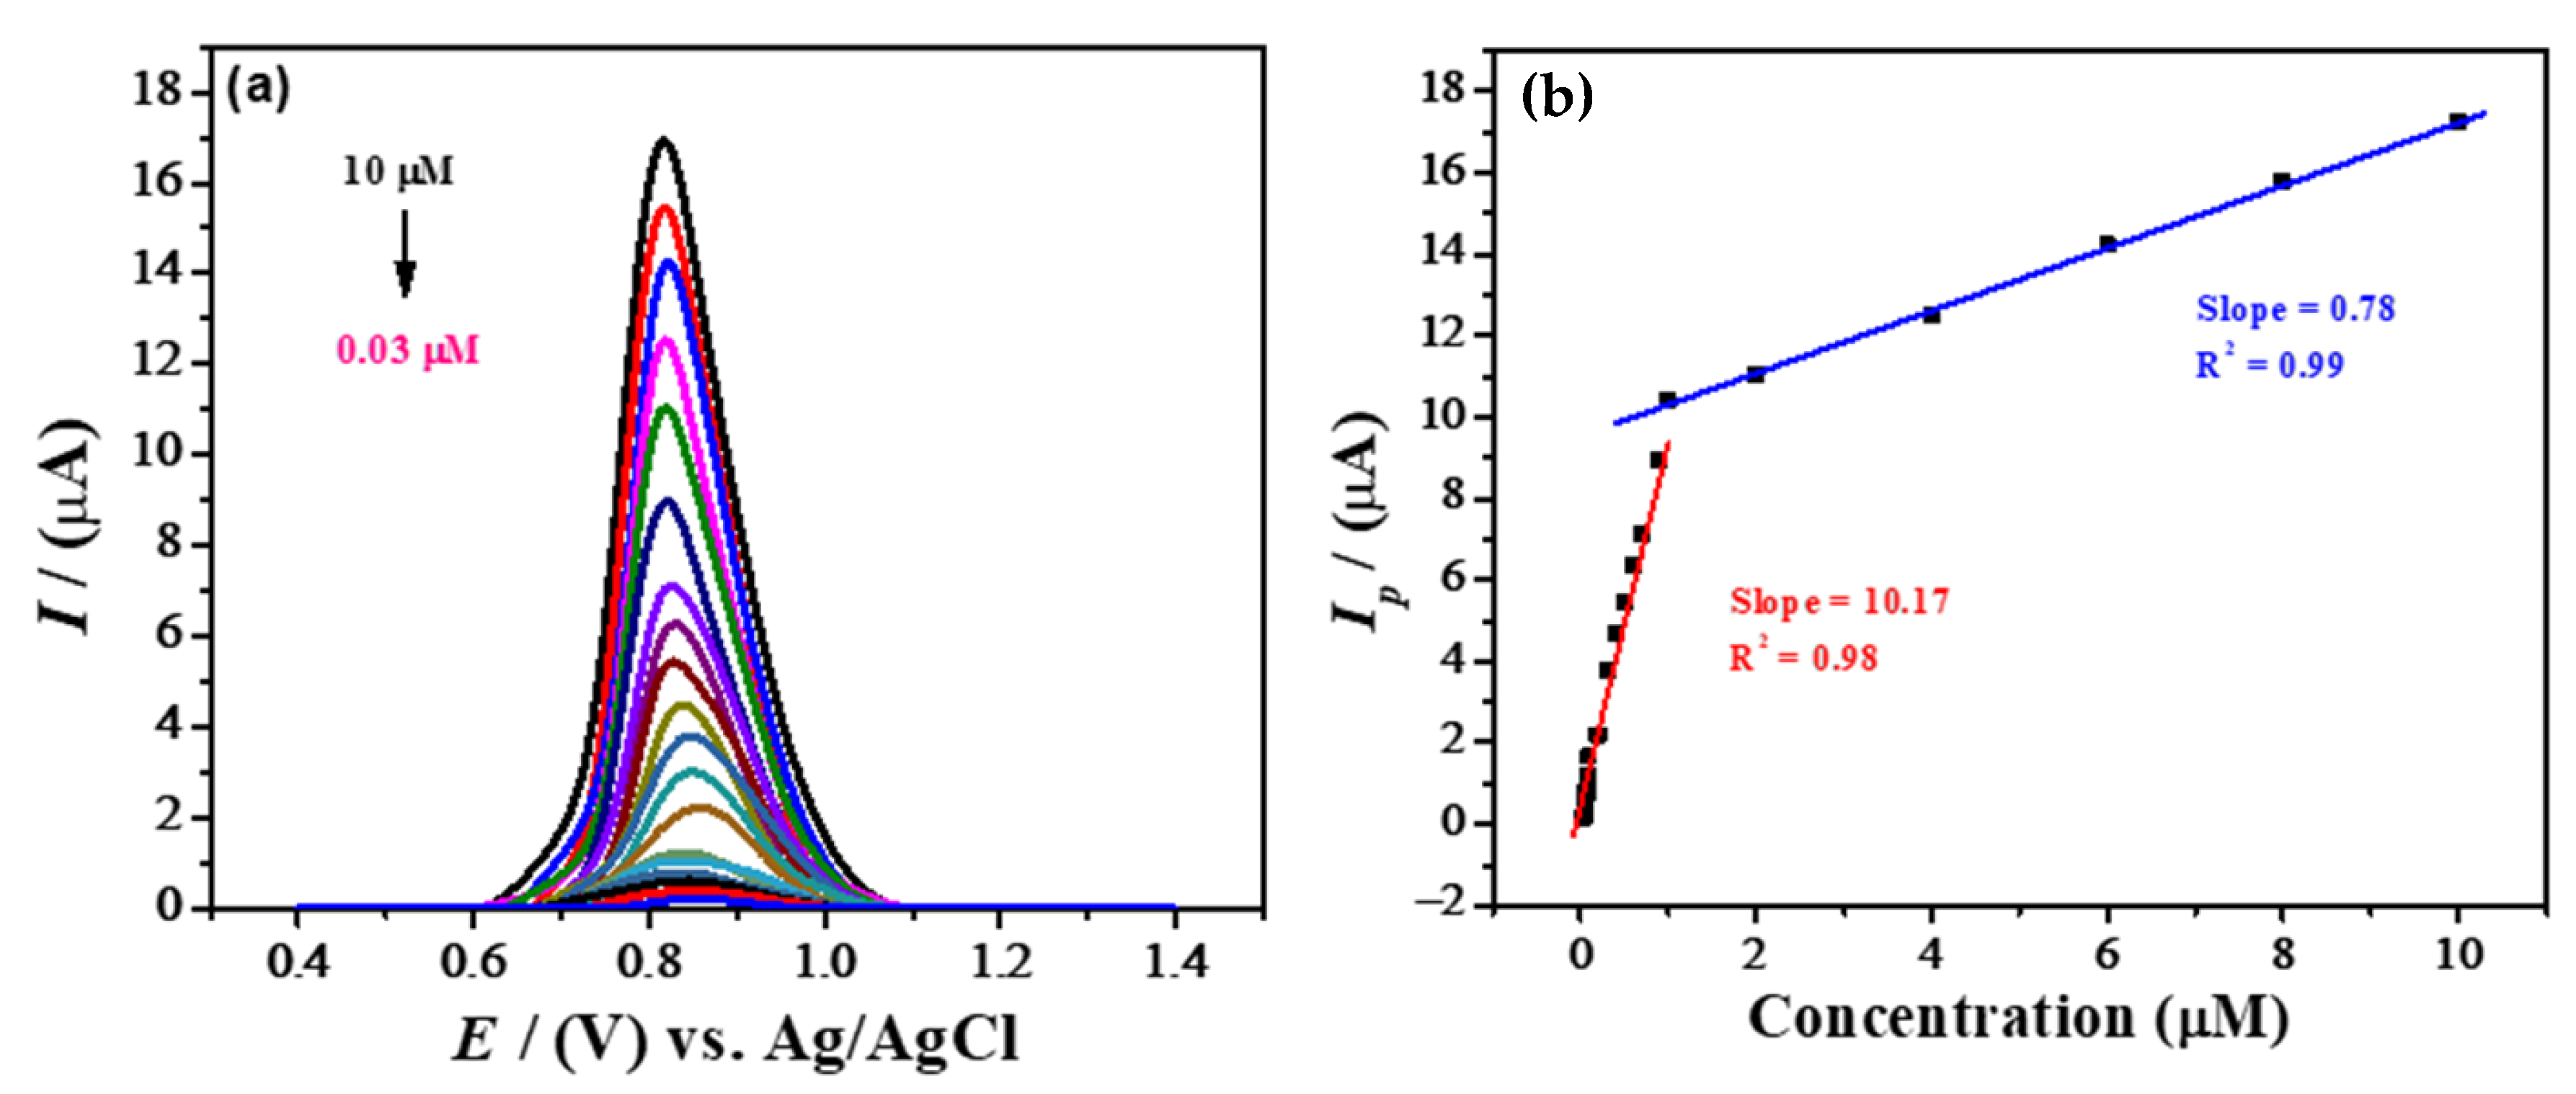
2.5. Analytical Characterization

SWV was used to calculate the detection and quantification limit for NBS dye using COOH-fMWCNTs modified GCE under optimized conditions, i.e., 0.1 M PBS supporting electrolyte of pH 6.0, 20 s deposition time, and −0.2 V deposition potential. In light of IUPAC guidelines, the LOD was investigated by incorporating the value of the standard deviation of the blank solution [42]. The results shown in Figure 5a, depict that peak current decreases linearly with a decrease in the analyte concentration. Figure 5b shows the corresponding linear calibration curves obtained as a result of variation in the analyte’s peak current vs. concentration of the analyte ranging from 0.03 µM to 10 µM. The plot is divided into two linear segments which suggest that two types of LODs can be determined. The first linear segment ranges from 10 µM to 1 µM which is towards the higher concentration end and the LOD for this concentration range was found to be 16.9 nM. The comparatively higher LOD is suggestive of the slow mobility of NBS towards the modified GCE and hence the corresponding peak current is lower with increased resistance to charge transfer. This may also indicate the presence of dimers and trimers at higher concentrations. The second linear segment ranges from the lowest concentration of 0.9 uM to 0.03 µM and the LOD was found to be 1.21 nM; this region marks very minute dye concentrations, wherein the dye completely solubilizes and is present in the form of its simplest unit i.e., monomers. Both LODs from two regions show detection in the nanomolar range, however, the lowest concentration range is the most preferred one for measuring LOD for its analytical performance. LOQ was also determined using the equation ( LOQ = 10 σ m ) and was found to be 4.06 nM. Here σ represents the standard deviation of the electrodes without any modifier at the GCE and m represents the slope of the graph.
A comparison of previously reported sensors for detecting NBS is given in Table 1. The lowest detection limit of COOH-fMWCNTs modified GCE revealed that this is a better sensing platform than previously reported analytical detection tools for NBS detection.

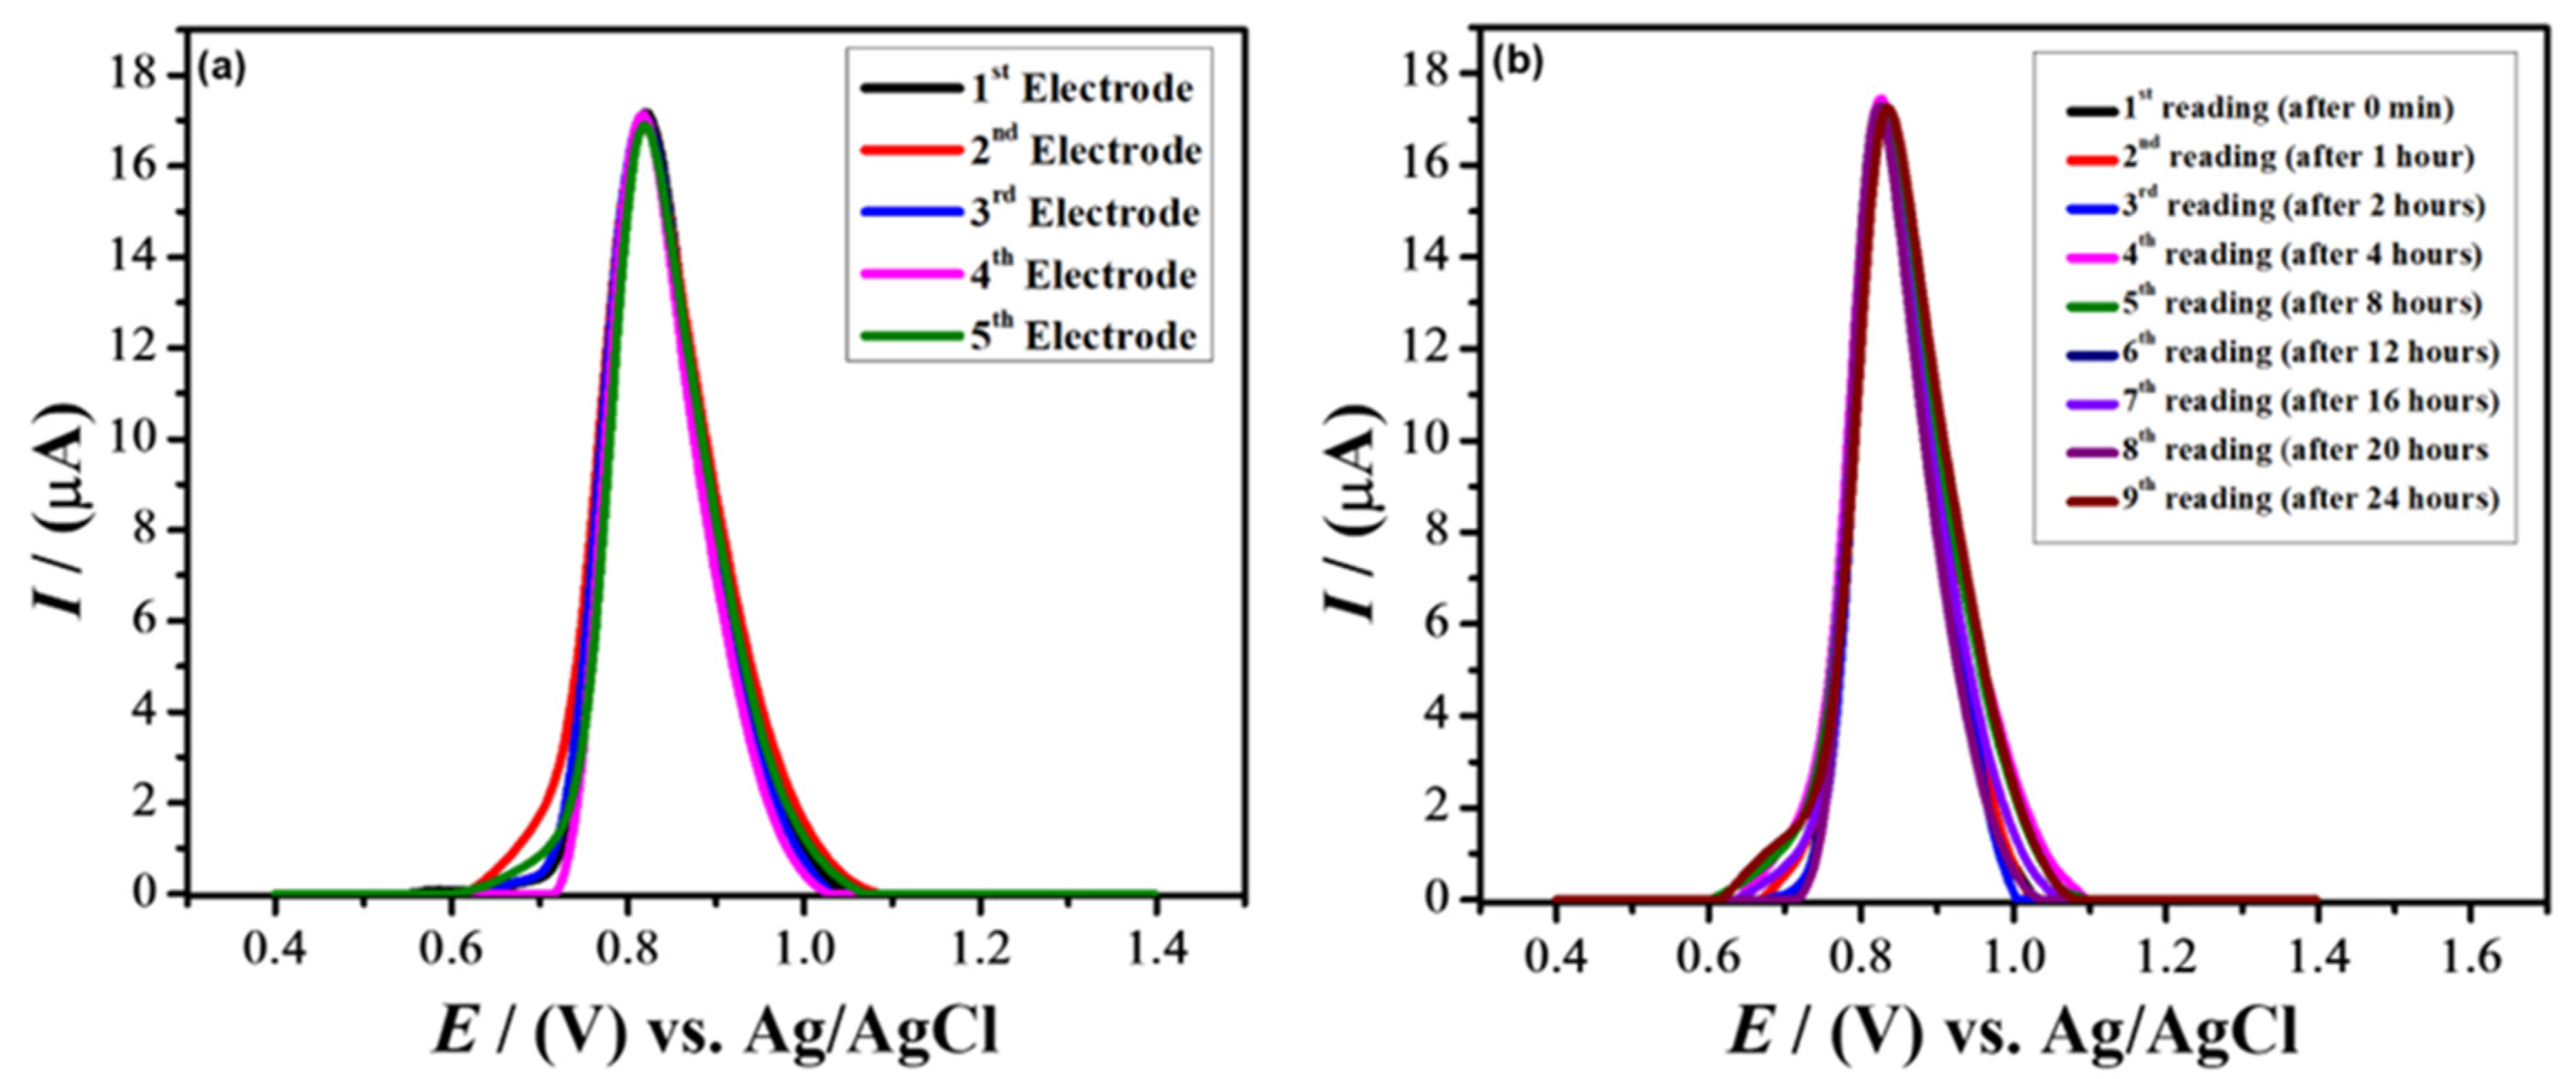
2.6. Validity of the Designed Sensor

SWV analysis was carried out to evaluate the reproducibility and repeatability of the designed sensor to investigate its validity for detection of NBS. To examine the reproducibility of the designed sensing platform, five different COOH-fMWCNTs modified GCE electrodes were prepared, and their voltammograms were recorded under pre-optimized conditions. The observations suggest that the designed electrochemical sensor had good reproducibility. No noticeable changes were observed in the anodic peak response with %age RSD less than 2% for the developed sensor for NBS, as illustrated in Figure 6a which show the robustness of the as obtained results.
To examine the designed electrochemical sensor’s repeatability, different peak current responses from the same modified electrode were recorded for up to 24 h at different time intervals. Figure 6b shows no considerable deviation in peak current at different time intervals as compared to the freshly prepared electrode. These results suggest that the designed sensor had intra-day stability. Due to the poor solubility of modifiers in water, the designed sensing platform not only showed stability but also prevented the leaching of modifiers from the electrode surface as indicated by the response of anodic peak currents. The intensity of the peak current remains almost the same which affirms the applicability of the proposed sensing matrix.

2.7. Study of Effects of Interferents for Validation of Designed Sensor

The influence of interferents on the voltammetric response of the designed electrochemical sensor was investigated to demonstrate the selectivity and sensitivity of the designed sensing platform. It is very likely that wastewater contains several other metal ions and toxic dyes along with NBS dye in real situations. A 0.1 mM solution of different dyes and metal ions was introduced separately as interferents in the solution of NBS to determine their influence on the analyte’s peak current response. These interferents include: Erichrome black T (EBT), Orange II dyes, and Ba3+, Co3+, Ni3+, Cu3+, Zn2+, Na1+, and K1+ metals ions. The results suggested that interferents had no considerable impact or had an insignificant effect on the anodic peak current response of the sensor. This is because of the strong binding affinity of the analyte with the modifier. The anodic peak response of the designed sensor in the presence of interfering agents is depicted in Figure 7a. Some other signals, along with the NBS signal, can also be seen, which indicate that this sensor can also be used to detect other dyes and this potential-based selectivity is the beauty of electrochemical sensors. The redox potentials of metallic ions investigated are different from the targeted analyte. However, interfering effects depend not only on the redox potential but also on the interaction of metallic ions with the recognition layer. The analyte’s signal was not disturbed by the metallic ions added as interfering agents. This indicates that the designed sensing platform possesses an anti-interfering ability for the tested ions. The bar graph in Figure 7b shows that the %age RSD value for the designed sensor was 1.77% which confirms the validity of the sensor. An RSD value of less than 3% is desirable for confirming the robustness of the proposed sensor.

2.8. Photocatalytic Degradation Studies by Designed Electrochemical Sensor

The designed sensing platform was employed to investigate the photocatalytic degradation of the NBS dye. A stock solution of 10 µM NBS was prepared and stirred for 30 min. 50 mL of 10 µM NBS solution was taken in a 100 mL beaker to which 0.1 mg of TiO2 as a photocatalyst, and 1 mL of H2O2 as an oxidizing agent were added. The solution was stirred for 5 min in the presence of sunlight and the aliquot was withdrawn after regular intervals which was investigated for degradation of NBS by sunlight in the presence of H2O2 by using two methods: electrochemical analysis by the as-prepared COOH-fMWCNTs/GCE sensor and UV-visible spectrophotometry. Thus, after withdrawing from the reaction mixture, the drop of 10 µM of NBS was cast on COOH-fMWCNTs modified GCE, and its voltammogram was recorded in PBS of pH = 6. This was repeated after an interval of 5 min followed every time by an electrochemical investigation of the remaining dye in the droplet. These recorded voltammograms, which were subjected to photocatalysis before, are depicted in Figure 8a. A decrease in peak current response in the voltammograms indicated that the concentration of dye molecules is decreasing over time suggesting its photocatalytic degradation. The peak current reaches the lowest value indicating that the maximum dye content has deteriorated. The effect of irradiation time on NBS dye photocatalytic degradation was investigated, and percentage degradation was found to be 95% after 100 min of keeping the dye solution under direct sunlight which is evident from Figure S10. The photocatalytic degradation kinetics of NBS was investigated by SWV and the obtained data was fitted in the first-order rate equation. The degradation rate constant with a value of 0.028 min−1 was obtained from the slope of the plot depicted in Figure 8b.

2.9. Spectroscopic Studies of NBS Photocatalytic Degradation

A UV-visible spectrophotometer was also used for studying the photocatalytic degradation of NBS. The TiO2 nanoparticles and H2O2 were used as photocatalysts and oxidizing agents respectively, as discussed previously in Section 2.8. The corresponding absorption spectra at different time intervals are depicted in Figure 9a. The dye molecule’s color is because of the conjugation system in the structure. Electron-hole pair generation occurred as the photocatalyst was exposed to sunlight. The generation of electron-hole pair and hydroxyl radical leads to dye degradation by breaking up the conjugation system in the dye molecule. It is evident from UV-visible spectra that over the time, the photocatalytic degradation process increased as the dye molecule was degraded in the presence of sunlight. The presence of H2O2 facilitates the production of hydroxyl radicals which leads to the mineralization of the organic molecule.
It is evident from Figure S11 that the dye content is photocatalytically degraded to 95%. Furthermore, recovery of TiO2 and its multiple usage performance were explored with the same concentration of dye i.e., 10 µM NBS solution. During the process the catalyst was removed by filtering it out from the dye solution and then replacing the supernatant with fresh solution of dye. This solution was then subjected to UV-Vis spectroscopy to investigate the effectiveness of the catalyst. Figures S11–S13 show recovery and reusability of TiO2 for the degradation of NBS for three cycles where a decrease in photocatalytic degradation efficiency from 95% (cycle-1: Figure S11) to 93% (cycle 2: Figure S12b) to 92% (cycle-3: Figure S13b) is evident. The slight change in %age degradation shows an insignificant change in the catalytic activity which shows good stability of the catalyst against the photocatalytic degradation of the dye. The slight decrease in the photocatalytic degradation efficiency can however be attributed to the decrease in pore size and pore volume due to adsorption and clogging of the pores by dye and its degraded products. The pore size is an important factor that contributes towards performance of the catalyst [46,47]. Thus, a small decrease in its catalytic activity points to reusability of the catalyst in applications where this factor becomes important.
The proposed degradation mechanism as depicted in Scheme 1 of NBS shows attack of hydroxyl free radicals generated by TiO2 and H2O2 at a double bond present in the ring, hence, with the breakdown of conjugation of the ring, the color variation from being intense to dull, was observed (Figure 10). Scheme 1 is the proposed mechanism, based upon the obtained electrochemical and UV-Vis spectroscopic data and also in the light of reported literature, of the degradation of NBS and other dyes using methods other than our developed method [36,48,49]. The final product is the mineralization of the NBS to CO2 and H2O.
Using spectroscopic results, the percent degradation of NBS was calculated using the following equation.
% ge   degradation = maximum   absorbance   ( t   = 0 )   absorbance   at   time maximum   absorbance   ( t = 0 ) × 100
The spectroscopic data were also used to explore the kinetics of the photocatalytic degradation process [50,51,52]. The reaction order and rate were confirmed from the plot between ln [Ct/C0] as a function of time, as shown inFigure 9b. The rate of reaction (k) was calculated from the equation i.e., ln C t C 0 = k t . Where Ct is the absorption at time t, C0 is the absorption at zero time, and k is the rate constant. The straight line of the plot between ln [Ct/C0] as a function of time exhibited that the reaction follows first-order kinetics. The rate of reaction calculated from spectroscopic data is 0.029 min−1. The order of reaction and rate of reaction calculated from electrochemical and spectroscopic data are in good agreement revealing that the designed sensor is also efficient for monitoring photocatalytic degradation of NBS.

3. Experimental

3.1. Reagents and Materials

All chemicals of analytical grade purity were used as received from Sigma Aldrich (St. Louis, MO, USA). NBS dye was used as an analyte while COOH-functionalized MWCNTs as an electrode modifier. TiO2 was utilized for the photocatalytic degradation of NBS. Dimethylformamide (DMF) was used as a solvent to prepare COOH-fMWCNTs suspension. Analytical grade reagents NaH2PO4·H2O and Na2HPO4·2H20 were used to prepare phosphate buffer saline (PBS) as a supporting electrolyte. Additionally, PBS, acetate buffer, Britton Robinson Buffer, NaOH, KOH, HCl, H2SO4, and CH3COOH were used as supporting electrolytes for the optimization of the modified electrode. Thus, all solutions of various electrolytes were prepared by using doubly distilled water with analytical grade reagents.

3.2. Instrumentation

The fabricated sensing platform was electrochemically characterized by executing CV, SWV, and EIS on a Metrohm Autolab (Utrecht, The Netherlands) equipped with NOVA 1.11 software. It comprises a three-cell assembly with GCE as the working electrode, Ag/AgCl (3 M KCl) as the reference electrode, and Pt as the counter electrode. Spectroscopic studies of NBS were carried out at Shimadzu UV-1700 spectrophotometer, Japan working in 200–800 nm range.

3.3. Working Electrode Modification

Before subjecting GCE to modification, it was physiochemically treated to achieve a high O/C ratio at its surface. A physically cleaned GCE surface was obtained by rubbing it in a fashion of digit 8 on a nylon buffing pad containing alumina slurry (1 µM). Then, the electrode was ultrasonicated in a 1:1 mixture of HNO3 and ethanol for five minutes, followed by rinsing with a jet of distilled water to remove the undesired moieties from the electrode’s surface [53]. The physically cleaned working electrode was then subjected to electrochemical cleaning by taking several CV scans of bare GCE in a supporting electrolyte [41,54,55]. GCE was modified by immobilizing a 5 µL drop of a modifier concentration at the pre-cleaned surface. After casting the modifier on the surface of the working electrode, it was left for drying followed by washing away any loosely bound molecules and then allowing it to dry. Finally, a 10 µL drop of the analyte (NBS) was applied to the modified electrode. This as-prepared electrode designated as COOH-fMWCNTs/GCE was further applied for electroanalytical measurements.

3.4. Experimental Procedure

0.1 mM stock solution of NBS dye was prepared using distilled water which was further diluted to prepare a solution of 10 µM concentration using the same solvent. The inks of electrode modifiers MWCNTs and COOH-fMWCNTs with a concentration of 1 mg/mL were prepared individually in DMF and subjected to ultrasonication for 1 h. Once the surface of GCE was dried after modification, a 10 µL drop of analyte was cast on the surface of the pre-modified working electrode. The modified electrode was then placed in the electrochemical cell containing the supporting electrolyte, and the sensing ability of the designed sensing platform was analyzed by recording square wave voltammograms. Different experimental parameters were optimized using the same procedure. The surface behavior of the working electrode was investigated using EIS. Electrochemical techniques, such as SWV and CV facilitated different analysis of the sensing platform. The limit of detection (LOD) and limit of quantification (LOQ) were calculated using data obtained by SWV responses. SWV and UV-visible spectroscopy was employed for photocatalytic degradation studies of NBS dye. The solution of 10 µM of NBS was kept in direct sunlight for 100 min. After subjecting the solution of NBS to sunlight, 5 µL of the sample of the dye was withdrawn at regular intervals which was drop casted at the modified electrode for its electroanalysis in PBS under set optimized conditions. Here recorded voltammograms provided information about the degree of degradation indicated by a decrease in peak current value after the aliquot was taken after every 5 min. The same procedure of withdrawing the photocatalyzed sample was conducted for recording its UV-visible spectra. The voltammetric and spectroscopic responses facilitated the determination of the percentage degradation, reaction order, and reaction rate for NBS photocatalytic degradation. All experimental work was done at an ambient temperature of 298 K (25 °C ± 1).

4. Conclusions

The toxicity of dyes is a threat to life in water and on land. Thus, in order to address abatement of the dyes and overcome issues pertaining to environmental degradation, the current work presents the development of a sensor for the nanomolar detection of Nile Blue Sulphate (NBS) dye. Moreover, it presents employing photocatalyst for the photocatalytic degradation of NBS followed by analytical methods for monitoring the extent and degradation kinetics. Acid-functionalized MWCNTs were immobilized on the surface of the GCE to fabricate an efficient electrochemical sensing platform. Various experimental parameters such as accumulation potential, accumulation time, supporting electrolyte, and pH of solution were optimized to obtain intense signal of the target analyte at the designed probe. Peak current versus concentration plot was found to have a wide linear range with LOD value of 1.21 nM under optimized experimental conditions for NBS. After detection, photocatalytic degradation experiments for NBS were conducted using TiO2 nanoparticles in the presence of hydrogen peroxide. The designed sensing platform was then employed for monitoring the photocatalytic degradation of the dye supported with spectroscopic studies. The results obtained from both electrochemical and spectroscopic techniques revealed that the photocatalytic degradation follows pseudo-first-order kinetics. The obtained results suggest that the developed method is promising for the purification of dye contaminated wastewater.

Supplementary Materials

The following supporting information can be downloaded at: https://www.mdpi.com/article/10.3390/catal13010141/s1, Table S1. Parameters evaluated from EIS experiments conducted on various electrodes; Table S2. Electroactive surface areas of bare and modified electrodes; Figure S1. Influence of scan rate on the anodic peak current of the NBS in supporting electrolyte of PBS of pH 6.0; Figure S2. Calibration plot between the log peak current vs. log scan rate of NBS oxidation; Figure S3. A plot of Ip vs. v of NBS oxidation; Figure S4. A plot of Ip vs. v1/2 of NBS oxidation; Figure S5. Bar graph of the oxidation peak current of NBS vs. various supporting electrolytes; Figure S6. Effect of accumulation potential on the peak current of 10 µM NBS in PBS of pH 6.0 using COOH-fMWCNTs/GCE; Figure S7. A plot of Ip vs. deposition potential; Figure S8. Peak current response of 10 µM NBS at different deposition times; Figure S9. Plot between peak current vs. deposition time of NBS oxidation; Figure S10. Kinetic study of NBS photocatalytic degradation using SWV data; Figure S11. Percentage degradation of NBS using UV-visible Spectroscopic data; Figure S12. (a) UV-Vis spectra of the photodegradation of NBS at different time intervals after recovery of photocatalyst for the first time. (b) %age degradation of NBS at different time intervals after recovery of photocatalyst for the first time; Figure S13. (a) UV-Vis spectra of the photodegradation of NBS at different time intervals after recovery of photocatalyst for the second time. (b) %age degradation of NBS at different time intervals after recovery of photocatalyst for the second time.

Author Contributions

Conceptualization, A.S.; methodology, A.S.; software, J.N.; validation, M.N.S. and N.U.; formal analysis, F.J.I. and A.S.; investigation, M.N.S.; resources, J.N. and A.S.; writing—original draft preparation, M.N.S.; writing—review and editing, A.S.; supervision, A.S.; project administration, A.S. and J.N. All authors have read and agreed to the published version of the manuscript.

Funding

This research received no external funding.

Data Availability Statement

Data are contained within the article and in the provided Supplementary Materials.

Acknowledgments

We acknowledge the support of Quaid-i-Azam University, Islamabad, Pakistan and Higher Education Commission of Pakistan.

Conflicts of Interest

The Authors declare no Competing Financial or Non-Financial Interest.

References

  1. Tahir, M.B.; Nawaz, T.; Nabi, G.; Sagir, M.; Khan, M.I.; Malik, N. Role of nanophotocatalysts for the treatment of hazardous organic and inorganic pollutants in wastewater. Int. J. Environ. Anal. Chem. 2022, 102, 491–515. [Google Scholar] [CrossRef]
  2. Abd Elaty, I.; Kuriqi, A.; Shahawy, A.E. Environmental rethinking of wastewater drains to manage environmental pollution and alleviate water scarcity. Nat. Hazards 2022, 110, 2353–2380. [Google Scholar] [CrossRef]
  3. Basu, N.; Abass, K.; Dietz, R.; Kruemmel, E.; Rautio, A.; Weihe, P. The impact of mercury contamination on human health in the Arctic: A state of the science review. Sci. Total Environ. 2022, 831, 154793. [Google Scholar] [CrossRef]
  4. Naidu, R.; Biswas, B.; Willett, I.R.; Cribb, J.; Singh, B.K.; Nathanail, C.P.; Coulon, F.; Semple, K.T.; Jones, K.C.; Barclay, A. Chemical pollution: A growing peril and potential catastrophic risk to humanity. Environ. Int. 2021, 156, 106616. [Google Scholar] [CrossRef]
  5. Liu, X.; Yang, H.; Diao, Y.; He, Q.; Lu, C.; Singh, A.; Kumar, A.; Liu, J.; Lan, Q. Recent advances in the electrochemical applications of Ni-based metal organic frameworks (Ni-MOFs) and their derivatives. Chemosphere 2022, 307, 135729. [Google Scholar] [CrossRef]
  6. Zheng, M.; Chen, J.; Zhang, L.; Cheng, Y.; Lu, C.; Liu, Y.; Singh, A.; Trivedi, M.; Kumar, A.; Liu, J. Metal Organic Framework as an Efficient Adsorbent for Drugs from Wastewater. Mater. Today Commun. 2022, 31, 103514. [Google Scholar] [CrossRef]
  7. Khan, M.A.; Ghouri, A.M. Environmental pollution: Its effects on life and its remedies. Res. World J. Arts Sci. Commer. 2011, 2, 276–285. [Google Scholar]
  8. Pereira, J.C. Environmental issues and international relations, a new global (dis) order-the role of International Relations in promoting a concerted international system. Rev. Bras. Politica Int. 2015, 58, 191–209. [Google Scholar] [CrossRef] [Green Version]
  9. Khan, U.; Niaz, A.; Shah, A.; Zaman, M.I.; Zia, M.A.; Iftikhar, F.J.; Nisar, J.; Ahmed, M.N.; Akhter, M.S.; Shah, A.H. Thiamine-functionalized silver nanoparticles for the highly selective and sensitive colorimetric detection of Hg2+ ions. New J. Chem. 2018, 42, 528–534. [Google Scholar] [CrossRef]
  10. Sutar, S.; Patil, P.; Jadhav, J. Recent advances in biochar technology for textile dyes wastewater remediation: A review. Environ. Res. 2022, 209, 112841. [Google Scholar] [CrossRef]
  11. Malik, V.; Saya, L.; Gautam, D.; Sachdeva, S.; Dheer, N.; Arya, D.K.; Gambhir, G.; Hooda, S. Review on adsorptive removal of metal ions and dyes from wastewater using tamarind-based bio-composites. Polym. Bull. 2022, 79, 9267–9302. [Google Scholar] [CrossRef]
  12. Dutta, S.; Gupta, B.; Srivastava, S.K.; Gupta, A.K. Recent advances on the removal of dyes from wastewater using various adsorbents: A critical review. Mater. Adv. 2021, 2, 4497–4531. [Google Scholar] [CrossRef]
  13. Mani, S.; Bharagava, R.N. Exposure to crystal violet, its toxic, genotoxic and carcinogenic effects on environment and its degradation and detoxification for environmental safety. Rev. Environ. Contam. Toxicol. 2016, 237, 71–104. [Google Scholar]
  14. Vyavahare, G.; Sutar, S.; Gurav, R.; Patil, R.; Patil, D.; Jadhav, J. Application of biochar for the treatment of textile dyes and wastewaters. In Biochar and Its Application in Bioremediation; Springer: Berlin/Heidelberg, Germany, 2021; pp. 169–191. [Google Scholar]
  15. Karthikeyan, C.; Arunachalam, P.; Ramachandran, K.; Al-Mayouf, A.M.; Karuppuchamy, S. Recent advances in semiconductor metal oxides with enhanced methods for solar photocatalytic applications. J. Alloys Compd. 2020, 828, 154281. [Google Scholar] [CrossRef]
  16. Wu, Z.; Guo, K.; Cao, S.; Yao, W.; Piao, L. Synergetic catalysis enhancement between H2O2 and TiO2 with single-electron-trapped oxygen vacancy. Nano Res. 2020, 13, 551–556. [Google Scholar] [CrossRef]
  17. Castro, M.; Pereira, F.; Aller, A.; Littlejohn, D. Raman spectrometry as a screening tool for solvent-extracted azo dyes from polyester based textile fibers. Polym. Test. 2020, 91, 106765. [Google Scholar] [CrossRef]
  18. Metters, J.P.; Banks, C.E. Electrochemical utilisation of chemical vapour deposition grown carbon nanotubes as sensors. Vacuum 2012, 86, 507–519. [Google Scholar] [CrossRef]
  19. Norizan, M.N.; Moklis, M.H.; Demon, S.Z.N.; Halim, N.A.; Samsuri, A.; Mohamad, I.S.; Knight, V.F.; Abdullah, N. Carbon nanotubes: Functionalisation and their application in chemical sensors. RSC Adv. 2020, 10, 43704–43732. [Google Scholar] [CrossRef]
  20. Yaghoubi, A.; Ramazani, A. Synthesis of amino-functionalized carbon nanotubes and their applications. Curr. Org. Chem. 2018, 22, 1505–1522. [Google Scholar] [CrossRef]
  21. Zhu, G.; Hu, N.; Guo, M.; Liu, Y.; Ran, Q.; Zhao, H. A simple and efficient electrochemical sensor for determination of gallic acid based on multi-walled carbon nanotubes with carboxyl functionalization. Mater. Res. Innov. 2022, 26, 389–396. [Google Scholar] [CrossRef]
  22. Kaur, B.; Srivastava, R.; Satpati, B. Silver nanoparticle decorated polyaniline–zeolite nanocomposite material based non-enzymatic electrochemical sensor for nanomolar detection of lindane. RSC Adv. 2015, 5, 57657–57665. [Google Scholar] [CrossRef]
  23. Gowda, J.I.; Nandibewoor, S.T. Electrochemical behavior of paclitaxel and its determination at glassy carbon electrode. Asian J. Pharm. Sci. 2014, 9, 42–49. [Google Scholar] [CrossRef]
  24. Kurbanoglu, S.; Ozkan, S.A.; Merkoci, A. Nanomaterials-based enzyme electrochemical biosensors operating through inhibition for biosensing applications. Biosens. Bioelectron. 2017, 89, 886–898. [Google Scholar] [CrossRef]
  25. Nandini, S.; Nalini, S.; Sanetuntikul, J.; Shanmugam, S.; Niranjana, P.; Melo, J.S.; Suresh, G.S. Development of a simple bioelectrode for the electrochemical detection of hydrogen peroxide using Pichia pastoris catalase immobilized on gold nanoparticle nanotubes and polythiophene hybrid. Analyst 2014, 139, 5800–5812. [Google Scholar] [CrossRef] [Green Version]
  26. Rastogi, P.K.; Ganesan, V.; Krishnamoorthi, S. Palladium nanoparticles incorporated polymer-silica nanocomposite based electrochemical sensing platform for nitrobenzene detection. Electrochim. Acta 2014, 147, 442–450. [Google Scholar] [CrossRef]
  27. Gupta, R.; Rastogi, P.K.; Ganesan, V.; Yadav, D.K.; Sonkar, P.K. Gold nanoparticles decorated mesoporous silica microspheres: A proficient electrochemical sensing scaffold for hydrazine and nitrobenzene. Sens. Actuators B Chem. 2017, 239, 970–978. [Google Scholar] [CrossRef]
  28. Kokab, T.; Shah, A.; Iftikhar, F.J.; Nisar, J.; Akhter, M.S.; Khan, S.B. Amino acid-fabricated glassy carbon electrode for efficient simultaneous sensing of zinc (II), cadmium (II), copper (II), and mercury (II) ions. ACS Omega 2019, 4, 22057–22068. [Google Scholar] [CrossRef] [Green Version]
  29. Shah, A.; Akhtar, M.; Aftab, S.; Shah, A.H.; Kraatz, H.S. Gold copper alloy nanoparticles (Au-Cu NPs) modified electrode as an enhanced electrochemical sensing platform for the detection of persistent toxic organic pollutants. Electrochim. Acta 2017, 241, 281–290. [Google Scholar] [CrossRef]
  30. Kokab, T.; Manzoor, A.; Aftab, S.; Aslam, F.; Iftikhar, F.J.; Siddiqi, H.M.; Shah, A. A reliable sensing platform based on tribenzamide for sensitive and selective detection of Pb (II) ions. Inorg. Chem. Commun. 2022, 138, 109261. [Google Scholar] [CrossRef]
  31. Shah, A.; Ullah, A.; Rauf, A.; Rehman, Z.U.; Shujah, S.; Shah, S.M.; Waseem, A. Detailed electrochemical probing of a biologically active isoquinoline. J. Electrochem. Soc. 2013, 160, 597. [Google Scholar] [CrossRef]
  32. Abouzari, M.S.; Berkemeier, F.; Schmitz, G.; Wilmer, D. On the physical interpretation of constant phase elements. Solid State Ionics 2009, 180, 922–927. [Google Scholar] [CrossRef]
  33. Haque, J.; Verma, C.; Srivastava, V.; Quraishi, M.; Ebenso, E.E. Experimental and quantum chemical studies of functionalized tetrahydropyridines as corrosion inhibitors for mild steel in 1 M hydrochloric acid. Results Phys. 2018, 9, 1481–1493. [Google Scholar] [CrossRef]
  34. Kassa, A.; Amare, M. Poly (4-amino-3-hydroxynaphthalene-1-sulfonic acid) modified glassy carbon electrode for square wave voltammetric determination of amoxicillin in four tablet brands. BMC Chem. 2021, 15, 10. [Google Scholar] [CrossRef]
  35. Shah, A. A novel electrochemical nanosensor for the simultaneous sensing of two toxic food dyes. ACS Omega 2020, 5, 6187–6193. [Google Scholar] [CrossRef] [PubMed]
  36. Hayat, M.; Shah, A.; Nisar, J.; Shah, I.; Haleem, A.; Ashiq, M.N. A novel electrochemical sensing platform for the sensitive detection and degradation monitoring of methylene blue. Catalysts 2022, 12, 306. [Google Scholar] [CrossRef]
  37. Hakeem, M.K.; Shah, A.; Nisar, J.; Iftikhar, F.J.; Khan, S.B.; Shah, I. Electrochemical sensing platform for the detection and degradation studies of Metanil Yellow. J. Electrochem. Soc. 2022, 169, 056503. [Google Scholar] [CrossRef]
  38. Kokab, T.; Shah, A.; Khan, M.A.; Nisar, J.; Ashiq, M.N. Electrochemical sensing platform for the simultaneous femtomolar detection of amlodipine and atorvastatin drugs. RSC Adv. 2021, 11, 27135–27151. [Google Scholar] [CrossRef] [PubMed]
  39. Wang, J.; Yang, B.; Wang, H.; Yang, P.; Du, Y. Highly sensitive electrochemical determination of Sunset Yellow based on gold nanoparticles/graphene electrode. Anal. Chim. Acta 2015, 893, 41–48. [Google Scholar] [CrossRef]
  40. Mo, Z.; Zhang, Y.; Zhao, F.; Xiao, F.; Guo, G.; Zeng, B. Sensitive voltammetric determination of Sudan I in food samples by using gemini surfactant ionic liquid multiwalled carbon nanotube composite film modified glassy carbon electrodes. Food Chem. 2010, 121, 233–237. [Google Scholar] [CrossRef]
  41. Kokab, T.; Shah, A.; Khan, M.A.; Arshad, M.; Nisar, J.; Ashiq, M.N.; Zia, M.A. Simultaneous femtomolar detection of paracetamol, diclofenac, and orphenadrine using a carbon nanotube/zinc oxide nanoparticle-based electrochemical sensor. ACS Appl. Nano Mater. 2021, 4, 4699–4712. [Google Scholar] [CrossRef]
  42. Wang, H.; Guo, X.; Fu, S.; Yang, T.; Wen, Y.; Yang, H. Optimized core shell Au@ Ag nanoparticles for label free Raman determination of trace Rhodamine B with cancer risk in food product. Food Chem. 2015, 188, 137–142. [Google Scholar] [CrossRef] [PubMed]
  43. Chandu, B.; Bharati, M.S.S.; Albrycht, P.; Rao, S.V. Fabrication of nanocages on nickel using femtosecond laser ablation and trace level detection of Malachite Green and Nile Blue dyes using surface enhanced Raman spectroscopic technique. Opt. Laser Technol. 2020, 131, 106454. [Google Scholar] [CrossRef]
  44. Moram, S.S.B.; Byram, C.; Soma, V.R. Gold nanoparticle and nanostar loaded paper based SERS substrates for sensing nanogram level picric acid with a portable Raman spectrometer. Bull. Mater. Sci. 2020, 43, 53. [Google Scholar] [CrossRef]
  45. Somsen, G.; Coulter, S.; Gooijer, C.; Velthorst, N.; Brinkman, U.T. Coupling of column liquid chromatography and surface enhanced resonance Raman spectroscopy via a thin layer chromatographic plate. Anal. Chim. Acta 1997, 349, 189–197. [Google Scholar] [CrossRef]
  46. Drisko, G.L.; Cao, L.; Kimling, M.C.; Harrisson, S.; Luca, V.; Caruso, R.A. Pore size and volume effects on the incorporation of polymer into macro and mesoporous zirconium titanium oxide membranes. ACS Appl. Mater. Interfaces 2009, 1, 2893–2901. [Google Scholar] [CrossRef] [PubMed]
  47. Teixeira, S.; Martins, P.; Lanceros-Mendez, S.; Kuhn, K.; Cuniberti, G. Reusability of photocatalytic TiO2 and ZnO nanoparticles immobilized in poly (vinylidene difluoride)-co-trifluoroethylene. Appl. Surf. Sci. 2016, 384, 497–504. [Google Scholar] [CrossRef]
  48. Kushwaha, R.; Garg, S.; Bajpai, S.; Giri, A.S. Degradation of Nile blue sulphate dye onto iron oxide nanoparticles: Kinetic study, identification of reaction intermediates, and proposed mechanistic pathways. Asia-Pac. J. Chem. Eng. 2018, 13, 2200. [Google Scholar] [CrossRef]
  49. Irfan, M.; Shah, A.; Iftikhar, F.J.; Hayat, M.; Ashiq, M.N.; Shah, I. Electrochemical sensing platform based on functionalized multi-walled carbon nanotubes and metal oxide for the detection and degradation studies of orange II dye. ACS Omega 2022, 7, 32302–32312. [Google Scholar] [CrossRef]
  50. Yahya, R.; Shah, A.; Kokab, T.; Ullah, N.; Hakeem, M.K.; Hayat, M.; Haleem, A.; Shah, I. Electrochemical Sensor for detection and degradation studies of ethyl violet dye. ACS Omega 2022, 7, 34154–34165. [Google Scholar] [CrossRef] [PubMed]
  51. Rao, C.; Zhou, L.; Pan, Y.; Lu, C.; Qin, X.; Sakiyama, H.; Muddassir, M.; Liu, J. The extra-large calixarene-based MOFs derived hierarchical composites for photocatalysis of dye: Facile syntheses and contribution of carbon species. J. Alloys Compd. 2022, 897, 163178. [Google Scholar] [CrossRef]
  52. Wang, J.; Rao, C.; Lu, L.; Zhang, S.; Muddassir, M.; Liu, J. Efficient photocatalytic degradation of methyl violet using two new 3D MOFs directed by different carboxylate spacers. CrystEngComm 2021, 23, 741–747. [Google Scholar] [CrossRef]
  53. Mosmann, T. Rapid colorimetric assay for cellular growth and survival: Application to proliferation and cytotoxicity assays. J. Immunol. Methods 1983, 65, 55–63. [Google Scholar] [CrossRef] [PubMed]
  54. Shah, A.; Shah, A.H.; Parveen, N.; Rehman, Z.; Khan, S.Z.; Rana, U.A.; Khan, S.U.D.; Nisar, J.; Lashin, A.; Qureshi, R. Synthesis and electrochemical investigations of piperazines. Electrochim. Acta 2016, 220, 705–711. [Google Scholar] [CrossRef]
  55. Kokab, T.; Manzoor, A.; Shah, A.; Siddiqi, H.M.; Nisar, J.; Ashiq, M.N.; Shah, A.H. Development of tribenzamide functionalized electrochemical sensor for femtomolar level sensing of multiple inorganic water pollutants. Electrochim. Acta 2020, 353, 136569. [Google Scholar] [CrossRef]
Figure 1. (a) Nyquist plots using data obtained at bare and modified GCE in a solution of 5 mM K3[Fe(CN)6] as a redox probe and 0.1 M KCl as a supporting electrolyte. (b) Cyclic voltammograms at the bare and modified GCE in 5 mM K3[Fe(CN6)] as redox probe and 0.1 M KCl as supporting electrolyte at a scan rate of 100 mV s−1.
Catalysts 13 00141 g001
Figure 2. (a) SWVs response of 10 µM NBS at bare GCE, MWCNTS/GCE, and COOH-fMWCNTs/GCE in PBS of pH 6.0. (b) Picture recorded after 30 s placement of the same volume of water droplet on bare GCE, MWCNTs/GCE and COOH-fMWCNTs/GCE.
Catalysts 13 00141 g002
Figure 3. Anodic peak current response of 10 µM NBS in various supporting electrolytes using COOH-fMWCNTs modified GCE.
Catalysts 13 00141 g003
Figure 4. (a) SWVs showing the influence of pH on the oxidation response of NBS in PBS solution of pH 3–10 using COOH-fMWCNTs/GCE. (b) The plot of Ep vs. pH of NBS using 0.1 M PBS as a supporting electrolyte.
Catalysts 13 00141 g004
Figure 5. (a) Square wave voltammograms of various concentrations of NBS ranging from 0.03 µM to 10 µM under pre-optimized conditions. (b) The calibration plot of NBS concentrations ranging from 0.03 µM to 10 µM under optimized conditions with two distinct regions.
Catalysts 13 00141 g005
Figure 6. (a) SWVs of NBS showing the reproducibility of the designed sensor. (b) SWVs of NBS showing repeatability of the designed sensor.
Catalysts 13 00141 g006
Figure 7. (a) SWVs of 10 µM NBS in the presence of different interfering agents using COOH-fMWCNTs/GCE. (b) Bar graph of the peak current of NBS at the designed sensor in the presence of interfering species.
Catalysts 13 00141 g007
Figure 8. (a) The SWV of NBS at different time intervals recorded by using COOH-fMWCNTs/GCE under optimized conditions. (b) Effect of irradiation time on NBS photocatalytic degradation under direct sunlight.
Catalysts 13 00141 g008
Scheme 1. Proposed mechanism for the degradation of NBS.
Catalysts 13 00141 sch001aCatalysts 13 00141 sch001b
Figure 9. (a) UV-Vis spectra of the photocatalytic degradation of NBS at different time intervals. (b) The photocatalytic degradation kinetics of NBS using UV-visible spectroscopic data.
Catalysts 13 00141 g009
Figure 10. Naked eye evidence of the decolorization of NBS dye.
Catalysts 13 00141 g010
Table 1. Assessment of the performance of the designed and reported sensors.
Sr.NoModifying MaterialMethodLOD (nM)Reference
1Nanocages of NiSERS5[43]
2Gold nanostarsSERS5[44]
3Ag and silicaLC/SERS157[45]
4COOH-fMWCNTsSWV1.21This work
Disclaimer/Publisher’s Note: The statements, opinions and data contained in all publications are solely those of the individual author(s) and contributor(s) and not of MDPI and/or the editor(s). MDPI and/or the editor(s) disclaim responsibility for any injury to people or property resulting from any ideas, methods, instructions or products referred to in the content.

