
Ni-H-Beta Catalysts for Ethylene Oligomerization: Impact of Parent Cation on Ni Loading, Speciation, and Siting

Abstract
1. Introduction
2. Results and Discussion
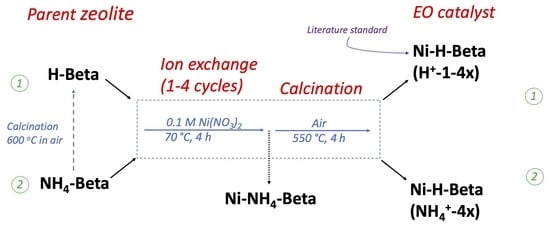
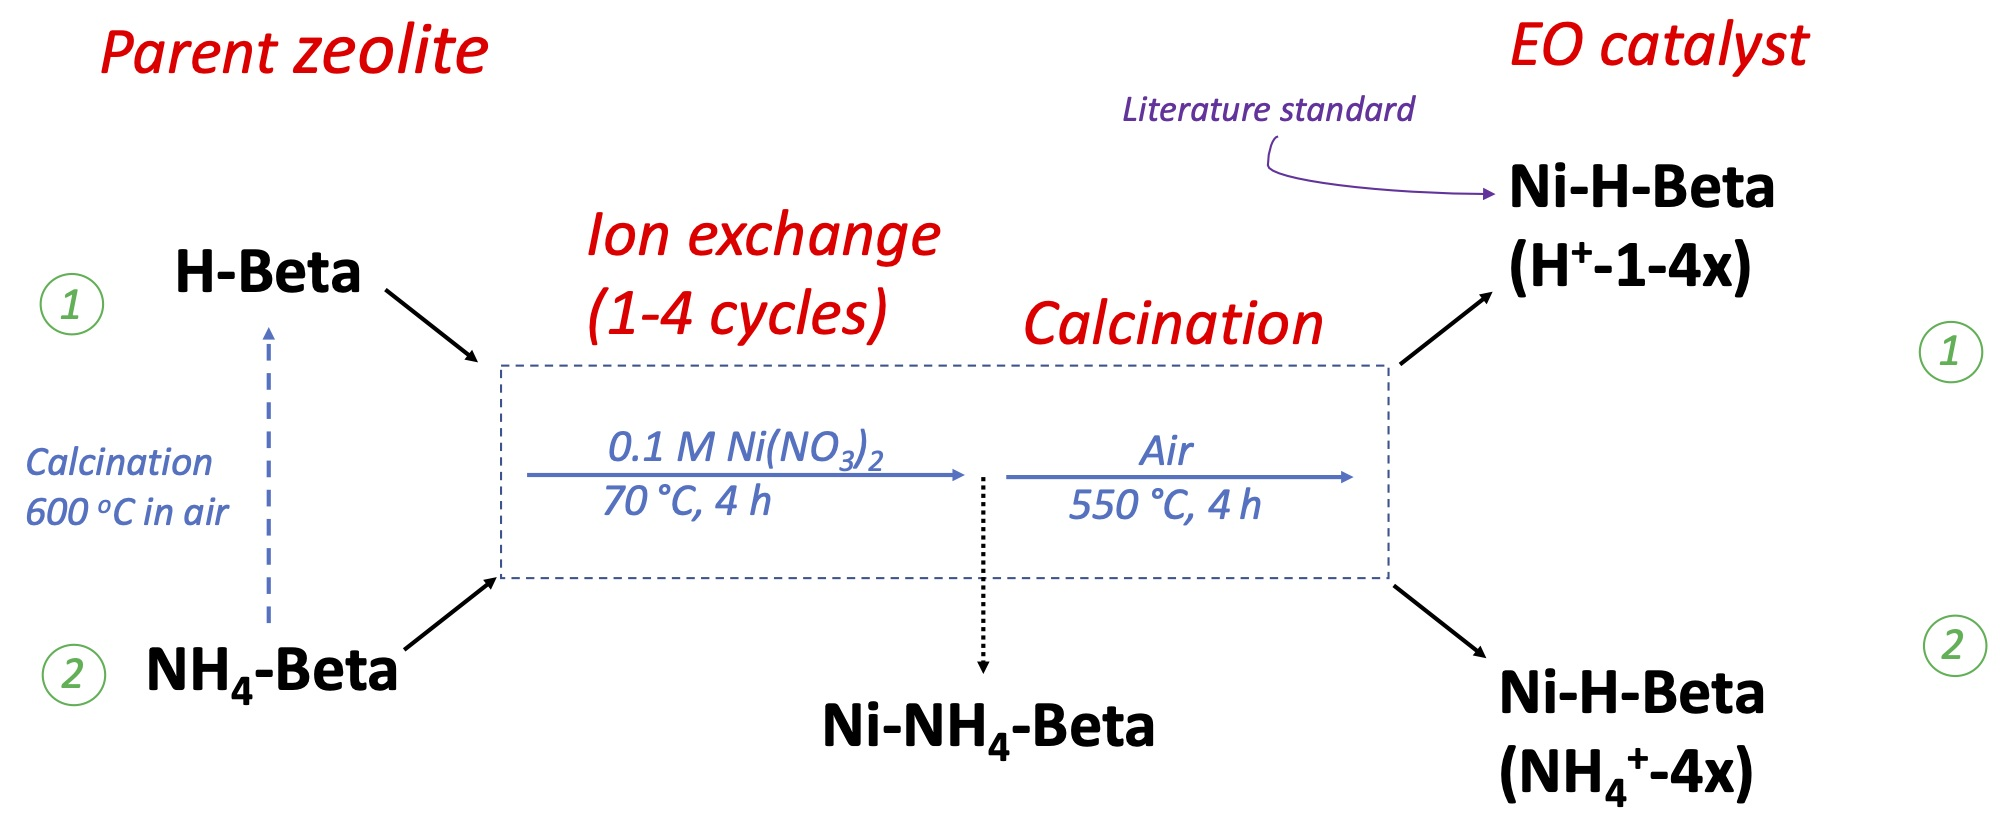
2.1. Catalyst Preparation
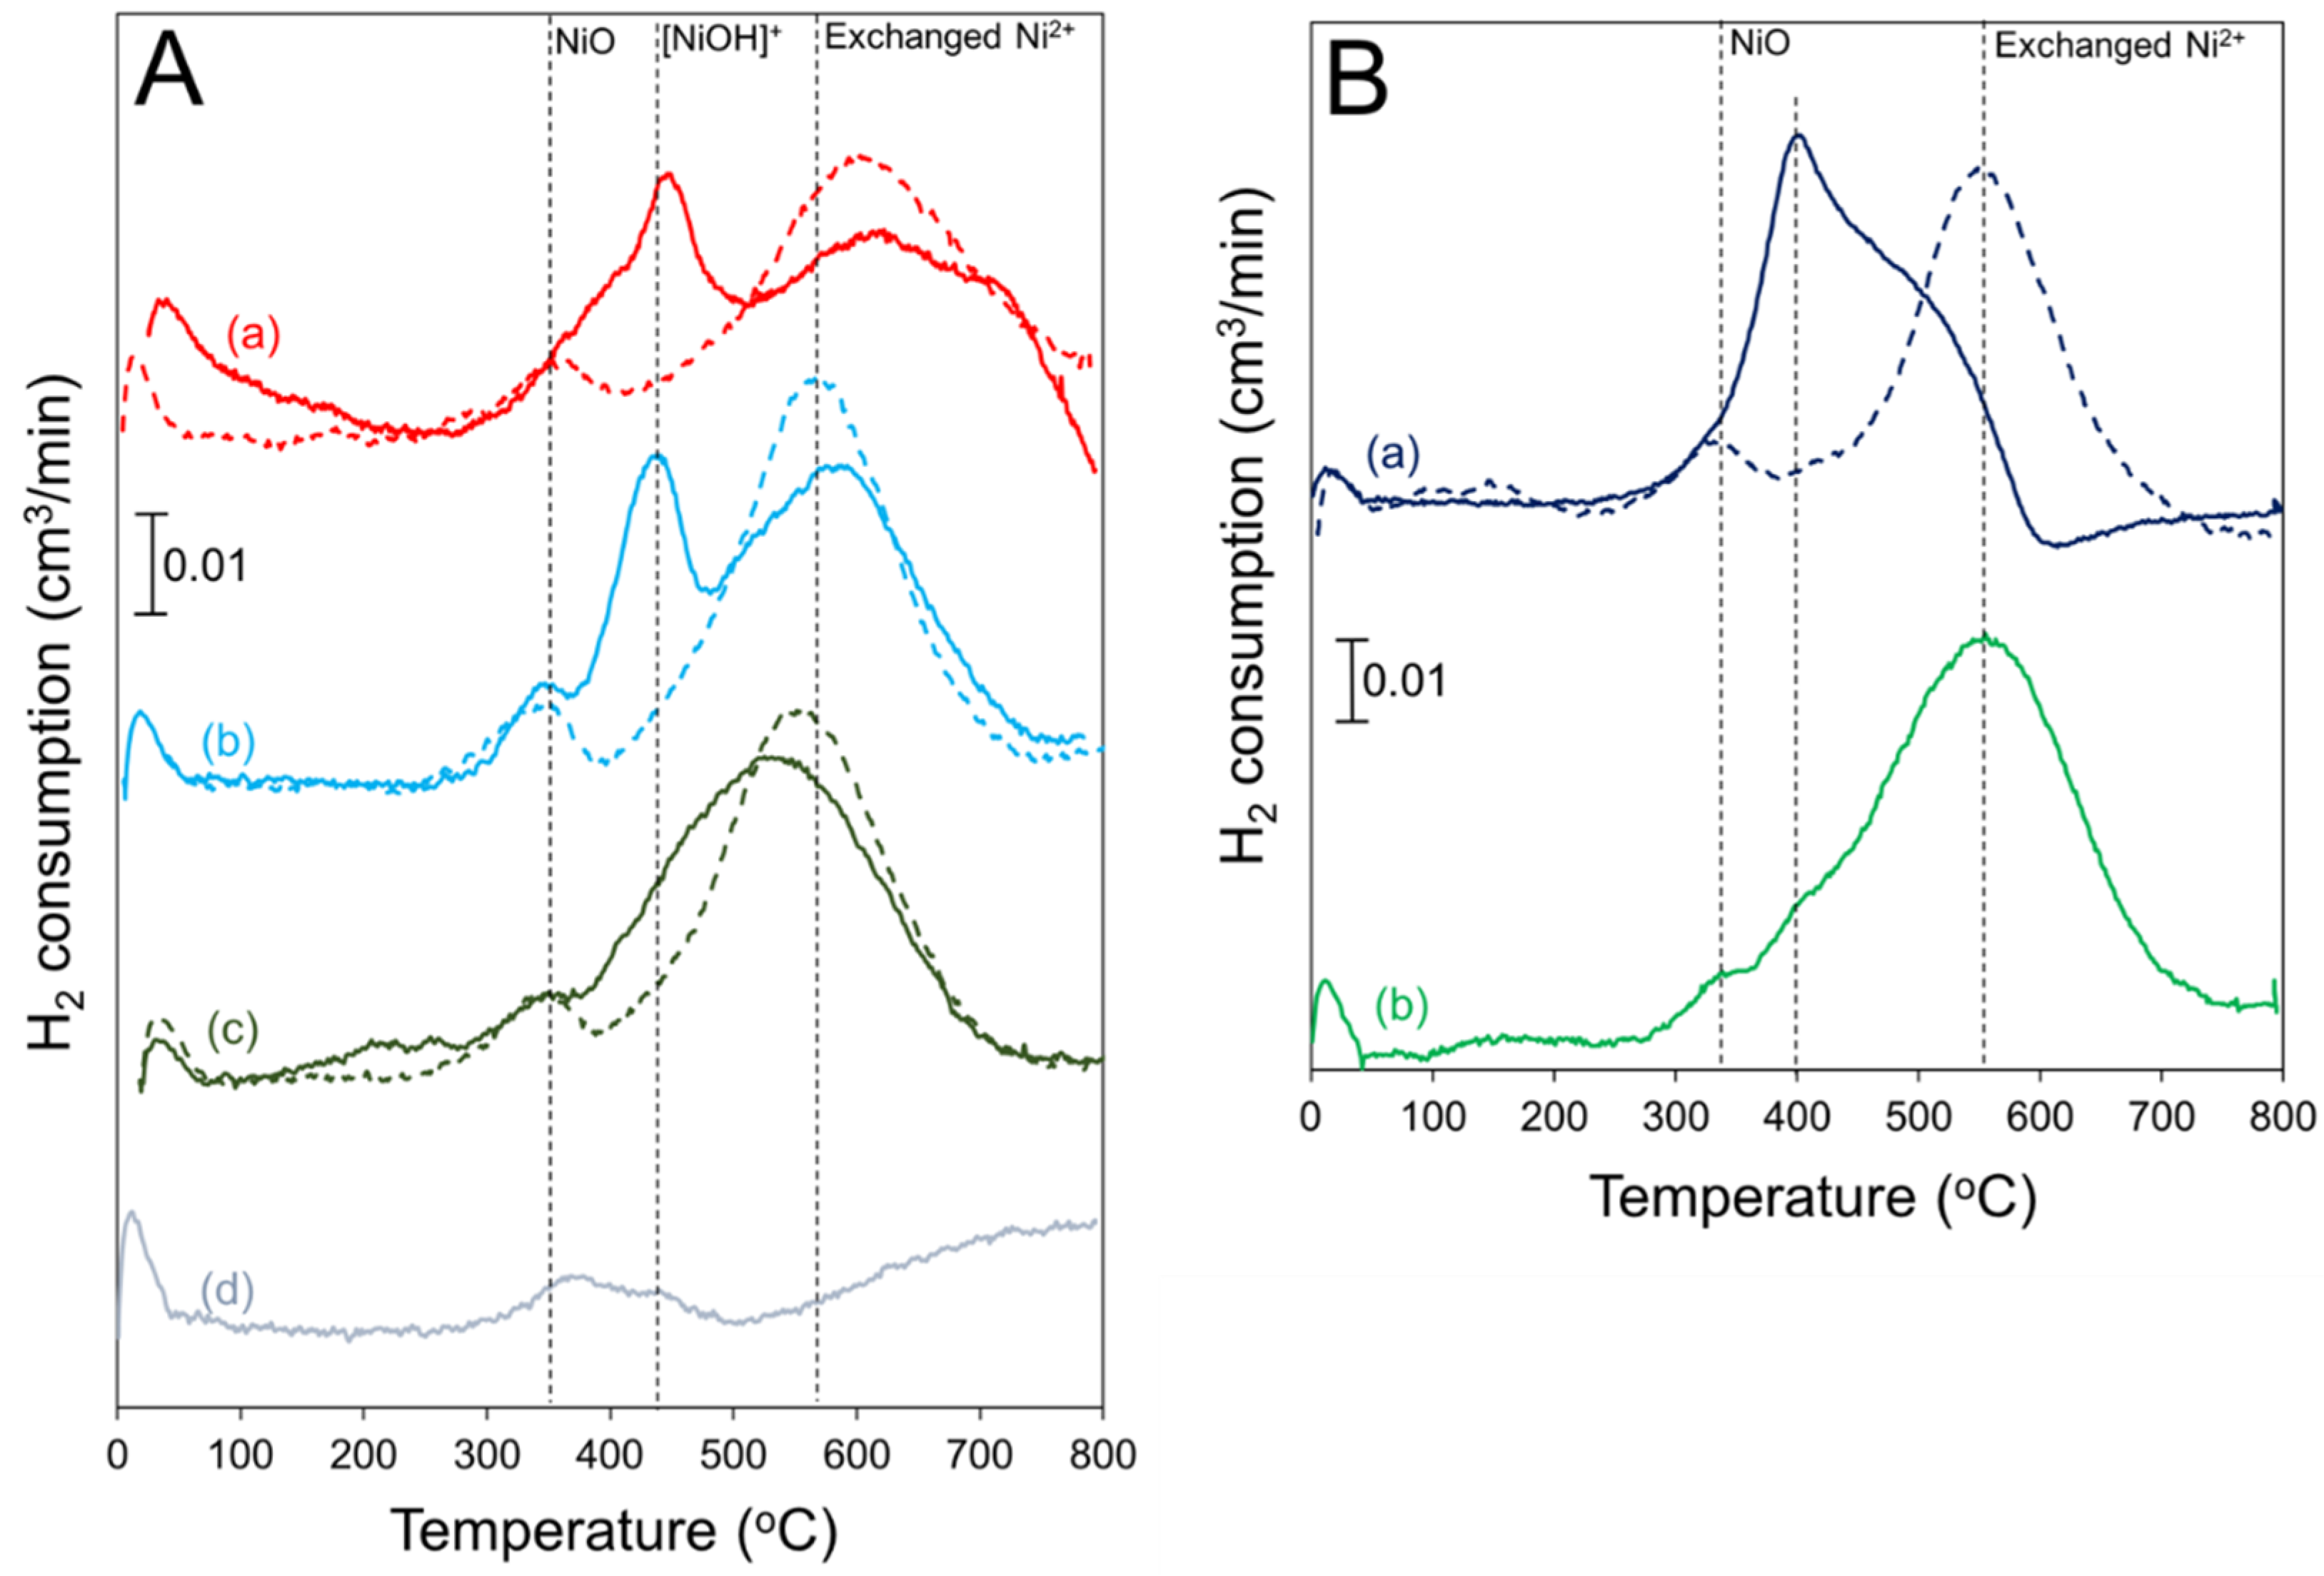
2.2. H2 TPR
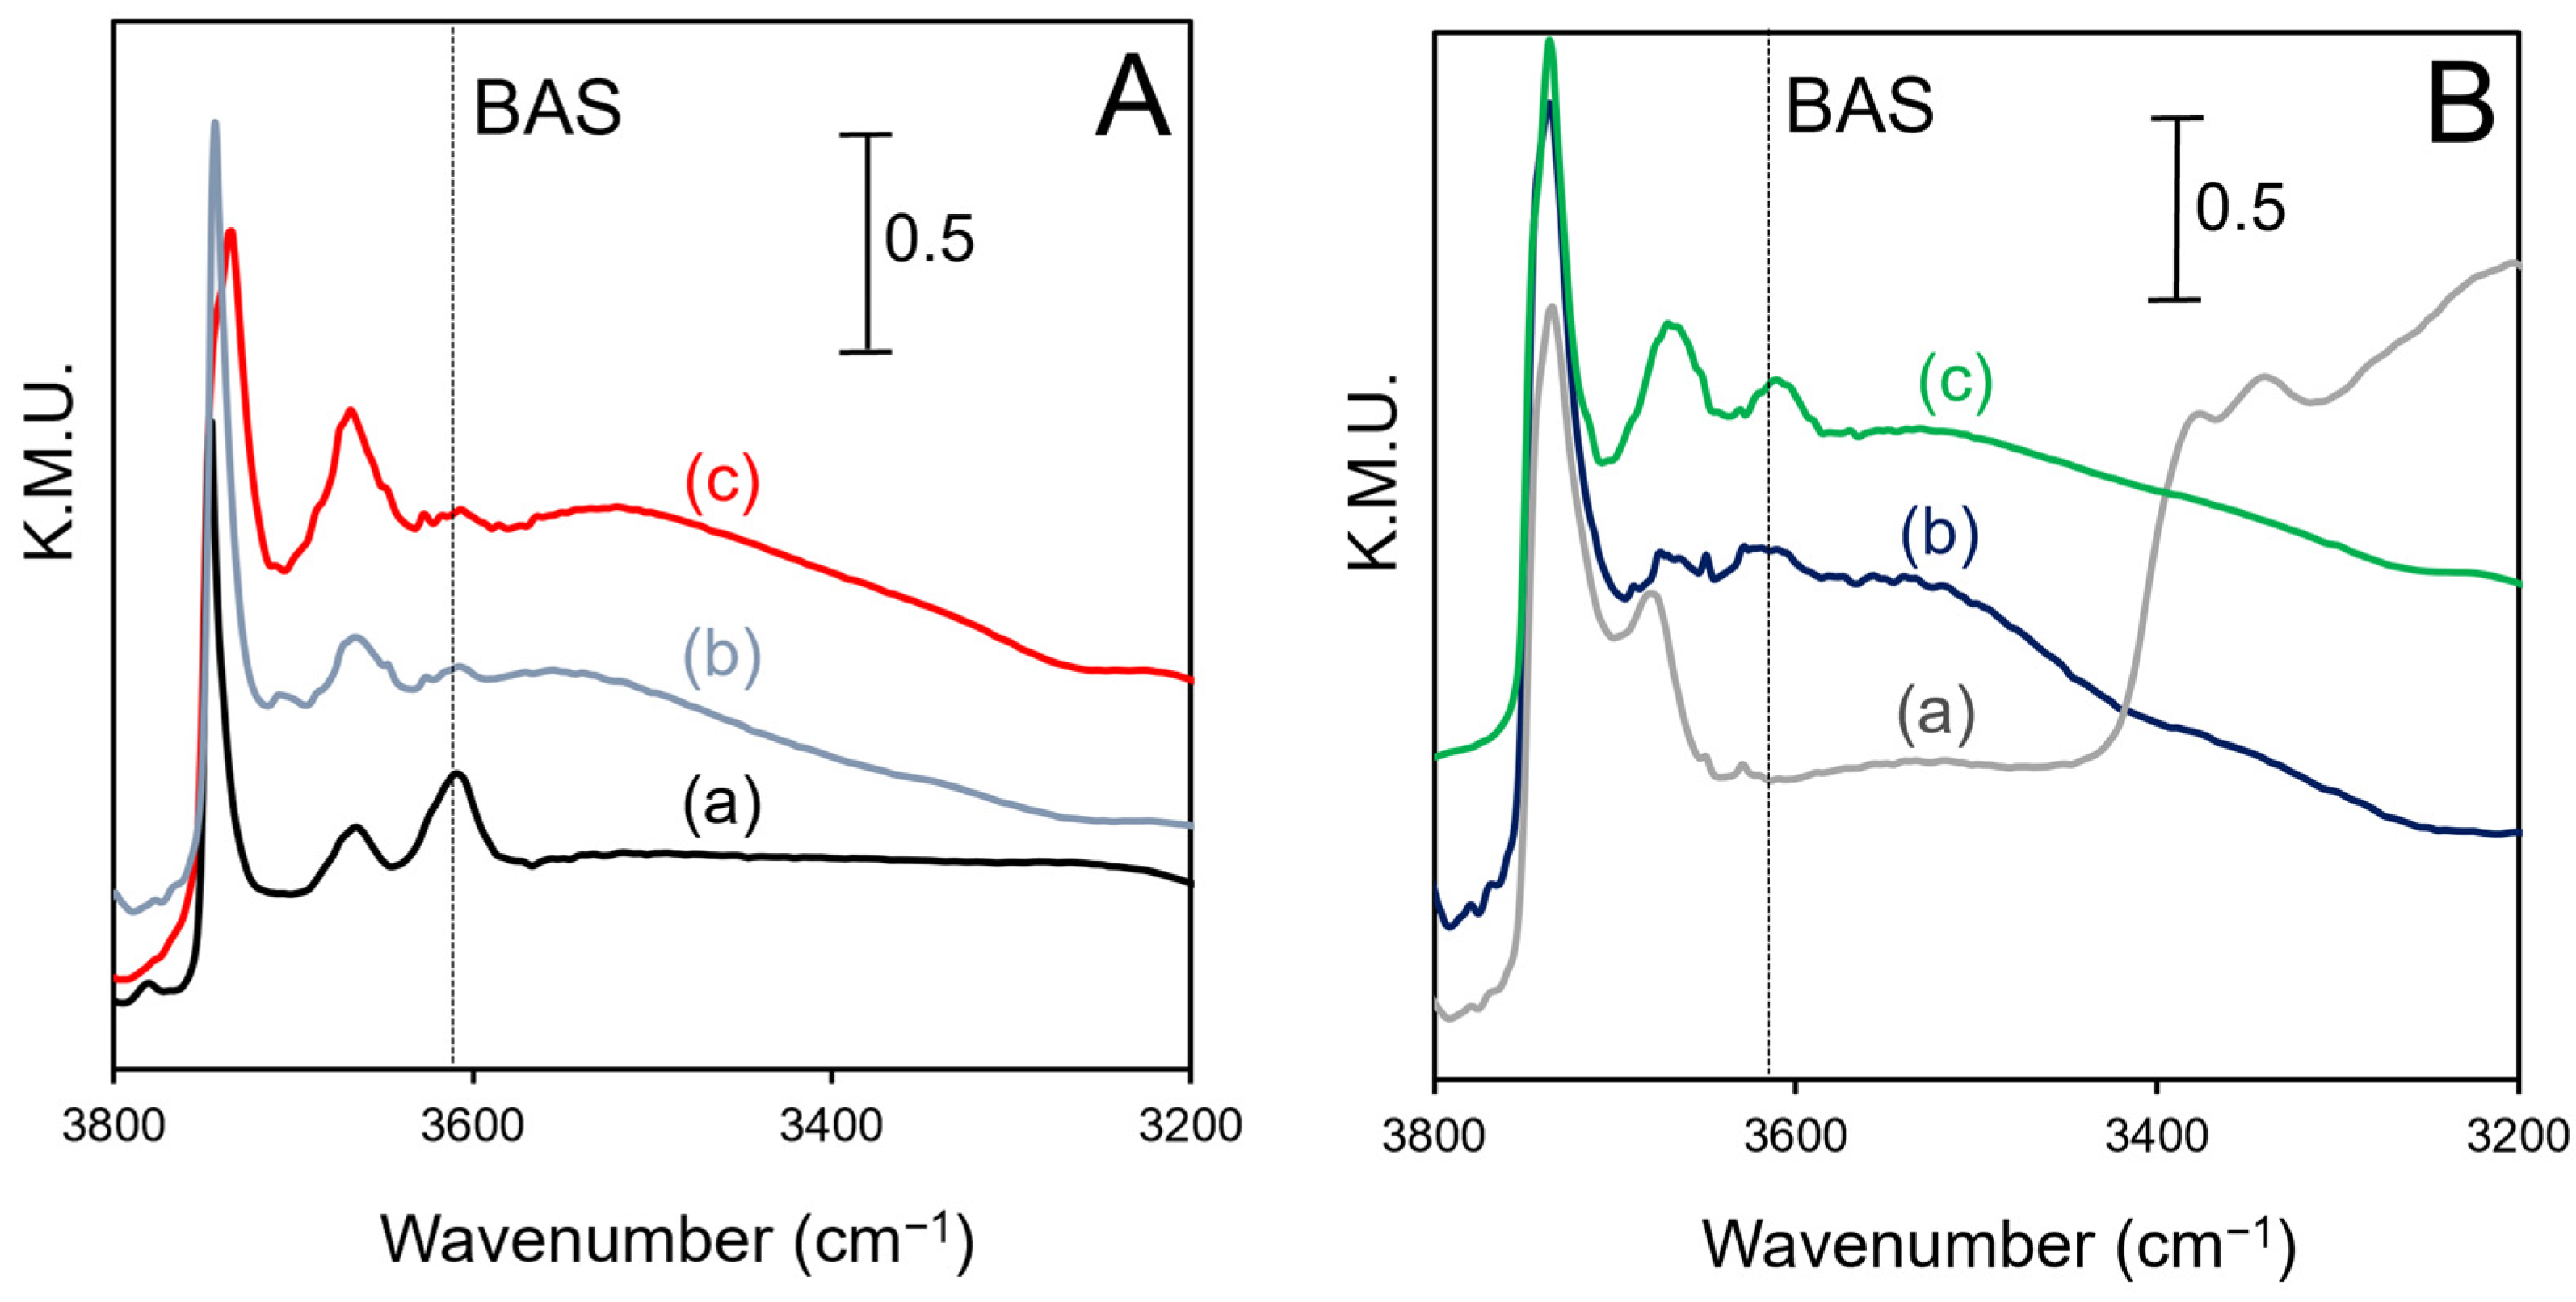
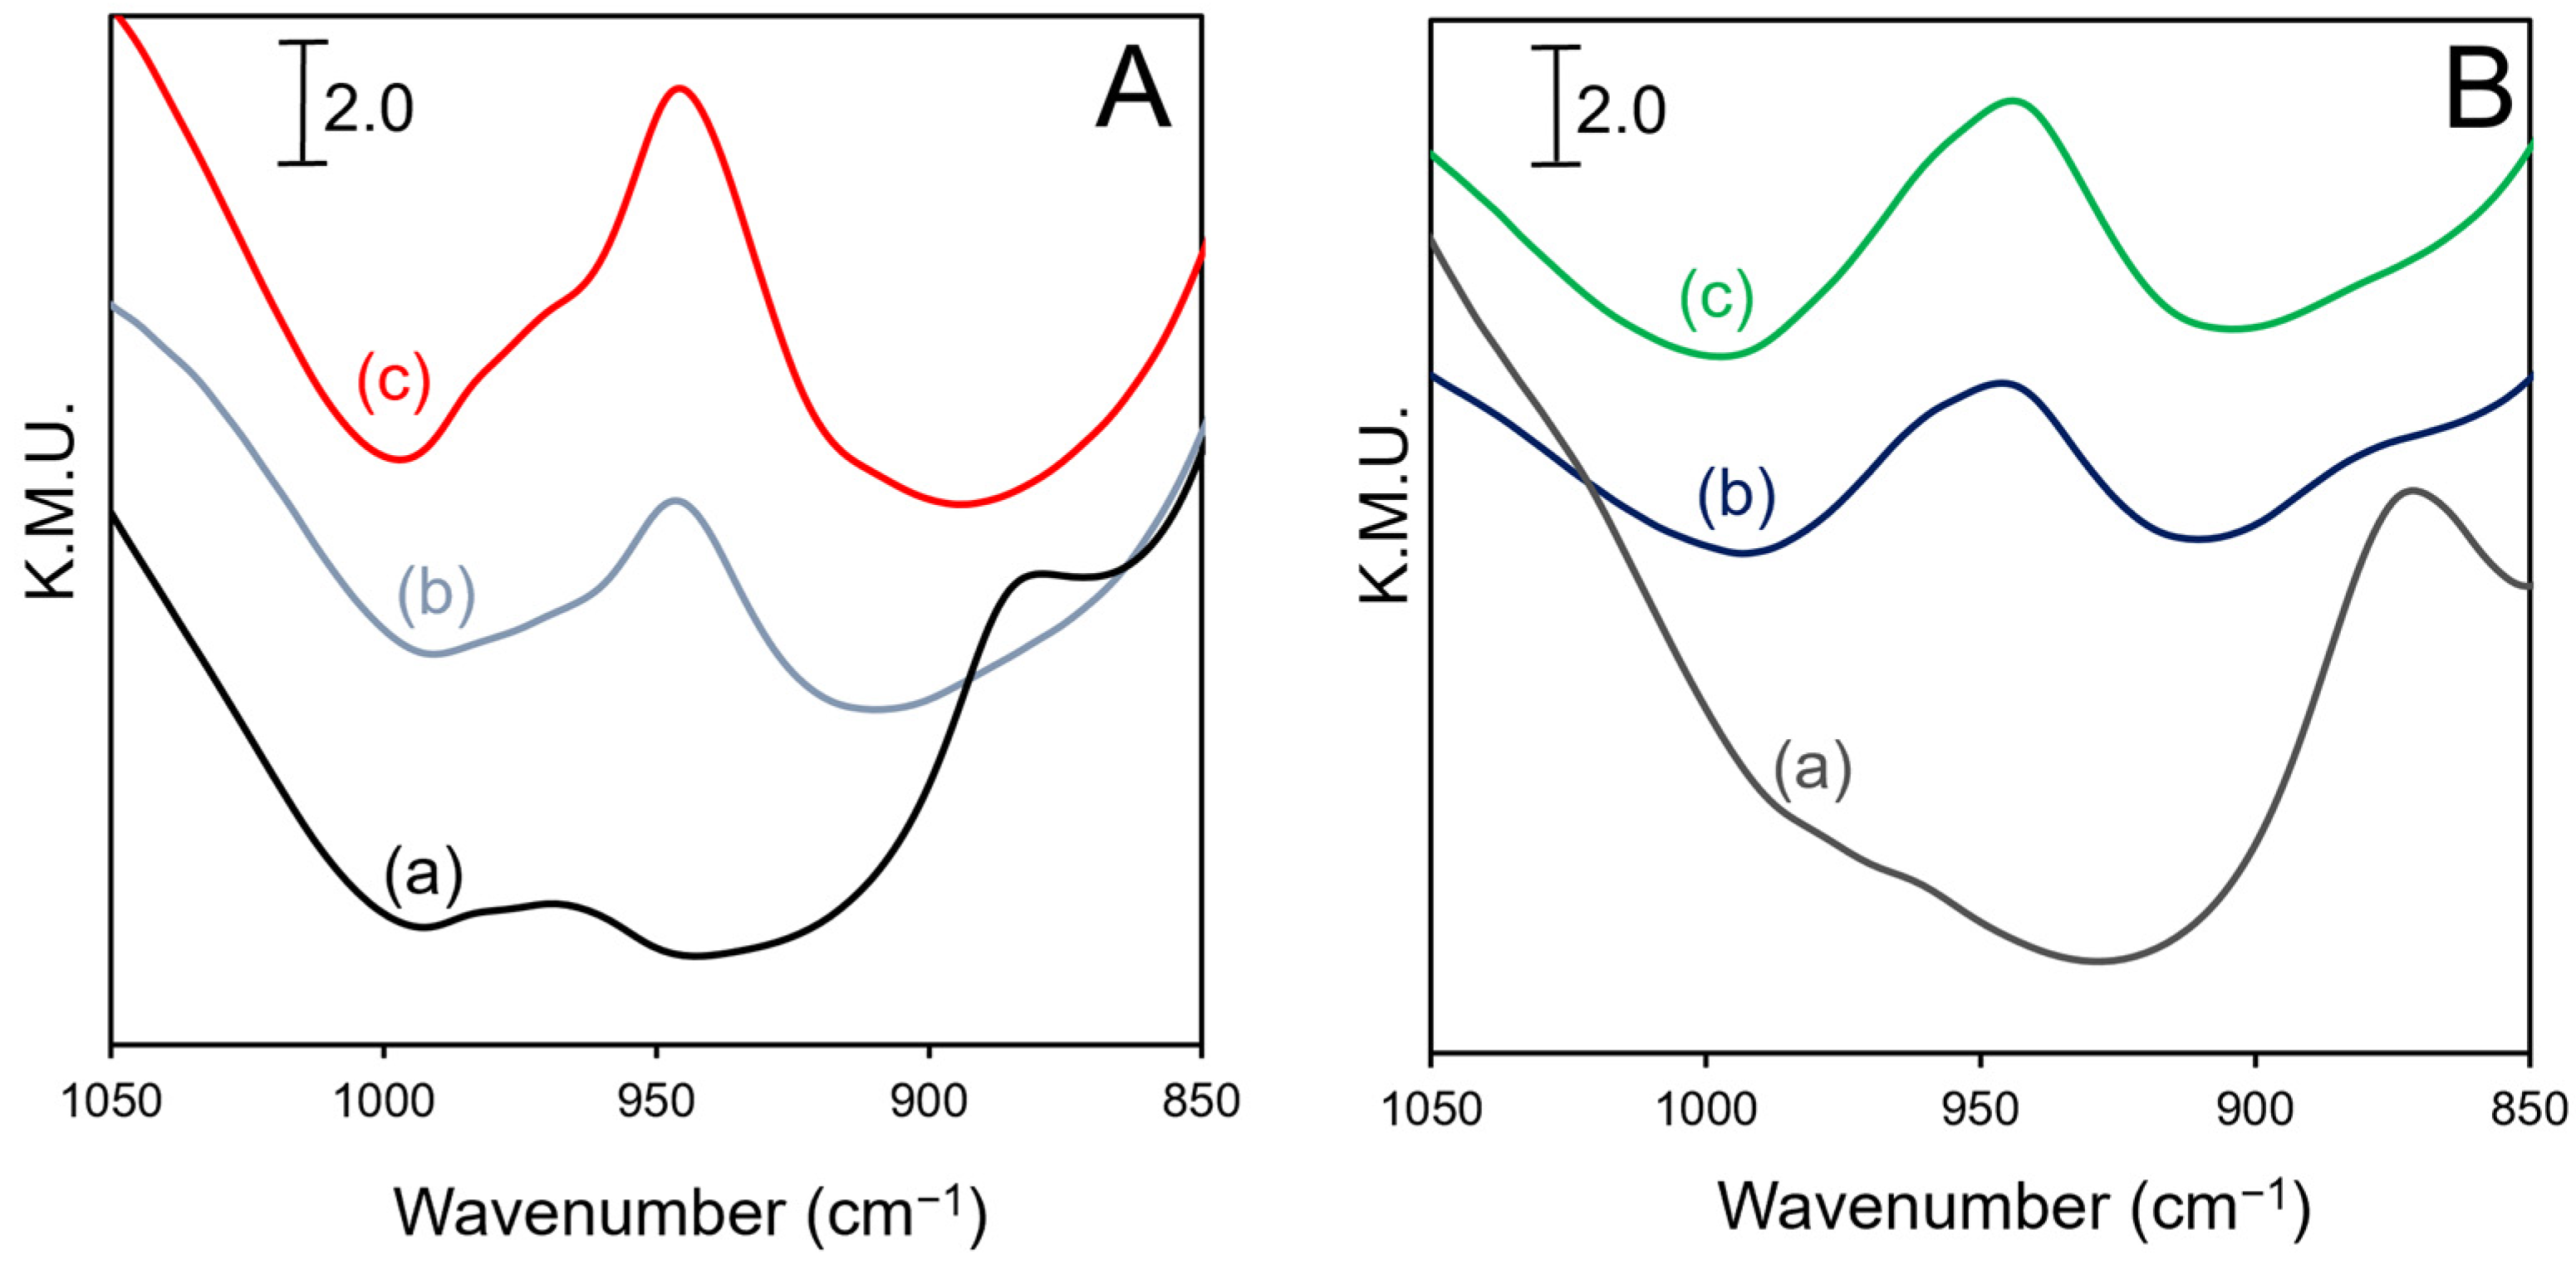
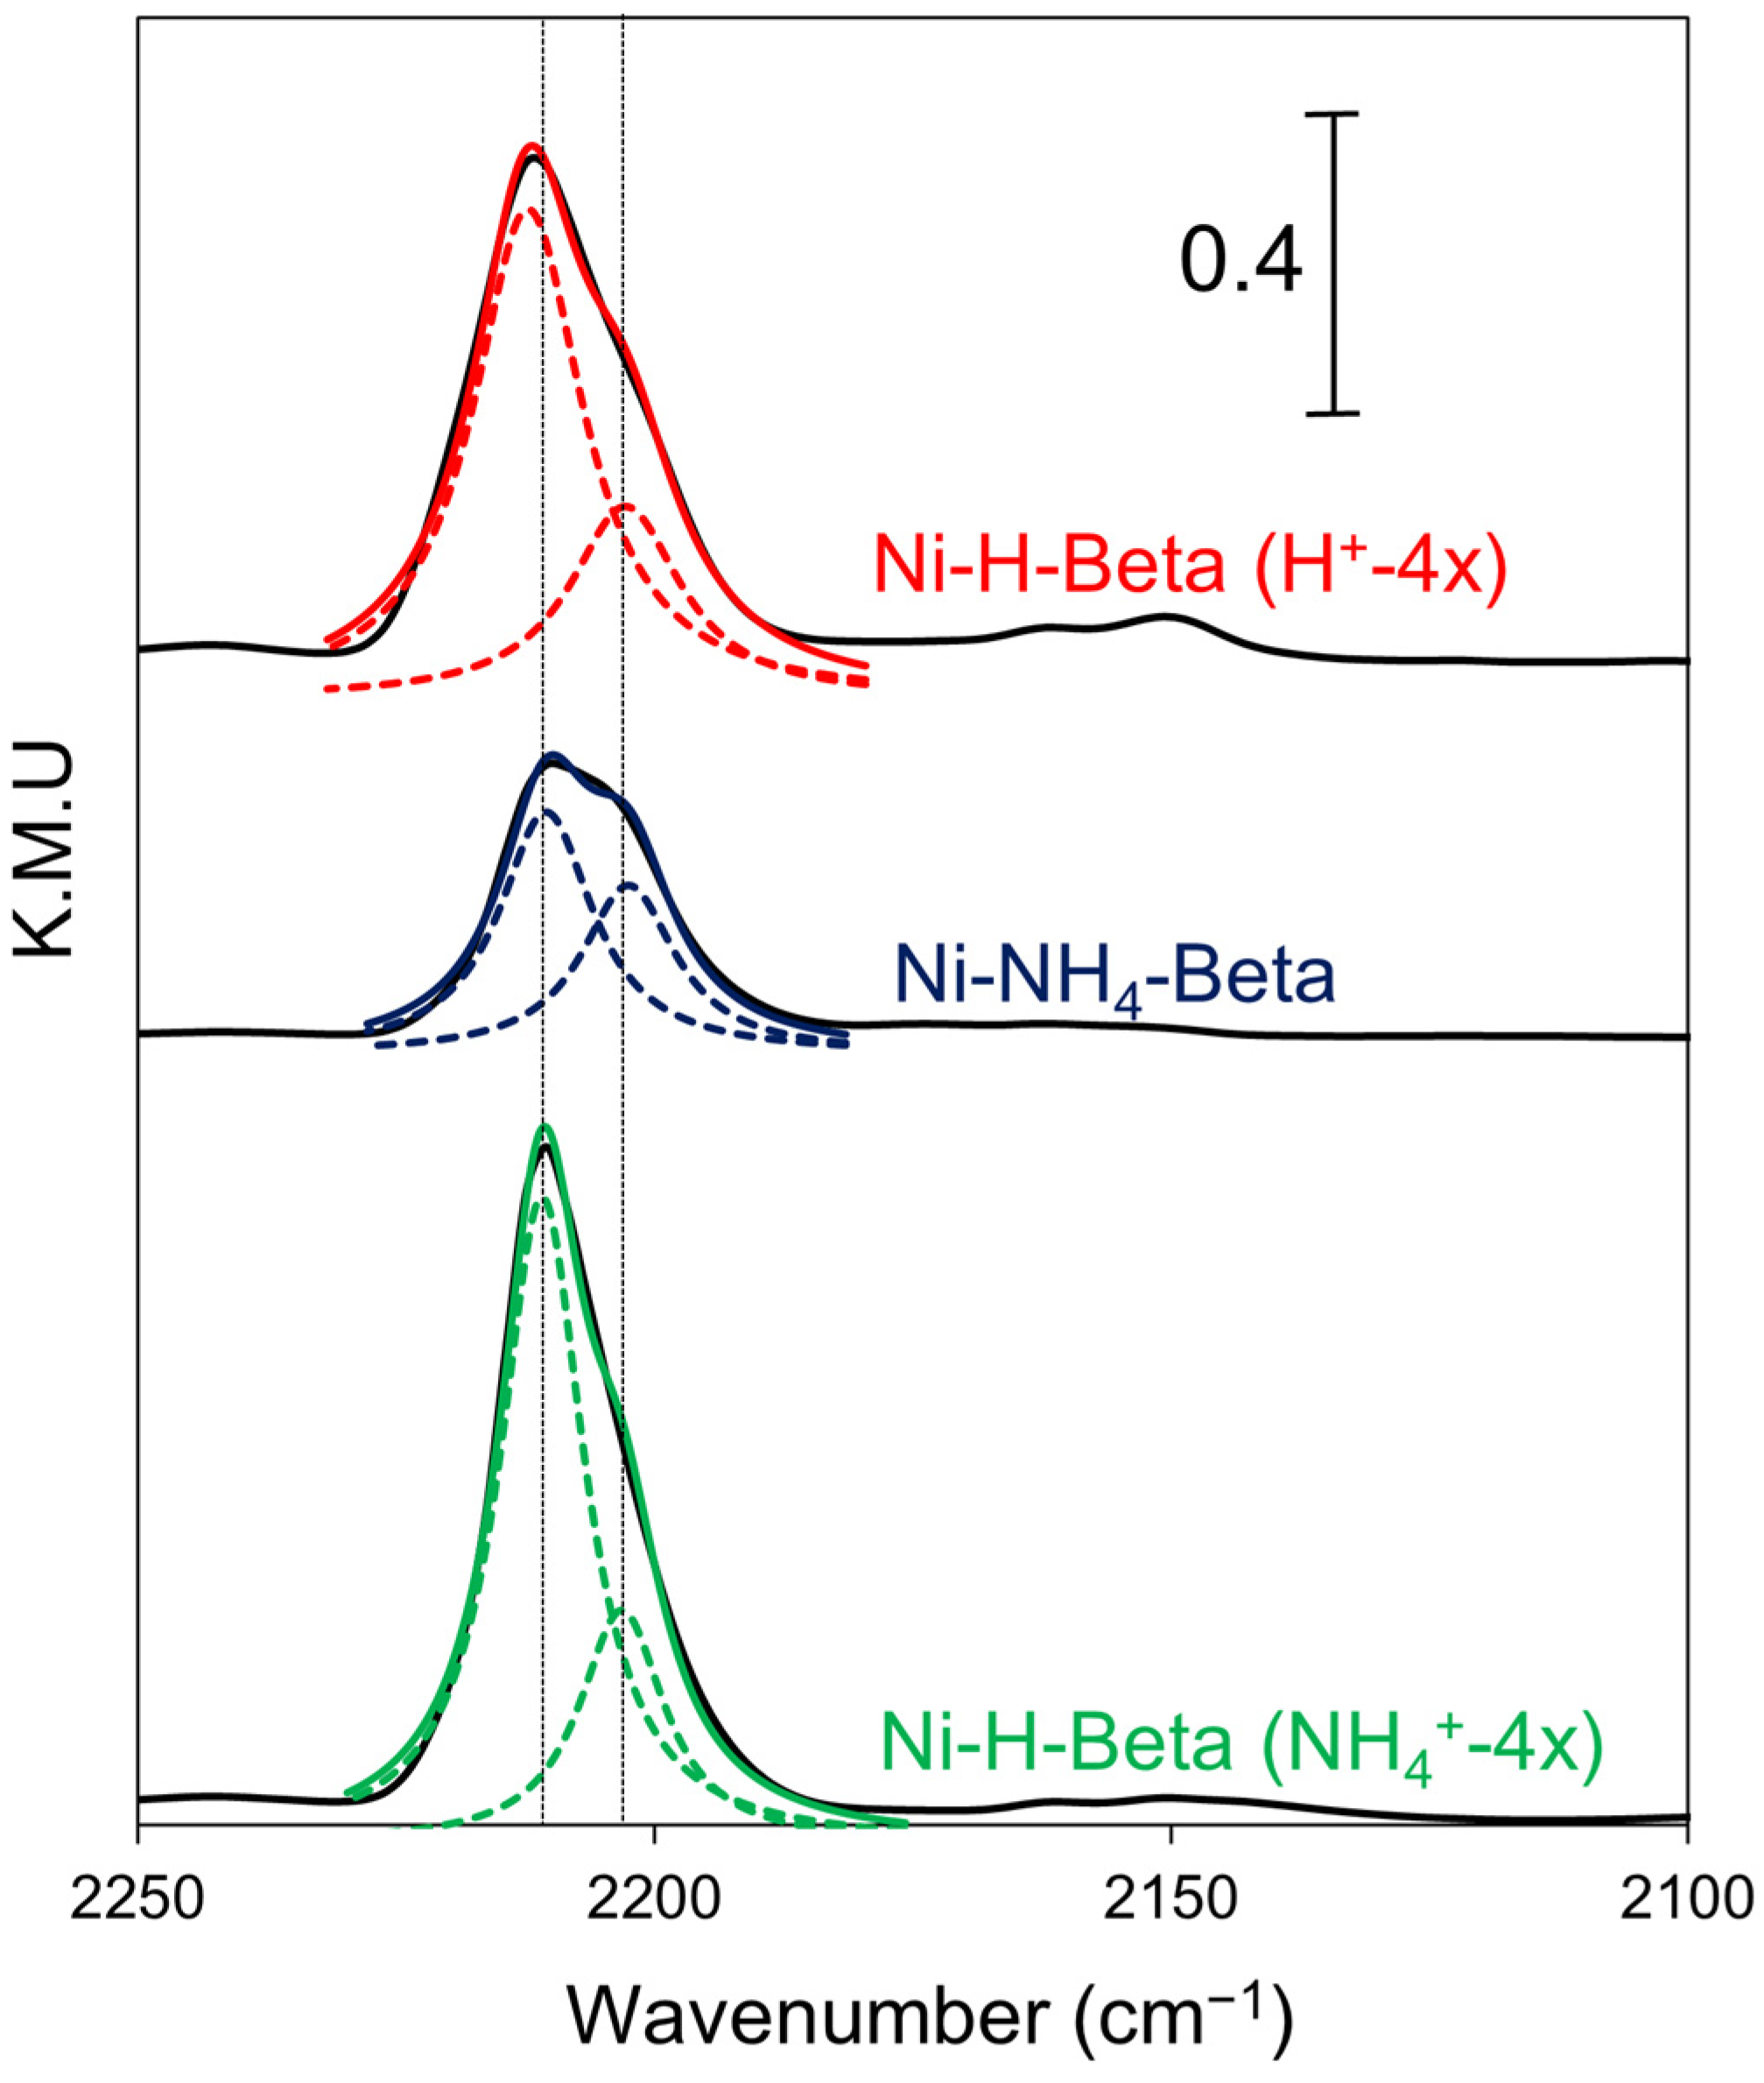
2.3. DRIFTS
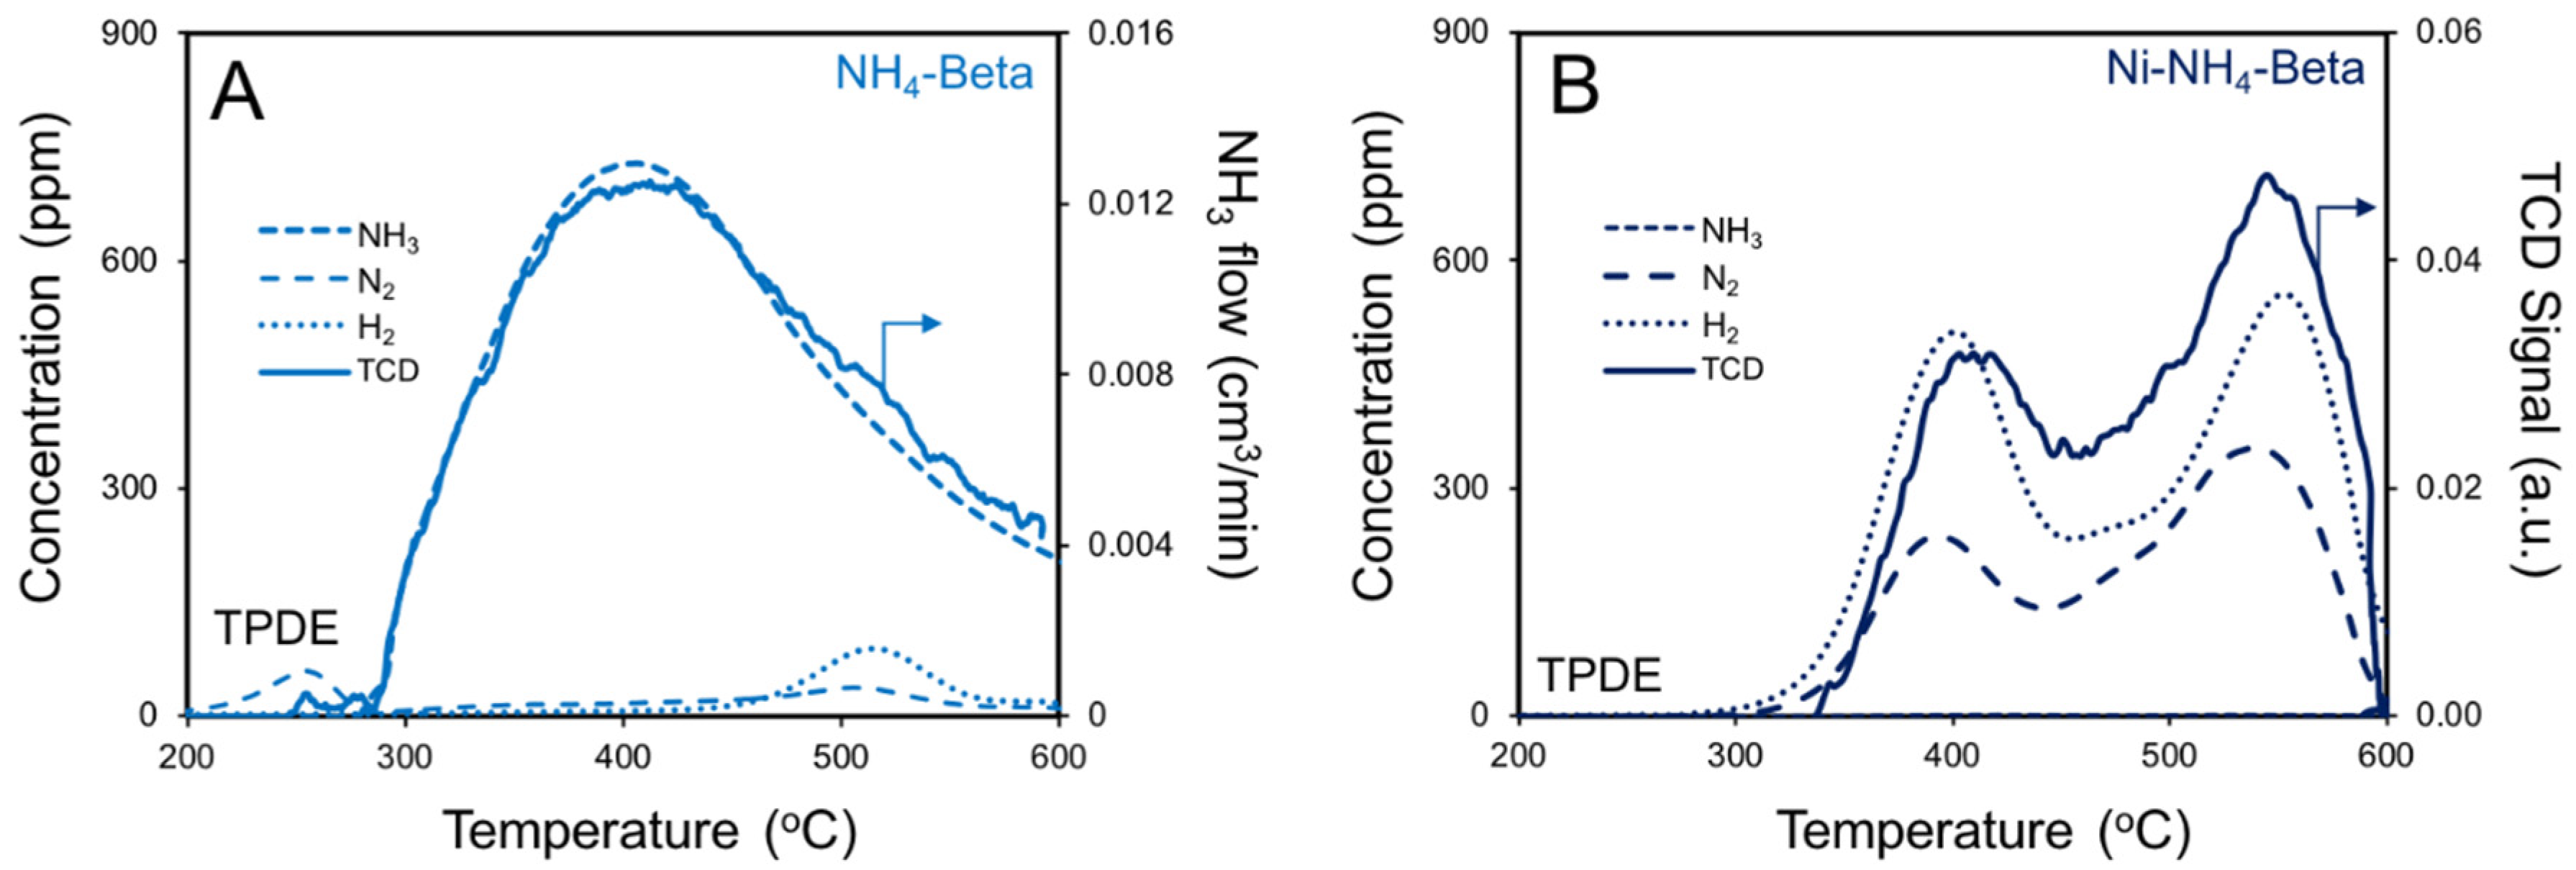
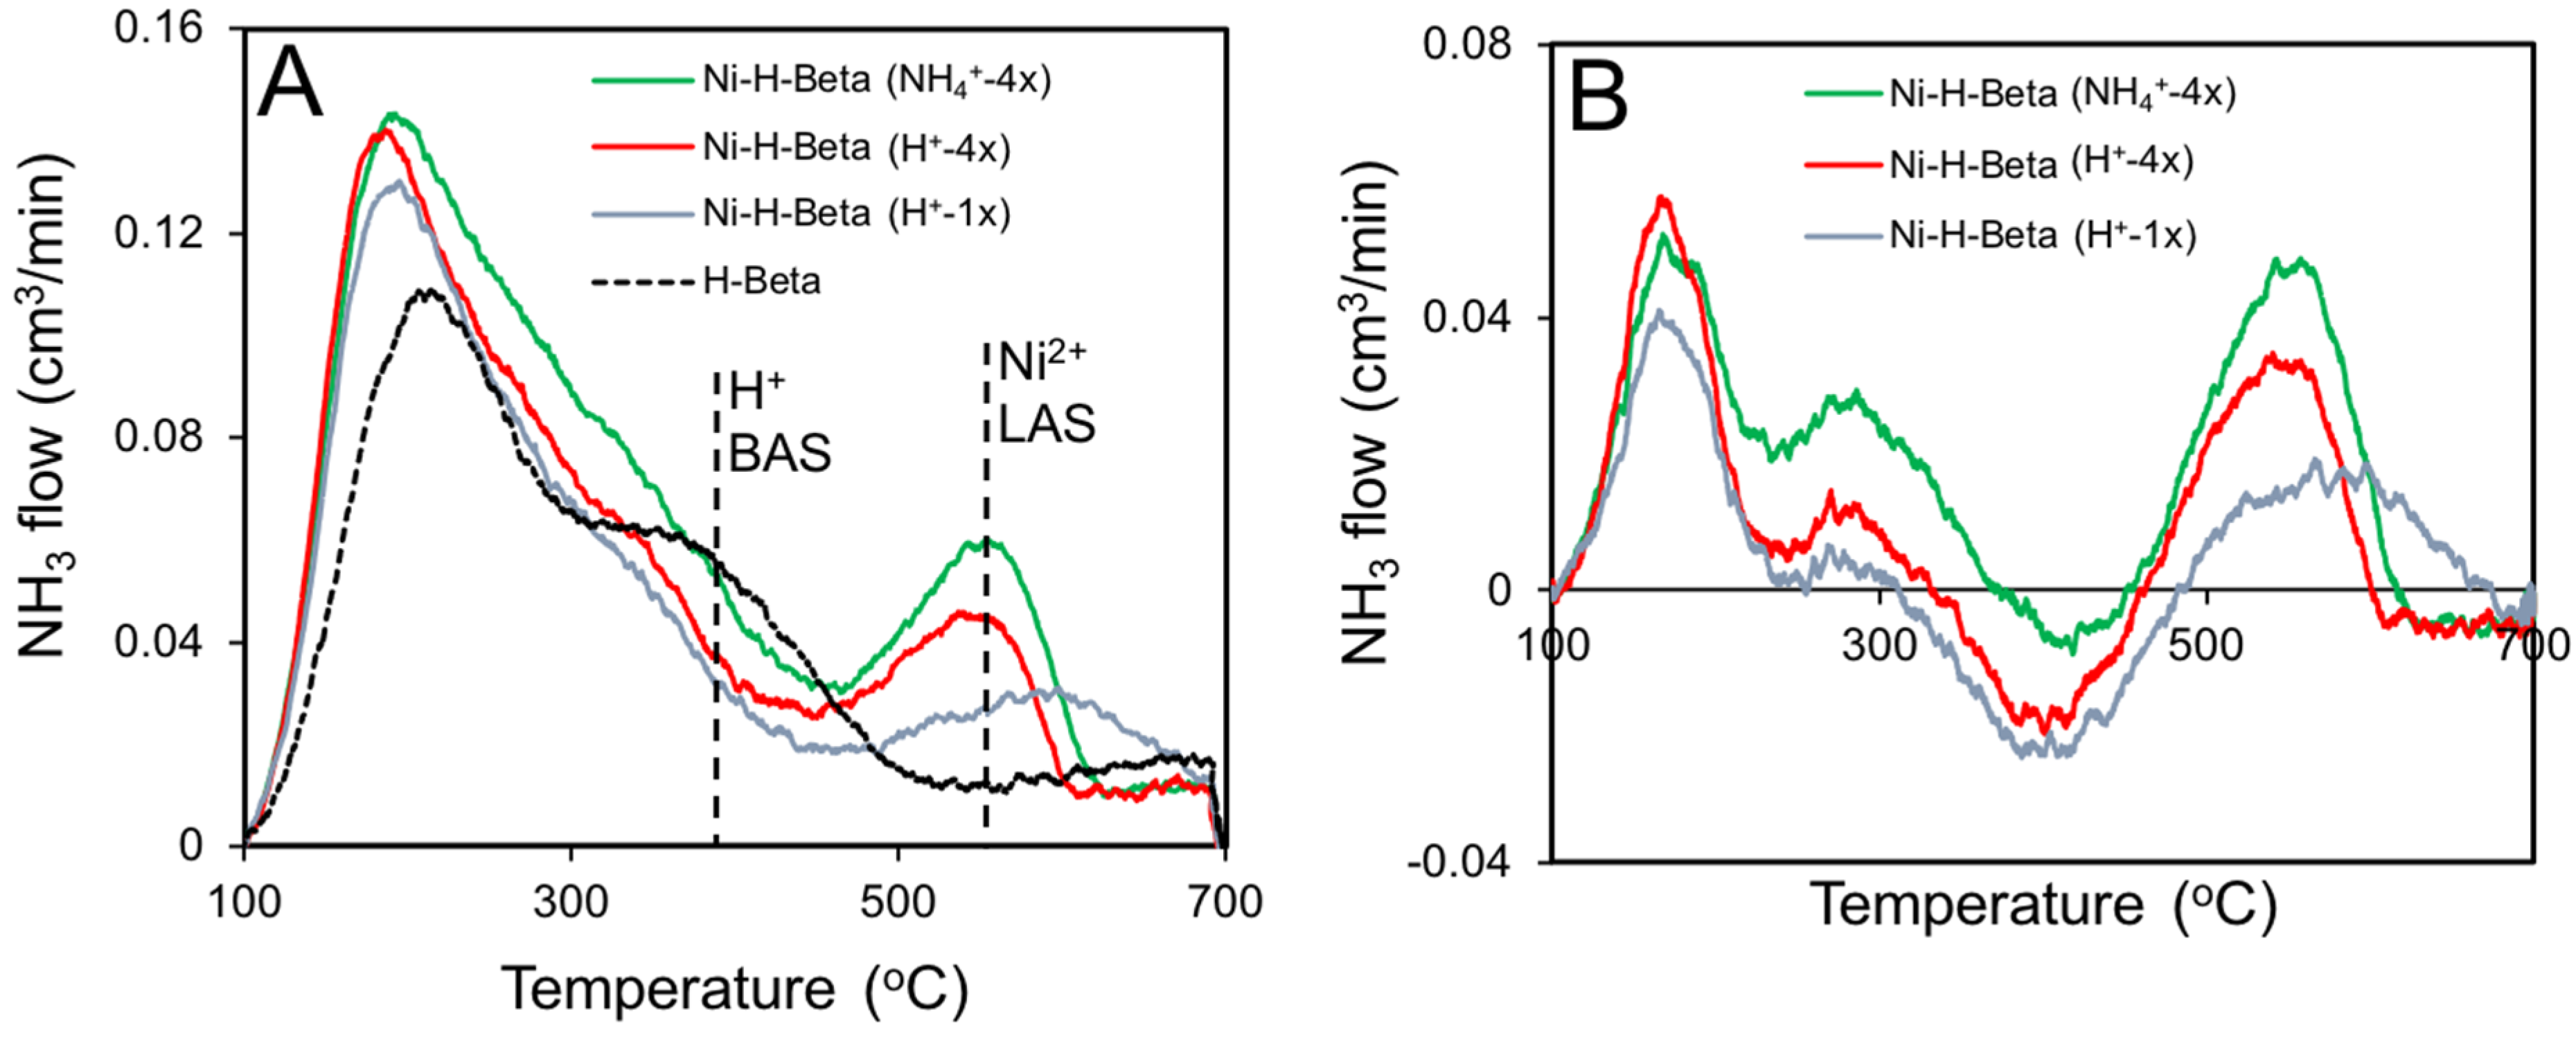
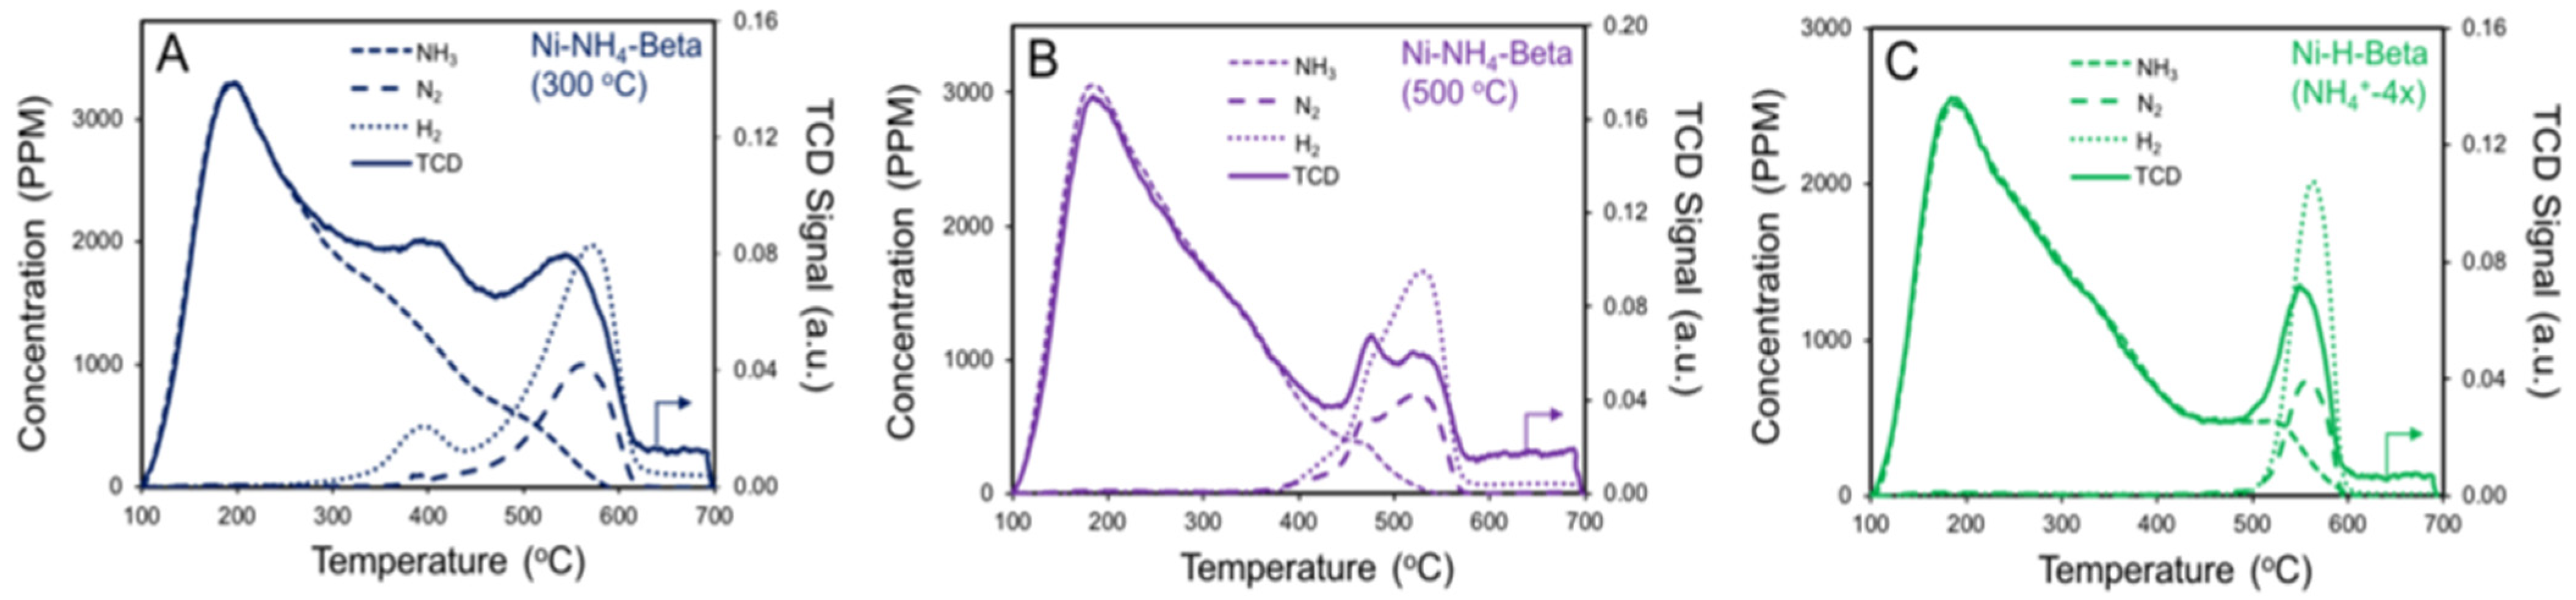
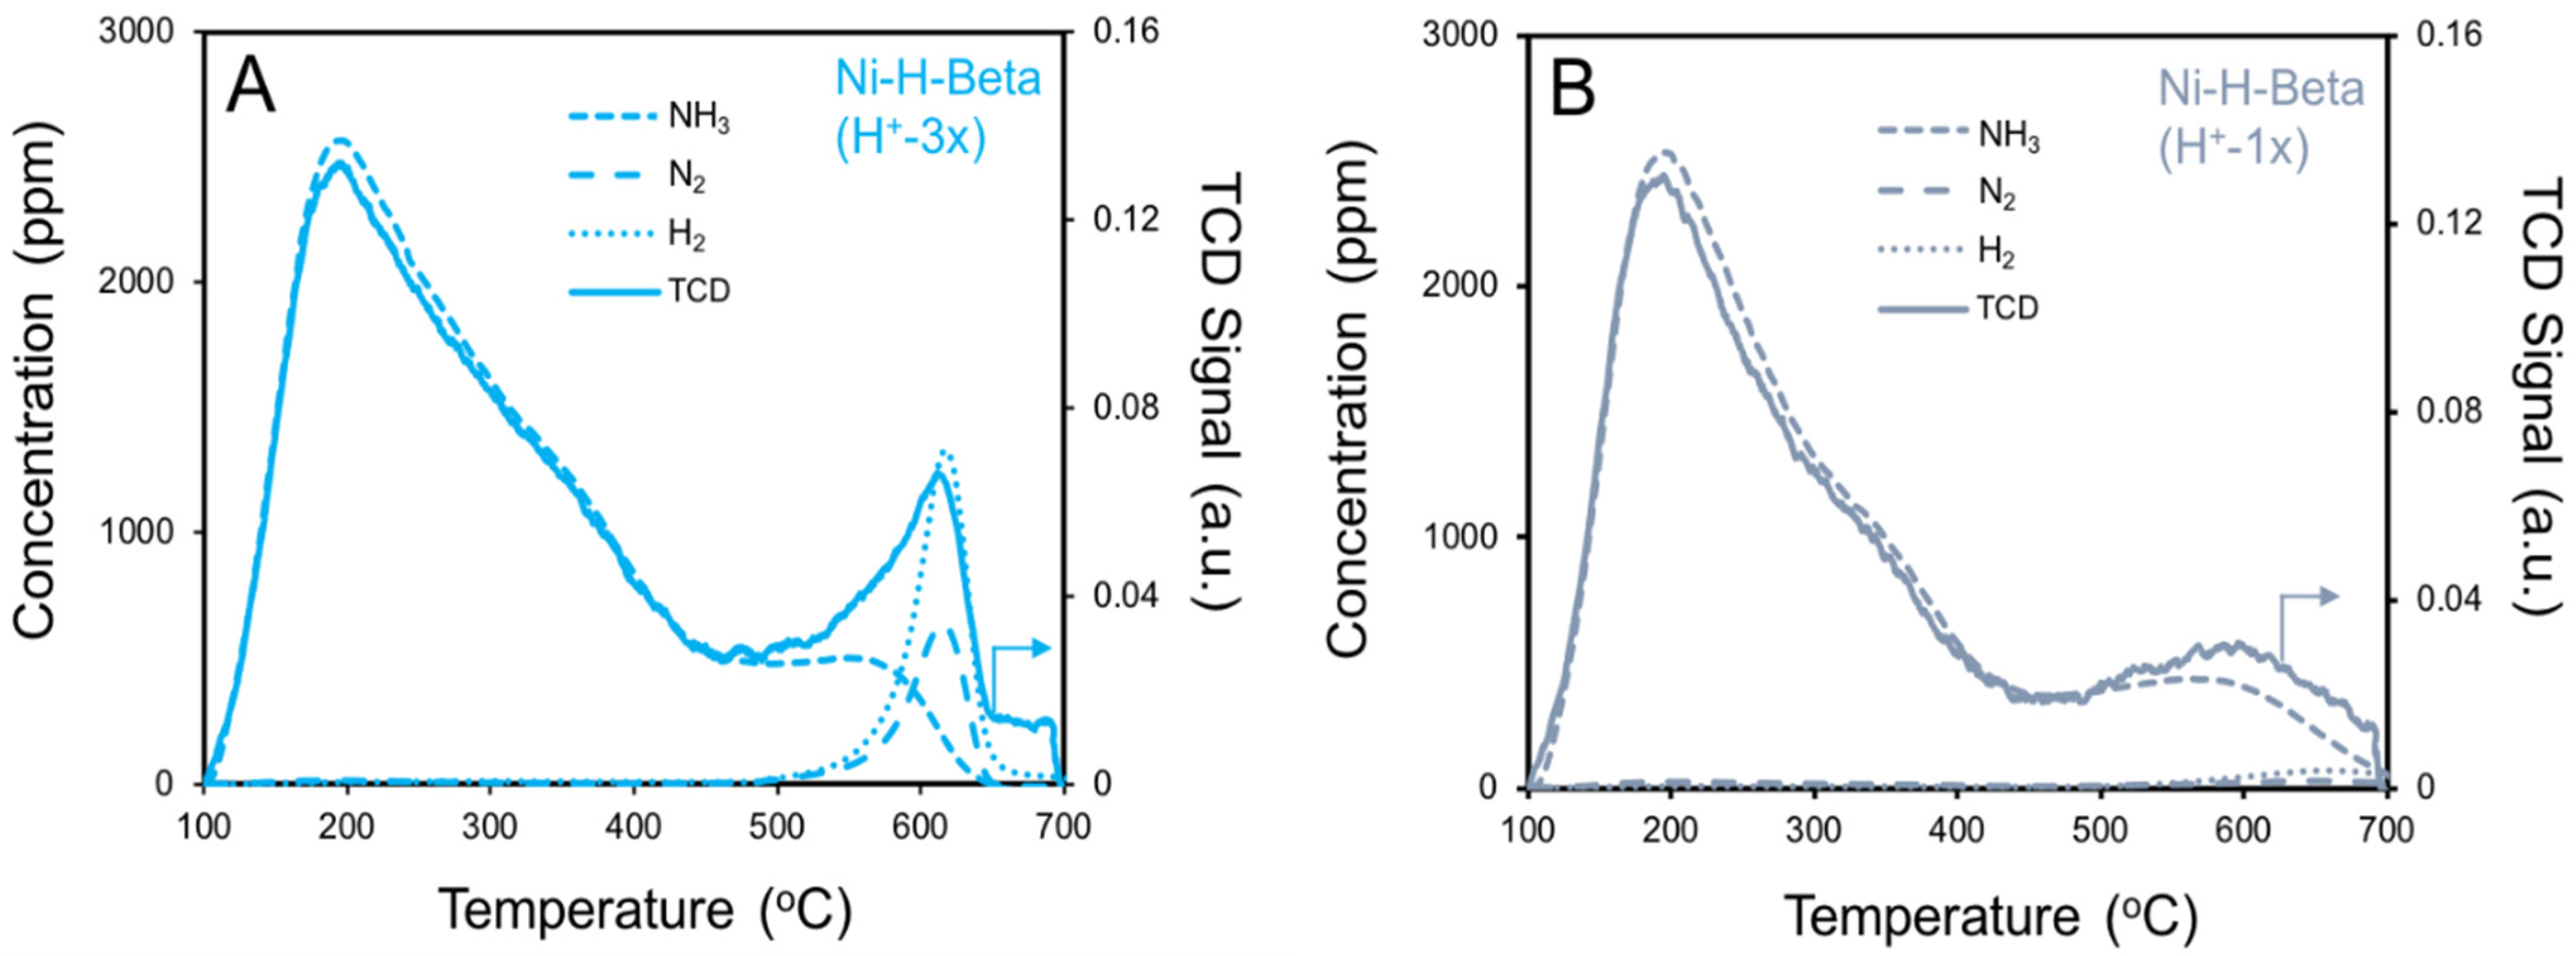
2.4. NH3 TPD
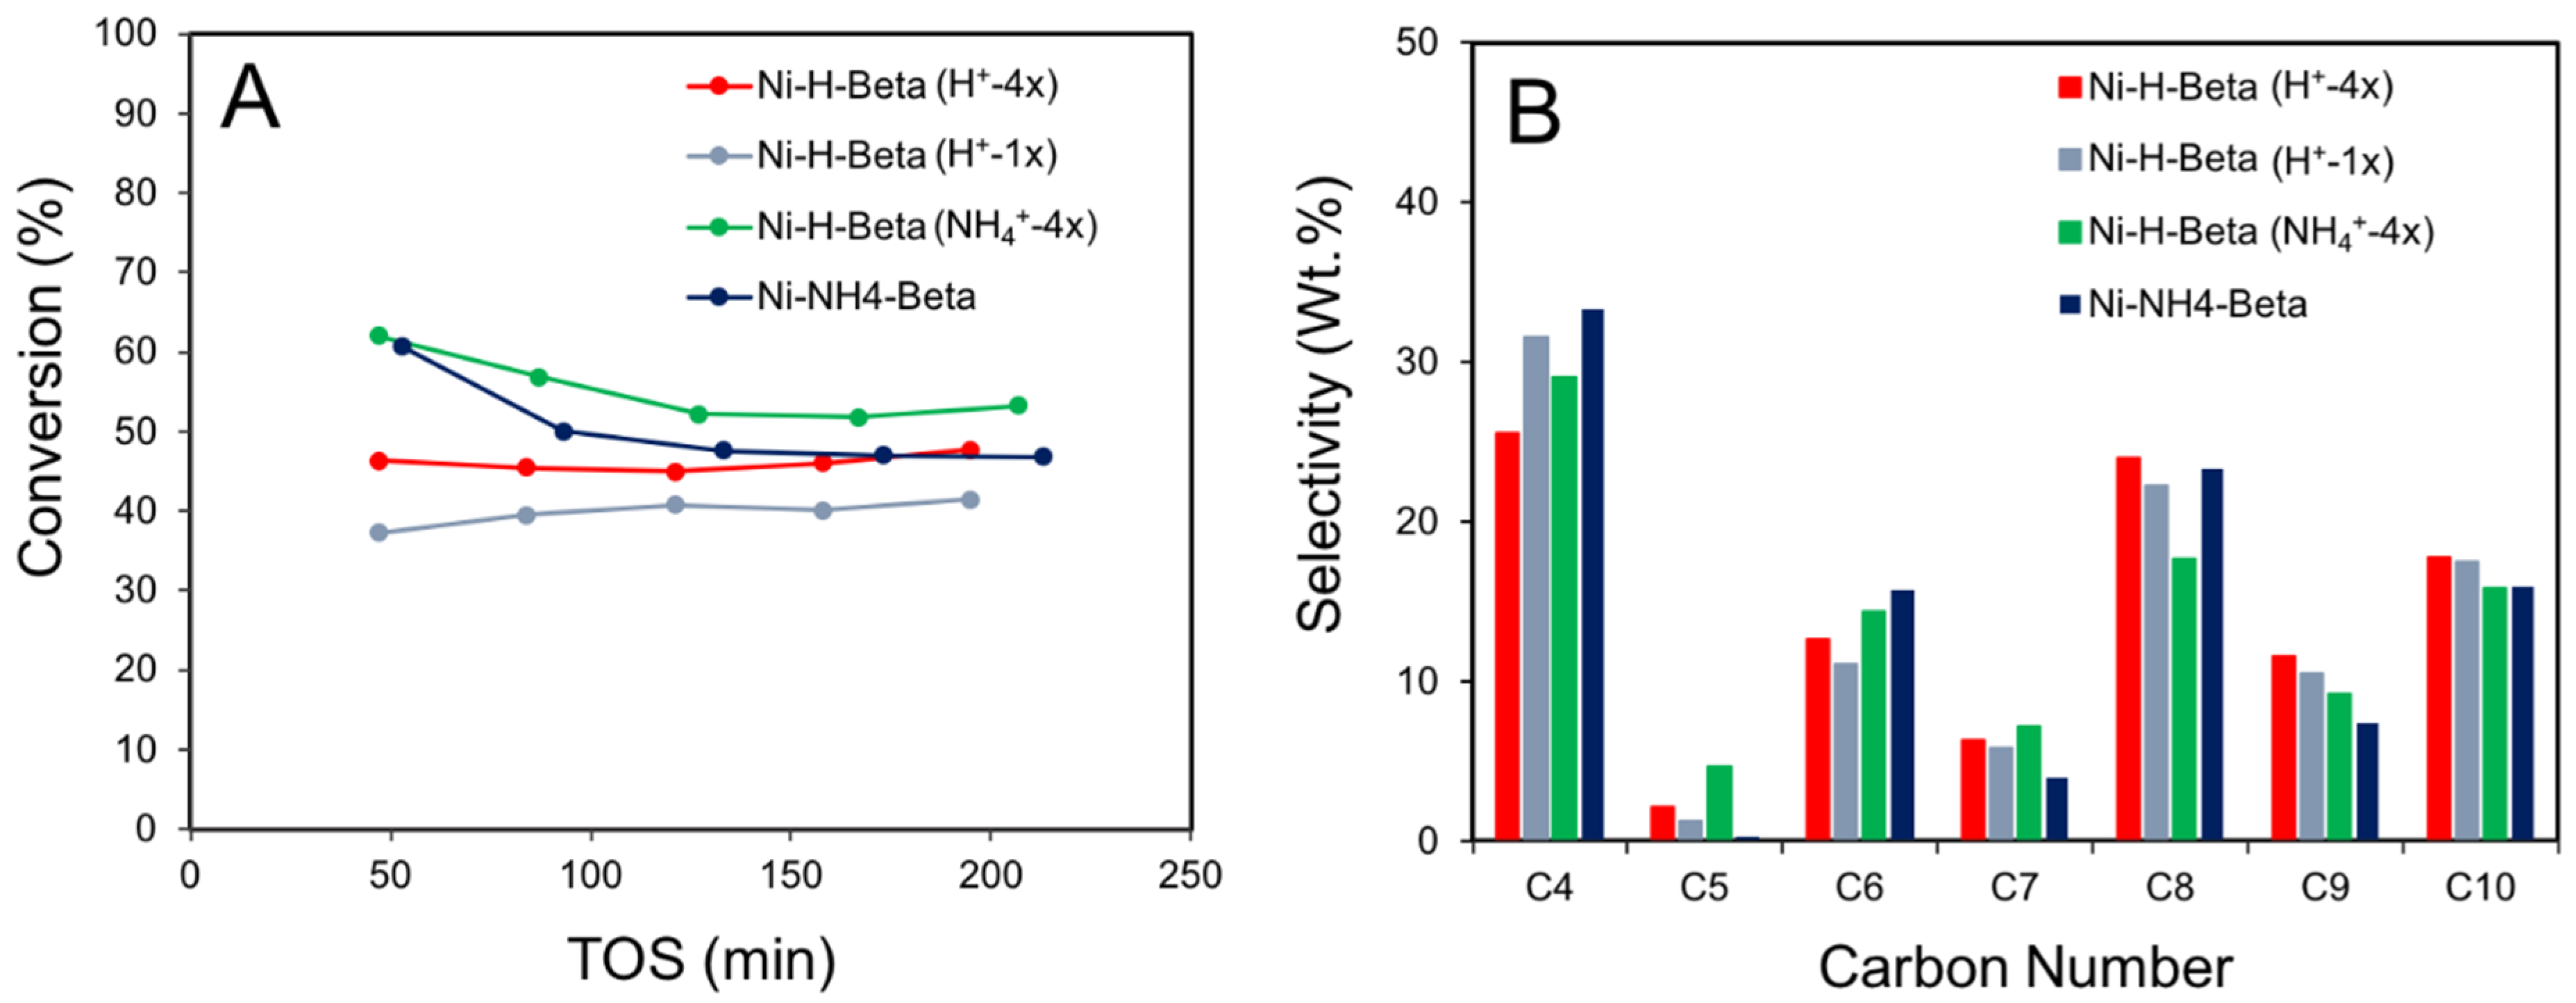
2.5. Ethylene Oligomerization
3. Materials and Methods
3.1. Catalyst Preparation
3.2. Catalyst Characterization
3.3. Ethylene Oligomerization
4. Conclusions
Supplementary Materials
Author Contributions
Funding
Data Availability Statement
Acknowledgments
Conflicts of Interest
References
- Weyant, C.; Shepson, P.; Subramanian, R.; Cambaliza, M.; Heimburger, A.; McCabe, D.; Baum, E.; Stirm, B.; Bond, T. Black carbon emissions from associated natural gas flaring. Environ. Sci. Technol. 2016, 50, 2075–2081. [Google Scholar] [CrossRef]
- Feijoo, F.; Iyer, G.; Avraam, C.; Siddiqui, S.; Clarke, L.; Sankaranarayanan, S.; Binsted, M.; Patel, P.; Prates, N.; Torres-Alfaro, E.; et al. The future of natural gas infrastructure development in the United States. Appl. Energy 2018, 228, 149–166. [Google Scholar] [CrossRef]
- Neal, L.; Haribal, V.; McCaig, J.; Lamb, H.; Li, F. Modular-scale ethane to liquids via chemical looping oxidative dehydrogenation: Redox catalyst performance and process analysis. J. Adv. Manuf. Process. 2019, 1, e10015. [Google Scholar] [CrossRef]
- Novotný, P.; Yusuf, S.; Li, F.; Lamb, H. Oxidative dehydrogenation of ethane using MoO3/Fe2O3 catalysts in a cyclic redox mode. Catal. Today 2018, 317, 50–55. [Google Scholar] [CrossRef]
- Lutz, E. Shell higher olefins process. J. Chem. Educ. 1986, 63, 202. [Google Scholar] [CrossRef]
- Small, B.; Brookhart, M. Iron-based catalysts with exceptionally high activities and selectivities for oligomerization of ethylene to linear α-Olefins. J. Am. Chem. Soc. 1998, 120, 7143–7144. [Google Scholar] [CrossRef]
- Lallemand, M.; Finiels, A.; Fajula, F.; Hulea, V. Catalytic oligomerization of ethylene over Ni-containing dealuminated Y zeolites. Appl. Catal. A Gen. 2006, 301, 196–201. [Google Scholar] [CrossRef]
- Lallemand, M.; Rusu, O.; Dumitriu, E.; Finiels, A.; Fajula, F.; Hulea, V. NiMCM-36 and NiMCM-22 catalysts for the ethylene oligomerization: Effect of zeolite texture and nickel cations/acid sites ratio. Appl. Catal. A Gen. 2008, 338, 37–43. [Google Scholar] [CrossRef]
- Heydenrych, M.; Nicolaides, C.; Scurrell, M. Oligomerization of ethene in a slurry reactor using a nickel(II)-exchanged silica–alumina catalyst. J. Catal. 2001, 197, 49–57. [Google Scholar] [CrossRef]
- Andrei, R.; Popa, M.; Fajula, F.; Hulea, V. Heterogeneous oligomerization of ethylene over highly active and stable Ni-AlSBA-15 mesoporous catalysts. J. Catal. 2015, 323, 76–84. [Google Scholar] [CrossRef]
- Lee, M.; Yoon, J.; Kim, Y.; Yoon, J.; Chae, H.; Han, Y.; Hwang, D. Ni/SIRAL-30 as a heterogeneous catalyst for ethylene oligomerization. Appl. Catal. A Gen. 2018, 562, 87–93. [Google Scholar] [CrossRef]
- Lehmann, T.; Wolff, T.; Zahn, V.; Veit, P.; Hamel, C.; Seidel-Morgenstern, A. Preparation of Ni-MCM-41 by equilibrium adsorption—Catalytic evaluation for the direct conversion of ethene to propene. Catal. Commun. 2011, 12, 368–374. [Google Scholar] [CrossRef]
- Martínez, A.; Arribas, M.; Concepción, P.; Moussa, S. New Bifunctional Ni–H-Beta Catalysts for the heterogeneous oligomerization of ethylene. Appl. Catal. A Gen. 2013, 467, 509–518. [Google Scholar]
- Jan, O.; Song, K.; Dichiara, A.; Resende, F. Ethylene oligomerization over Ni–Hβ heterogeneous catalysts. Ind. Eng. Chem. Res 2018, 57, 10241–10250. [Google Scholar] [CrossRef]
- Henry, R.; Komurcu, M.; Ganjkhanlou, Y.; Brogaard, R.; Lu, L.; Jens, K.; Berlier, G.; Olsbye, U. Ethene oligomerization on nickel microporous and mesoporous-supported catalysts: Investigation of the active sites. Catal. Today 2018, 299, 154–163. [Google Scholar] [CrossRef]
- Brogaard, R.; Olsbye, U. Ethene oligomerization in Ni-containing zeolites: Theoretical discrimination of reaction mechanisms. ACS Catal. 2016, 6, 1205–1214. [Google Scholar] [CrossRef]
- Joshi, R.; Zhang, G.; Miller, J.; Gounder, R. Evidence for the coordination–insertion mechanism of ethene dimerization at nickel cations exchanged onto beta molecular sieves. ACS Catal. 2018, 8, 11407–11422. [Google Scholar] [CrossRef]
- Moussa, S.; Arribas, M.; Concepcion, P.; Martinez, A. Heterogeneous oligomerization of ethylene to liquids on bifunctional Ni-Based Catalysts: The influence of support properties on nickel speciation and catalytic performance. Catal. Today 2016, 277, 78–88. [Google Scholar] [CrossRef]
- Seufitelli, G.; Park, J.; Tran, P.; Dichiara, A.; Resende, F.; Gustafson, R. Kinetics of ethylene oligomerization over Ni-H-beta catalysts. J. Catal. 2021, 401, 40–53. [Google Scholar]
- Lónyi, F.; Valyon, J. A TPD and IR study of the surface species formed from ammonia on zeolite H-ZSM-5, H-Mordenite and H-Beta. Thermochim. Acta 2001, 373, 53–57. [Google Scholar] [CrossRef]
- Rice, M.J.; Chakraborty, A.K.; Bell, A.T. Site availability and competitive siting of divalent metal cations in ZSM-5. J. Catal. 2000, 194, 278–285. [Google Scholar] [CrossRef]
- Kunkeler, P.; Zuurdeeg, B.; van der Waal, J.; van Bokhoven, J.; Koningsberger, D.; van Bekkum, H. zeolite Beta: The relationship between calcination procedure, aluminum configuration, and Lewis acidity. J. Catal. 1998, 180, 234–244. [Google Scholar] [CrossRef]
- Wouters, B.H.; Chen, T.H.; Grobet, P.J. Reversible tetrahedral-octahedral framework aluminum transformation in zeolite Y. J. Am. Chem. Soc. 1998, 120, 11419–11425. [Google Scholar] [CrossRef]
- Bourgeat-Lami, E.; Massiani, P.; Di Renzo, F.; Espiau, P.; Fajula, F.; Des Courieres, T. Study of the state of aluminium in zeolite Beta. Appl. Catal. 1991, 72, 139–152. [Google Scholar] [CrossRef]
- Abraham, A.; Lee, S.; Shin, C.; Bong Hong, S.; Prins, R.; van Bokhoven, J. Influence Of framework silicon to aluminium ratio on aluminium coordination and distribution in zeolite beta investigated by 27Al MAS and 27Al MQ MAS NMR. Phys. Chem. Chem. Phys. 2004, 6, 3031. [Google Scholar] [CrossRef]
- Ravi, M.; Sushkevich, V.L.; van Bokhoven, J.A. Towards a better understanding of Lewis acidic aluminium in zeolites. Nat. Mater. 2020, 19, 1047–1056. [Google Scholar] [CrossRef] [PubMed]
- Penkova, A.; Dzwigaj, S.; Kefirov, R.; Hadjiivanov, K.; Che, M. Effect of the preparation method on the state of nickel ions in BEA zeolites. A study by fourier transform infrared spectroscopy of adsorbed CO and NO, temperature-programmed reduction, and X-ray diffraction. J. Phys. Chem. C 2007, 111, 8623–8631. [Google Scholar] [CrossRef]
- Kyounghwan, L.; Hong, S.B. Ethene dimerization over Ni-beta catalysts prepared by solid-state ion exchange. Appl. Catal. A Gen. 2021, 615, 118059. [Google Scholar]
- Suzuki, M.; Tsutsumi, K.; Takahashi, H.; Saito, Y. Study on reducibility of nickel ions in zeolite Y. Zeolites 1989, 9, 98–103. [Google Scholar] [CrossRef]
- Stoyanova, M.; Bentrup, U.; Atia, H.; Kondratenko, E.; Linke, D.; Rodemerck, U. The role of speciation Of Ni2+ and its interaction with the support for selectivity and stability in the conversion of ethylene to propene. Catal. Sci. Technol. 2019, 9, 3137–3148. [Google Scholar]
- Mihályi, R.; Lónyi, F.; Beyer, H.; Szegedi, Á.; Kollár, M.; Pál-Borbély, G.; Valyon, J. N-Heptane hydroconversion over nickel-loaded aluminum- and/or boron-containing BEA zeolites prepared by recrystallization of magadiite varieties. J. Mol. Catal. A Chem. 2013, 367, 77–88. [Google Scholar] [CrossRef]
- Ward, J.W. The nature of active sites on zeolites III. The alkali and alkaline earth ion-exchanged forms. J. Catal. 1968, 10, 34–46. [Google Scholar] [CrossRef]
- Jacobs, P.A. Metal clusters and zeolites. In Metal Clusters in Catalysis; Gates, B.C., Guczi, L., Knozinger, H., Eds.; Elsevier: Amsterdam, the Netherlands, 1986; pp. 357–414. [Google Scholar]
- Hoang, D.; Berndt, H.; Miessner, H.; Schreier, E.; Völter, J.; Lieske, H. Nickel modified H-ZSM-5 catalysts. Appl. Catal. A Gen. 1994, 114, 295–311. [Google Scholar] [CrossRef]
- Kiricsi, I.; Flego, C.; Pazzuconi, G.; Parker, W.; Millini, R.; Perego, C.; Bellussi, G. Progress toward understanding zeolite beta acidity: An IR and 27Al NMR spectroscopic study. J. Phys. Chem. 1994, 98, 4627–4634. [Google Scholar] [CrossRef]
- Newsam, J.M.; Treacy, M.M.J.; Koetsier, W.T.; De Gruyter, C.B. Structural characterization of zeolite beta. Proc. R. Soc. A. 1988, 420, 375–405. [Google Scholar]
- Marques, J.; Gener, I.; Ayrault, P.; Bordado, J.; Lopes, J.; Ramôa Ribeiro, F.; Guisnet, M. Infrared spectroscopic study of the acid properties of dealuminated BEA zeolites. Microporous Mesoporous Mater. 2003, 60, 251–262. [Google Scholar] [CrossRef]
- Shannon, R.D.; Gardner, K.H.; Staley, R.H. The nature of the nonframework aluminum species formed during the dehydroxylation of H-Y. J. Phys. Chem. 1985, 89, 4778–4788. [Google Scholar] [CrossRef]
- Zholobenko, V.; Kustov, L.; Kazansky, V.; Loeffler, E.; Lohser, U.; Peuker, C.; Oehlmann, G. On The possible nature of sites responsible for the enhancement of cracking activity of HZSM-5 zeolites dealuminated under mild steaming conditions. Zeolites 1990, 10, 304–306. [Google Scholar] [CrossRef]
- Jacobs, P.A. Evidence for the nature of true Lewis sites in faujasite-type zeolites. J. Phys. Chem. 1979, 83, 1174. [Google Scholar] [CrossRef]
- Vimont, A.; Thibault-Starzyk, F.; Lavalley, J.C. Infrared spectroscopic study of the acidiobasic properties of zeolite beta. J. Phys. Chem. 2000, 104, 286–291. [Google Scholar] [CrossRef]
- Sobalík, Z.; Dêdecek, J.; Kaucký, D.; Wichterlová, B.; Drozdová, L.; Prins, R.J. Structure, distribution, and properties of Co ions in ferrierite revealed by FTIR, UV–Vis, and EXAFS. J. Catal. 2000, 194, 330–342. [Google Scholar] [CrossRef]
- Borfecchia, E.; Lomachenko, K.; Giordanino, F.; Falsig, H.; Beato, P.; Soldatov, A.; Bordiga, S.; Lamberti, C. Revisiting the nature of Cu sites in the activated Cu-SSZ-13 catalyst for SCR reaction. Chem. Sci. 2015, 6, 548–563. [Google Scholar] [CrossRef] [PubMed]
- Hall, D.; Lockwood, D.; Poirier, S.; Bock, C.; MacDougall, B. Raman and infrared spectroscopy of A and Β phases of thin nickel hydroxide films electrochemically formed on Nickel. J. Phys. Chem. A 2012, 116, 6771–6784. [Google Scholar] [CrossRef] [PubMed]
- Dedecek, J. Siting and distribution of the Co ions in zeolite beta: A UV–Vis–NIR and FTIR study. J. Catal. 2002, 211, 198–207. [Google Scholar] [CrossRef]
- Hun Kwak, J.; Zhu, H.; Lee, J.; Peden, C.; Szanyi, J. Two different cationic positions in Cu-SSZ-13. Chem. Commun. 2012, 48, 4758. [Google Scholar] [CrossRef] [PubMed]
- Hadjiivanov, K.; Knözinger, H.; Mihaylov, M. FTIR Study of CO adsorption on Ni−ZSM-5. J. Phys. Chem. B 2002, 106, 2618–2624. [Google Scholar] [CrossRef]
- Mihaylov, M.; Hadjiivanov, K. FTIR study of CO and NO adsorption and coadsorption on Ni-ZSM-5 and Ni/SiO2. Langmuir 2002, 18, 4376–4383. [Google Scholar] [CrossRef]
- Hadjivanov, K.; Vayssilov, G. Characterization of oxide surfaces and zeolites by carbon monoxide as an IR probe molecule. Adv. Catal. 2002, 47, 307–511. [Google Scholar] [CrossRef]
- Góra-Marek, K.; Glanowska, A.; Datka, J. Quantitative IR studies of the concentration of different nickel sites in NiZSM-5 zeolites. Microporous Mesoporous Mater. 2012, 158, 162–169. [Google Scholar] [CrossRef]
- Campa, M.; Pietrogiacomi, D.; Occhiuzzi, M. The simultaneous selective catalytic reduction of N2O and NOX with CH4 on Co- and Ni-exchanged mordenite. Appl. Catal. B 2015, 168–169, 293–302. [Google Scholar] [CrossRef]
- Yan, P.; Li, M.; Kennedy, E.; Adesina, A.; Zhao, G.; Setiawan, A.; Stockenhuber, M. The role of acid and metal sites in hydrodeoxygenation of guaiacol over Ni/Beta catalysts. Catal. Sci. Technol. 2020, 10, 810–825. [Google Scholar] [CrossRef]
- Lin, T.; Meng, X.; Shi, L. Ni-exchanged Y-Zeolite: An efficient heterogeneous catalyst for acetylene hydrocarboxylation. Appl. Catal. A Gen. 2014, 485, 163–171. [Google Scholar] [CrossRef]
- Hu, Z.; Weng, C.; Chen, C.; Yuan, Z. Catalytic decomposition of ammonia to COX-free hydrogen over Ni/ZSM-5 catalysts: A comparative study of the preparation methods. Appl. Catal. A Gen. 2018, 562, 49–57. [Google Scholar] [CrossRef]
- Toch, K.; Thybaut, J.; Arribas, M.; Martínez, A.; Marin, G. Steering linear 1-Alkene, propene or gasoline yields in ethene oligomerization via the interplay between nickel and acid sites. Chem. Eng. Sci. 2017, 173, 49–59. [Google Scholar] [CrossRef]
- Lallemand, M.; Finiels, A.; Fajula, F.; Hulea, V. Nature of The active sites in ethylene oligomerization catalyzed by Ni-containing molecular sieves: Chemical and IR spectral investigation. J. Phys. Chem C 2009, 113, 20360–20364. [Google Scholar] [CrossRef]
- Hulea, V.; Fajula, F. Ni-exchanged AlMCM-41: An efficient bifunctional catalyst for ethylene oligomerization. J. Catal. 2004, 225, 213–222. [Google Scholar] [CrossRef]


| Catalyst a | Ni (wt.%) | SBET (m2/g) | Ni/FAl Molar Ratio b | TPR H/Ni Ratio | NH3/Ni Ratio d | H2/N2 Ratio d | |
|---|---|---|---|---|---|---|---|
| 300 °C c | 500 °C c | ||||||
| Ni-H-Beta (H+-4x) | 2.02 | 620 | 0.41 | 1.56 | 1.56 | n/a | n/a |
| Ni-H-Beta (H+-3x) | 2.14 | n/a | 0.44 | 1.50 | 1.43 | 0.43 | 2.0 |
| Ni-H-Beta (H+-2x) | 1.98 | 610 | 0.40 | 1.43 | 1.45 | 0.71 | - |
| Ni-H-Beta (H+-1x) | 1.17 | n/a | 0.24 | 1.31 | n/a | 0.84 | - |
| Ni-H-Beta (NH4+-4x) | 2.64 | 602 | 0.54 | 1.98 | n/a | 0.44 | 2.6 |
| Ni-NH4-Beta e | 2.54 | 560 | 0.52 | 2.21 | 1.75 | 0.80 | 2.1 |
Publisher’s Note: MDPI stays neutral with regard to jurisdictional claims in published maps and institutional affiliations. |
© 2022 by the authors. Licensee MDPI, Basel, Switzerland. This article is an open access article distributed under the terms and conditions of the Creative Commons Attribution (CC BY) license (https://creativecommons.org/licenses/by/4.0/).
Share and Cite
McCaig, J.; Lamb, H.H. Ni-H-Beta Catalysts for Ethylene Oligomerization: Impact of Parent Cation on Ni Loading, Speciation, and Siting. Catalysts 2022, 12, 824. https://doi.org/10.3390/catal12080824
McCaig J, Lamb HH. Ni-H-Beta Catalysts for Ethylene Oligomerization: Impact of Parent Cation on Ni Loading, Speciation, and Siting. Catalysts. 2022; 12(8):824. https://doi.org/10.3390/catal12080824
Chicago/Turabian StyleMcCaig, Joseph, and H. Henry Lamb. 2022. "Ni-H-Beta Catalysts for Ethylene Oligomerization: Impact of Parent Cation on Ni Loading, Speciation, and Siting" Catalysts 12, no. 8: 824. https://doi.org/10.3390/catal12080824
APA StyleMcCaig, J., & Lamb, H. H. (2022). Ni-H-Beta Catalysts for Ethylene Oligomerization: Impact of Parent Cation on Ni Loading, Speciation, and Siting. Catalysts, 12(8), 824. https://doi.org/10.3390/catal12080824