Article

Photocatalytic Conversion of Fructose to Lactic Acid by BiOBr/Zn@SnO2 Material

State Key Laboratory of Biobased Material and Green Papermaking, School of Environmental Science and Engineering, Qilu University of Technology (Shandong Academy of Sciences), Jinan 250353, China
*
Author to whom correspondence should be addressed.
Catalysts 2022, 12(7), 719; https://doi.org/10.3390/catal12070719
Submission received: 6 May 2022 / Revised: 24 June 2022 / Accepted: 27 June 2022 / Published: 30 June 2022

Abstract

:
Photocatalysis provides a prospective approach for achieving high-value products under mild conditions. To realize this, constructing a selective, low-cost and environmentally friendly photocatalyst is the most critical factor. In this study, BiOBr/Zn@SnO2 is fabricated by a one-pot hydrothermal synthesis method and BiOBr: SnO2 ratio is 3:1; this material is applied as photocatalyst in fructose selective conversion to lactic acid. The bandgap structure can be regulated via two-step modification, which includes Zn doping SnO2 and Zn@SnO2 coupling BiOBr. The photocatalyst shows excellent conversion efficiency in fructose and high selectivity in lactic acid generation under alkaline conditions. The conversion rate is almost 100%, and the lactic acid yield is 79.6% under optimal reaction conditions. The catalyst is highly sustainable in reusability; the lactic acid yield can reach 67.4% after five runs. The possible reaction mechanism is also proposed to disclose the photocatalysis processes.

1. Introduction

The irrational exploitation and use of non-renewable resources have caused a significant negative impact on the production and development of human society. Heavy ecological and environmental damage have seriously affected the survival quality and future of humanity. Biomass energy has been deemed as a promising alternative to solve this predicament. Among all the converted products, lactic acid has attracted considerable attention due to its wide application ranging from food to the cosmetic industries [1,2]. It is also one of the top-12 high-value bio-based platform molecules identified by the US Department of Energy [3,4]. In recent years, lactic acid has been used to synthesize high-value-added anilines via ruthenium-catalyzed amination, which provides a fast and efficient chemical method for the synthesis of amino acids from biomass. In addition, lactic acid can be used for the synthesis of polylactic acid, which is one of the most promising biodegradable plastics [5,6].
So far, there are two main approaches to lactic acid production: biological and chemical processes. The biological method mainly uses enzymes to hydrolyze carbohydrates to produce lactic acid. However, a series of defects such as slow reaction speed, high energy consumption, and rigorous raw material requirements make this method difficult to apply in large-scale utilization [7]. In recent years, there has been significant interest in the photoreforming (PR) of biomass, which relies on inexhaustible light energy to harness biomass to meet the low-carbon, high-sustainability goals. Biomass PR typically involves a hydrogen evolution reaction (HER) and biomass oxidation reactions (BOR), where HER occurs over a metal-loaded photocatalyst, reducing protons in water and producing H2 through the conduction band (CB) electrons [8]. However, the controllability and selectivity of BOR processes are challenging, due primarily to there being the existence of various possible pathways. Different reactive oxygen species (ROS), which including hydroxyl radicals, superoxide radicals, and electron holes are all considered to play a vital role in the process. It is imperative to improve the selective transformation in the process of BOR.
During the processes of photorefinery, efficient charge separation of the photocatalyst and suitable redox potential is critical to its catalysis performance. Duan et al. [9] proposed coupling heterojunctions formed by two different semiconductor materials to modify charge transfer, and Chaves et al. [10] suggested that bandgap engineering should be combined with homojunction as a means to modulate the redox potential and thus achieve efficient selection for sugar oxidation. Zhao et al. [11] chose Zn1-xCdxS to perform a series of experiments on the modulation of bandgap and redox potential. They found that the reduction in bandgap and the increase in redox potential could, to some extent, reduce the hydrogen precipitation reaction of sugars while increasing the oxidation reaction and improving the selectivity of lactic acid, but all of their studies suffer from low lactate yields. Meanwhile, the experiments of Zhao et al. [11] and Sun et al. [12] revealed that ·OH plays a key role in the photocatalytic conversion of sugars under weak alkaline conditions. Therefore, in the investigation of the photocatalytic conversion of fructose to lactic acid, the bandgap, redox potential, and hydroxyl radical production of the photocatalyst are essential conditions for the experiment’s success [13].
In previous research, many biomasses were utilized to generate liquid lactic acid through chemical processes—three-carbon sugars such as propanone [14,15], and six-carbon sugars such as hexose [16,17] and polysaccharide cellulose [18,19]. Fructose is a simple monosaccharide; it is a tautomer of glucose, mostly white crystal or crystalline powder, odorless, sweet, hygroscopic, very soluble in water, soluble in ethanol, methanol, insoluble in methane and ether, etc. [20]. In this research, it was selected as the material to generate lactic acid.
The coupling of SnO2 with Bi-containing semiconductor materials has been studied as a new trend for composites that can improve photocatalytic performance [21]. Due to the traditional preparation methods, which are time-consuming, energy-intensive and have low purity [22], some other methods were referenced in this study, such as modified SnO2 with BiOBr in one pot [23,24]. In this research, BiOBr and SnO2 were chosen as original semiconductor materials. The bandgap of the composite can further be adjusted and the redox potential was also regulated by loading Zn on SnO2. Both processing operations are beneficial to the selective transformation of fructose to lactic acid. The heterojunction was synthesized via coupling of BiOBr with the Zn-doped SnO2; the results indicated the catalyst had excellent selectivity toward lactic acid from fructose; the lactic acid selectivity was about 79.6%.

2. Results and Discussion

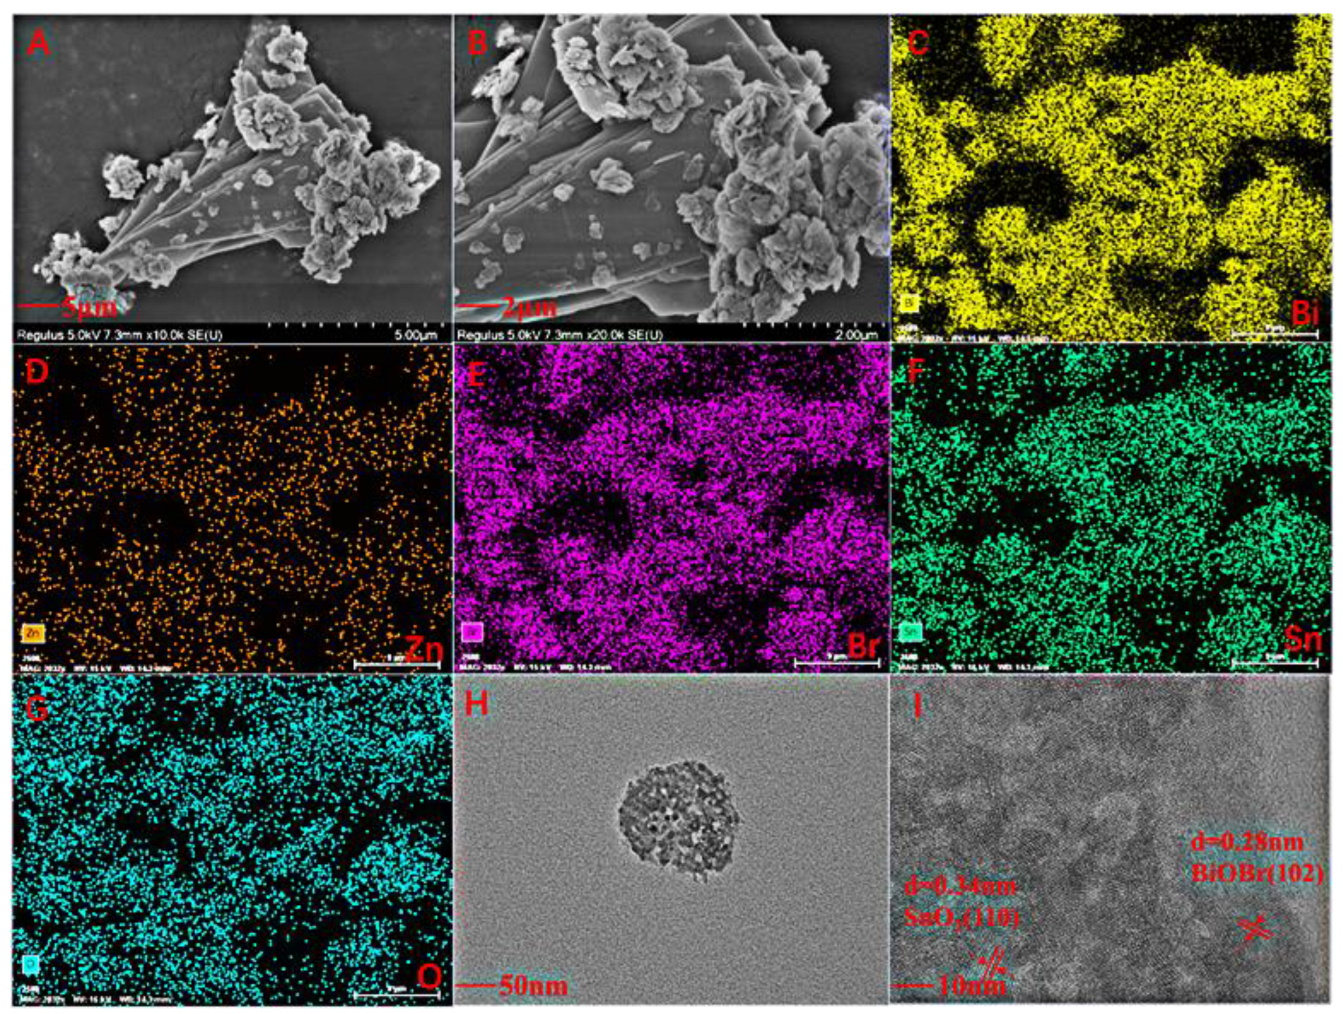
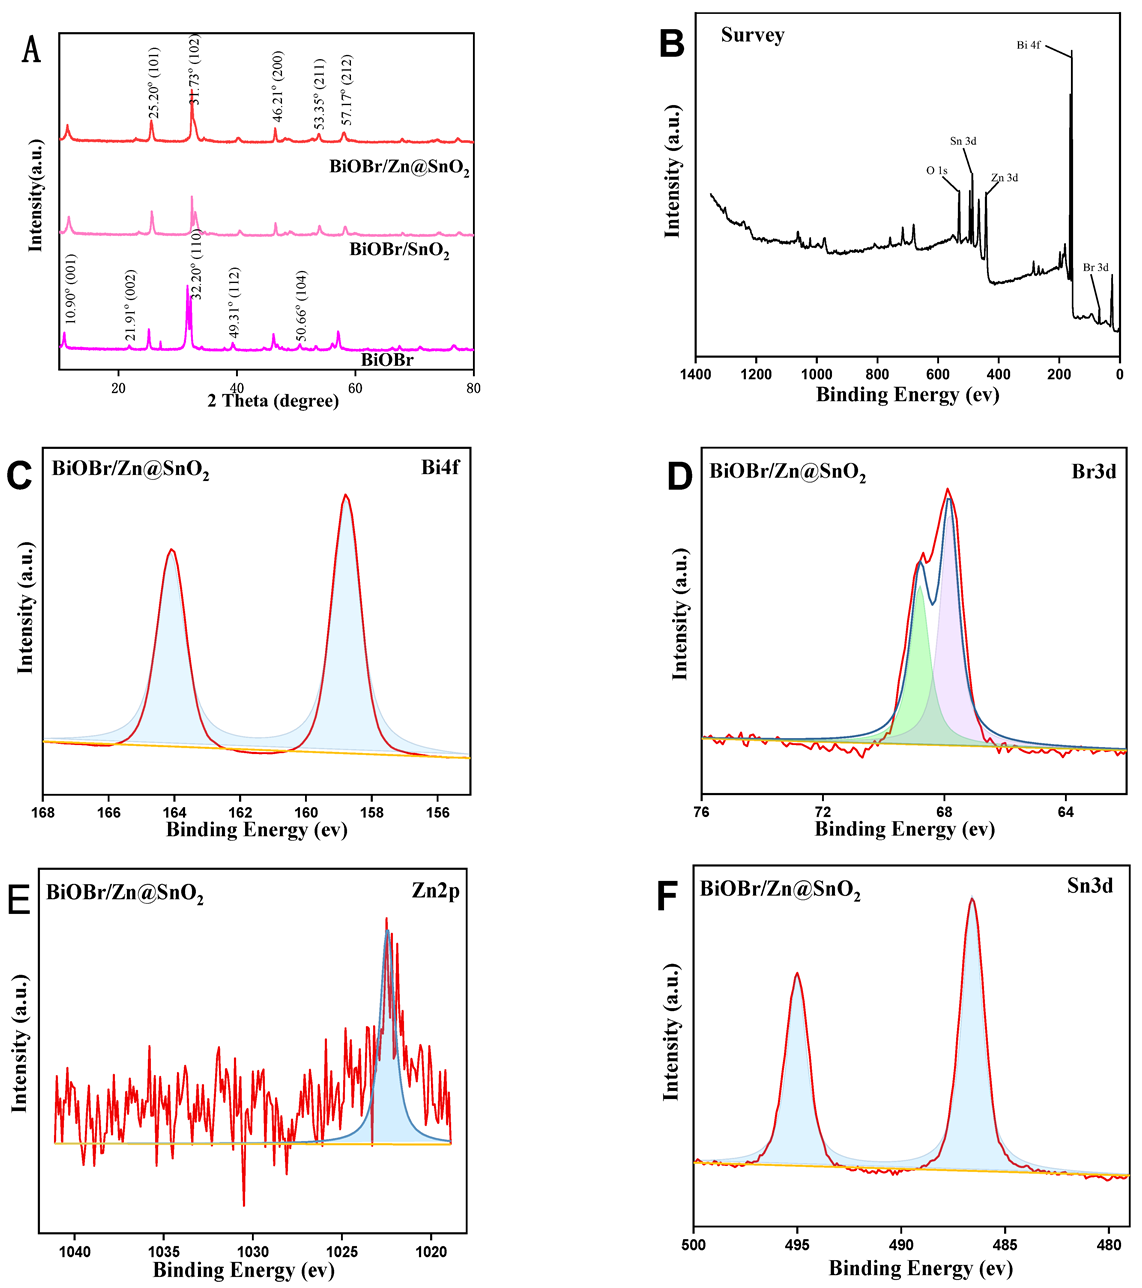
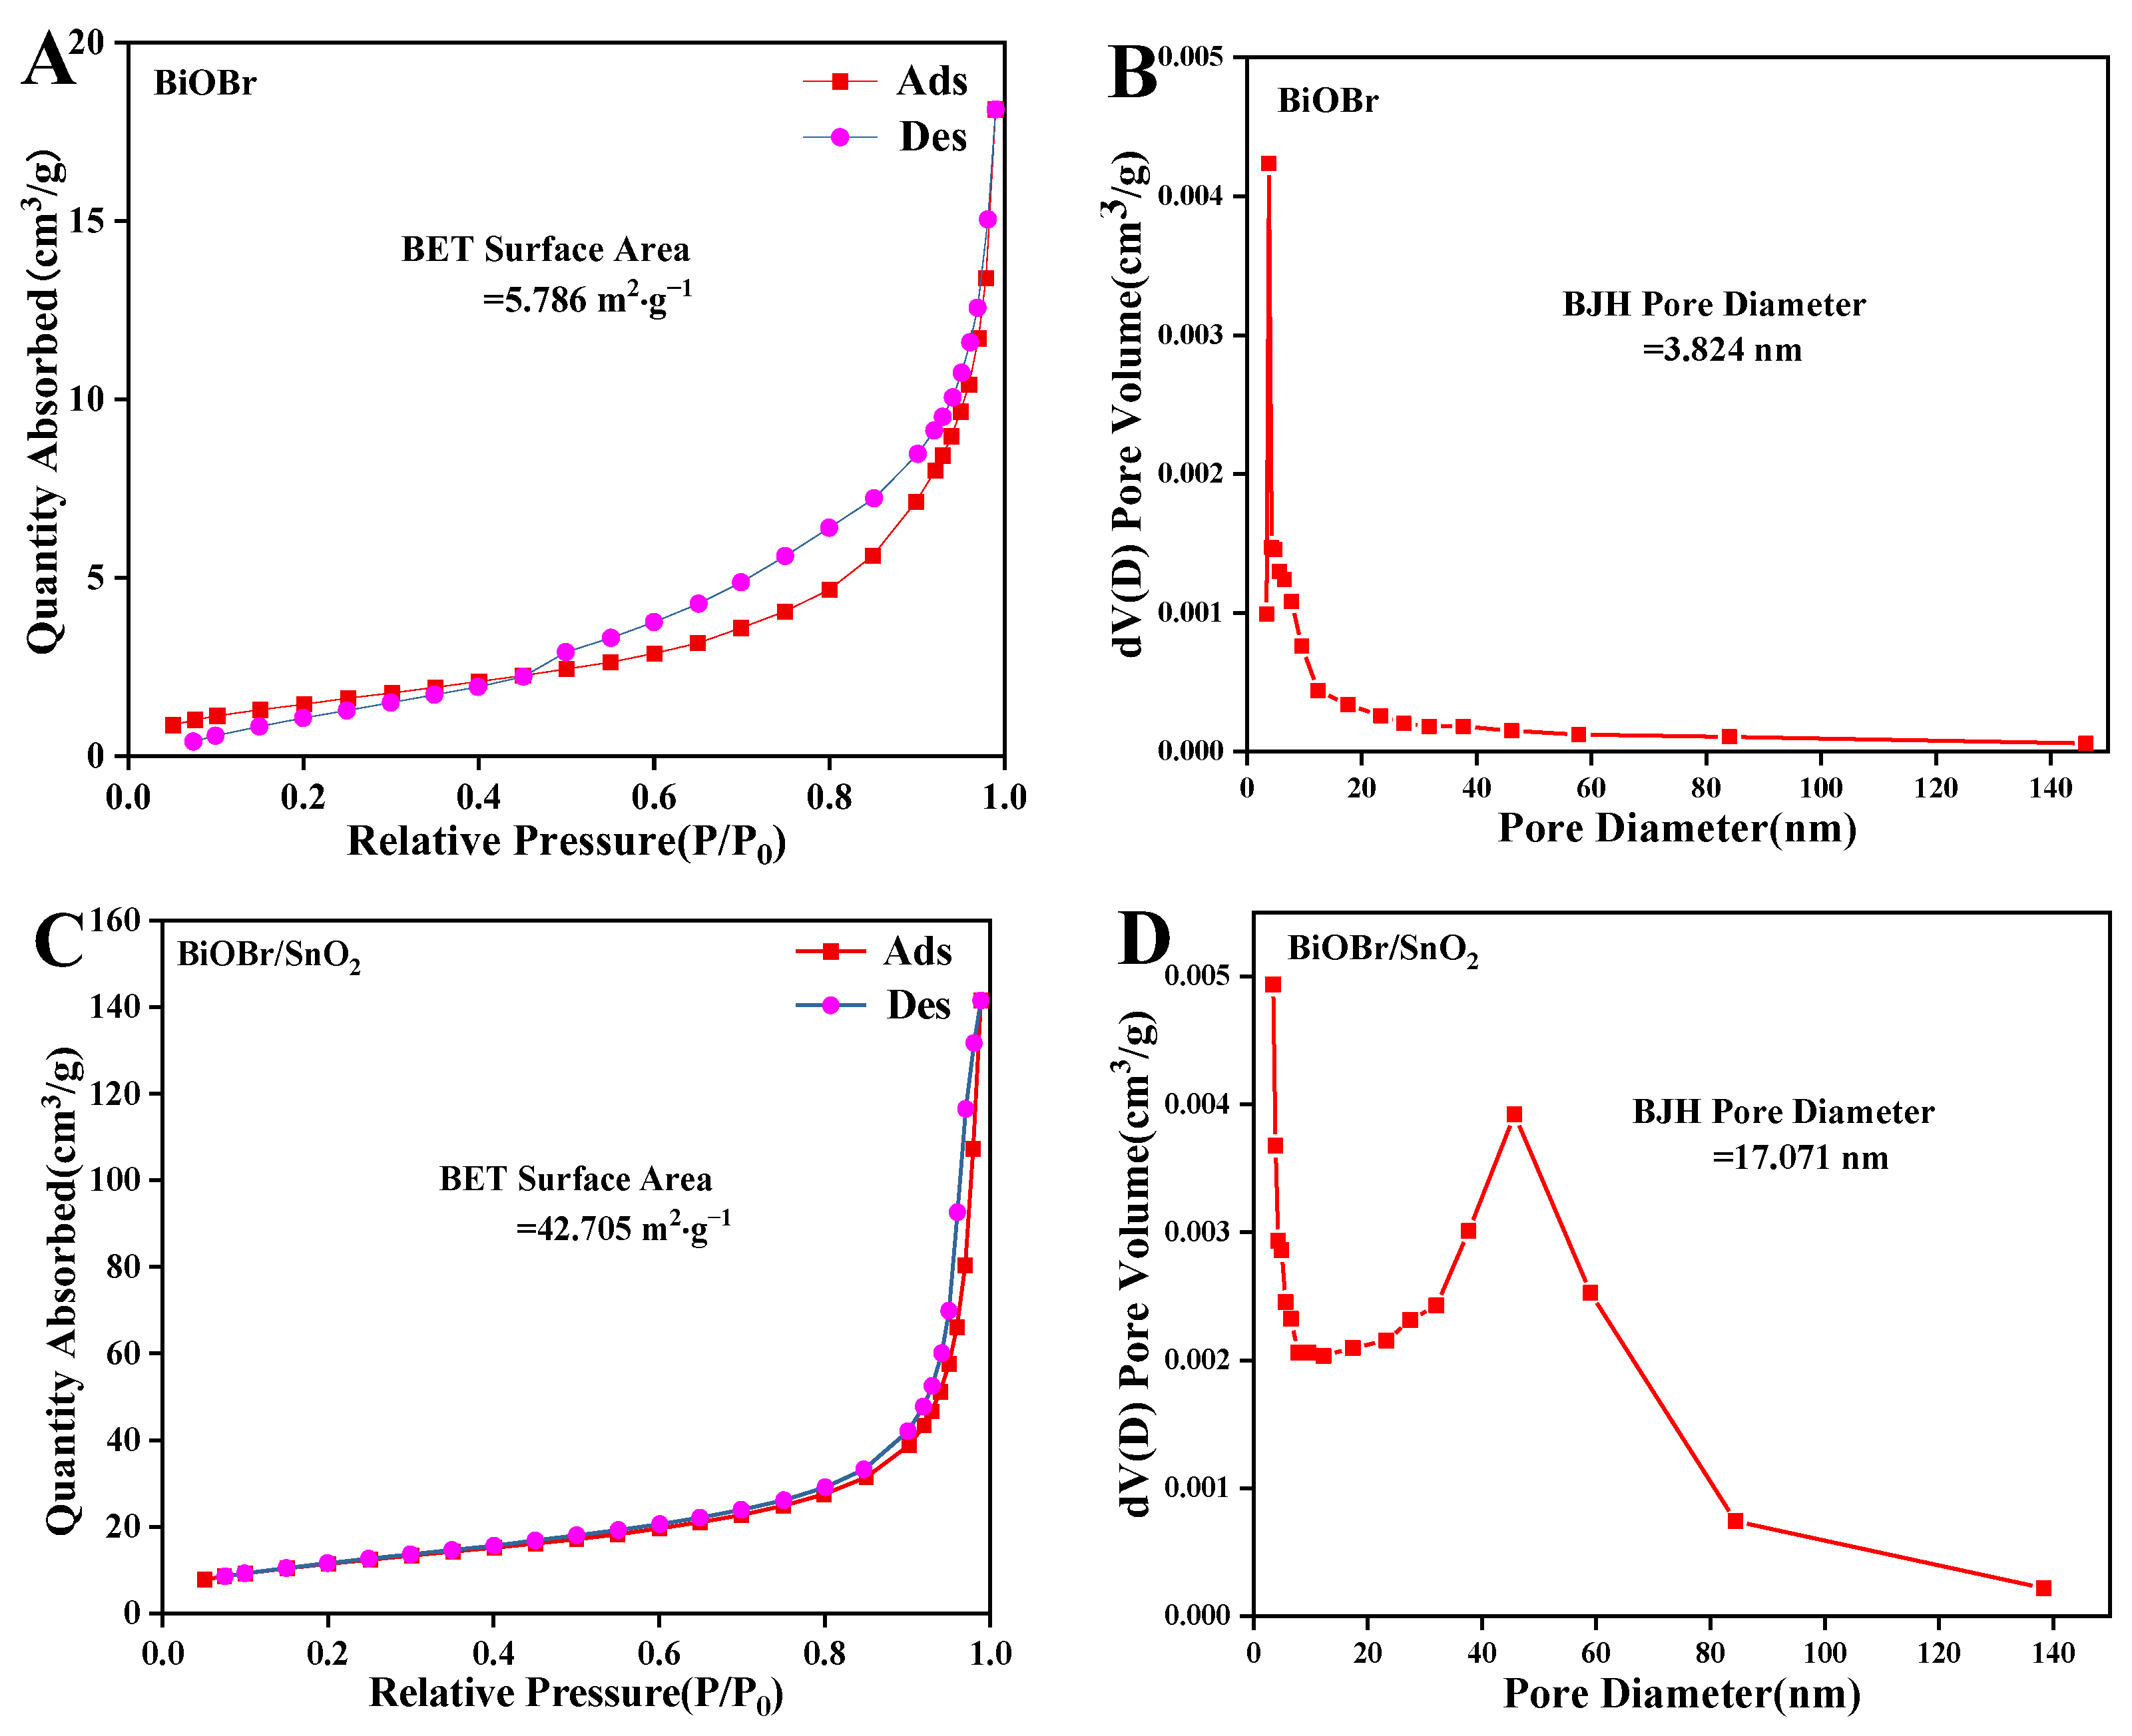
2.1. Characterization of BiOBr, BiOBr/SnO2, BiOBr/Zn@SnO2

SEM and TEM analyses were carried out to observe the microstructure and morphology of the fabricated BiOBr/Zn@SnO2. Figure 1A,B depict the layer-stacked structure of the product; the comparison with the pre-synthetic material can be found in Figure S1, and obvious structural changes can be found in the figure. Figure 1C–G show the results of the distribution of each element in the material taken by energy dispersive X-ray spectroscopy (EDS). It can be seen that related elements, such as Bi, Br, Zn, Sn, and O, are well distributed on the composite, indicating BiOBr and SnO2 have co-existed in the composite structure successfully. SnO2 nanoparticles were dispersed on the surface of BiOBr and Zn was also well loaded on the resulting material. TEM characterization was carried out to further investigate the relationship between Zn@SnO2 and BiOBr. Figure 1H exhibits the relatively uniform dispersion of the two materials; Figure 1I displays the existence of two lattice stripes, which corresponded to SnO2 (110, 3.4 Å) lattice stripes [25] and BiOBr (102, 2.8 Å) lattice stripes [26], respectively.
The chemical structural aspects of BiOBr, BiOBr/SnO2, and BiOBr/Zn@SnO2 are investigated by Fourier transform infrared (FT-IR) and powder X-ray diffractometry (XRD). Figure 2 shows the FT-IR spectra of the materials, from which it can be seen that the characteristic peak appears at 501 cm−1 and belongs to the vibrational peak of Bi-O [27]. While 1636 cm−1 and 3433 cm−1 can be attributed to the vibrational peaks of O-H [28], the peak emerging at 2361 cm−1 is associated with the vibrational peak of the C=O bond in the absorbed CO2, and the presence of a vibrational peak near 650 cm−1 is caused by the contraction vibration of O-Sn-O.
Figure 3A shows the typical XRD pattern of BiOBr, the diffraction peaks at 2θ = 10.90°, 21.91°, 25.20°, 31.73°, 32.20°, 39.31°, 46.21°, 50.66°, 53.35° and 57.17° corresponding to the BiOBr crystals at (001), (002), (101), (102), (110), (112), (200), (104), (211) and (212) crystal planes, respectively. To further investigate the influence of Zn-doping on the crystal structural of the product, XRD patterns of ZnO, SnO2 and Zn@SnO2 were conducted (as could be seen in Figure S2).
There were almost no typical peaks of zinc or other zinc compounds that could be observed in the pattern of Zn@SnO2, and almost no diffraction peaks shift could be found after the Zn-doping, which should be ascribed to the similar ionic radius of Zn(II) (0.73 Å) and Sn(IV) (0.71 Å) [29]. While the diffraction peaks of BiOBr/SnO2 and BiOBr/Zn@SnO2 showed similar characteristic peaks as BiOBr, there were almost no typical diffraction peaks of SnO2 observed in the patterns. This might be due to the intensities of SnO2 peaks being much weaker compared with that of BiOBr as well as the peak positions being just overlapped by the peaks of BiOBr [21]. However, the peak that emerged at 33.54 should belong to the (101) facet of SnO2, which further proved the coexistence of BiOBr and SnO2.
Figure 3B exhibits the full survey of BiOBr/Zn@SnO2, Bi, Br, Sn, and Zn of BiOBr/Zn@SnO2 all emerged in the spectrum, which indicates SnO2 and Zn are well loaded onto BiOBr. Figure 3C shows the spectrum of Bi 4f, the two typical peaks located at 159.50 eV and 164.70 eV attributed to Bi4f7/2 and Bi4f5/2, respectively, which indicate Bi is in the valence state of +3 in this catalyst. In Figure 3D, the two peaks located at 68.39 eV and 69.42 eV may belong to Br3d3/2 and Br3d5/2, respectively. The corresponding valency of Br is −1 [30]. The peak at 442.86 eV in Figure 3E is Zn 3d. The peaks at 487.35 eV and 495.86 eV in Figure 3F are Sn3d5/2 and Sn3d3/2, respectively. Both of them attribute to Sn (IV) [31].
The specific surface area and pore size distribution of BiOBr, BiOBr/SnO2 and BiOBr/Zn@SnO2 are analyzed using a BET analyzer. The adsorption and desorption isotherms of all the samples are shown in Figure 4A–C, respectively. It can be found that the desorption return line has a clear hysteresis return line, which indicates the hysteresis loop is type h3 and possesses mesopores structure [32].
The specific surface areas of BiOBr, BiOBr/SnO2, and BiOBr/Zn@SnO2 are calculated as 5.8 m2·g−1, 42.7 m2·g−1 and 61.5 m2·g−1, respectively. Furthermore, the average pore sizes of BiOBr/SnO2 and BiOBr/Zn@SnO2 are 3.8 nm, 17.0 nm and 17.1 nm, respectively (Table 1). The results indicate that the combination of BOBr and SnO2, as well as the doping of Zn element, significantly enhance the specific surface areas and pore sizes of the products. All the above-mentioned improve the opportunity for catalyst participation in the reaction, thus enhancing the catalysis performance of the product.

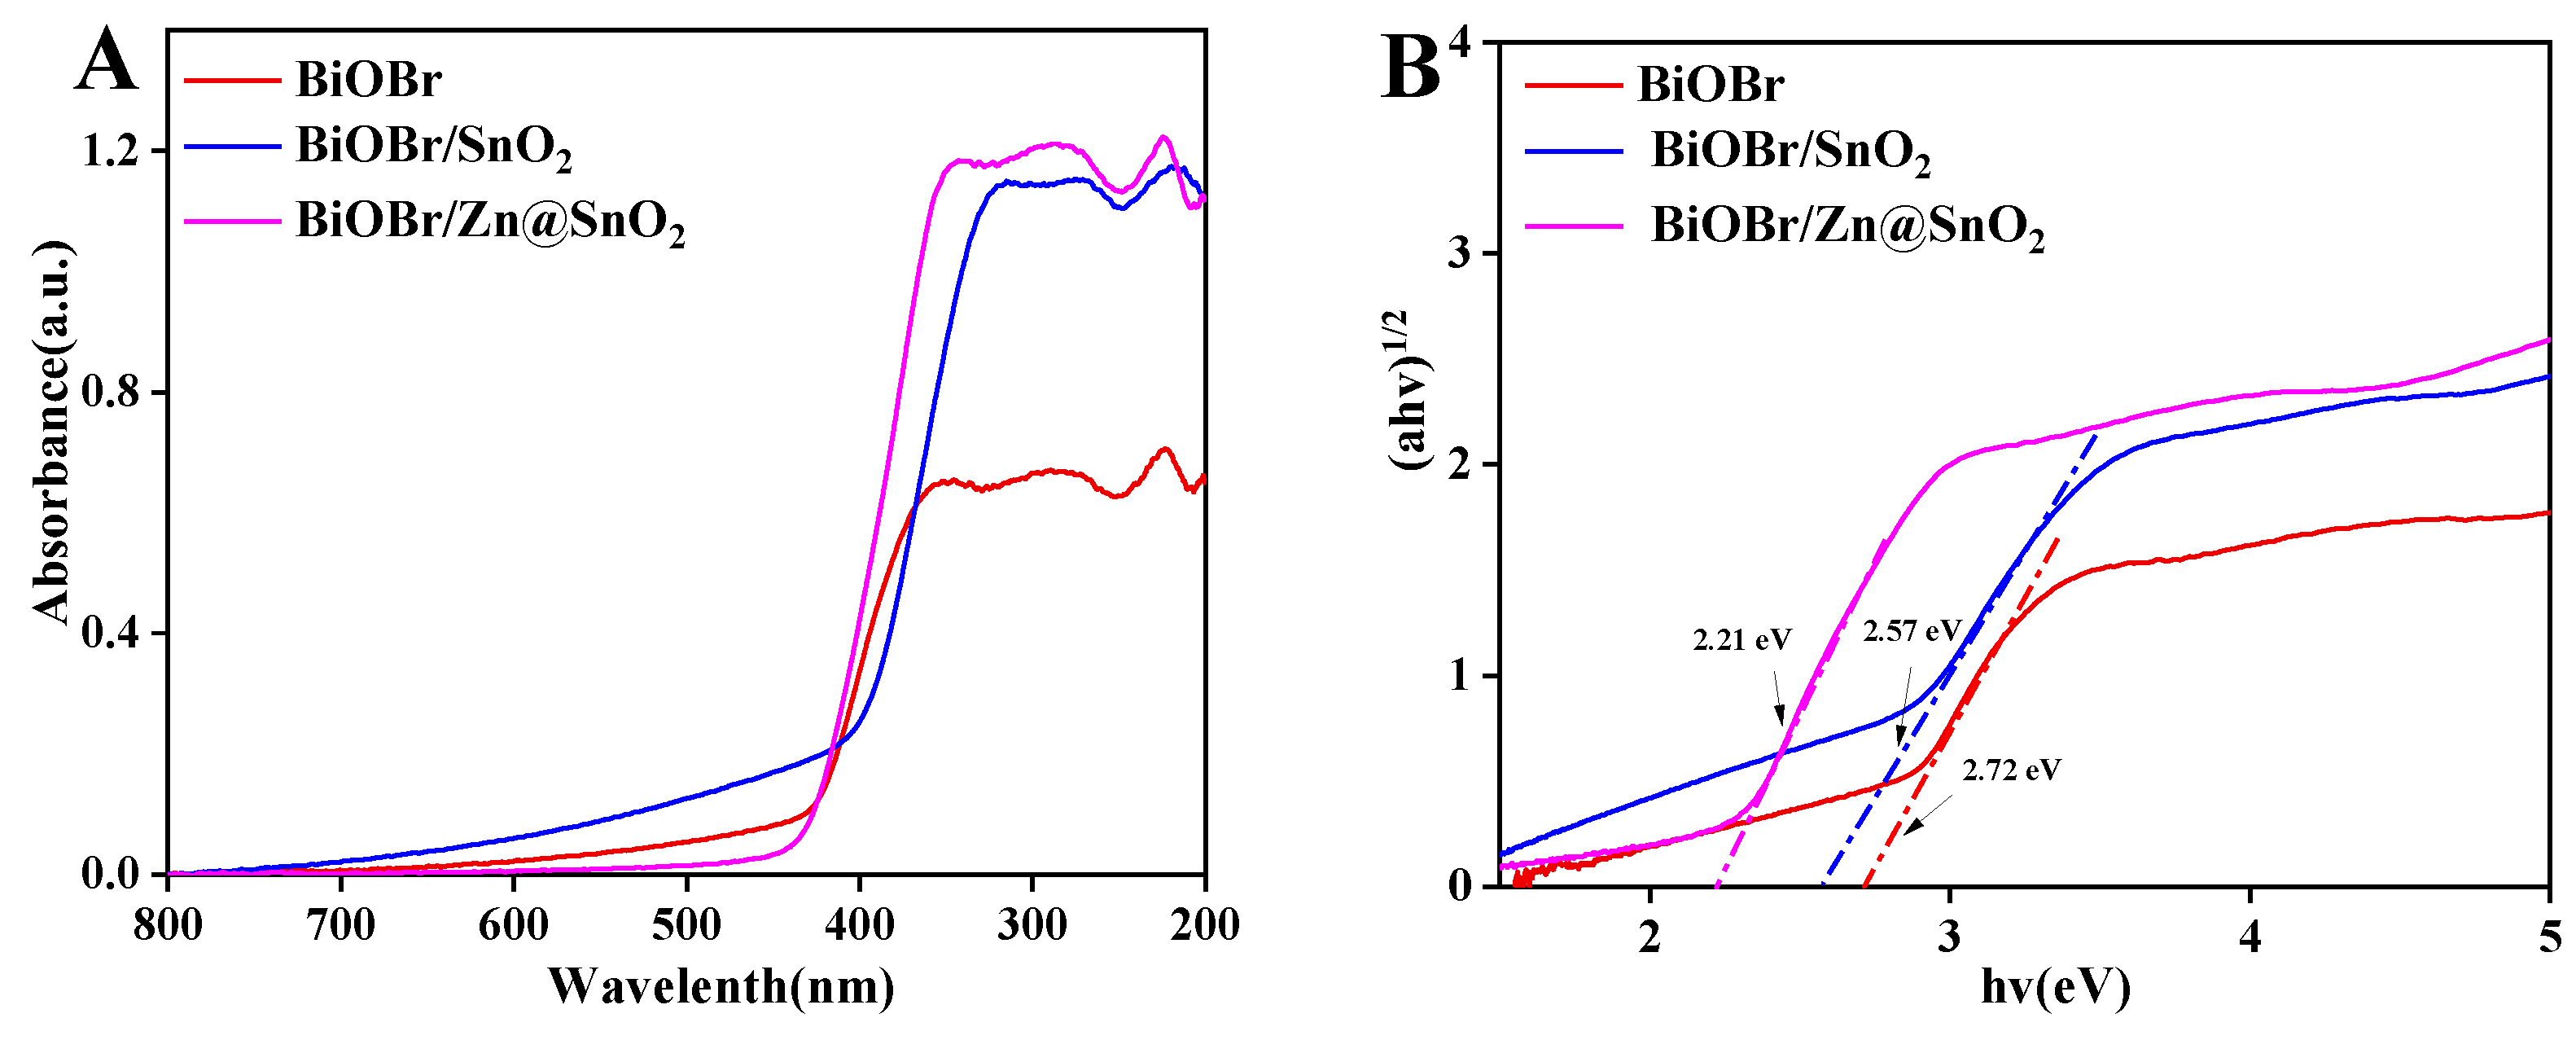
2.2. Optical Characterization of BiOBr, BiOBr/SnO2, BiOBr/Zn@SnO2

The visible absorption as well as the bandwidth of BiOBr, BiOBr/SnO2 and BiOBr/Zn@SnO2 were investigated using UV–vis spectroscopy. In Figure 5A, the absorption edges of BiOBr, BiOBr/SnO2, and BiOBr/Zn@SnO2 are at 400 nm, 380 nm and 410 nm, respectively. The optical band edges in Figure 5B are determined by the Tauc equation as ahv = A(hv-Eg) n/2, where A is a constant, a is the absorption coefficient, h is Planck’s constant, v is the photon energy, Eg is the bandgap and n is defined by the optical leap in the semiconductor (n = 1 for a direct leap and n = 4 for an indirect leap).
It is understood from a review of the data that BiOBr and SnO2 have an n value of 1.24 and are direct leaps [33,34]. The bandgaps of BiOBr, BiOBr/SnO2, and BiOBr/Zn@SnO2 can be measured as 2.72 eV, 2.57 eV, and 2.21 eV can be measured in Figure 5B by plotting (ahv)1/2 versus hv. It can be seen that, as the catalyst is modified, the bandgap decreases and the range of visible light that can be absorbed increases, resulting in a reduction in the hydrogen precipitation reaction of sugars, the catalysts having been modified to reduce the hydrogen precipitation of sugars, increasing the oxidation reaction and improving the selectivity of lactic acid.
The photoelectric properties of BiOBr, BiOBr/SnO2 and BiOBr/Zn@SnO2 were investigated. The light and dark periodic photocurrents, alternating current (AC) impedance and Lsv of the three materials were measured using a Shanghai Chenhua model 660 e electrochemical workstation. Figure 6A shows the light and dark periodic photocurrents of the three catalysts. It can be seen that the photocurrent response values of BiOBr/Zn@SnO2 are higher than the other two catalysts, indicating that BiOBr/Zn@SnO2 has better photosensitivity and can participate in the photocatalytic reaction more efficiently. Figure 6B shows the AC impedance profiles of the three catalysts. It can be seen that the impedance of the catalysts decreases with the doping of SnO2 and Zn, indicating that the new materials once synthesized can maintain a lower electron transfer resistance to the electrolyte and achieve a higher photocatalytic efficiency. In addition, LSV scans of the three photocatalysts under bright and dark–light conditions were also carried out, the results of which are shown in Figure 6C. It can be seen that the photocurrent response values of BiOBr/Zn@SnO2 are higher than those of the other two catalysts under both visible and dark conditions, indicating that the catalysts have a higher photogenerated charge capability. Testing of these three photovoltaic properties suggests that the newly synthesized catalyst has higher photocatalytic activity than the original single catalyst.

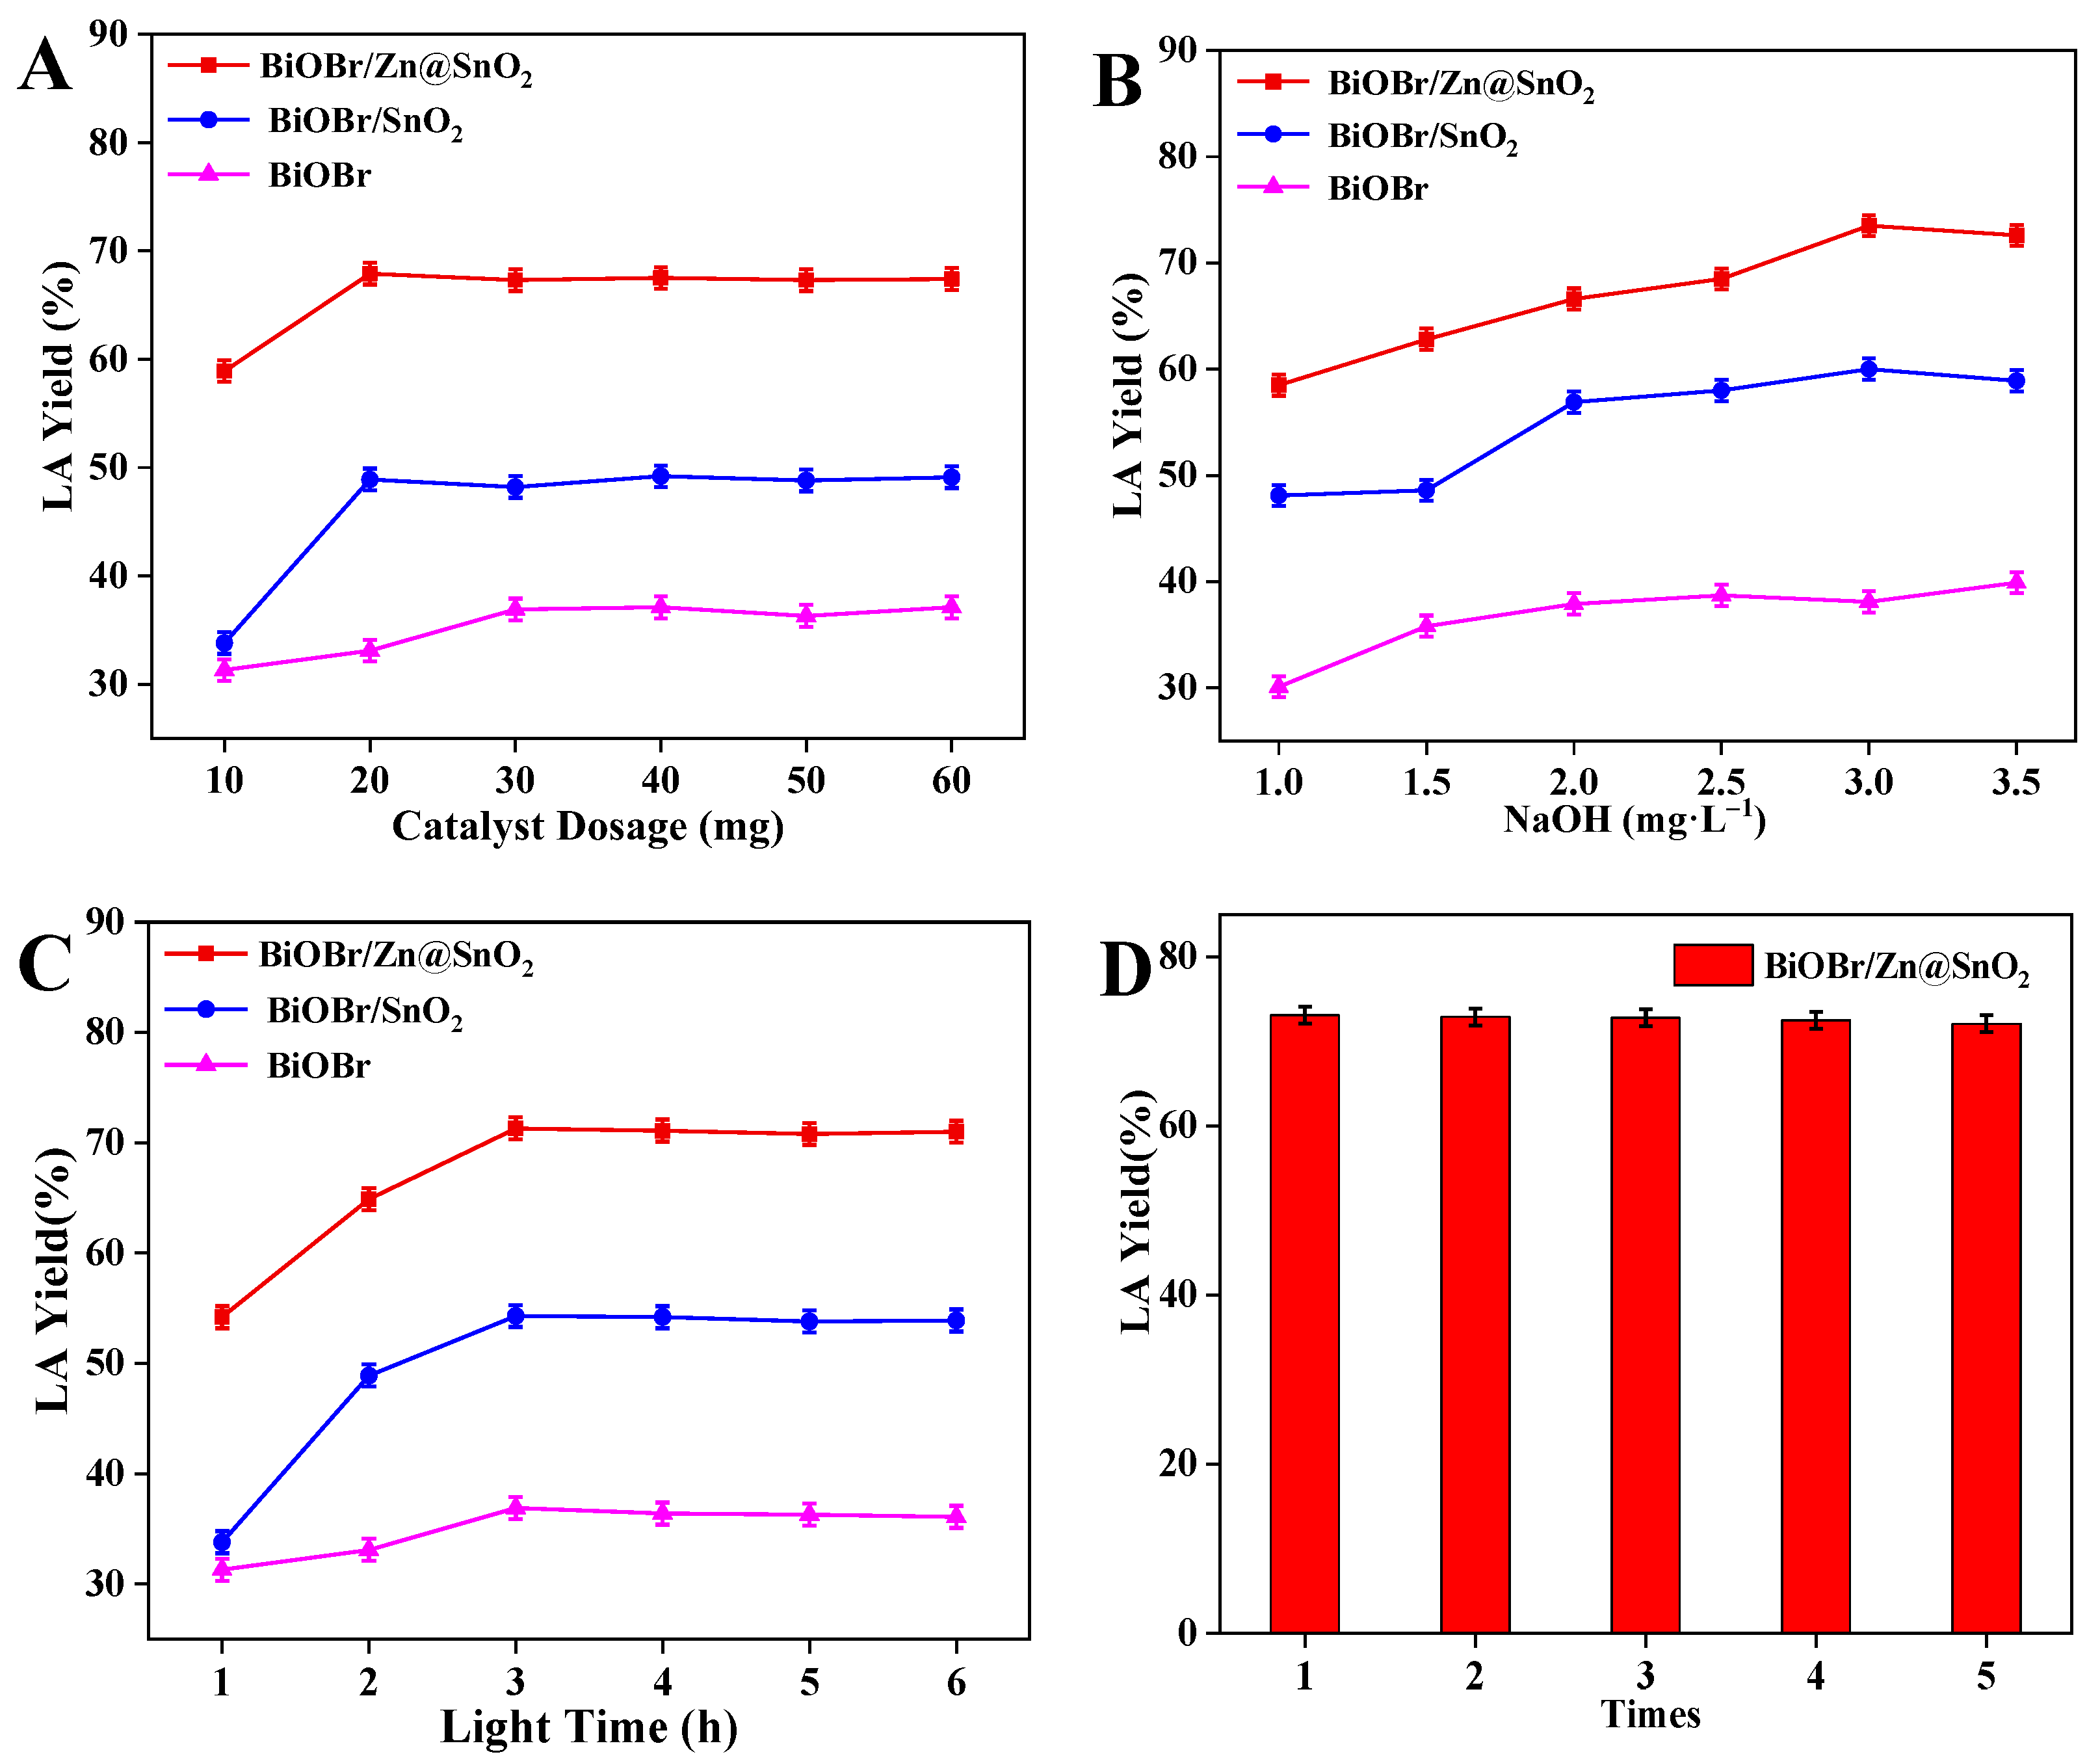
2.3. Investigating the Effect of Different Conditions on Fructose Photoproduction of Lactic Acid

The effect of various factors on the lactic acid production from fructose was investigated by designing different reaction sets. Firstly, the photoreformation of fructose was carried out with catalysts under neutral and acidic conditions. It was found that no lactic acid was produced under acidic conditions, while the yield of the three catalysts only reached about 10% under neutral conditions, suggesting that photoreformation of lactic acid is dependent on alkaline conditions, and therefore experiments were designed to produce lactic acid from photoreformation of fructose using NaOH as the solvent. This was followed by dark–light experiments with all three catalysts under alkaline conditions, which showed no lactic acid production, indicating that light is an exciting condition for the reaction. As shown in Figure 7A, 100 mg of fructose was subjected to light catalysis at room temperature under the same light conditions and pH with different amounts of catalyst, and it can be seen that as the amount of catalyst increased, the lactic acid yield reached the highest at a catalyst dosage of 20 mg, and the reaction was basically flat when the amount of catalyst continued to increase, so the optimal amount of catalyst was concluded to be 20 mg.
The NaOH concentration variable experiment was designed immediately afterwards, as shown in Figure 7B, with 100 mg of fructose and 20 mg of catalyst, and the variable experiment was made on the solution concentration under the same light and room temperature conditions, and it could be seen that the lactic acid yield increased continuously as the concentration became larger, with the best yield being obtained when it reached 3.0 mol·L−1, where the increase in lactic acid yield was more related to the presence of -OH. Finally, an experiment was designed with the duration of light as the variable, as shown in Figure 7C, in which 100 mg of fructose with 20 mg of catalyst was selected and the experiment was carried out at room temperature as well as in 3.0 mol·L−1 NaOH solution, and the lactic acid yield became higher as the duration of light increased and remained constant after 3 h. The optimum conditions for catalytic lactic acid and the maximum yield were obtained by the above experiments, i.e., 100 mg of fructose with 20 mg of catalyst added to 3.0 mol·L−1 NaOH solution, and 79.6% lactic acid was obtained by 3 h of light exposure at room temperature.
The stability and reusability of the newly synthesized catalyst was tested and the results are shown in Figure 7D. In total, 100 mg of fructose and 20 mg of BiOBr/Zn@SnO2 were added to 10 mL of NaOH solution at a concentration of 3 mol/L. The catalyst was filter dried and recovered after 3 h of light prodding to test the recovery each time as well as the conversion of lactic acid. After five cycles of the experiment, it can be seen that the yield of lactic acid decreased slightly with the recycling of the catalyst, but still remained high; at the same time, and comparing this experiment with previous studies, it can be seen that the conversion rate has been greatly improved (Table 2). Thus, the prepared BiOBr/Zn@SnO2 has good stability and reusability, and can save materials while being more cost-effective.
The influence of various radicals and hole on the synthesis of lactic acid was also explored. It is well known that various reactive oxidants are produced during the photocatalytic process, and that these oxidative active free radicals play different roles in the overall reaction system. In order to investigate the effect of these oxidation reactive substances on the reaction, reactive substance inhibitors were used to determine the effect on the reaction if the production of a particular reactive substance was inhibited. Three reactive inhibitors, 1,4-benzoquinone (BQ), disodium ethylenediaminetetraacetate (EDTA-Na2) and isopropyl alcohol (IPA), were used as inhibitors of the superoxide radical (·O2), hole (H+) and hydroxyl radical (OH) radicals [35]. These inhibitors were added separately under the same conditions to investigate the effect on the photopromoted reforming of lactic acid from fructose, and the results are shown in Figure 8A. It can be seen that the effect of cavity H+ on the overall reaction is not significant, but the yield of lactic acid decreases significantly when superoxide radicals (·O2) and hydroxyl radicals (·OH) are inhibited by the inhibitors, so it can be judged that superoxide radicals and hydroxyl radicals play an important role in the phototactic reforming of lactic acid from fructose. Therefore, ESR spin labeling of the superoxide radical (·O2) and hydroxyl radical (·OH) in the reaction system was carried out with DMPO as the trapping agent, as shown in Figure 8B. As far as we know, DMPO, ·O2 or ·OH alone do not produce a signal in the solution system, while the combination of DMPO and ·O2 has a quadruple signal peak with a relative intensity of 1:1:1:1 [36], which can be clearly seen in Figure 9B, and is trapped by the trapping agent to produce a signal. The same combination of DMPO and ·OH showed a quadruple signal peak with a relative intensity of 1:2:2:1 [37], and no hydroxyl radicals were produced under dark conditions. Thus, both superoxide radicals and hydroxyl radicals were generated under light conditions in the catalyst system and played an oxidative role in the subsequent photoreactivation of fructose.

2.4. Possible Pathways for Lactic Acid-Lactate Production by Fructose Photorefinery

The reaction pathways of fructose convert to lactic acid using BiOBr/Zn@SnO2, as a photocatalyst was proposed in this research. A possible mechanism was proposed based on the experiment results and previous literature [21]. As can be seen in Figure 9, the heterojunction of BiOBr/Zn@SnO2 with a suitable bandgap is activated under visible light irradiation, and the photogenerated electrons generated in the conduction band reduce the absorbed oxygen to form superoxide radicals. Furthermore, the produced superoxide radicals can be continuously transformed into other reactive substances under light irradiation, such as hydroxyl radicals, which promote the conversion of fructose to lactic acid [11]. The formation of lactic acid from fructose under alkaline conditions in the photorefinery start from the ring-opening of fructose, followed by hydrolysis (trans-aldol) of fructose in the presence of reactive oxygen species to produce glyceraldehyde and 1,3-dihydroxyacetone. Through further dehydration, pyruvic aldehyde is formed and, finally, lactic acid is produced through a series of steps. However, for the small number of by-products such as formic acid produced after the reaction, this could be produced from the α/β-oxidation of fructose, as he detected yields of lactic acid were much higher than the substances such as formic acid. This suggests that lactic acid has a greater selectivity in the reaction.

3. Materials and Methods

Fructose, bismuth nitrate pentahydrate, potassium bromide, sodium hydroxide, anhydrous ethanol, ethylene glycol, zinc acetate dihydrate, and tin tetrachloride pentahydrate were purchased from Shanghai Maclean Biochemical Technology Co (Analysis of pure). Lactic acid, dipotassium hydrogen phosphate, methanol (chromatographically pure), 1,4-benzoquinone (BQ), disodium ethylenediaminetetraacetate (EDTA-Na2), and isopropanol (IPA) were purchased from Shanghai Aladdin Biochemical Technology Co (Analysis of pure).
BiOBr/Zn@SnO2 were prepared by the one-pot method that was modified based on the previous literature [21]. Weigh 0.97 g of Bi (NO3)3·5H2O (0.0025 mol) and 0.238 g of KBr (0.002 mol) into 20 mL of ethylene glycol as solution A, and 0.235 g of SnCl4·5H2O (0.0007 mol) and 0.029 g Zn(CH3COO)2·2H2O (0.001 mol) into mix 10 mL of ethanol and 0.107 g of NaOH (0.0027 mol), as solution B. After sonication for 1 h, solution A was slowly poured into solution B and also mixed with solution C. Solution C was put into a PTFE reactor and reacted at 120 °C for 12 h. The mixture was washed three times with anhydrous ethanol and water in sequence, then filtered. The target product was dried in a vacuum oven at 60 °C overnight.
Scheme 1 demonstrates the preparation process of one-pot chemistry to synthesis BiOBr/Zn@SnO2. Briefly, a certain amount of SnCl4·5H2O is dissolved in sodium hydroxide and ethanol solution to form a white flocculent Sn(OH)4, while adding Zn(CH3COO)2·2H2O in a hydrothermal reaction can load Zn onto the SnO2 molecule, then Bi(NO3)3·5H2O is poured into the ethylene glycol solution, and KBr is added to slowly form a yellow solution, after which the white flocculent solution is poured into the yellow solution and stirred well before being put into the reactor for heating and reaction, and the target product of BiOBr/Zn@SnO2 is obtained by separation and precipitation and drying. Two comparative catalysts, BiOBr and BiOBr/SnO2, are also prepared, with both having been synthesized by hydrothermal reaction in an autoclave, for use in some subsequent experimental comparisons.
Batch experiments were carried out under the irradiation of a xenon lamp (300 w). A total of 100.0 mg of fructose was immersed in 10.0 mL of NaOH solution (0.5–3.0 M). Effect of catalyst sorts (BiOBr, BiOBr/SnO2, BiOBr/Zn@SnO2), NaOH concentration, catalyst dosage, and light duration were all investigated. Results of the final lactic acid yield were determined via high-performance liquid chromatography (HPLC). The reusability of the catalyst was explored under optimal reaction conditions. after each run, the solution was withdrawn to detect the final lactic acid yield by high performance liquid chromatography (HPLC). Simultaneously, 100 mg of fructose and 10 mL NaOH solution with appropriate concentration was added into the reactor and the next run was started.
Fourier transform infrared (FT-IR), powder X-ray diffractometer (XRD), UV–Vis diffuse reflectance spectrometer (UV–Vis), Scanning electron microscope (SEM), high magnification transmission electron microscope (HRTEM), X-ray photoelectron spectrometer (XPS), specific surface area analyzer (BET) was conducted to characterize the products. Photocurrents, linear scanning voltammetry (LSV), and AC impedance were measured using a Shanghai Chenhua model 660e electrochemical workstation. Electron spin resonance (ESR) was used to test the free radicals in the solution system to study their effect on the reaction. Details of the detect conditions could be found in the supplementary data.
To investigate the effect of various active substances on lactic acid yield, a series of comparative experiments with the addition of inhibitors were designed. Inhibitors such as IPA, EDTA, and BQ were added to the reaction system to assess the effect of the active species on the reaction.

4. Conclusions

BiOBr/Zn@SnO2 was synthesized and applied as photocatalyst in the selective conversion of fructose to lactic acid. The catalyst showed excellent fructose and high lactic acid selectivity. The conversion rate was almost 100%, and the yield of lactic acid was about 79.6%. Possible reaction pathways were proposed based on the results of active oxygen species poisoning experiments, which included superoxide radicals (O2), vacancies (H+), and hydroxyl radicals (OH) [38]. The results of reusability show the catalyst possesses excellent performance. This result demonstrates the scientific value of the experiment and provides a new direction for the high value utilization of biomass, with the catalyst being simple to synthesize, simple to process, and also effective in reducing costs, which has a more significant advantage in the high value utilization of biomass.

Supplementary Materials

The following are available online at https://www.mdpi.com/article/10.3390/catal12070719/s1, Figure S1. SEM figure for BiOBr and SnO2; Figure S2. XRD patterns of SnO2, ZnO and Zn@SnO2.

Author Contributions

H.-J.Q.: Conceptualization, Methodology, Validation, Investigation, Resources, Writing—Original draft, Visualization; Z.W.: Conceptualization, Validation, Writing—Review and editing, Supervision, Funding acquisition; Y.-H.Z.: Resources, Visualization; G.-H.Y.: Software, Visualization. All authors have read and agreed to the published version of the manuscript.

Funding

This research received no external funding.

Data Availability Statement

All the relevant data are included in this published article.

Acknowledgments

The authors are grateful to be supported in part by the Provincial Key Research and Development Program of Shandong (2019JZZY010326, 2019JZZY010328, 2021CXGC010601) and the Taishan Scholars Program of Shandong Province.

Conflicts of Interest

The authors declare no conflict of interest.

References

  1. Katryniok, B.; Paul, S.; Dumeignil, F. Highly efficient catalyst for the decarbonylation of lactic acid to acetaldehyde. Green Chem. 2010, 12, 1910–1913. [Google Scholar] [CrossRef]
  2. Purushothaman, R.K.P.; Van Haveren, J.; Van Es, D.; Melián-Cabrera, I.; Meeldijk, J.; Heeres, H. An efficient one pot conversion of glycerol to lactic acid using bimetallic gold-platinum catalysts on a nanocrystalline CeO2 support. Appl. Catal. B Environ. 2014, 147, 92–100. [Google Scholar] [CrossRef] [Green Version]
  3. Eş, I.; Khaneghah, A.M.; Barba, F.J.; Saraiva, J.A.; Sant’Ana, A.S.; Hashemi, S.M.B. Recent advancements in lactic acid production-a review. Food Res. Int. 2018, 107, 763–770. [Google Scholar] [CrossRef] [PubMed]
  4. Li, S.; Deng, W.; Li, Y.; Zhang, Q.; Wang, Y. Catalytic conversion of cellulose-based biomass and glycerol to lactic acid. J. Energy Chem. 2019, 32, 138–151. [Google Scholar] [CrossRef] [Green Version]
  5. Deng, W.; Wang, Y.; Zhang, S.; Gupta, K.M.; Hülsey, M.J.; Asakura, H.; Liu, L.; Han, Y.; Karp, E.M.; Beckham, G.T. Catalytic amino acid production from biomass-derived intermediates. Proc. Natl. Acad. Sci. USA 2018, 115, 5093–5098. [Google Scholar] [CrossRef] [PubMed] [Green Version]
  6. Li, C.; Wang, H.; Naghadeh, S.B.; Zhang, J.Z.; Fang, P. Visible light driven hydrogen evolution by photocatalytic reforming of lignin and lactic acid using one-dimensional NiS/CdS nanostructures. Appl. Catal. B Environ. 2018, 227, 229–239. [Google Scholar] [CrossRef]
  7. Kong, L.; Li, G.; Wang, H.; He, W.; Ling, F. Hydrothermal catalytic conversion of biomass for lactic acid production. J. Chem. Technol. Biotechnol. Int. Res. Process Environ. Clean Technol. 2008, 83, 383–388. [Google Scholar] [CrossRef]
  8. Huang, C.-W.; Nguyen, B.-S.; Wu, J.C.-S.; Nguyen, V.-H. A current perspective for photocatalysis towards the hydrogen production from biomass-derived organic substances and water. Int. J. Hydrogen Energy 2020, 45, 18144–18159. [Google Scholar] [CrossRef]
  9. Duan, Q.; Ji, J.; Hong, X.; Fu, Y.; Wang, C.; Zhou, K.; Liu, X.; Yang, H.; Wang, Z.-Y. Design of hole-transport-material free CH3NH3PbI3/CsSnI3 all-perovskite heterojunction efficient solar cells by device simulation. Sol. Energy 2020, 201, 555–560. [Google Scholar] [CrossRef]
  10. Chaves, A.; Azadani, J.; Alsalman, H.; Da Costa, D.; Frisenda, R.; Chaves, A.; Song, S.H.; Kim, Y.; He, D.; Zhou, J. Bandgap engineering of two-dimensional semiconductor materials. NPJ 2D Mater. Appl. 2020, 4, 29. [Google Scholar] [CrossRef]
  11. Zhao, H.; Li, C.-F.; Yong, X.; Kumar, P.; Palma, B.; Hu, Z.-Y.; Van Tendeloo, G.; Siahrostami, S.; Larter, S.; Zheng, D. Coproduction of hydrogen and lactic acid from glucose photocatalysis on band-engineered Zn1-xCdxS homojunction. Iscience 2021, 24, 102109. [Google Scholar] [CrossRef] [PubMed]
  12. Li, M.; Zhong, L.X.; Chen, W.; Huang, Y.; Chen, Z.; Xiao, D.; Zou, R.; Chen, L.; Hao, Q.; Liu, Z. Regulating the electron–hole separation to promote selective oxidation of biomass using ZnS@ Bi2S3 nanosheet catalyst. Appl. Catal. B Environ. 2021, 292, 120180. [Google Scholar] [CrossRef]
  13. Li, Y.; Ma, J.; Jin, D.; Jiao, G.; Yang, X.; Liu, K.; Zhou, J.; Sun, R. Copper oxide functionalized chitosan hybrid hydrogels for highly efficient photocatalytic-reforming of biomass-based monosaccharides to lactic acid. Appl. Catal. B Environ. 2021, 291, 120123. [Google Scholar] [CrossRef]
  14. John, R.P.; Nampoothiri, K.M.; Pandey, A. Fermentative production of lactic acid from biomass: An overview on process developments and future perspectives. Appl. Microbiol. Biotechnol. 2007, 74, 524–534. [Google Scholar] [CrossRef] [PubMed]
  15. Rasrendra, C.B.; Fachri, B.A.; Makertihartha, I.G.B.; Adisasmito, S.; Heeres, H.J. Catalytic conversion of dihydroxyacetone to lactic acid using metal salts in water. ChemSusChem 2011, 4, 768–777. [Google Scholar] [CrossRef]
  16. Wang, J.; Masui, Y.; Onaka, M. Conversion of triose sugars with alcohols to alkyl lactates catalyzed by Brønsted acid tin ion-exchanged montmorillonite. Appl. Catal. B Environ. 2011, 107, 135–139. [Google Scholar] [CrossRef]
  17. Holm, M.S.; Saravanamurugan, S.; Taarning, E. Conversion of sugars to lactic acid derivatives using heterogeneous zeotype catalysts. Science 2010, 328, 602–605. [Google Scholar] [CrossRef] [Green Version]
  18. Liu, G.; Xie, Y.; Wei, C.; Liu, C.; Song, F.; Sun, X.; Zhang, Y.; Cui, H. Synergistic catalysis of species in molten salt hydrate for conversion of cellulose to 5-hydroxymethylfurfural. Biomass Bioenergy 2022, 158, 106363. [Google Scholar] [CrossRef]
  19. Gómez Millán, G.; Hellsten, S.; Llorca, J.; Luque, R.; Sixta, H.; Balu, A.M. Recent advances in the catalytic production of platform chemicals from holocellulosic biomass. ChemCatChem 2019, 11, 2022–2042. [Google Scholar] [CrossRef]
  20. Dhepe, P.L. Fukuoka A: Cellulose conversion under heterogeneous catalysis. ChemSusChem Chem. Sustain. Energy Mater. 2008, 1, 969–975. [Google Scholar] [CrossRef]
  21. Liu, H.; Du, C.; Li, M.; Zhang, S.; Bai, H.; Yang, L.; Zhang, S. One-pot hydrothermal synthesis of SnO2/BiOBr heterojunction photocatalysts for the efficient degradation of organic pollutants under visible light. ACS Appl. Mater. Interfaces 2018, 10, 28686–28694. [Google Scholar] [CrossRef] [PubMed]
  22. Long, D.; Tu, Y.; Chai, Y.; Yuan, R. Photoelectrochemical Assay Based on SnO2/BiOBr p–n Heterojunction for Ultrasensitive DNA Detection. Anal. Chem. 2021, 93, 12995–13000. [Google Scholar] [CrossRef] [PubMed]
  23. Wu, H.; Yuan, C.; Chen, R.; Wang, J.; Dong, F.; Li, J.; Sun, Y. Mechanisms of Interfacial Charge Transfer and Photocatalytic NO Oxidation on BiOBr/SnO2 p–n Heterojunctions. ACS Appl. Mater. Interfaces 2020, 12, 43741–43749. [Google Scholar] [CrossRef] [PubMed]
  24. Liu, H.; Chen, M.; Zhang, H.; Wang, B.; Peng, J.; Liu, G. One-Step Synthesis of Hierarchical Flower-like SnO2/BiOCOOH Microspheres with Enhanced Light Response for the Removal of Pollutants. Langmuir 2020, 36, 9005–9013. [Google Scholar] [CrossRef] [PubMed]
  25. Tammanoon, N.; Wisitsoraat, A.; Tuantranont, A.; Liewhiran, C. Flame-made Zn-substituted SnO2 nanoparticulate compound for ultra-sensitive formic acid gas sensing. J. Alloy. Compd. 2021, 871, 159547. [Google Scholar] [CrossRef]
  26. Duresa, L.W.; Kuo, D.-H.; Bekena, F.T.; Kebede, W.L. Simple room temperature synthesis of oxygen vacancy-rich and In-doped BiOBr nanosheet and its highly enhanced photocatalytic activity under visible-light irradiation. J. Phys. Chem. Solids 2021, 156, 110132. [Google Scholar] [CrossRef]
  27. Lv, J.; Dai, K.; Zhang, J.; Liu, Q.; Liang, C.; Zhu, G. Facile constructing novel 2D porous g-C3N4/BiOBr hybrid with enhanced visible-light-driven photocatalytic activity. Sep. Purif. Technol. 2017, 178, 6–17. [Google Scholar] [CrossRef]
  28. Xiao, K.; Huang, H.; Tian, N.; Zhang, Y. Mixed-calcination synthesis of Bi2MoO6/g-C3N4 heterojunction with enhanced visible-light-responsive photoreactivity for RhB degradation and photocurrent generation. Mater. Res. Bull. 2016, 83, 172–178. [Google Scholar] [CrossRef]
  29. Kumaravelan, S.; Seshadri, S.; Suresh, R.; Ravichandran, K.; Sathishkumar, P.; Shanthaseelan, K.; Suganthi, N. Effect of Zn dopant on SnO2 nano-pyramids for photocatalytic degradation. Chem. Phys. Lett. 2021, 769, 138352. [Google Scholar] [CrossRef]
  30. Qiu, F.; Li, W.; Wang, F.; Li, H.; Liu, X.; Sun, J. In-situ synthesis of novel Z-scheme SnS2/BiOBr photocatalysts with superior photocatalytic efficiency under visible light. J. Colloid Interface Sci. 2017, 493, 1–9. [Google Scholar] [CrossRef]
  31. Akhundi, A.; Habibi-Yangjeh, A. A simple large-scale method for preparation of g-C3N4/SnO2 nanocomposite as visible-light-driven photocatalyst for degradation of an organic pollutant. Mater. Express 2015, 5, 309–318. [Google Scholar] [CrossRef]
  32. Suthakaran, S.; Dhanapandian, S.; Krishnakumar, N.; Ponpandian, N. Hydrothermal synthesis of surfactant assisted Zn doped SnO2 nanoparticles with enhanced photocatalytic performance and energy storage performance. J. Phys. Chem. Solids 2020, 141, 109407. [Google Scholar] [CrossRef]
  33. Ao, Y.; Wang, K.; Wang, P.; Wang, C.; Hou, J. Synthesis of novel 2D-2D pn heterojunction BiOBr/La2Ti2O7 composite photocatalyst with enhanced photocatalytic performance under both UV and visible light irradiation. Appl. Catal. B Environ. 2016, 194, 157–168. [Google Scholar] [CrossRef]
  34. Mao, W.; Bao, K.; Cao, F.; Chen, B.; Liu, G.; Wang, W.; Li, B. Synthesis of a CoTiO3/BiOBr heterojunction composite with enhanced photocatalytic performance. Ceram. Int. 2017, 43, 3363–3368. [Google Scholar] [CrossRef]
  35. Xiong, F.; Yin, L.-L.; Li, F.; Wu, Z.; Wang, Z.; Sun, G.; Xu, H.; Chai, P.; Gong, X.-Q.; Huang, W. Anatase TiO2 (001)-(1 × 4) Surface Is Intrinsically More Photocatalytically Active than the Rutile TiO2 (110)-(1 × 1) Surface. J. Phys. Chem. C 2019, 123, 24558–24565. [Google Scholar] [CrossRef]
  36. Liu, J.; Dong, Y.; Zhang, L.; Liu, W.; Zhang, C.; Shi, Y.; Lin, H. Regulating superoxide radicals and light absorption ability for enhancing photocatalytic performance of MoS2@ Z by CeO2 rich in adsorbed oxygen. J. Clean. Prod. 2021, 322, 129059. [Google Scholar] [CrossRef]
  37. Ma, H.; Feng, J.; Jin, F.; Wei, M.; Liu, C.; Ma, Y. Where do photogenerated holes at the gC3N4/water interface go for water splitting: H2O or OH? Nanoscale 2018, 10, 15624–15631. [Google Scholar] [CrossRef]
  38. Khan, I.; Saeed, K.; Zekker, I.; Zhang, B.; Hendi, A.H.; Ahmad, S.; Zada, N.; Ahmad, H.; Shah, L.A.; Shah, T. Review on Methylene Blue: Its Properties, Uses, Toxicity and Photodegradation. Water 2022, 14, 242. [Google Scholar] [CrossRef]
Figure 1. SEM images of BiOBr/Zn@SnO2 (A,B). EDS elemental images of Bi (C), Zn (D), Br (E), Sn (F) and O (G). TEM images (H) and HRTEM images (I) of BiOBr/Zn@SnO2.
Catalysts 12 00719 g001
Figure 2. FT-IR spectra of BiOBr, BiOBr/SnO2, BiOBr/Zn@SnO2.
Catalysts 12 00719 g002
Figure 3. XRD and XPS images of BiOBr/Zn@SnO2. XRD (A), Survey (B), Bi 4f (C), Br 3d (D), Zn 3d (E), Sn 3d (F).
Catalysts 12 00719 g003
Figure 4. Adsorptions and desorption isotherms (A,C,E) and BJH pore size distributions (B,D,F) for BiOBr, BiOBr/SnO2 and BiOBr/Zn@SnO2.
Catalysts 12 00719 g004aCatalysts 12 00719 g004b
Figure 5. UV–vis diffuse reflectance spectra of BiOBr, BiOBr/SnO2 and BiOBr/Zn@SnO2 (A) and (ahv)1/2 plotted against bandgap (B).
Catalysts 12 00719 g005
Figure 6. Periodic photocurrent response of BiOBr, BiOBr/SnO2 and BiOBr/Zn@SnO2 under visible light irradiation (λ > 420 nm) with 0.1 M Na2SO4 as the electrolyte and 0.5 V vs. Ag/AgCl electrode as the electrode (A). Nyquist plots of the electrochemical impedance spectra of the three catalysts (B). LSV scans of the three catalysts under bright and dark–light conditions (C).
Catalysts 12 00719 g006
Figure 7. Effect of catalyst type on lactic acid yield (A), effect of NaOH concentration (B), effect of catalyst dosing (C) and reusability of the BiOBr/Zn@SnO2 (D).
Catalysts 12 00719 g007
Figure 8. Effect of adding various inhibitors to inhibit ·O2, H+ and ·OH radicals on lactate yield (A), DMPO ESR spin-labelled ·O2 and ·OH radicals (B).
Catalysts 12 00719 g008
Figure 9. Possible reaction pathways of fructose photostimulation.
Catalysts 12 00719 g009
Scheme 1. One-pot process for the preparation of BiOBr/Zn@SnO2.
Catalysts 12 00719 sch001
Table 1. Specific surface area and average pore sizes.
MaterialsSpecific Surface Area (m2·g−1)Average Pore Sizes (nm)
BiOBr5.8 m2·g−13.8 nm
BiOBr/SnO242.7 m2·g−117.0 nm
BiOBr/Zn@SnO261.5 m2·g−117.1 nm
Table 2. Comparison of this experiment with previous studies.
MaterialCatalystExperimental ConditionsProductLiterature
FructoseBiOBr/Zn@SnO2light 3 hLactic Acid 79.6%This experiment
GlucoseNi 400 ppm240 °C 120 sLactic Acid 8.37%Technical Note Hydrothermal catalytic conversion of biomass for lactic acid production
FructoseSn-Beta zeolite140 °CLactic acid methyl ester 44%Conversion of Sugars to Lactic Acid Derivatives Using Heterogeneous Zeotype Catalysts
CelluloseY-Beta zeolite220 °C 2 MPa N2Lactic Acid 49.2%Efficient conversion of cellulose to lactic acid over yttrium modified siliceous Beta zeolites
Glucose0.15 M Ba(OH)260 °C 12 hLactic Acid 42.55%Ca(OH)2 induced a controlled-release catalytic system for the efficient conversion of high-concentration glucose to lactic acid
GlucoseZn0.6Cd0.4S light 5 hLactic Acid 35%Coproduction of hydrogen and lactic acid from glucose photocatalysis on band-engineered Zn 1−x Cd x S homojunction
Publisher’s Note: MDPI stays neutral with regard to jurisdictional claims in published maps and institutional affiliations.

