Article

Improved the Methanol Electro-Oxidation and Carbon Monoxide Tolerance for Direct Methanol Fuel Cells Using Strontium Molybdate

Department of Energy Engineering, National United University, Miaoli 36006, Taiwan
*
Author to whom correspondence should be addressed.
Catalysts 2022, 12(7), 676; https://doi.org/10.3390/catal12070676
Submission received: 11 May 2022 / Revised: 14 June 2022 / Accepted: 17 June 2022 / Published: 21 June 2022

Abstract

:
A high methanol electro-oxidation (MOR) and carbon monoxide (CO) tolerance satisfied the electrochemical requirements of direct methanol fuel cells (DMFCs). The study investigated strontium molybdate (SrMoO4) mixed with Vulcan XC-72, carbon-loaded with 20% Pt. The electrochemical performance was confirmed by MOR and CO tolerance activities measured via cyclic voltammetry (CV). The synergistic effect between Pt and SrMoO4 is essential to affect the electrochemical characteristic. SrMoO4 can help remove CO-like intermediate products on the Pt surface, enhancing electrochemical performance for DMFCs. In addition, HxMoO3/HyMoO3 existence in Sr0.5Mo0.5O4−δ can quickly remove intermediates from Pt surfaces and accelerate the transformation of adsorbed intermediates to CO2. The results obtained showed that 20%-Pt/uncalcined Sr0.5Mo0.5O4−δ-C electrocatalyst has higher MOR and CO tolerance ability in DMFCs. Furthermore, the fabricated DMFC shows excellent long-term electrochemical stability after 1000 cycles and a maximum power density (1.42 mW/cm2) higher than commercial 20%-Pt/C (1.27 mW/cm2).

1. Introduction

Global warming has already created extreme weather globally. The European Union’s energy and climate policy requires energy system transformations to reduce greenhouse gas emissions in 2050 to less than 80% of 1990 levels [1]. The conversion of carbon dioxide produced by feedstock into green methanol [2] is a key strategic factor for renewable energy and creating a low-carbon economy. The manufacturing cost of renewable methanol will be gradually reduced by 2030, making it cheaper than coal and natural gas [2]. Methanol (CH3OH) is a liquid fuel at room temperature, making it less toxic and providing higher octane value [3] than gasoline. It is also much easier to handle and store than pure H2, another alternative fuel. Methanol is a crucial fuel for direct methanol fuel cells (DMFCs). Although DMFCs face more difficulty when used in transportation power technology than well-known hydrogen fuels of polymer electrolyte membrane fuel cells (PEMFCs), there is still an opportunity for their use in portable power systems. Simultaneously, DMFCs are environmentally friendly when converting chemical energy from liquid methanol fuel to electrical energy as they only generate water and carbon dioxide (CO2) byproducts. However, DMFCs have the crossover of methanol fuel from the anode to the cathode electrode [4] and undergo electro-oxidation to CO2 on the anode. The electrochemical performance and durability of the electrocatalysts were reduced because of Pt-absorbed carbon monoxide (CO), causing poison (Equations (1)–(3)) [5,6] and blockage [7,8] of the surface of Pt during MOR.
CH3OH + H2O → CO2 + 6H+ + 6e
2Pt + H2 → 2Pt–Hads
CO2 + 2Pt–Hads→ Pt–COads +H2O + Pt
One method used to maintain the performance of DMFCs includes adding a high loading amount of Pt or Pt alloys on carbon as an electrocatalyst to increase CO tolerance [9]. Another method to improve Pt is poisoned by Pt loading on metal oxide (MO) and carbon as an electrocatalyst that can create a synergistic effect between Pt and MO. This synergistic effect enhances CO tolerance, as expressed in Equations (4) and (5) [10].
MO + H2O → MO–OHads +H+ + e
Pt-COads +MO–OHads→ Pt + MO +CO2 + H+ + e
Therefore, many studies have been performed with MOs incorporating Pt to create electrocatalysts that not only enhance MOR activity but also are not susceptible to carbon monoxide poisoning, for example, Pt/CeO2-C [11], Pt-Co3O4 [12], Pt/NiO-C [13], Pt/SnOx-C [14], Pt–Ru/Al2O3-C [15], Pt/WO3 [16], Pt/TixSn1−xO2-C [17], and Pt/Ni-doped CeO2-C [18]. To overcome CO poisoning Pt is loaded on MoO3. Through interaction with molybdenum bronzes (HxMoO3), clean Pt poisoned sites [19] are created during MOR. Justin et al. [20] reported a 128% higher peak current for MOR obtained by Pt-MoO3/C than Pt–Ru/C. Therefore, MoO3 [21] and Mo oxide-based electrocatalysts, such as NiMoO4 nanorods [22], Mo-doped CeO2 (Ce1−xMoxO2−δ) [23,24], Ti1−xMoxO2 [25], and (MoO3)mSnO2 [26], have been investigated.
Strontium molybdate consists of Sr2+ cations and (MoO4)2− anions, which are scheelite-type complex oxide [27] structures. It imporve hydrogen evolution reaction in acid electrolytes [28], photocatalytic degradation of diphenylamine [29], and tetracycline [30]. Thrane et al. [31] reported that SrMoO4 electrocatalysts could be used for the selective oxidation of methanol to formaldehyde.
Although the commercial PtRu-C (E-TEK) electrocatalyst has a higher MOR and more CO tolerance than commercial Pt/C [32,33], its cost is twice that of Pt/C. Therefore, both PtRu-C and Pt/C applied in DMFCs are more limiting. The advantage of the electrocatalytic activity of Pt/C could see it replace other materials. Therefore, the study prepared an electrocatalyst consisting of SrMoO4 with 20%Pt/C loading and found that it could help increase the MOR and improve the CO tolerance. In addition, the influence of different calcination temperatures and amounts of Sr mixed with the Mo contact during SrMoO4 preparation on MOR and CO tolerance was investigated.

2. Results and Discussion

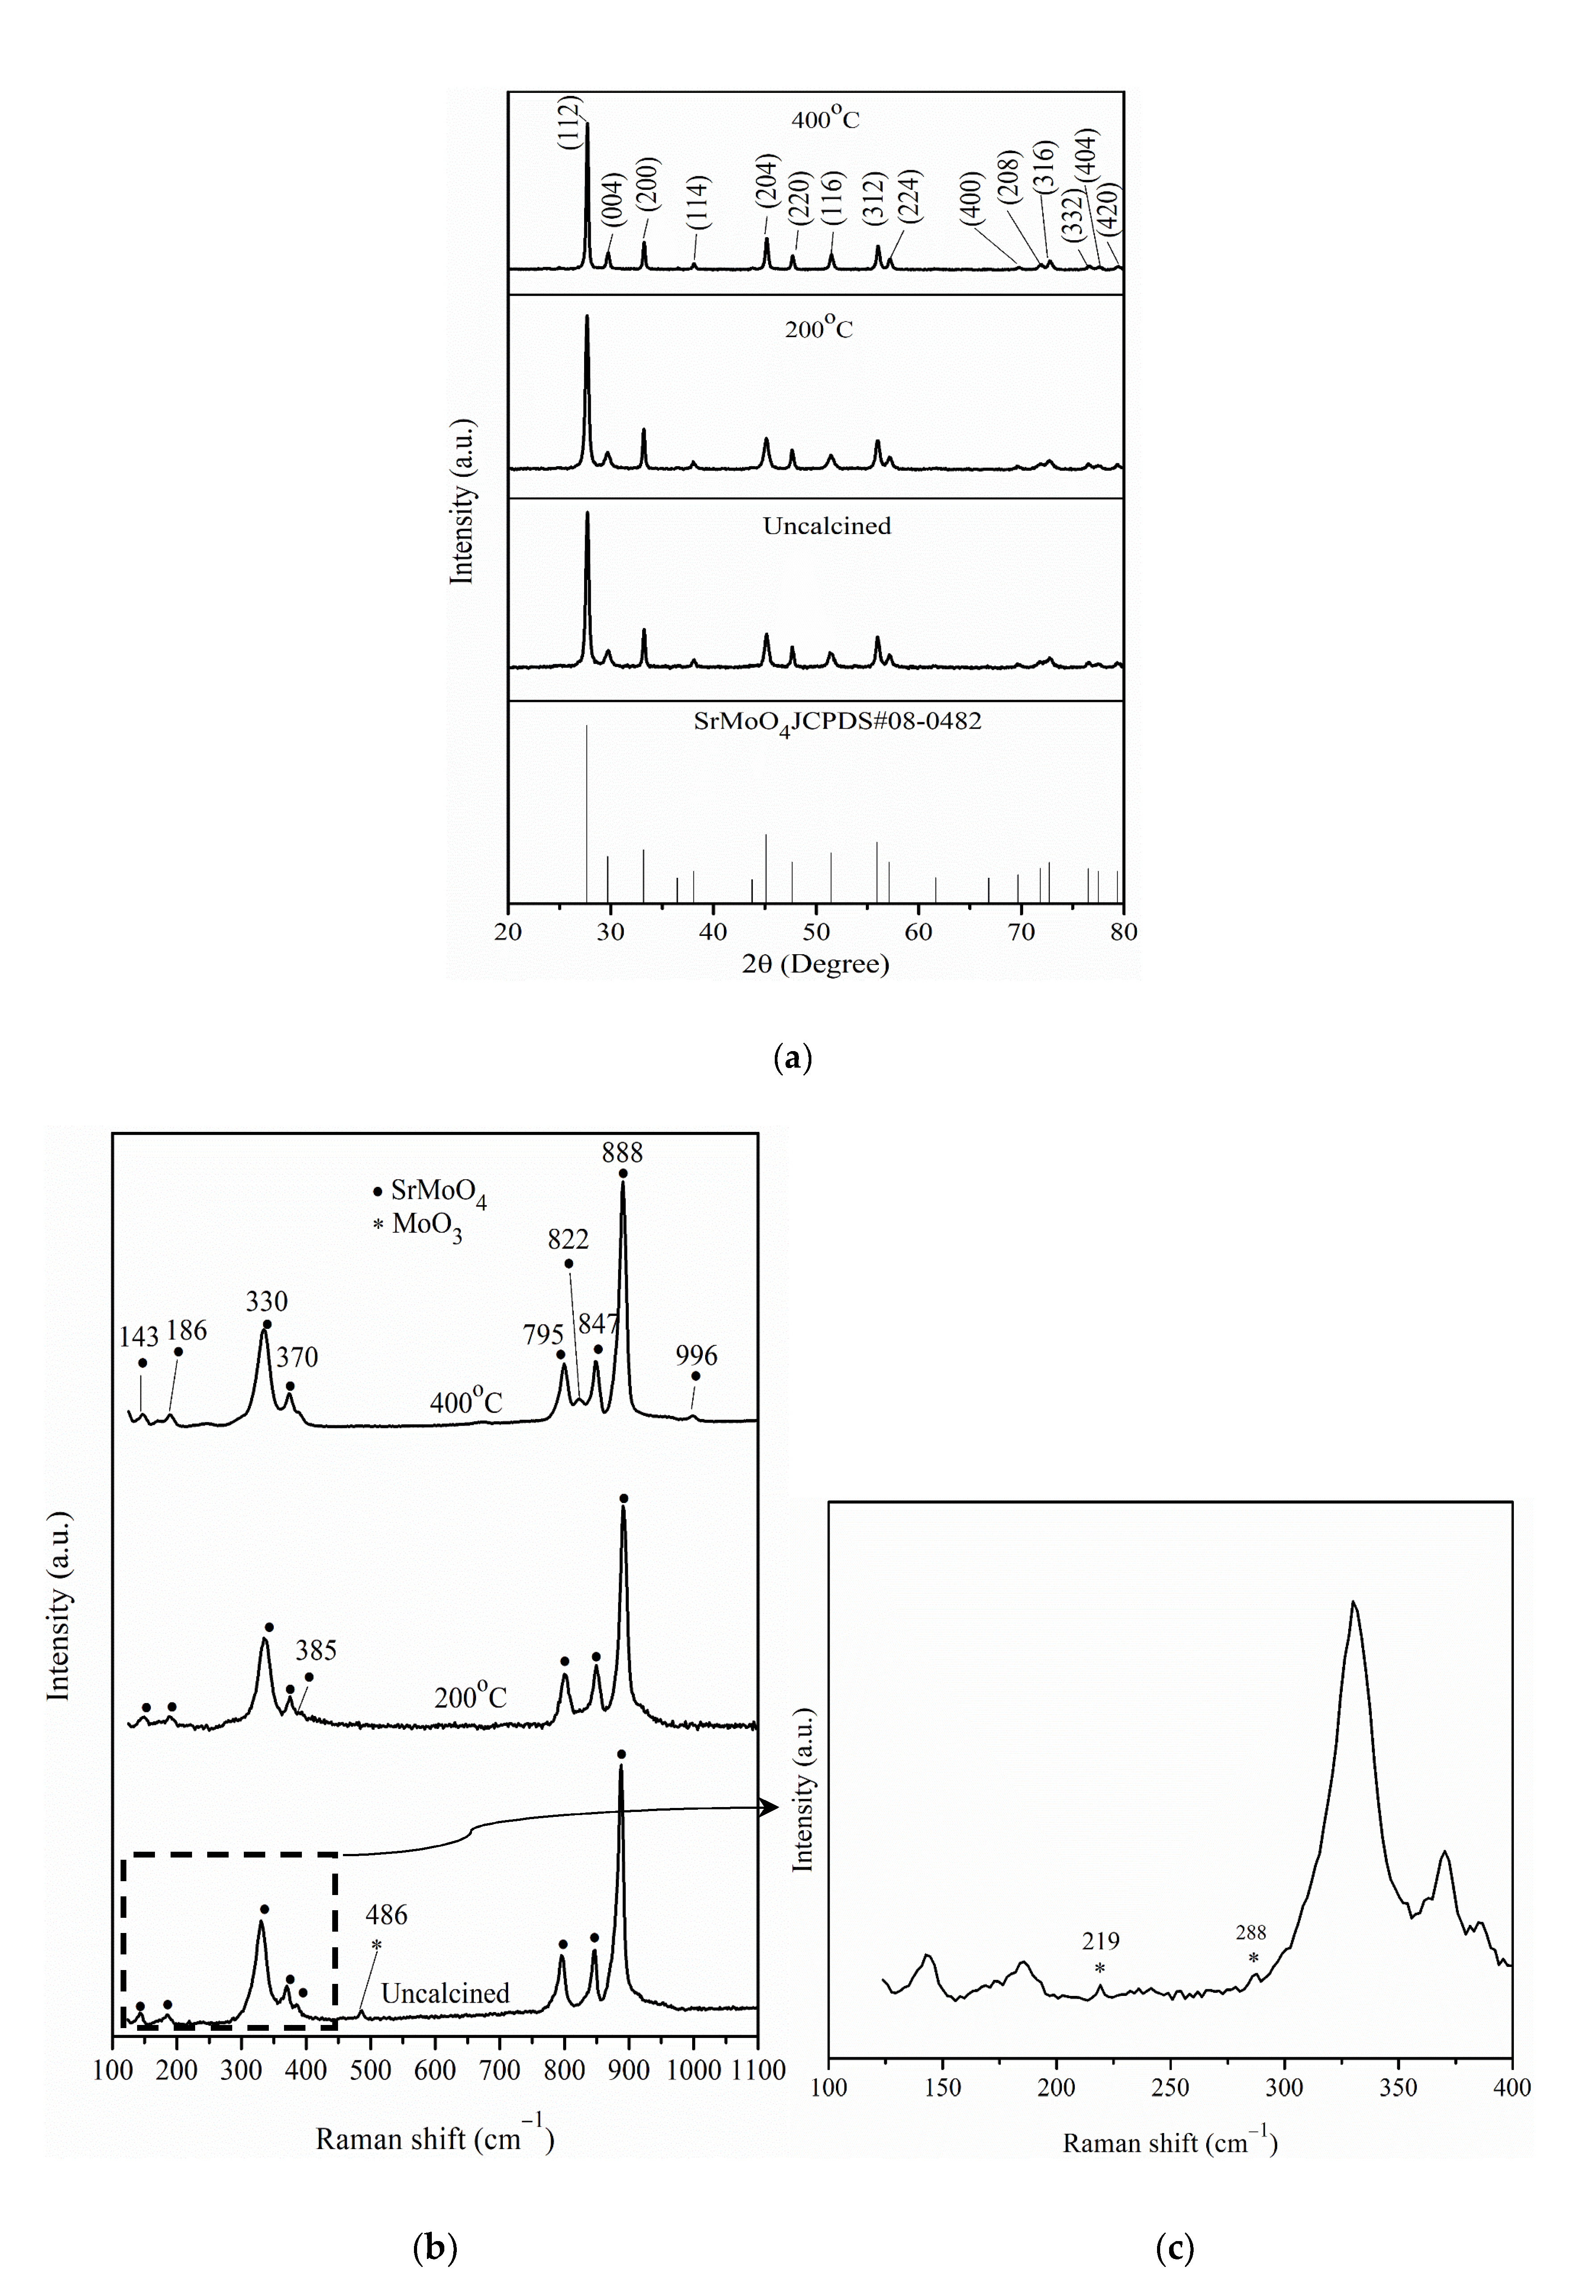
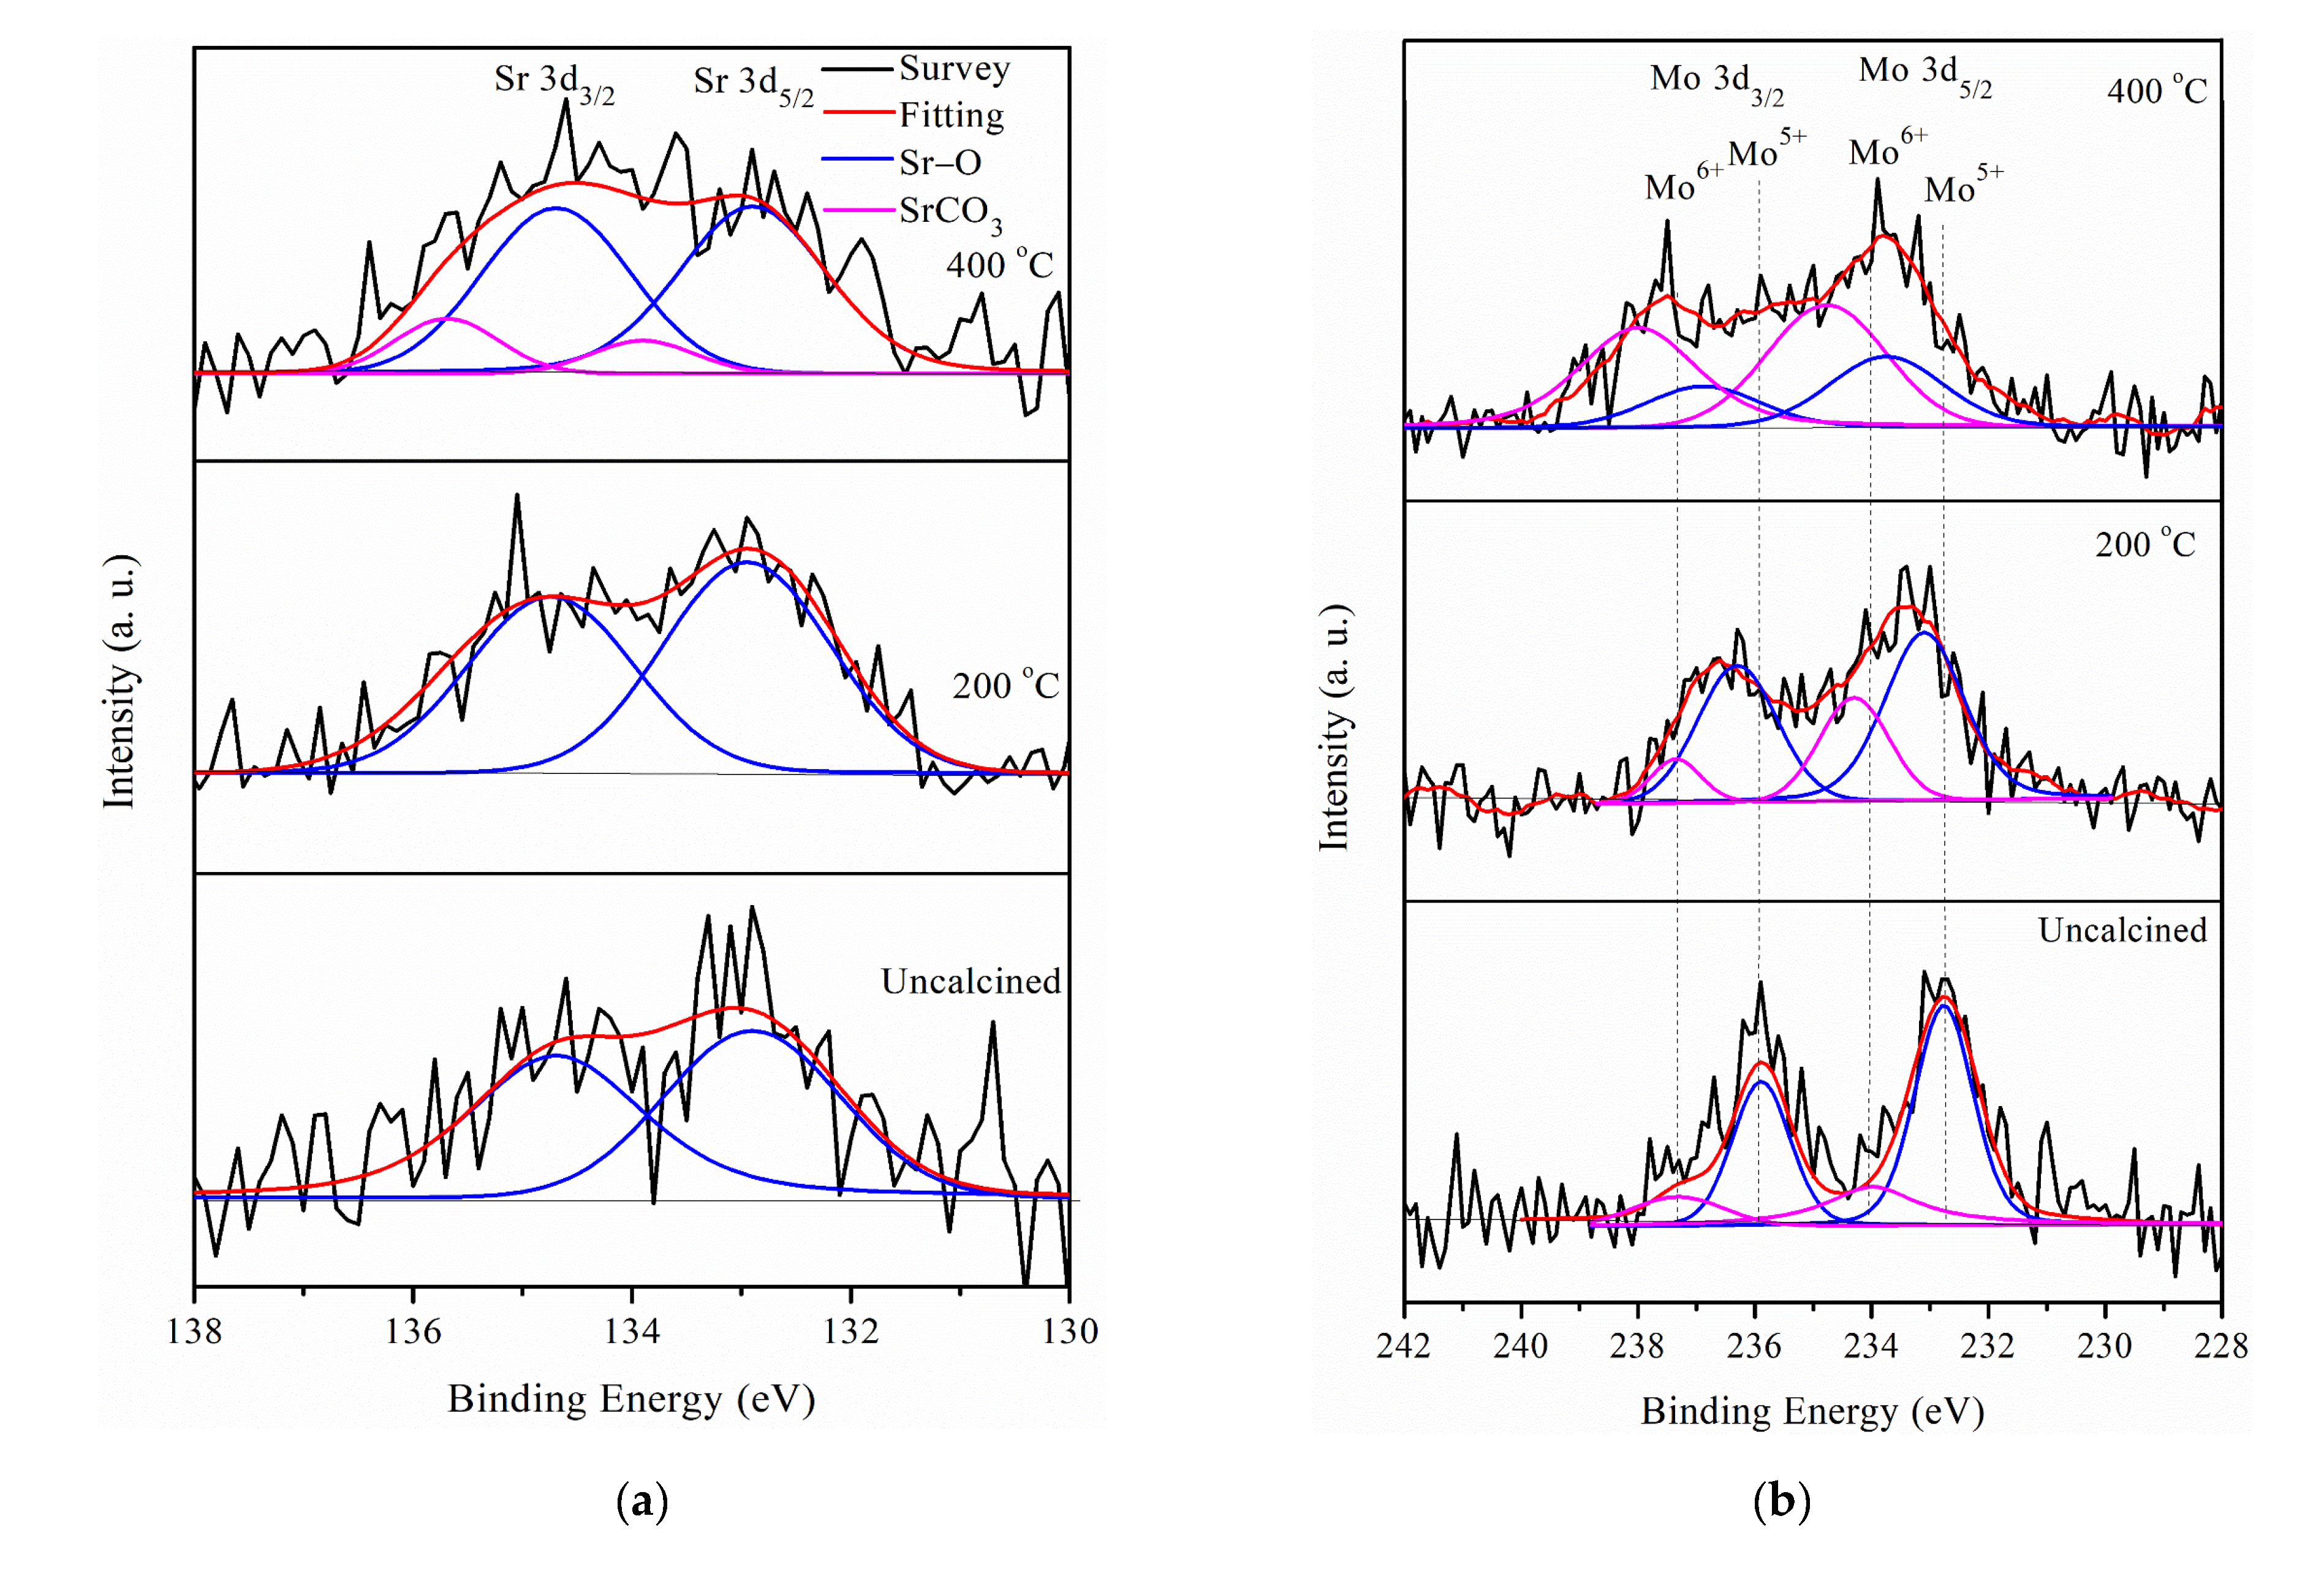
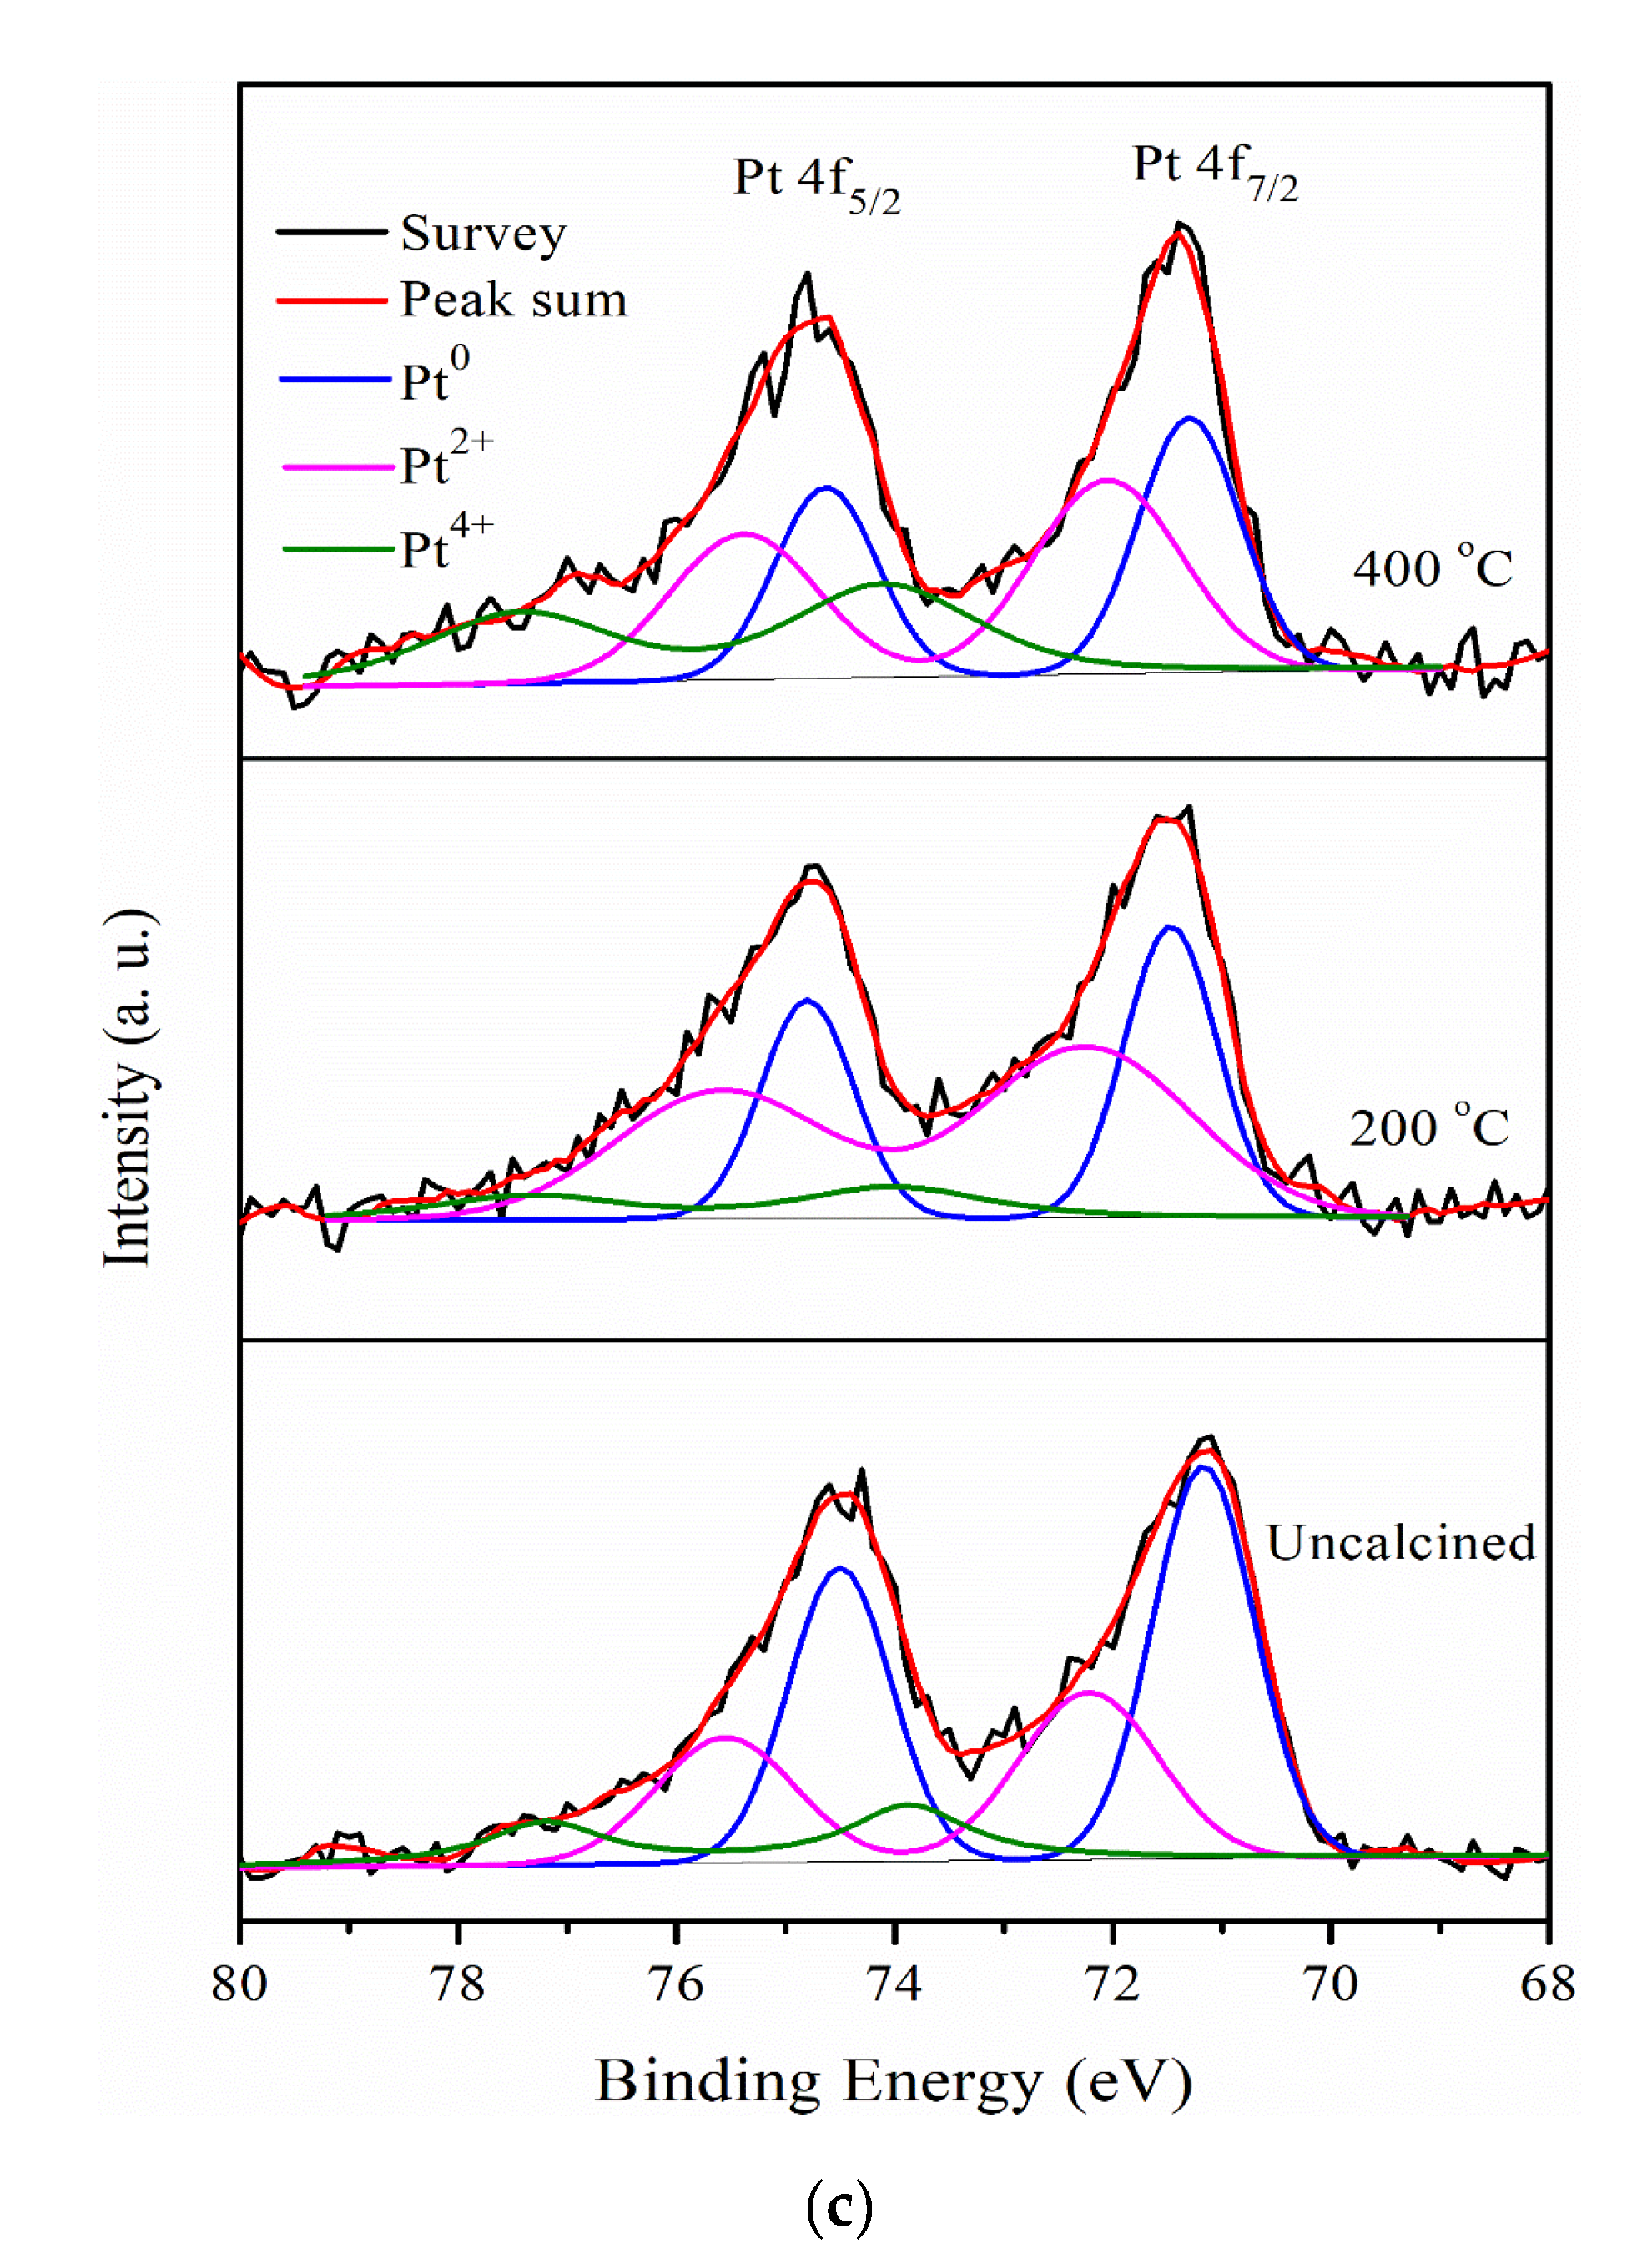
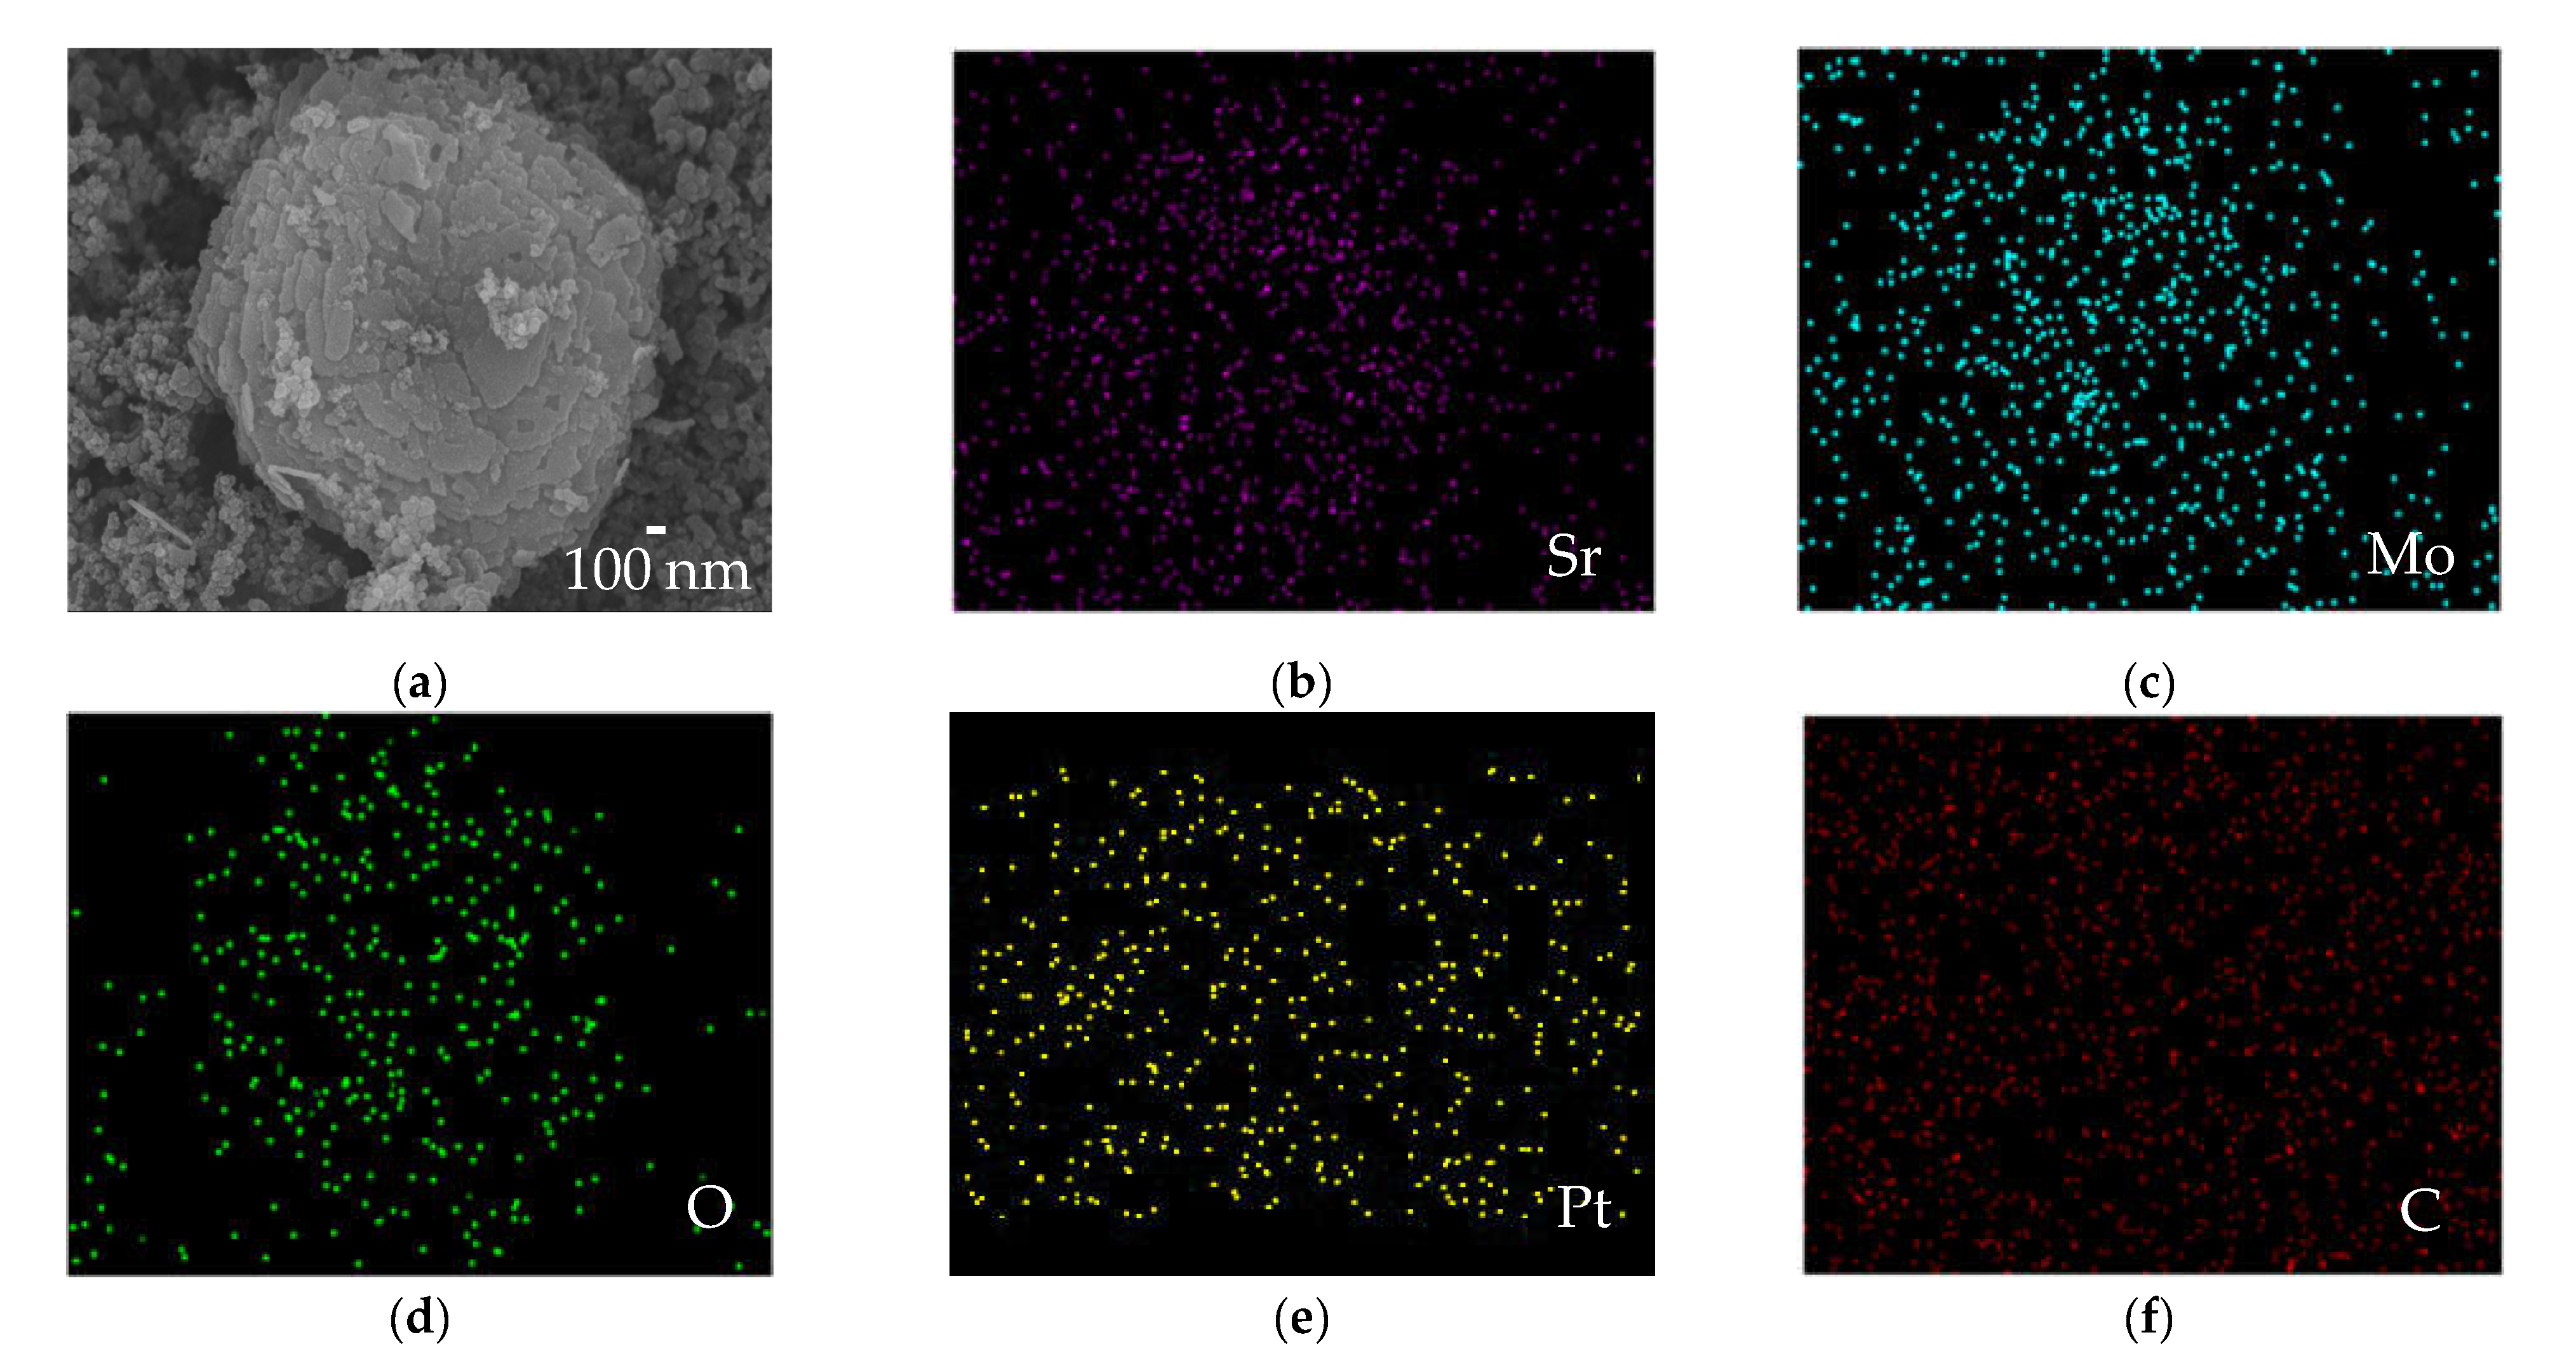
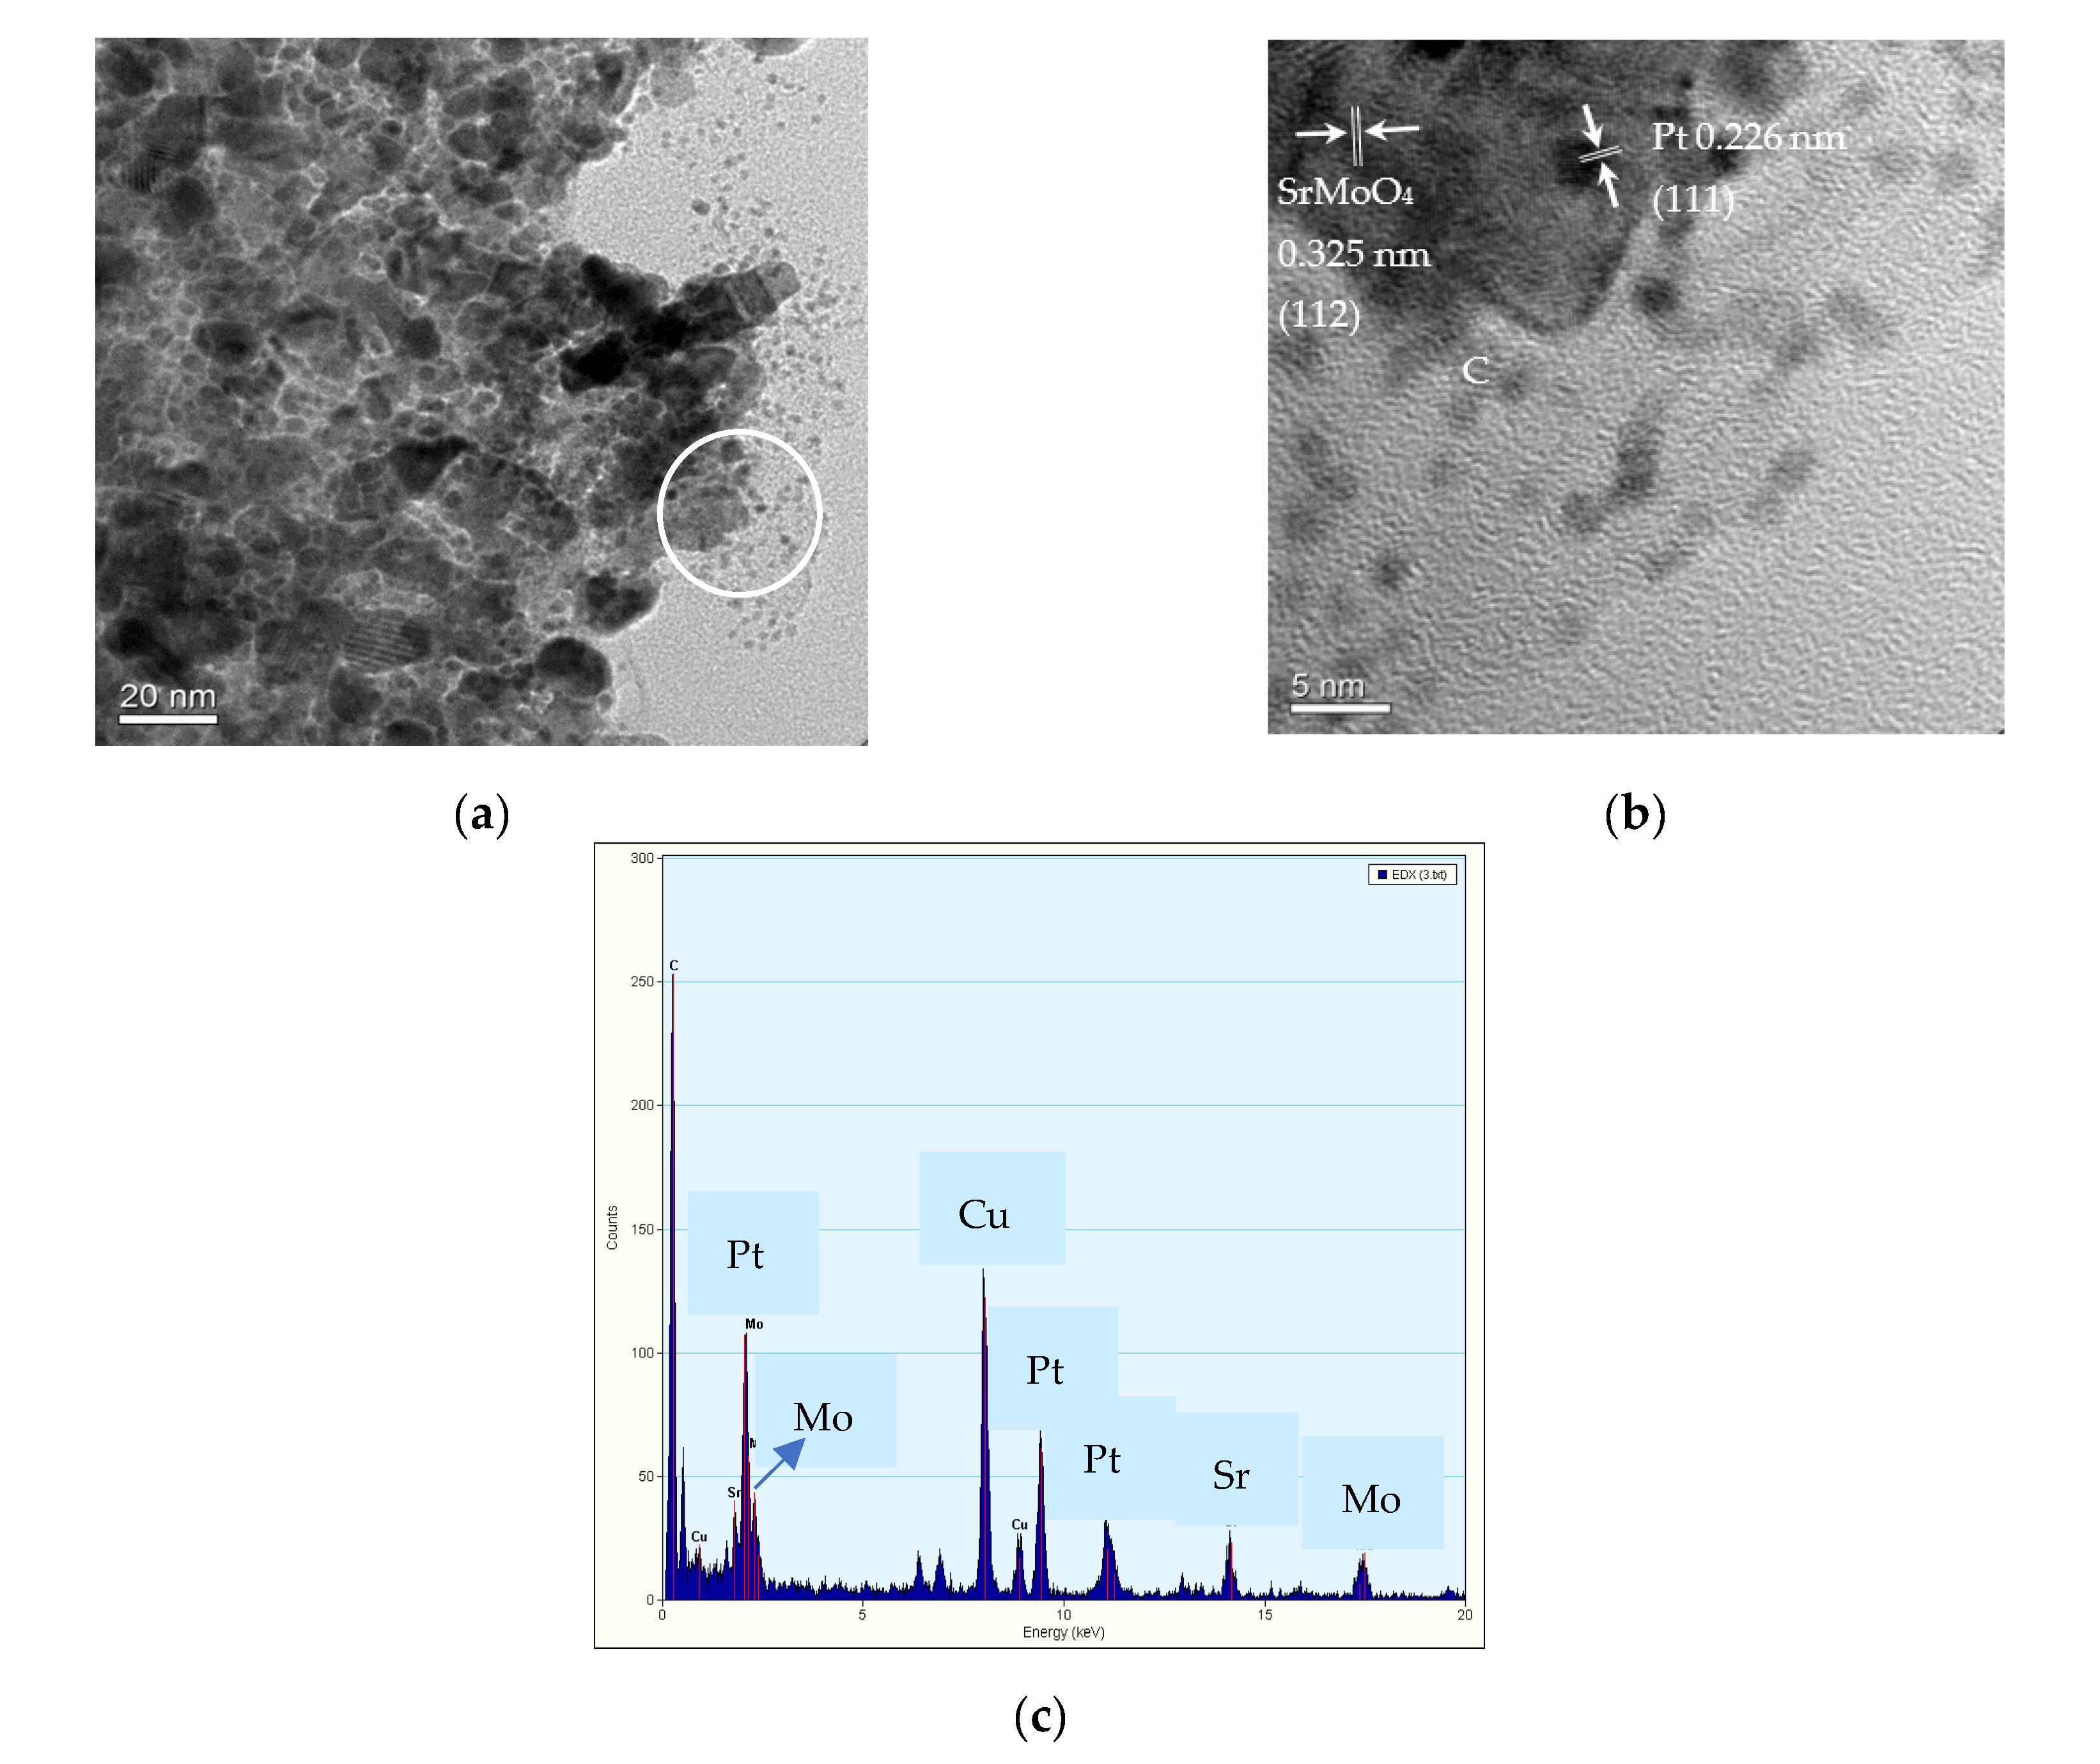
2.1. Characterization of Pt/different Calcination Temperature Sr0.5Mo0.5O4−δ-C Electrocatalysts

SrMoO4 was subjected to different calcination temperatures, whose structures were confirmed by XRD in Figure 1a. The results show that the 2θ peak values agree with the characteristic peaks for the planes of tetragonal SrMoO4 (JCPDS no. 08-0482). The Raman vibrational modes of SrMoO4 compounds obtained at different Sr0.5Mo0.5O4δ calcination temperatures correspond with those reported by Vidya et al. [34] and Sczancoski et al. [35], as shown in Figure 1b. Three Raman active mode peaks of MoO3 are obtained at 219 cm−1 (Ag, rotational rigid MoO4 chain mode), at 288 cm−1 (B2g, δO=M=O wagging) in Figure 2c, and at 486 cm−1 (Ag, νas O–M–O stretch and bend) [36] for uncalcined Sr0.5Mo0.5O4−δ. However, these active mode peaks of MoO3 do not appear at Sr0.5Mo0.5O4−δ calcination temperatures of 200 °C and 400 °C. Higher calcination temperatures more easily produce the diffuse phenomenon, which leads to increased crystalline structure formation of SrMoO4.
The XPS analysis of different electrocatalysts in the Sr 3d, Mo 3d, and Pt 4f regions are presented in Figure 2. All fitting curves followed the rules of FWHM and the double separation of metal peaks, as shown in Table S1–S3 (Supplementary Materials). Figure 2a shows that the Sr 3d5/2 and Sr 3d3/2 doublets appear due to the spin-orbital splitting of Sr 3d peaks at binding energies of 132.8 and 134.8 eV, which correspond to SrO structure [37]. This result means that Sr2+ is incorporated into the MoO4−2 structure at different Sr0.5Mo0.5O4−δ calcination temperatures. However, Sr0.5Mo0.5O4−δ under a calcination temperature of 400 °C generates extra Sr 3d spectra divided into two peaks, at binding energies of 133.90 and 135.69 eV, corresponding to strontium carbonate (SrCO3) [37], which depends on SrO capturing CO2 in the air [38].
The Mo 3d doublet consisted of two distinct chemical states on Mo6+ and Mo5+ for different calcination temperatures of Sr0.5Mo0.5O4−δ, as shown in Figure 2b. The peaks of Mo5+ 3d5/2 and 3d3/2 were at 232.7 and 235.6 eV, respectively. The Mo doublets at 233.8 and 237.2 eV proved that the Mo6+chemical state existed [39] in the Sr0.5Mo0.5O4−δ. The relative areas of integrated peak intensities of Mo5+ decreased and, in contrast to that of Mo6+, increased with calcination temperature increase, as shown in Table 1. The Mo6+ relative area increased, meaning more SrMoO4 compound formation with increasing calcination temperature.
In addition, the Pt 4f region displays spin-orbit splitting doublet peaks of 4f7/2 and 4f5/2 for Pt/various Sr0.5Mo0.5O4−δ/C, as shown in Figure 2c. All the Pt 4f signals consist of three doublets that can be attributed to different valence states of Pt. The first doublet peaks at approximately 71.25 and 74.58 eV are attributed to metallic Pt (Pt0) [40]. The second doublet peaks at approximately 72.34 and 75.67 eV, respectively, can be assigned to Pt2+ species of Pt-O or Pt(OH)2, formed by the surface of Pt being oxidized or hydroxide [41]. The third doublet peaks at approximately 74.24 and 77.57 eV correspond to Pt4+ of PtO2 [42]. The relative area of integrated peak intensities for Pt/different calcined temperature Sr0.5Mo0.5O4−δ-C are shown in Table 1. Pt loading on Sr0.5Mo0.5O4−δ with calcination temperatures of 200 °C and 400 °C caused increased PtO and PtO2 formation with less or no MoO3 formation.
The particle shape of uncalcined Sr0.5Mo0.5O4−δ was donut-like or flower-like, as indicated by the SEM image in Figure 3a. These results are similar to the images reported by Wannapop et al., wherein donut-like SrMoO4 was produced using the microwave-hydrothermal process [43]. The Pt/uncalcined Sr0.5Mo0.5O4−δ-C electrocatalysts contain Pt, Sr, Mo, O, and C elements, as shown in Figure 3b–f. These results indicate the successful incorporation of Pt loading into the uncalcined Sr0.5Mo0.5O4−δ-C. Figure 4a shows TEM images of Pt/uncalcined Sr0.5Mo0.5O4−δ-C with Pt particles deposited from 2 to 2.5 nm. The HRTEM image (Figure 4b) shows lattice fringes with d spacings of 0.325 and 0.226 nm, which are attributed to SrMoO4 (112) and Pt (111), respectively. EDS results confirmed the simultaneous existence of Pt, Sr, and Mo elements in the Pt/Sr0.5Mo0.5O4−δ-C, as shown in Figure 5c.

2.2. MOR and CO Tolerance for Strontium Molybdate with Different Calcination Temperatures

Sr0.5Mo0.5O4−δ was studied under different calcination temperatures (i.e., uncalcined, 200 °C, and 400 °C). Electrochemical performances for MOR and COR are shown in Figure 5. The CV of 20%-Pt loaded various Sr0.5Mo0.5O4−δ mixed with carbon is shown in Figure 5a. The hydrogen adsorption and desorption peaks obtained between −0.2 and 0.1 V are shown in Figure 5b. The average areas were used to calculate the ECSAH. The removal of incompletely oxidized carbonaceous species formation is demonstrated by the forward current density peak of potentials [44] during MOR. All electrocatalysts have a similar forward current density peak of potentials, and the oxidation peak potentials in the reverse scan are similar in Figure 5a. The forward peak current density and ECSAH decrease for Sr0.5Mo0.5O4-δ under calcination temperature increase. It was in the following order: uncalcined > 200 °C > 400 °C, as shown in Table 2. In addition, Pt/uncalcined Sr0.5Mo0.5O4−δ–C electrocatalyst obtained the lowest onset potential of MOR at 344 mV (Table 2). The results lead to it having the lowest overpotential of methanol oxidation and facilitating fast methanol oxidation at the electrode surface [45]. Furthermore, it is confirmed that Pt/uncalcined Sr0.5Mo0.5O4−δ-C electrocatalysts possess higher MOR activity. In addition, the remarkable MOR properties of Pt/uncalcined Sr0.5Mo0.5O4−δ/C are noted in Figure 5b, which shows that a peak between 0.08 and 0.32 V contributes to the formation of HxMoO3 by hydrogen adsorption on Pt and migration onto the MoO3 surface [20] in Sr0.5Mo0.5O4−δ following the mechanism described by Equation (6) [46]. HxMoO3 can oxidize adsorption intermediates (CO or CHzOads, 0 ≤ z ≤ 4) on Pt, as shown by Equation (7) [47]. However, HxMoO3 provides charge transport across the support and can be easily oxidized on the Pt to form HxMoO3 with less hydrogen (HyMoO3) (0 < y < x < 2), which plays a role as a proton acceptor [20]. HyMoO3 can also oxidize adsorption intermediates on Pt, as shown by Equation (8) [48].
MoO3 + xPt-H → HxMoO3 + xe + xPt
Pt–COads/Pt–CHzOads + HxMoO3 + H2O → CO2 + Pt + Hx+2MoO3
Pt–COads/Pt–CHzOads + HyMoO3 + H2O → CO2 + Pt + HxMoO3
In Figure 5b, the peak demonstrates the existence of HxMoO3/ HyMoO3, which can quickly remove intermediates from Pt surfaces and significantly accelerate the transformation of adsorbed intermediates to CO2 [47]. It facilitates methanol adsorption on Pt sites in the presence of MoO3, thereby maintaining higher MOR activity. The results demonstrate that MoO3 compound formation is essential. The MoO3 compound in uncalcined Sr0.5Mo0.5O4−δ structure is confirmed by Raman data, as shown in Figure 1c.
In addition, the charge transfer resistance (Rct) and Nyquist plots of the various electrocatalysts were fitted with the corresponding equivalent circuit, as shown in Figure 5c and its inset. Rs represents the solution resistance for the circuit, Ro is the contact resistance between the electrocatalyst and the support electrode, and the constant phase element (CPE) is the double-layer capacitance associated with the adsorption of intermediates formed during MOR [49]. The results show that the Rct increased with Sr0.5Mo0.5O4−δ-C under increasing calcination temperature, meaning electrical conductivity decreased. Loading less metallic Pt on the electrocatalyst surface causes the electrical conductivity to decrease when Sr0.5Mo0.5O4−δ calcined temperature increases, as shown in Table 1. The Pt/uncalcined Sr0.5Mo0.5O4−δ-C obtained the highest electrical conductivity, which was better than that of commercial Pt/C. The results indicated that the ion transfer rate was faster and led to the best electrocatalytic activity for MOR.
As shown in Figure 5d, the peak area and CO onset potential appeared in the difference in current density between the 1st cycle and that of the 2nd cycle on various electrocatalysts, indicating the amount of CO stripped off from the Pt surface [50]. The results obtained that Pt/uncalcined Sr0.5Mo0.5O4−δ-C has a slightly higher CO onset potential (476 mV) than that of 200 °C (430 mV) and 400 °C (450 mV). However, the electrocatalysts containing uncalcined treatment of Sr0.5Mo0.5O4−δ obtained the largest ECSACO. The calcination temperature increase leads to ECSACO decreasing (Table 2). As a result, uncalcined Sr0.5Mo0.5O4−δ can help Pt provide more reaction sites by removing the poisoning intermediates [51], leading to electrocatalysts having higher CO electro-oxidation ability during MOR. In addition, the enhanced CO tolerance of the Pt/uncalcined Sr0.5Mo0.5O4−δ-C attributed to the synergistic effect of Pt and SrMoO4. SrMoO4 can facilitate the electro-oxidation of adsorbed CO at lower potentials, as follows in Equations (9) and (10). The OH is adsorbed on the surface of the SrMoO4, which may oxidize the CO on the surface of Pt [51,52].
SrMoO4 + H2O → SrMoO4–OHad + H+ + e
Pt(CO)ad + SrMoO4–OHad → Pt + SrMoO4+ CO2+ H+ + e
The uncalcined Sr0.5Mo0.5O4−δ was in contact with the highest relative area of Mo5+ that was higher than that of 200 °C and 400 °C. It is attributed to MoO3 formed from distorted octahedra [53] and indicates the generation of a higher concentration of oxygen vacancies [54]. The generation of oxygen vacancies allows better electron transfer from the electrocatalysts to the Pt [55]. Moreover, the cations in the vicinity of the oxygen vacancies in uncalcined Sr0.5Mo0.5O4−δ are reduced, triggering electronic interactions between reduced cations and Pt atoms. Moreover, this gives rise to strong metal-support interactions [56], which help improve electrocatalytic MOR performance.
In addition, the binding energy peak of Pt0 is the dominant component of Pt 4f due to its important role in supplying available Pt sites for methanol adsorption for MOR. Therefore, the results show that Pt/uncalcined Sr0.5Mo0.5O4−δ-C generates the largest relative area of Pt0 peak, 54.0% higher than 200 °C (29.3%) and 400 °C (27.1%).
Uncalcined MoO3−δ was prepared to compare with Pt/uncalcined Sr0.5Mo0.5O4−δ-C. The MOR, EIS, and CO tolerance are shown in Figure 5. Unfortunately, Pt/uncalcined MoO3-δ-C obtained lower MOR and CO tolerance with larger Rct characteristics. XRD results of uncalcined MoO3 were analyzed in our previous study [57] and indicated MoOx or molybdenum trioxide hydrate (MoO3∙H2O) compounds. The ionic radius of Sr2+ (1.26 Å) is larger than that of Mo6+ (0.41 Å) [27], forming the substitutional incorporation of Sr2+ ions at Mo6+ sites. It leads to the immediate formation of SrMoO4 crystal structure without calcination. The result of Sr doping in MoO3 compounds is enhanced by MOR and CO tolerances.
The ionic radius of Sr2+ (1.26 Å) is larger than that of Mo6+ (0.41 Å) [27], leading to the immediate formation of SrMoO4 crystal structure without calcination. The result of Sr doping in MoO3 compounds is enhanced by MOR and CO tolerances.

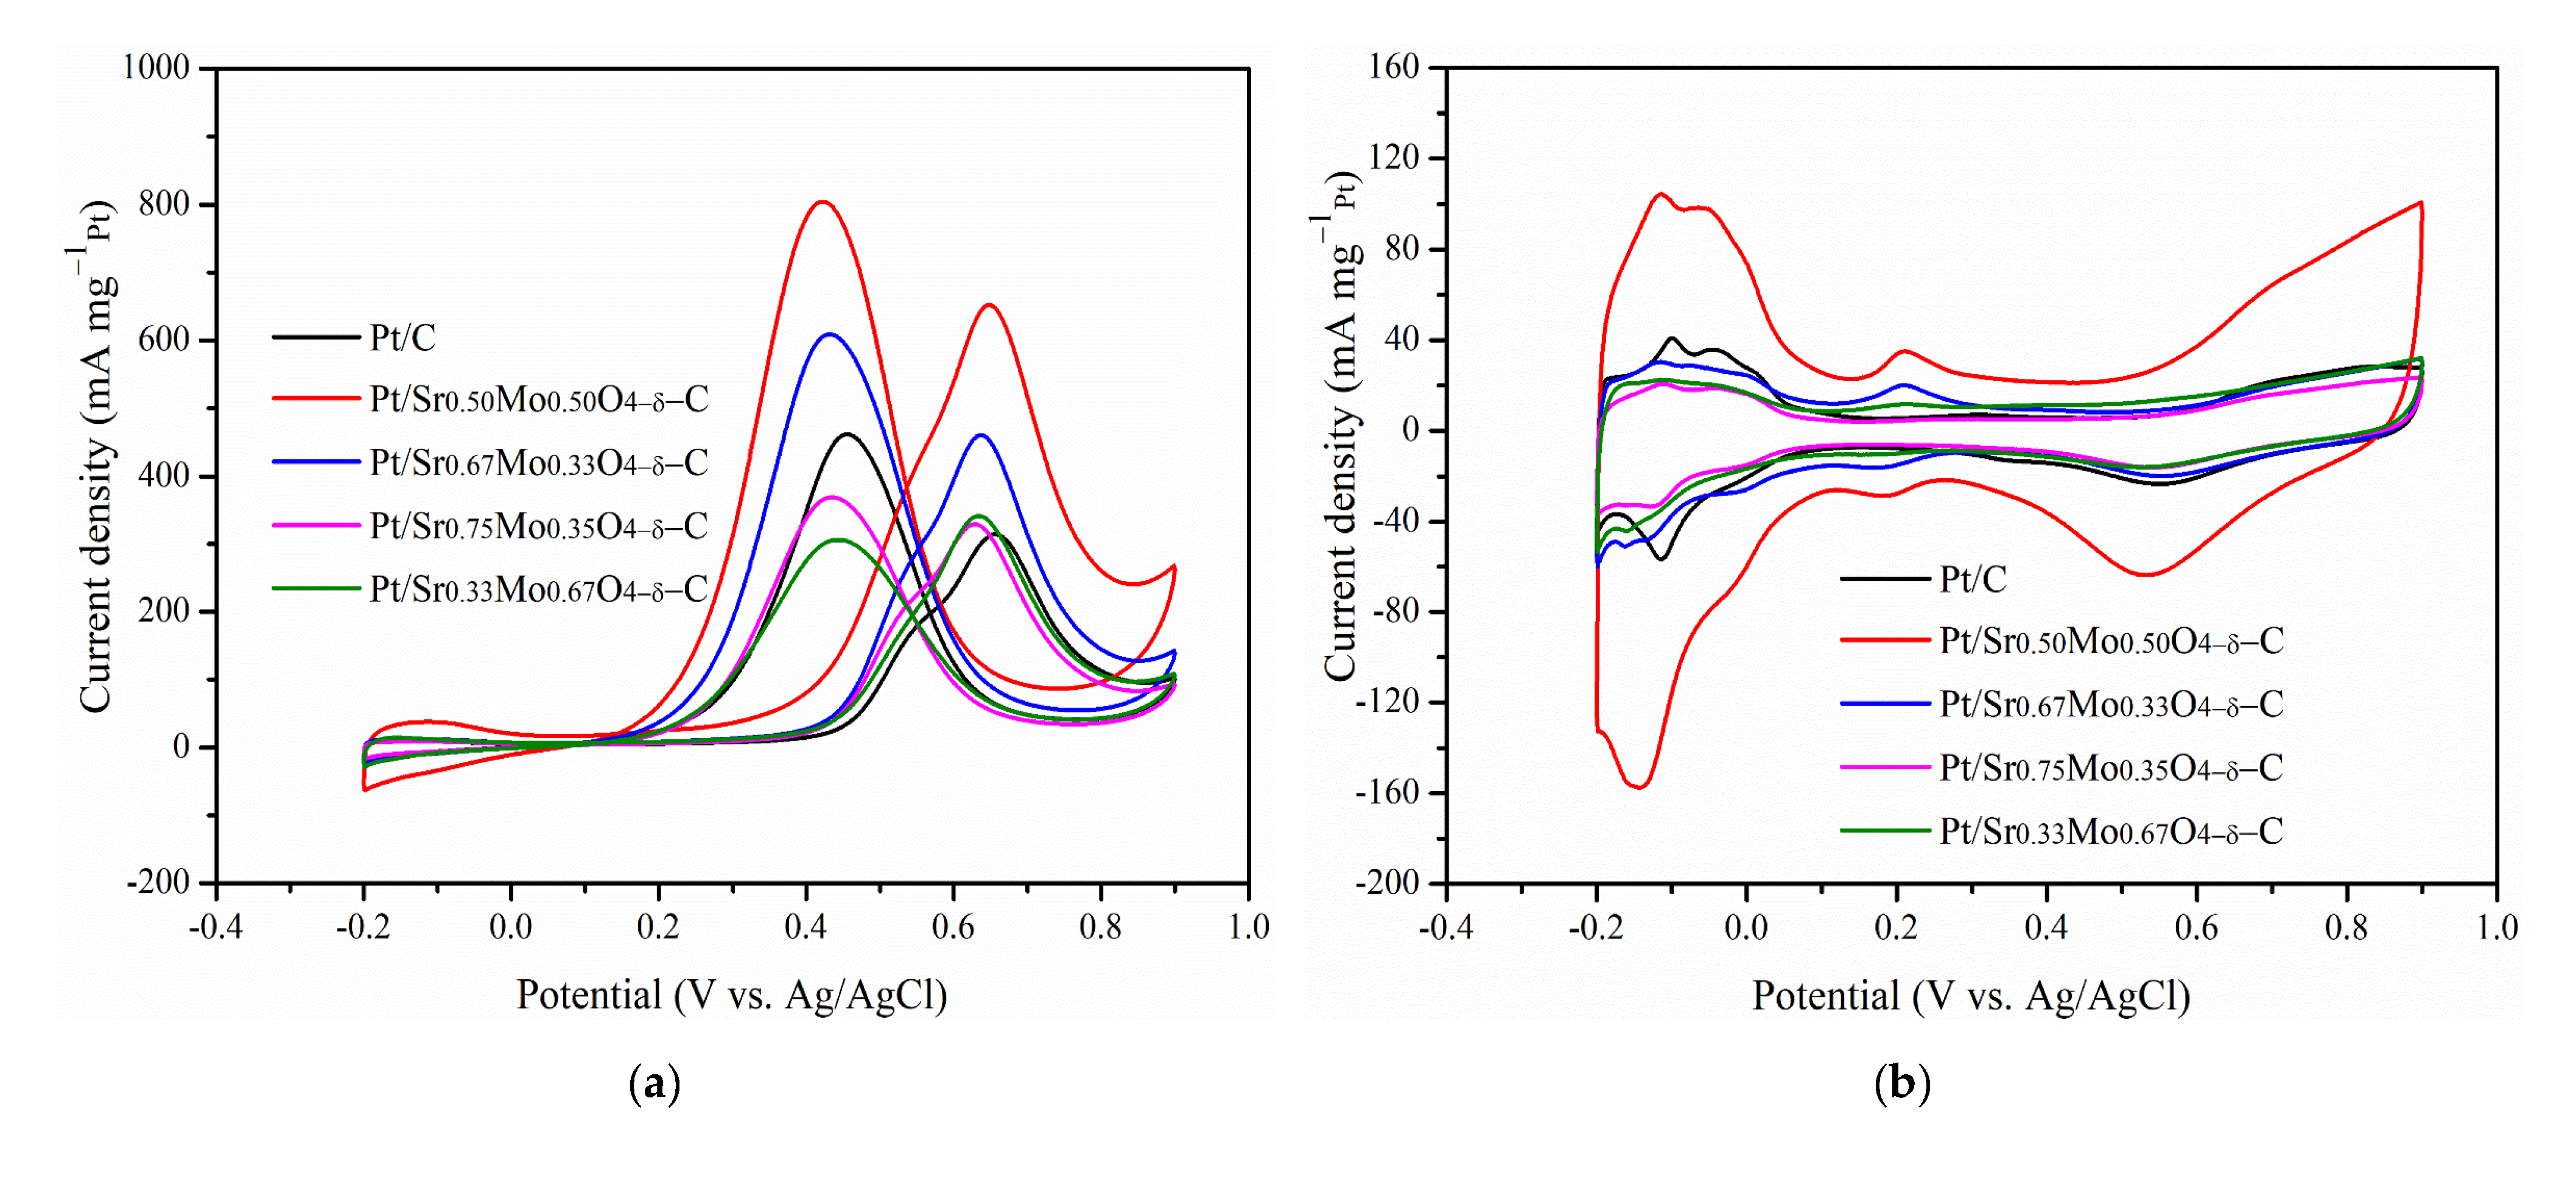
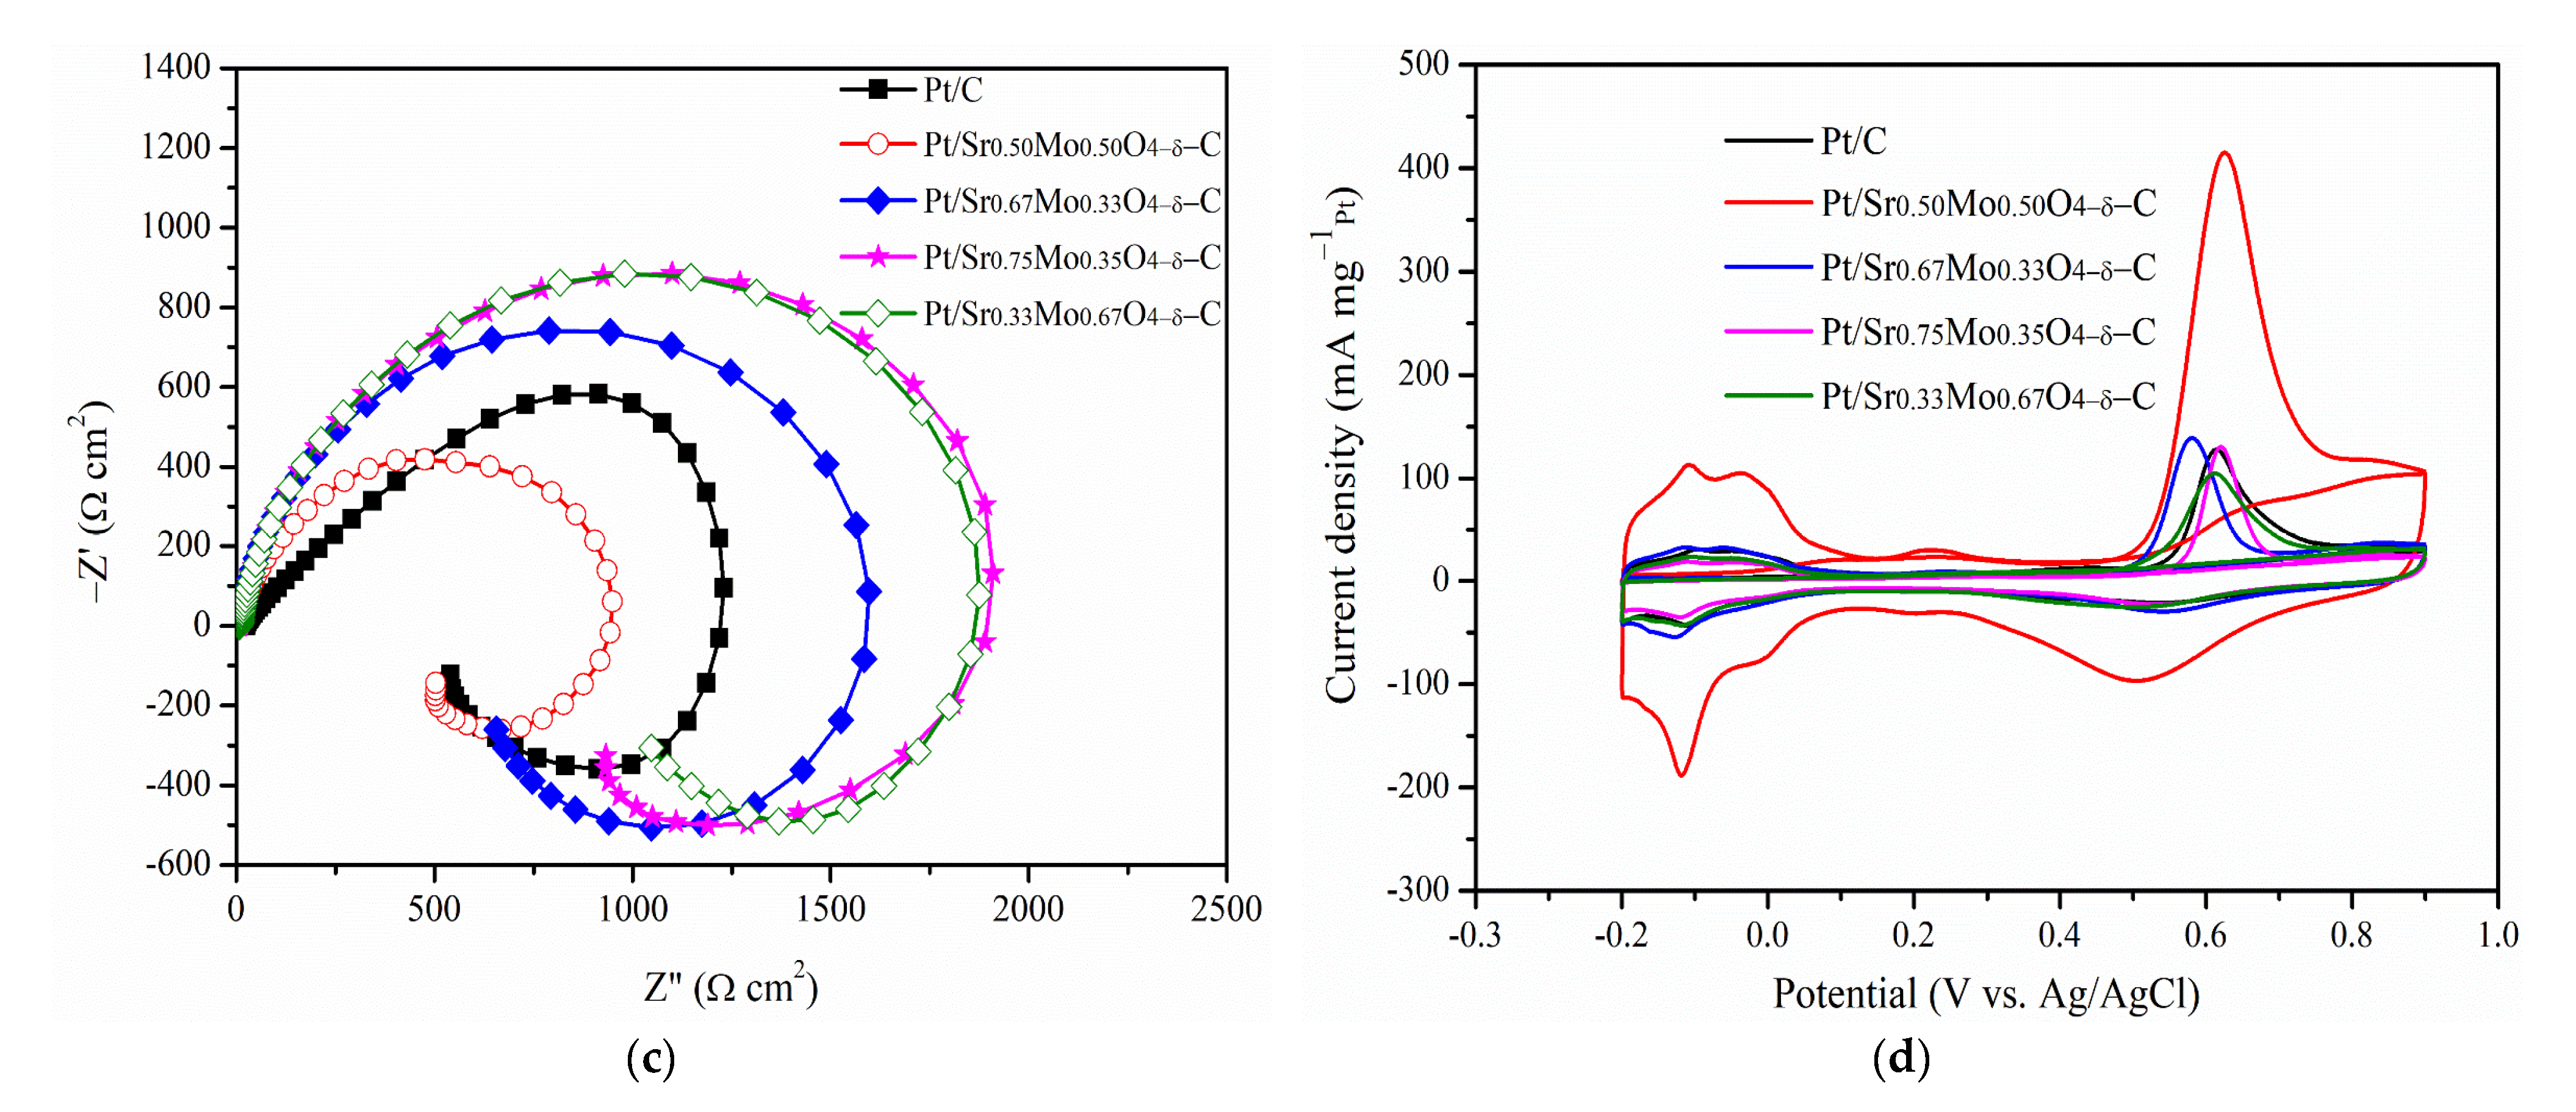
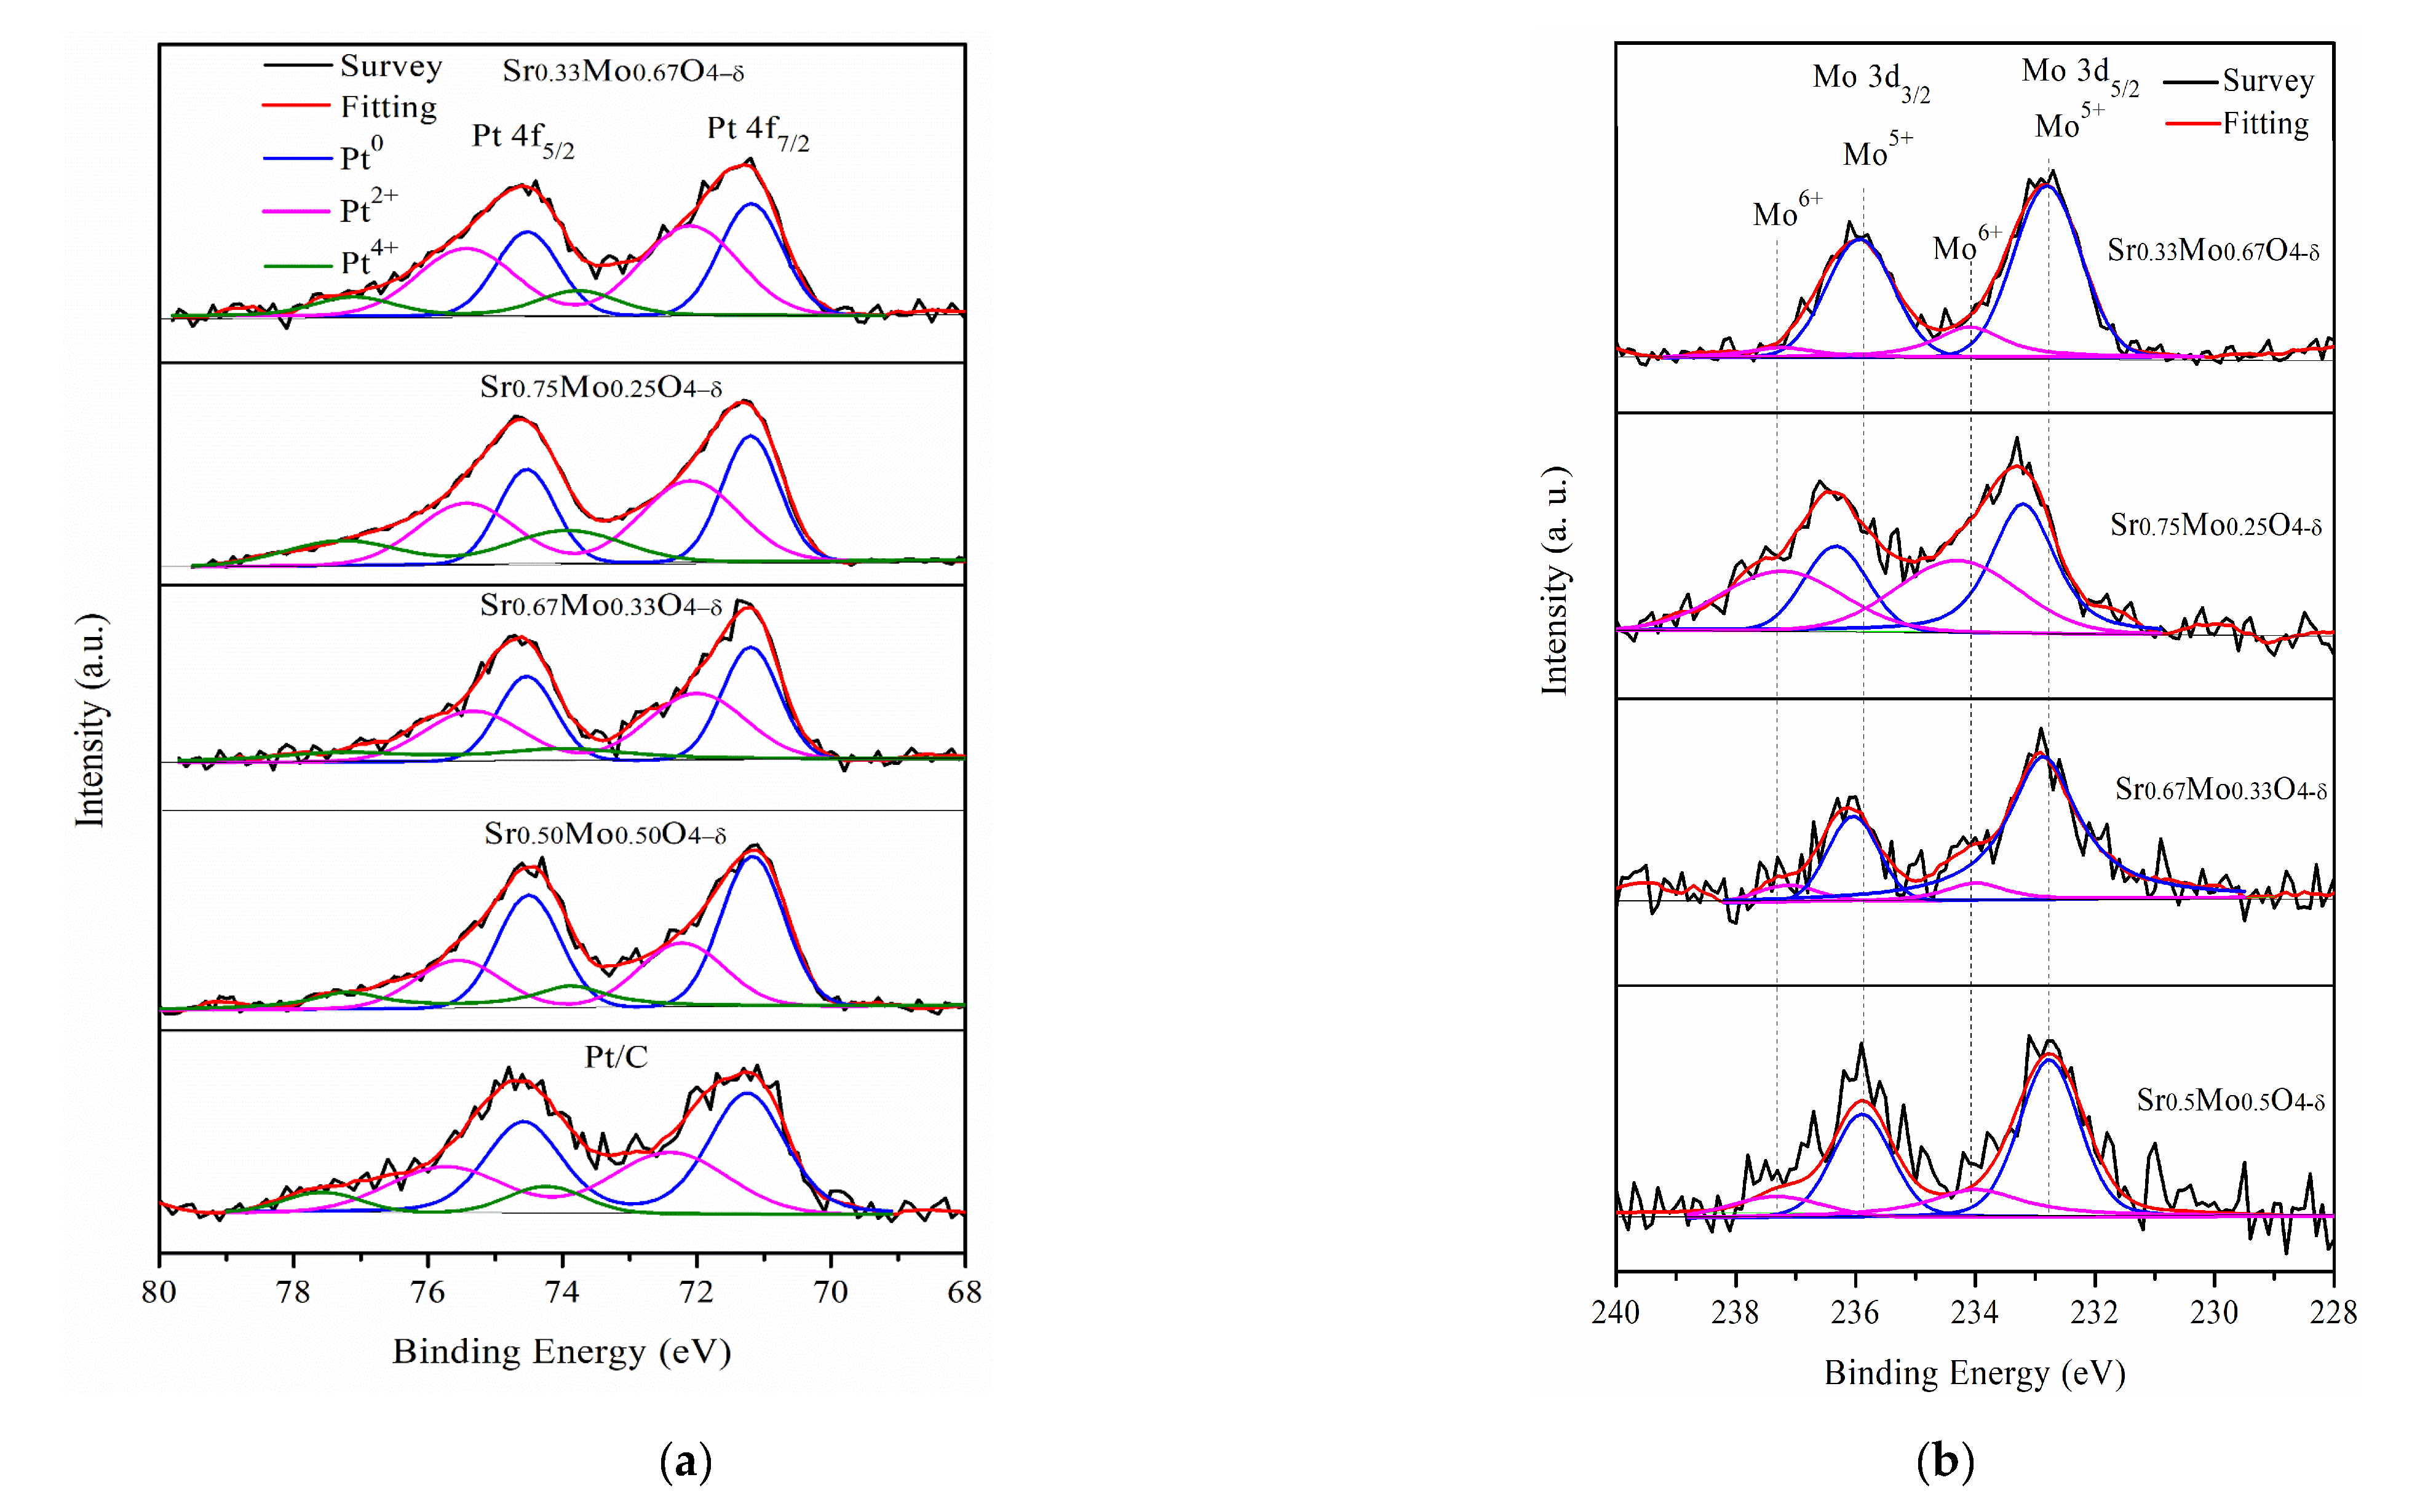
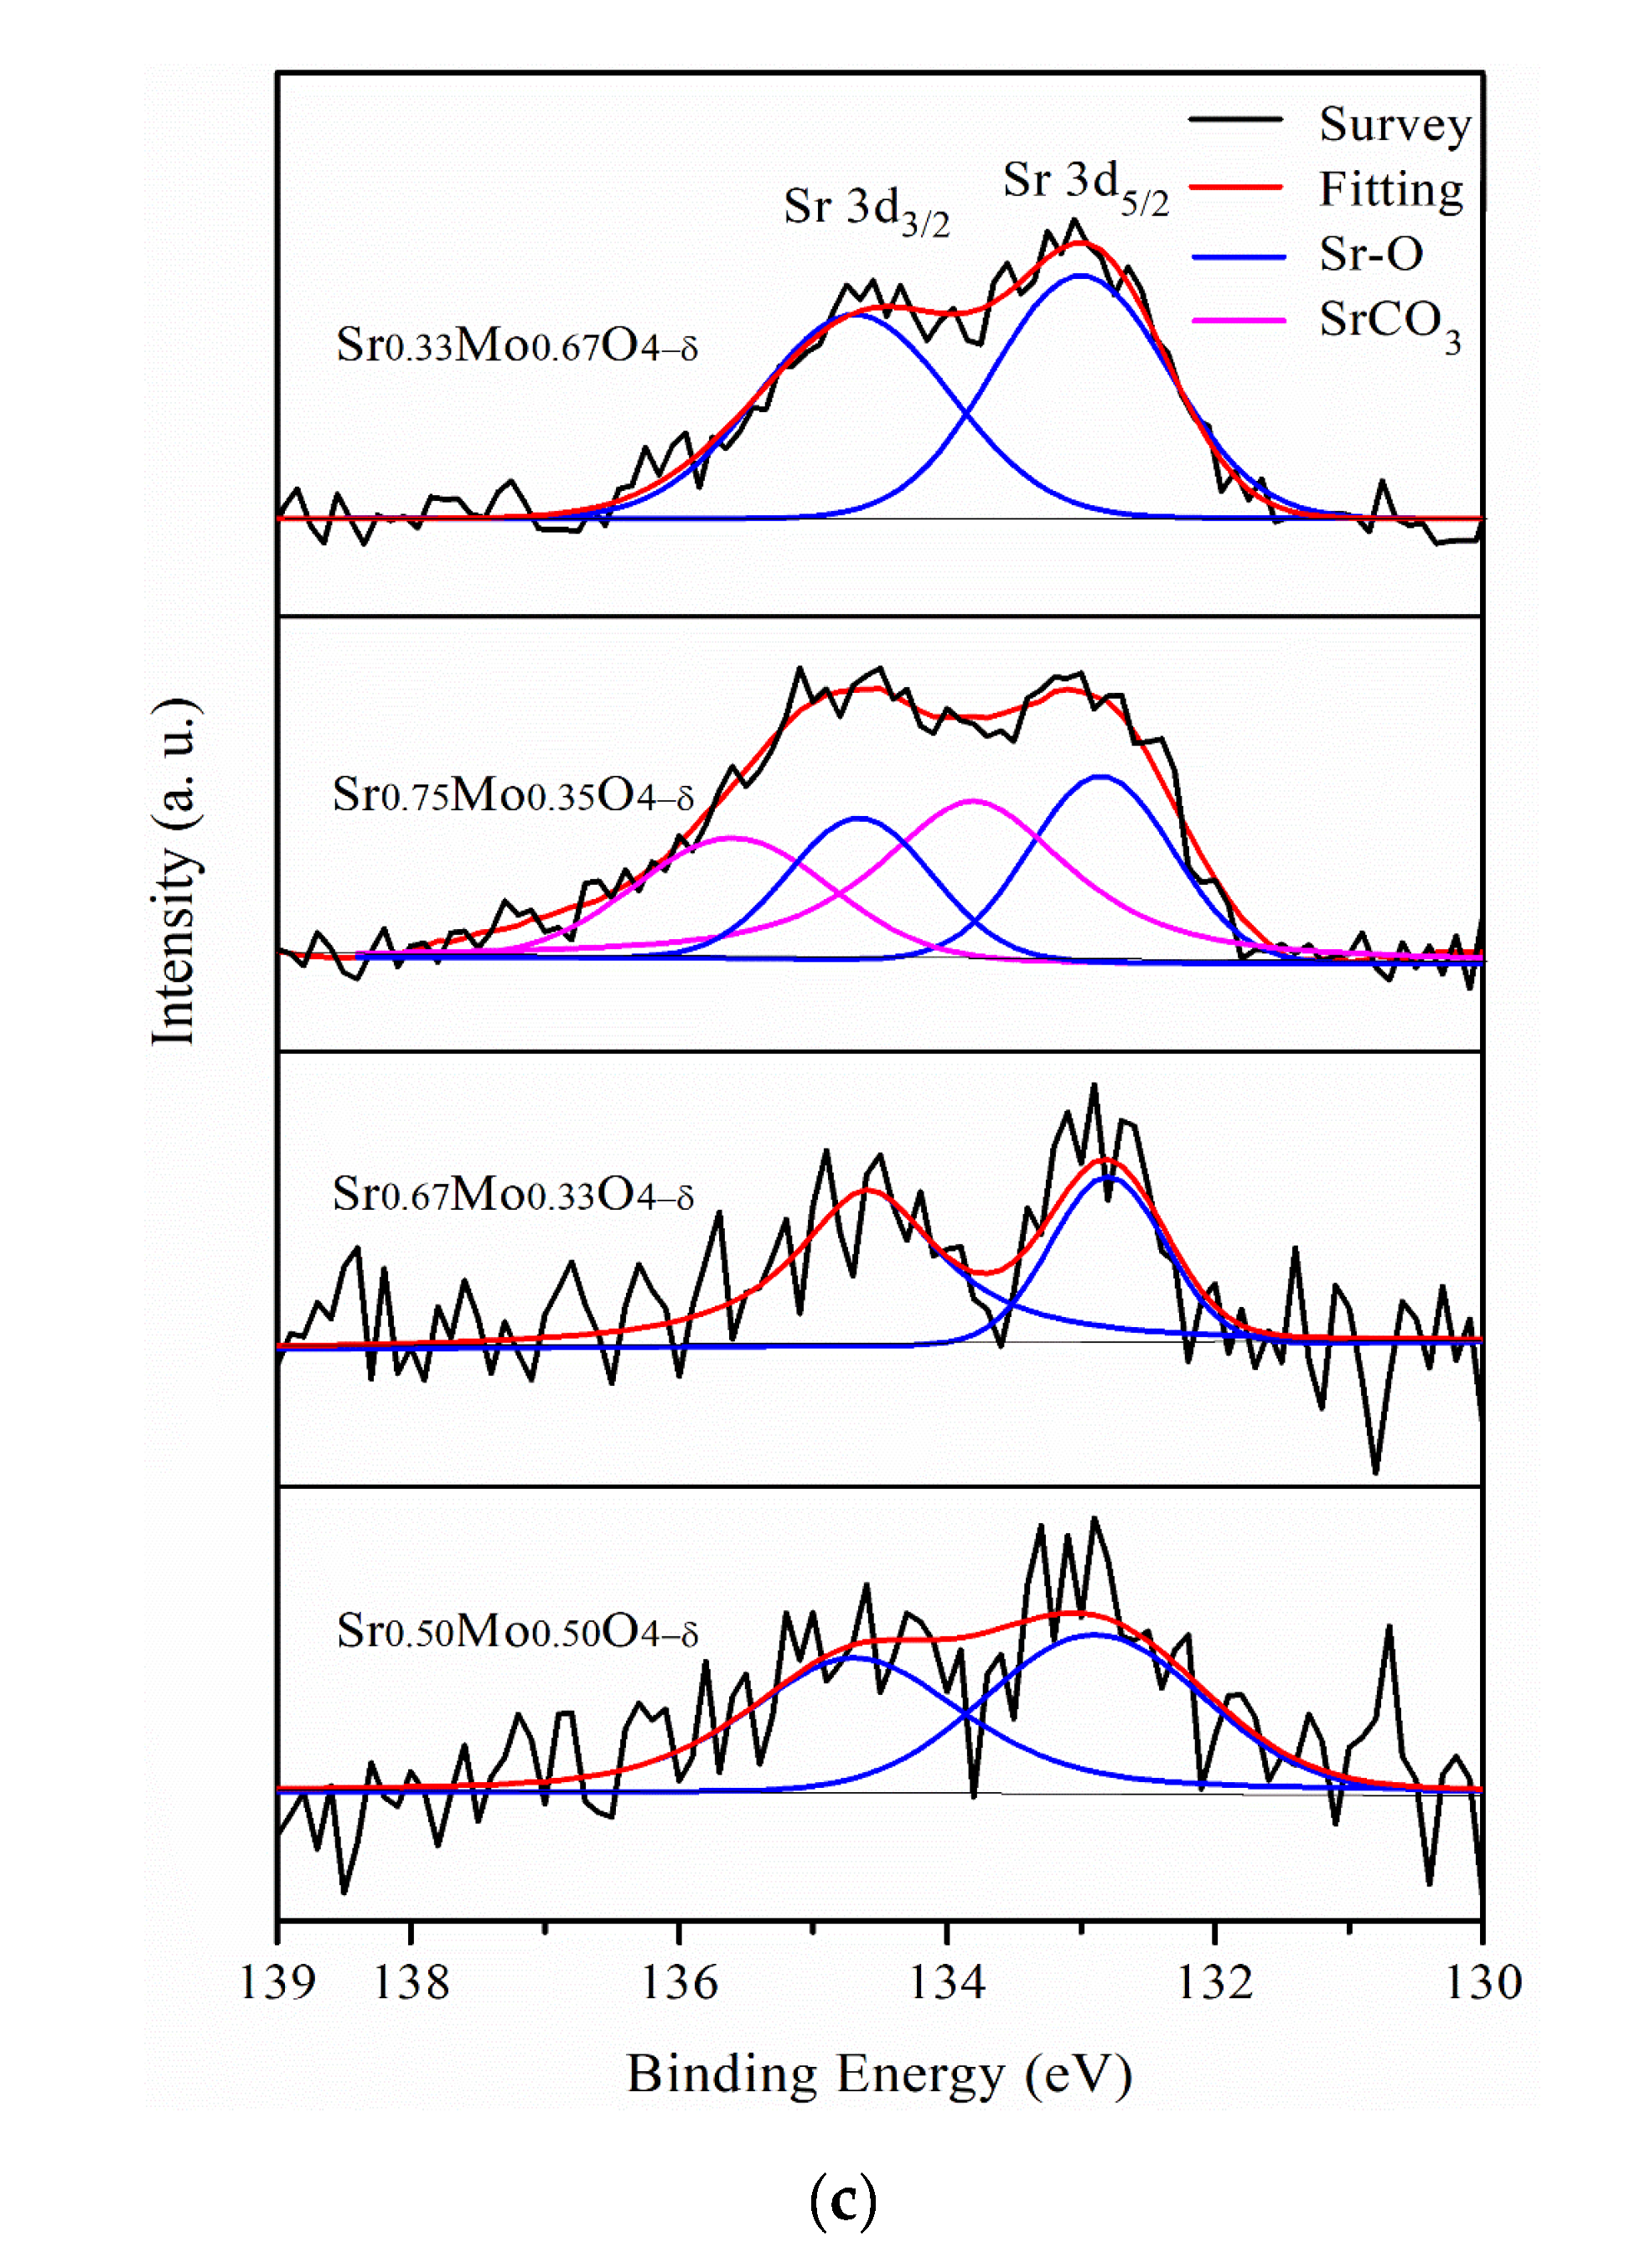
2.3. MOR and CO Tolerance of Strontium Molybdate Oxide Prepared with Different Sr and Mo Ratio Contacts

The MOR was determined for Pt/uncalcined SrMoO4-C prepared with different mole ratios of Sr and Mo precursors: 1:1, 2:1, 3:1, and 1:2, named Sr0.50Mo0.50O4−δ, Sr0.67Mo0.33O4−δ, Sr0.75Mo0.25O4−δ, and Sr0.3Mo0.67O4−δ, respectively. The results are shown in Figure 6a. The forward peak potentials on the Pt-various SrMoO4/C electrocatalysts were observed at approximately 0.40–0.43 V in the forward scan. Furthermore, the various electrocatalysts’ CV of MOR, CO tolerance, and EIS are shown in Figure 6b–d. Their forward peak intensities, ECSAH, ECSACO, and Rct are shown in Table 3. The results showed that the forward peak intensities, ECSAH, and ECSACO decreased in the following order: Sr0.5Mo0.5O4−δ > Sr0.3Mo0.67O4−δ > Sr0.67Mo0.33O4−δ > Sr0.75Mo0.25O4−δ. The Rct from the EIS, in increasing order, are as follows: Sr0.5Mo0.5O4−δ < Sr0.3Mo0.67O4−δ < Sr0.67Mo0.33O4−δ < Sr0.75Mo0.25O4−δ. The results showed that Pt/Sr0.5Mo0.5O4−δ-C electrocatalysts obtained the largest ECSAH, and ECSACO and the smallest Rct. These values were lower than that of commercial Pt/C electrocatalysts. The uncalcined SrMoO4 prepared with a 1:1 mole ratio of Sr and Mo precursors obtained the best MOR and CO tolerance activity. Unfortunately, the structure of the prepared SrMoO4 with different Mo and Sr ratios was difficult to define using XRD (Figure S1, Supplementary Materials) due to these electrocatalysts having the same 2θ peaks as SrMoO4 structures. When Pt is loaded on the electrocatalysts, the electrochemical abilities could be attributed to Pt morphology change, as confirmed by XPS. The binding energy of Pt 4f XPS and relative area Pt0 of Pt/various SrMoO4-C are shown in Figure 7a and Table 4. The results showed that the relative area of Pt0 decreased and oxidized Pt2+ and Pt4+ increased with the increasing amount of Sr contact. The Pt/Sr0.5Mo0.5O4−δ-C electrocatalysts obtained the largest relative area of metallic Pt0, higher than commercial Pt/C and with other mole ratios of Sr and Mo precursors confirms that Pt/Sr0.5Mo0.5O4−δ-C has the best MOR and CO tolerances.
From the Mo 3d XPS, the binding energy of Mo5+ was positively shifted when the Sr contact mole ratio increased from 0.67 to 0.75, as shown in Figure 7b. The result suggests that more Sr2+ ions incorporated MoO42. Therefore, a lower amount of MoO3 formation is demonstrated by decreasing peak intensities between 0.08 and 0.32 V, as shown in Figure 6b. In addition, when the Sr contact mole ratio was 0.75, binding energy peaks of Sr2+ for SrCO3 formed in Figure 6c that could influence less metallic Pt0 formation, causing decreased MOR performance. Furthermore, the Mo6+ binding energy peaks were negatively shifted when the Mo contact was increased to 0.67, and less SrMoO4 production could reduce the synergistic effect of the bifunctional mechanism, resulting in lower MOR and CO tolerances.

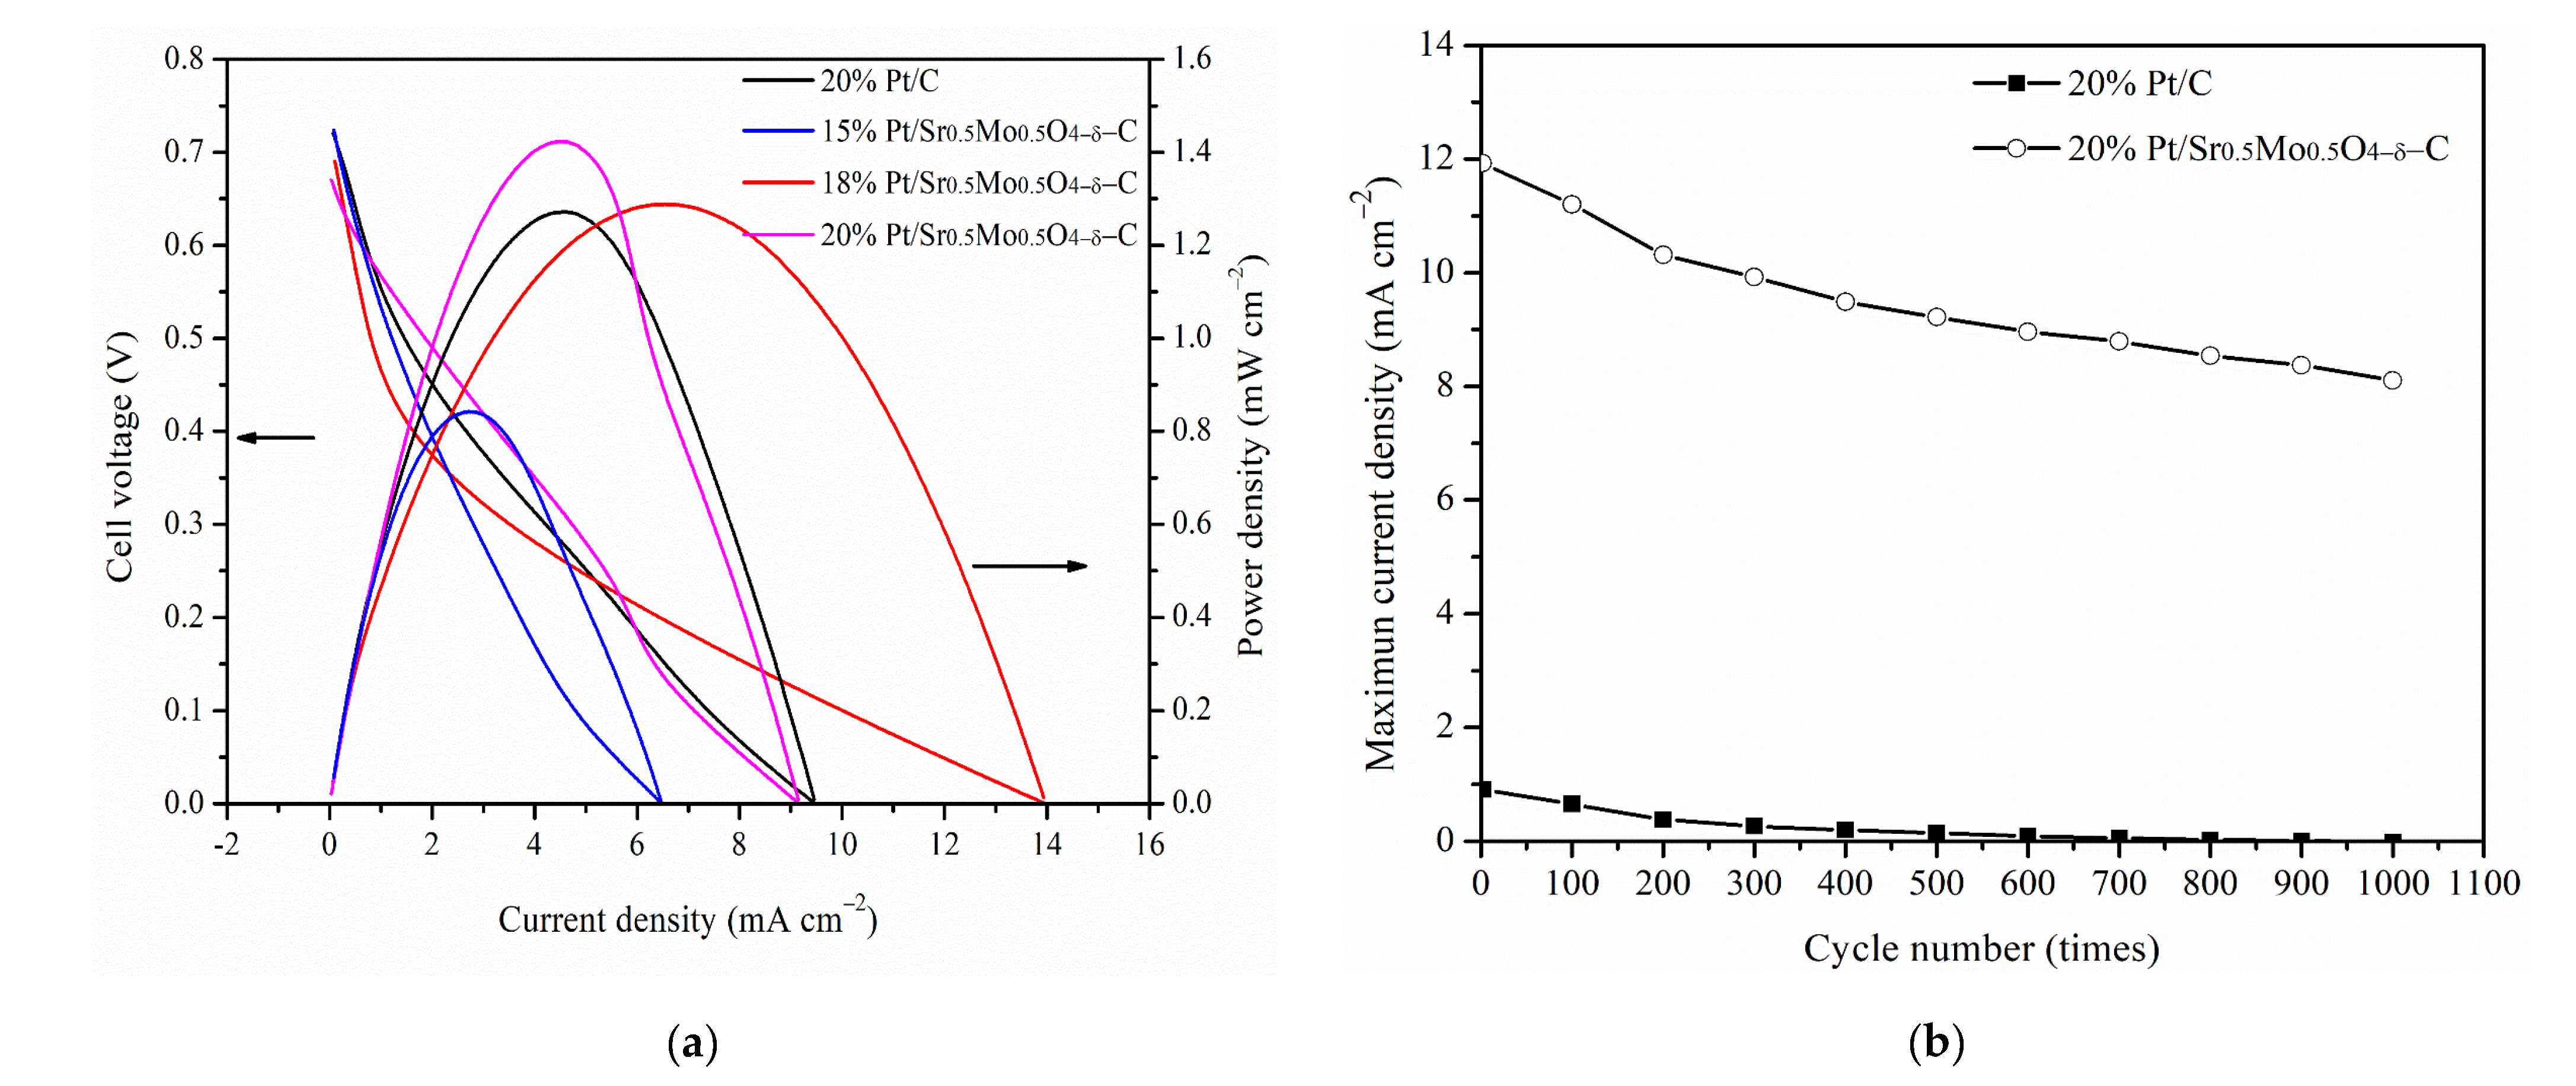
2.4. DMFCs Performance and Cycling Performance Tests

Figure 8a shows the CV curve for DMFCs performance of commercial 20%-Pt/C and uncalcined Sr0.5Mo0.5O4-C with different amounts of Pt. The results showed a maximum power density of 1.42 mW/cm2 for 20%-Pt/uncalcined Sr0.5Mo0.5O4-C, which is higher than commercial 20%-Pt/C (1.27 mW/cm2), resulting in a more negative onset voltage for MOR, smaller charge transfer resistances, and better tolerance against CO poisoning as compared to commercial Pt/C.
Furthermore, the power density of 18%-Pt/uncalcined Sr0.5Mo0.5O4-C (1.29 mW/cm2) is similar to that of commercial 20%-Pt/C, demonstrating that using 2% less Pt loading can maintain the same DMFCs performance as commercial 20%-Pt/C. Unfortunately, 15%-Pt/uncalcined Sr0.5Mo0.5O4-C has a lower power density (0.84 mW/cm2).
The cycling performance test of the commercial 20%-Pt/C and 20%-Pt/uncalcined Sr0.5Mo0.5O4−δ-C electrocatalysts in MOR on 1000 cycles in a 0.5 M H2SO4 containing 1 M CH3OH mixture, which is shown in Figure 8b. The current density of both electrocatalysts decayed when the number of cycles increased. As the number of cycles increases, intermediate carbonaceous species such as CO accumulate on the electrode surface and may poison the Pt and decrease the oxidation current [56]. Gratifyingly, the maximum current density of 20%-Pt/uncalcined Sr0.5Mo0.5O4−δ-C electrocatalysts remained higher than for the commercial 20%-Pt/C. In addition, uncalcined Sr0.5Mo0.5O4−δ simultaneously contains SrMoO4 and MoO3 compounds, which play a role in CO tolerance. The mechanism of CO tolerance for Pt/uncalcined Sr0.5Mo0.5O4−δ-C involves two simultaneous reactions, as shown in Figure 9. The first reaction results in HxMoO3/HyMoO3 formation in uncalcined Sr0.5Mo0.5O4−δ under MOR, which helps remove intermediates from Pt surfaces and accelerates the transformation of adsorbed intermediates to carbon dioxide. The second bifunctional mechanism is the synergistic effect of Pt and SrMoO4 compounds in uncalcined Sr0.5Mo0.5O4−δ.

3. Materials and Methods

3.1. Preparation of SrMoO4

1:1, 0.5:1, 0.3:1, and 1:1.5 molar ratios for 100 mL of strontium nitrate (Sr(NO3)2; Alfa Aesar) and 100 mL of ammonium heptamolybdate tetrahydrate (NH4)6Mo7O24·4H2O; ACROS) mixed with 40 mL of ethylene glycol (C2H6O2; J.T. Baker®, Phillipsburg, NJ, USA) under magnetic stirring synthesized different SrMoO4, respectively. Mixtures were heated at 120 °C for 1 h and cooled to room temperature, producing a precipitate centrifuged five times at 5000 rpm for 15 min each time. After centrifugation, the precipitate was washed with distilled water and heated overnight in an oven at 60 °C. Finally, the precipitate underwent calcination temperatures of 200 °C and 400 °C under an air atmosphere with a heating rate of 5 °C /min for 1 h.

3.2. Pt/SrMoO4-C Preparation

A 1:1 weight ratio of 0.04 g SrMoO4 was mixed with 0.04 g Vulcan XC-72 carbon black (Brunauer–Emmett–Teller surface area of 250 m2/g; Cabot Co., Alpharetta, GA, USA) with 40 mL of C2H6O2 dispersed in a 100-mL beaker. The solution was then ultrasonicated for 15 min and underwent magnetic stirring for 1 h to form a uniform suspension. Next, 10 mL of 5.2 mg/mL (20%) hexahydrate (H2PtCl6·6H2O; Alfa Aesar, Lancashire, UK) in C2H6O2 solution was added to the suspension and stirred for 1 h. The pH of the suspension was adjusted to 11 by the drop-wise addition of 0.5 M sodium hydroxide (NaOH; Showa Chemical Industry Co., Ltd., Tokyo, Japan). The suspension was then heated to 140 °C under reflux for 3 h. After the mixture was cooled, the precipitate was centrifuged at 5000 rpm for 15 min each. The precipitate was washed with distilled water, placed in a dish, and dried in an oven at 80 °C for 24 h.

3.3. Material Characterization

Raman spectra were measured at room temperature through a 100X microscope objective using an automated Raman spectrometer equipped with an argon laser (514 nm). (Unidron, CL Technology Co., Ltd, New Taipei city, Taiwan) with a diode-pumped solid-state laser with a wavelength of 532 nm at 100 mW in the spectral range between 100 and 1100 cm1. The objective lens of the microscope resulted in a 1.2-mm diameter laser spot. SrMoO4 structural properties were identified using X-ray diffraction (XRD) in a Rigaku (Tokyo, Japan) ultima IV rotating anode diffractometer with a Ni-filtered Cu–Kα radiation source (wavelength of 1.54 Å). The binding energies of different elements were identified using X-ray photoelectron spectroscopy (XPS) with ESCALAB 250 (VG Scientific, East Grinstead, UK) equipped with a dual Al X-ray source operated at 200 W and 15 kV. The beam size of the XPS X-ray source was 650 μm, and a hemispherical analyzer was operated in constant analyzer energy mode during measurements. The base pressure in the XPS analyzing chamber was maintained at 1010 mbar. A nonlinear least-squares curve-fitting program with a Gaussian–Lorentzian production function, the Casa XPS program (Casa Software Ltd., Teignmouth, UK), is used to process XPS data. An adventitious C1s binding energy of 284.9 eV was set as the reference binding energy for charge correction. The morphology of the electrocatalysts was analyzed using scanning electron microscopy (SEM; JSM-6700F instrument, JEOL, Tokyo, Japan) with energy-dispersive X-ray spectroscopy (EDS). Transmission electron microscopy (TEM) was performed with a Philips FEI Tecnai G2F30 electron microscope with an acceleration voltage of 300 kV with a 1–25-nm probe size of EDS detector.

3.4. Electrochemical Measurements

Electrochemical measurements were performed on a computer-controlled CHI 608E electrochemical analysis instrument (CH Instruments, Inc., Austin, TX, USA). The cyclic voltammetry (CV) curves of MOR were measured using a three-electrode cell system at room temperature within a potential range of −0.2–0.9 V at 50 mV/s in 100 mL of 0.5 M sulfuric acid (H2SO4; Honeywell, Morris Plains, NJ, USA) containing 1 M of methanol (CH3OH; Honeywell, Morris Plains, NJ, USA).
An ink was prepared with 20 mg of electrocatalyst dispersed in 1950 μL of ethanol (C2H5OH; Taiwan Sugar Corporation, Tainan, Taiwan) and mixed with 50 μL of 20 wt.% Nafion solution (DuPont Co., Wilmington, NC, USA) via sonication for 30 min. A working electrode was prepared by spreading 1 μL of the ink catalyst onto a 3-mm diameter glassy carbon electrode and dried at room temperature. Before using the working electrode, it was cleaned with alumina (1 and 0.3 μm grit size) polish paper. A Pt sheet electrode and an Ag/AgCl electrode were used as the counter and reference electrodes.
CV curves of hydrogen adsorption–desorption were obtained in a potential range between −0.2 V and 0.9 V at 50 mV/s in 100 mL of 0.5 M H2SO4 after ultrapure N2 gas flowed for 30 min. The electrochemically active surface area (ECSAH) was calculated using the following equation: ECSAH [m2/g] = QH/(0.21 [mC/m2] × mPt) [57], where QH [mC/cm2] is the average of the integrated hydrogen adsorption and desorption area [mA/cm2·V] eliminating the double layer region [58] obtained by Origin 8.5 software. Furthermore, the term 0.21 [mC/cm2] in the equation represents the charge required to oxidize a monolayer of H2 on Pt [59], and mPt corresponds to the 20% Pt loading of the electrocatalyst on a disk electrode. mPt was 0.19 g/m2 from the 13.61% Pt (theoretical 20% Pt) detected using a high-resolution inductively coupled plasma-mass spectrometer ELEMENT XR analyzer (Thermo Fisher Scientific, Waltham, MA, USA).
The CV curves of CO stripping for various electrocatalysts were obtained by purging CO gas (flow of 4 cc/min) into the 0.5 M H2SO4 solution under −0.12 V (versus Ag/AgCl) for 10 min and measured in the potential range of −0.2 to 0.9 V (versus Ag/AgCl) with a scan rate of 50 mVs−1 at 25 °C. The ECSACO was calculated using the following equation: ECSACO [m2/g] = QCO/(0.42 [mC/m2] × mPt) [60]. QCO [mC/cm2] in this equation is the charge under the CO oxidation peak, related to the following oxidation process converting CO to CO2: CO + H2O → CO2 + 2H+ + 2e. The value of 0.420 [mC/m2] corresponds to the charge required to oxidize a monolayer of CO adsorbed on Pt.
Electrochemical impedance spectra (EIS) were obtained at 0.4 V and from 100 kHz to 0.01 Hz in a 0.5 M H2SO4 containing 1 M CH3OH mixture de-aerated with ultrapure N2 gas (4 cc/min) for 30 min. The charge reaction resistances (Rct) associated with the MOR [49] were assessed by the diameter of the primary semicircle using Nyquist plots of EIS measurements. The experimental impedance data fitted using EIS Spectrum Analyzer software obtained the equivalent circuit model.

3.5. Membrane Electrode Assembly Fabrication and Single-Cell Performance Testing

The ink was prepared with 12 mg of varying Pt/uncalcined Sr0.5Mo0.5O4−δ-C electrocatalyst content (i.e., 20%, 18%, and 15%) dispersed in 400 μL of ethanol, 100 μL of ethylene glycol, and mixed with 15 μL of 20 wt.% Nafion solution with 30 min sonication. The ink was then dropped on a 2.5 cm × 2.5 cm carbon paper (25BC, Hephas energy Co., Ltd., Hsinchu, Taiwan) and dried at 40 °C for 24 h to create the anode electrode. The same volume ratio with anodic ink of a commercial 20%-Pt/C was dropped on a 2.5 cm × 2.5 cm carbon paper for the cathode electrode. A 3 cm × 3 cm Nafion® 117 membrane was used as the solid electrolyte. Before applying to the electrodes, the membrane was pretreated by immersion in a 5% H2O2 solution at 80 °C for 30 min and then rinsed with deionized (DI) water. Next, the membrane was immersed in 0.5 M sulfuric acid at 80 °C for 30 min and rinsed with DI water. The treated membrane was stored in a beaker filled with DI water until used.
The membrane electrode assembly (MEA) had a 6.25 cm2 active area, as shown in Figure S2a (Supplementary Materials), and was hot-pressed on both sides between the anode/Nafion® film/cathode at 140 °C with a pressure of 50 kg/cm2 for 3 min. A simple single DMFC was assembled without a bipolar plate to avoid electrocatalysts’ characteristic interface resistance effects, as shown in Figure S2b (Supplementary Materials). The DMFCs consisted of an air-filled cathode tank, the MEA, and a 35-mL 20% methanol-filled anode tank. The electrochemical performances were measured using a potentiostat/galvanostat (CHI 608E, CH Instrument, Austin, TX, USA) at atmospheric pressure and room temperature. The cell polarization curve was obtained for the electrocatalysts. The long-term durability of the electrocatalysts was tested by conducting 1000 continuous potential cycles between 0.05 and 1.20 V at 50 mV s−1.

4. Conclusions

The study successfully prepared 20%-Pt/uncalcined Sr0.5Mo0.5O4−δ-C electrocatalyst, which has higher MOR and CO tolerance in DMFCs. Tetragonal SrMoO4 structure is the main compound for strontium molybdate. Strontium molybdate prepared with increased calcination temperature resulted in reduced MOR and CO tolerance. This optimum strontium molybdate and contact ratio is beneficial for removing CO-like intermediate products on the Pt surface, which leads to more Pt active sites released during MOR. The HxMoO3/HyMoO3 and SrMoO3 unique structural formation in uncalcined Sr0.5Mo0.5O4−δ provided critical synergistic effects and improved DMFCs performance. These structures can simultaneously perform two working reactions during CO tolerance. The first reaction includes HxMoO3/HyMoO3 formation in uncalcined Sr0.5Mo0.5O4−δ under MOR to help remove intermediates from Pt surfaces, reduce poisoned Pt, and accelerate the transformation of adsorbed intermediates to carbon dioxide. The second reaction includes both Pt and SrMoO4 to generate a synergistic effect of the bifunctional mechanism and provides active oxygen to remove CO on the Pt surface. Therefore, 20%-Pt/uncalcined Sr0.5Mo0.5O4−δ-C electrocatalysts as anode electrode with a DMFCs performance 1.1 times higher than commercial 20%-Pt/C.

Supplementary Materials

The following are available online at https://www.mdpi.com/article/10.3390/catal12070676/s1, Figure S1: XRD of various electrocatalysts, the ∗ symbol means Pt structure, and • symbol means SrMoO4 form, Figure S2: (a) MEA and (b) simple single DMFC assembly, Table S1: The peak fitting for various electrocatalysts in the Mo 3d region, Table S2. The peak fitting for various electrocatalysts in the Sr 3d region, Table S3. The peak fitting for various electrocatalysts in the Pt 4f region.

Author Contributions

Writing—original draft preparation, T.H.C.; writing—review and editing, T.H.C.; supervision, T.H.C.; project administration, T.H.C., conceptualization, T.H.C.; funding acquisition, T.H.C.; investigation, J.-W.H.; formal analysis and data curation, J.-W.H. All authors have read and agreed to the published version of the manuscript.

Funding

This research was funded by Ministry of Science and Technology Taiwan, grant number MOST 107-2221-E-239-007.

Conflicts of Interest

The authors declare no conflict of interest.

References

  1. Simoes, S.; Nijs, W.; Ruiz, P.; Sgobbi, A.; Thiel, C. Comparing policy routes for low-carbon power technology deployment in EU-an energy system analysis. Energy Policy 2017, 101, 353–365. [Google Scholar] [CrossRef]
  2. Samimi, F.; Hamedi, N.; Rahimpour, M.R. Green methanol production process from indirect CO2 conversion: RWGS reactor versus RWGS membrane reactor. J. Environ. Chem. Eng. 2019, 7, 102813. [Google Scholar] [CrossRef]
  3. Rifal, M.; Sinaga, N. Impact of methanol-gasoline fuel blend on the fuel consumption and exhaust emission of a SI engine. In Proceedings of the 3rd International Conference on Advanced Materials Science and Technology (ICAMST 2015), Semarang, Indonesia, 6–7 October 2015. [Google Scholar]
  4. Du, C.Y.; Zhao, T.S.; Yang, W.W. Effect of methanol crossover on the cathode behavior of a DMFC: A half-cell investigation. Electrochim. Acta 2007, 52, 5266–5271. [Google Scholar] [CrossRef]
  5. Yajima, T.; Uchida, H.; Watanabe, M. In-Situ ATR-FTIR spectroscopic study of electro-oxidation of methanol and adsorbed CO at Pt-Ru alloy. J. Phys. Chem. B 2004, 108, 2654–2659. [Google Scholar] [CrossRef]
  6. Seiler, T.; Savinova, E.R.; Friedrich, K.A.; Stimming, U. Poisoning of PtRu/C catalysts in the anode of a direct methanol fuel cell: A DEMS study. Electrochim. Acta 2004, 49, 3927–3936. [Google Scholar] [CrossRef]
  7. Kaur, A.; Kaur, G.; Singh, P.P.; Kaushal, S. Supported bimetallic nanoparticles as anode catalysts for direct methanol fuel cells: A review. Int. J. Hydrogen Energy 2021, 46, 15820–15849. [Google Scholar] [CrossRef]
  8. Cheng, X.; Shi, Z.; Glass, N.; Zhang, L.; Zhang, J.; Songa, D.; Liu, Z.S.; Wang, H.; Shen, J. A review of PEM hydrogen fuel cell contamination: Impacts, mechanisms, and mitigation. J. Power Sources 2007, 16, 739–756. [Google Scholar] [CrossRef]
  9. Yamanaka, T.; Takeguchi, T.; Wang, G.; Muhamad, E.N.; Ueda, W. Particle size dependence of CO tolerance of anode PtRu catalysts for polymer electrolyte fuel cells. J. Power Sources 2010, 195, 6398–6404. [Google Scholar] [CrossRef]
  10. Wang, J.; Xi, J.; Bai, Y.; Shen, Y.; Sunc, J.; Chen, L.; Zhu, W.; Qiu, X. Structural designing of Pt-CeO2/CNTs for methanol electro-oxidation. J. Power Sources 2007, 164, 555–560. [Google Scholar] [CrossRef]
  11. Xu, C.; Shen, P.K. Electrochamical oxidation of ethanol on Pt-CeO2/C catalysts. J. Power Sources 2005, 142, 27–29. [Google Scholar] [CrossRef]
  12. Zhao, H.; Zheng, Z.; Li, J.; Jia, H.; Wong, K.W.; Zhang, Y.; Lau, W.M. Substitute of expensive Pt with improved electrocatalytic performance and higher resistance to CO poisoning for methanol oxidation: The case of synergistic Pt-Co3O4 nanocomposite. Nano Micro Lett. 2013, 5, 296–302. [Google Scholar] [CrossRef]
  13. Amin, R.S.; Hameed, R.M.A.; El-Khatib, K.M.; Youssef, M.E.; Elzatahry, A.A. Pt–NiO/C anode electrocatalysts for direct methanol fuel cells. Electrochim. Acta 2012, 59, 499–508. [Google Scholar] [CrossRef]
  14. Sun, X.; Gao, K.; Pang, X.; Yang, H.; Volinsky, A.A. Electrochemical oxidation of methanol on Pt-SnOx/C catalysts characterized by electrochemistry methods. J. Electrochem. Soc. 2015, 162, F1540–F1548. [Google Scholar] [CrossRef] [Green Version]
  15. Das, S.; Kundu, P.P. Pt–Ru/Al2O3–C nanocomposites as direct methanol fuel cell catalysts for electrooxidation of methanol in acidic medium. RSC Adv. 2015, 5, 93539–93546. [Google Scholar] [CrossRef]
  16. Jayaraman, S.; Jaramillo, T.F.; Baeck, S.H.; McFarland, E.W. Synthesis and characterization of Pt-WO3 as methanol oxidation catalysts for fuel cells. J. Phys. Chem. B 2005, 109, 22958–22966. [Google Scholar] [CrossRef]
  17. Li, Y.; Liu, C.; Liu, Y.; Feng, B.; Li, L.; Pan, H.; Kellogg, W.; Higgins, D.; Wu, G. Sn-doped TiO2 modified carbon to support Pt anode catalysts for direct methanol fuel cells. J. Power Sources 2015, 286, 354–361. [Google Scholar] [CrossRef]
  18. Tan, Q.; Du, C.; Sun, Y.; Du, L.; Yin, G.; Gao, Y. Nickel-doped ceria nanoparticles for promoting catalytic activity of Pt/C for ethanol electrooxidation. J. Power Sources 2014, 263, 310–314. [Google Scholar] [CrossRef]
  19. Ordóñez, L.C.; Roquero, P.; Ramírez, J.; Sebastian, P.J. Methanol electro-oxidation on bimetallic PtMo/C catalysts and Pt/C-Mo/C mechanical mixtures. Int. J. Electrochem. Sci. 2016, 11, 5364–5379. [Google Scholar] [CrossRef]
  20. Justin, P.; Rao, G.R. Methanol oxidation on MoO3 promoted Pt/C electrocatalyst. Int. J. Hydrogen Energy 2011, 36, 5875–5884. [Google Scholar] [CrossRef]
  21. Ioroi, T.; Yasuda, K.; Siroma, Z.; Fujiwara, N.; Miyazaki, Y. Enhanced CO-Tolerance of carbon-supported platinum and molybdenum oxide anode catalyst. J. Electrochem. Soc. 2003, 150, A1225–A1230. [Google Scholar] [CrossRef]
  22. Jothi, P.R.; Kannan, S.; Velayutham, G. Enhanced methanol electro-oxidation over in-situ carbon and graphene supported one dimensional NiMoO4 nanorods. J. Power Sources 2015, 277, 350–359. [Google Scholar] [CrossRef]
  23. Zhang, G.; Yanga, Z.; Zhanga, W.; Wanga, Y. Nanosized Mo-doped CeO2 enhances the electrocatalytic property of the Pt anode catalyst in direct methanol fuel cells. J. Mater. Chem. A 2017, 5, 1481–1487. [Google Scholar] [CrossRef]
  24. Liu, Y.; Liu, C.; Yu, X.; Osgood, H.; Wu, G. CeO2-modified α-MoO3 nanorods as a synergistic support for Pt nanoparticles with enhanced COads tolerance during methanol oxidation. Phys. Chem. Chem. Phys. 2017, 19, 330. [Google Scholar] [CrossRef] [PubMed]
  25. Diczhazi, D.; Borbath, I.; Bakos, I.; Szijjarto, G.P.; Tompos, A.; Paszti, Z. Design of Mo-doped mixed oxide–carbon composite supports for Pt-based electrocatalysts: The nature of the Mo-Pt interaction. Catal. Today 2021, 366, 31–40. [Google Scholar] [CrossRef]
  26. Lu, G.P.; Ma, X.B.; Yang, H.F.; Kong, D.S.; Feng, Y.Y. Highly active Pt catalysts promoted by molybdenum-doped SnO2 for methanol electrooxidation. Int. J. Hydrogen Energy 2015, 40, 5889–5896. [Google Scholar] [CrossRef]
  27. Mikhaylovskaya, Z.A.; Buyanova, E.S.; Petrova, S.A.; Nikitina, А.А. Sheelite-related strontium molybdates: Synthesis and characterization. Chim. Techno Acta 2018, 5, 189–195. [Google Scholar] [CrossRef] [Green Version]
  28. Aruna, K.K.; Manoharan, R. Electrochemical hydrogen evolution catalyzed by SrMoO4 spindle particles in acid water. Int. J. Hydrogen Energy 2013, 38, 12695–12703. [Google Scholar] [CrossRef]
  29. Karthik, R.; Karikalan, N.; Chen, S.M.; Kumar, J.V.; Karuppiah, C.; Muthuraj, V. Assessment of divergent functional properties of seed-like strontium molybdate for the photocatalysis and electrocatalysis of the postharvest scald inhibitor diphenylamine. J. Catal. 2017, 352, 606–616. [Google Scholar] [CrossRef]
  30. Huerta-Flores, A.M.; Juárez-Ramírez, I.; Torres-Martínez, L.M.; Carrera-Crespo, J.E.; Gómez-Bustamante, T.; Sarabia-Ramos, O. Synthesis of AMoO4 (A = Ca, Sr, Ba) photocatalysts and their potential application for hydrogen evolution and the degradation of tetracycline in water. J. Photochem. Photobiol. A 2018, 356, 29–37. [Google Scholar] [CrossRef]
  31. Thrane, J.; Lundegaard, L.F.; Beato, P.; Mentzel, U.V.; Thorhauge, M.; Jensen, A.D.; Høj, M. Alkali earth metal molybdates as catalysts for the selective oxidation of methanol to formaldehyde—Selectivity, activity, and stability. Catalysts 2020, 10, 82. [Google Scholar] [CrossRef] [Green Version]
  32. Wagner, N.; Schulze, M. Change of electrochemical impedance spectra during CO poisoning of the Pt and Pt–Ru anodes in a membrane fuel cell (PEFC). Electrochim. Acta 2003, 48, 3899–3907. [Google Scholar] [CrossRef]
  33. Almeida, G.R.O.; Sussuchi, E.M.; Meneses, C.T.D.; Salazar-Banda, G.R.; Eguiluz, K.I.B. Influence of the metallic load of Pt/C and Pt0.6-Ru0.4/C nanowires on the electrochemical oxidation of methanol in acid medium. Int. J. Electrochem. Sci. 2017, 12, 7502–7517. [Google Scholar] [CrossRef]
  34. Vidya, S.; John, A.; Solomon, S.; Thomas, J.K. Optical and dielectric properties of SrMoO4 powders prepared by the combustion synthesis method. Adv. Mater. Res. 2012, 1, 191–204. [Google Scholar] [CrossRef]
  35. Sczancoski, J.C.; Cavalcante, L.S.; Joya, M.R.; Varela, J.A.; Pizani, P.S.; Longo, E. SrMoO4 powders processed in microwave-hydrothermal: Synthesis, characterization and optical properties. Chem. Eng. J. 2008, 140, 632–637. [Google Scholar] [CrossRef]
  36. Dieterle, M.; Weinberg, G.; Mestl, G. Raman spectroscopy of molybdenum oxides Part I. Structural characterization of oxygen defects in MoO3-x by DR UV/VIS, Raman spectroscopy and X-ray diffraction. Phys. Chem. Chem. Phys. 2002, 4, 812–821. [Google Scholar] [CrossRef]
  37. Song, J.; Sun, Y.; Ba, R.; Huang, Z.Y.; Zhang, J.; Sun, Y.; Zhu, Y. Monodisperse Sr–La2O3 hybrid nanofibers for oxidative coupling of methane to synthesize C2 hydrocarbons. Nanoscale 2015, 7, 2260–2264. [Google Scholar] [CrossRef] [PubMed]
  38. Bagherisereshki, E.; Tran, J.; Lei, F.; Yeung, N.A. Investigation into SrO/SrCO3 for high temperature thermochemical energy Storage. Sol. Energy 2018, 160, 85–93. [Google Scholar] [CrossRef]
  39. Çiftyürek, E.; Sabolsky, K.; Sabolsky, E.M. Molybdenum and tungsten oxide based gas sensors for high temperature detection of environmentally hazardous sulfur species. Sens. Actuators B Chem. 2016, 237, 262–274. [Google Scholar] [CrossRef] [Green Version]
  40. Kim, K.S.; Winograd, N.; Davis, R.E. Electron spectroscopy of platinum-oxygen surfaces and application to electrochemical studies. J. Am. Chem. Soc. 1971, 93, 6296–6297. [Google Scholar] [CrossRef]
  41. Fu, Q.; Saltsburg, H.; Flytzani-Stephanopoulos, M. Active nonmetallic Au and Pt species on ceria-based water-gas shift catalysts. Science 2003, 301, 935–938. [Google Scholar] [CrossRef]
  42. Václavu, M.; Matolinová, I.; Mysliveček, J.; Fiala, R.; Matolin, V. Anode material for hydrogen polymer membrane fuel cell: Pt – CeO2 RF-sputtered thin films. J. Electrochem. Soc. 2009, 156, B938–B942. [Google Scholar] [CrossRef]
  43. Wannapop, S.; Thongtem, T.; Thongtem, S. Characterization of donut-like SrMoO4 produced by microwave-hydrothermal process. J. Nanomater. 2013, 2013, 474576. [Google Scholar] [CrossRef] [Green Version]
  44. Binninger, T.; Fabbri, E.; Kötz, R.; Schmidt, T.J. Determination of the electrochemically active surface area of metal-oxide supported platinum catalyst. J. Electrochem. Soc. 2014, 161, H121–H128. [Google Scholar] [CrossRef]
  45. Baronia, R.; Goel, J.; Kaswan, J.; Shukla, A.; Singhal, S.K.; Singh, S.P. PtCo/rGO nano-anode catalyst: Enhanced power density with reduced methanol crossover in direct methanol fuel cell. Mater. Renew. Sustain. Energy 2018, 7, 27. [Google Scholar] [CrossRef] [Green Version]
  46. Hou, Z.; Yi, B.; Yu, H.; Lin, Z.; Zhang, H. CO tolerance electrocatalyst of PtRu-HxMeO3/C (Me = W, Mo) made by composite support method. J. Power Sources 2003, 123, 116–125. [Google Scholar] [CrossRef]
  47. Li, W.S.; Tian, L.P.; Huan, Q.M.; Li, H.; Chen, H.Y.; Lian, X.P. Catalystic oxidation of methanol on molybdate-modified platinum electrode in sulfuric acid solution. J. Power Sources 2002, 104, 281–288. [Google Scholar] [CrossRef]
  48. Li, W.; Lu, J.; Du, J.; Lu, D.; Chen, H.; Li, H.; Wu, Y. Electrocatalytic oxidation of methanol on polyaniline-stabilized Pt–HxMoO3 in sulfuric acid solution. Electrochem. Commun. 2005, 7, 406–410. [Google Scholar]
  49. Silva, C.D.; Morais, L.H.; Gonçalves, R.; Matos, R.; Souza, G.L.C.; Freitas, R.G.; Pereira, E.C. The methanol and CO electro-oxidation onto Ptpc/Co/Pt metallic multilayer nanostructured electrodes: An experimental and theoretical approach. Electrochim. Acta 2018, 280, 197–205. [Google Scholar] [CrossRef]
  50. Tsukagoshi, Y.; Ishitobi, H.; Nakagawa, N. Improved performance of direct methanol fuel cells with the porous catalyst layer using highly-active nanofiber catalyst. Carbon Resour. Convers. 2018, 1, 61–72. [Google Scholar] [CrossRef]
  51. Chun, H.J.; Kim, D.B.; Lim, D.H.; Lee, W.D.; Lee, H.I. A synthesisof CO-tolerant Nb2O5-promoted Pt/C catalyst for direct methanol fuel cell; its physical and electrochemical characterization. Int. J. Hydrogen Energy 2010, 35, 6399–6408. [Google Scholar] [CrossRef]
  52. Wang, Y.; Fachini, E.R.; Cruz, G.; Zhu, Y.; Ishikawa, Y.; Colucci, J.A.; Cabrera, C.R. Effect of surface composition of electrochemically codeposited platinum molybdenum oxide on methanol oxidation. J. Electrochem. Soc. 2001, 148, C222. [Google Scholar] [CrossRef]
  53. Radhakrishnan, R.; Reed, C.; Oyama, S.T. Variability in the structure of supported MoO3 catalysts: Studies using Raman and X-ray absorption spectroscopy with ab initio calculations. J. Phys. Chem. B 2001, 105, 8519–8530. [Google Scholar] [CrossRef]
  54. Wu, Q.L.; Zhao, S.X.; Yu, L.; Zheng, X.X.; Wang, Y.F.; Yu, L.Q.; Nan, C.W.; Cao, G. Oxygen vacancy-enriched MoO3−x nanobelts for asymmetric supercapacitors with excellent room/low temperature performance. J. Mater. Chem. A 2019, 7, 13205–13214. [Google Scholar] [CrossRef]
  55. Tsai, M.C.; Nguyen, T.T.; Akalework, N.G.; Pan, C.J.; Rick, J.; Liao, Y.F.; Su, W.N.; Hwang, B.J. Interplay between molybdenum dopant and oxygen vacancies in a TiO2 support enhances the oxygen reduction reaction. ACS Catal. 2016, 6, 6551–6559. [Google Scholar] [CrossRef]
  56. Chiang, T.H.; Yeh, H.C. A novel synthesis of α-MoO3 nanobelts and the characterization. J. Alloys Compd. 2014, 585, 535–541. [Google Scholar] [CrossRef]
  57. Huang, H.; Sun, D.; Wang, X. Low-defect MWNT-Pt nanocomposite as a high performance electrocatalyst for direct methanol fuel cells. J. Phys. Chem. C 2011, 115, 19405–19412. [Google Scholar] [CrossRef]
  58. Rodríguez, J.M.D.; Melián, J.A.H.; Peña, J.P. Determination of the real surface area of Pt electrodes by hydrogen adsorption using cyclic voltammetry. J. Chem. Educ. 2000, 77, 1195. [Google Scholar] [CrossRef]
  59. Shepperd, S.A.; Campbell, S.A.; Smith, J.R.; Lloyd, G.W.; Ralph, T.R.; Walsh, F.C. Electrochemical and microscopic characterization of platinum-coated perfluorosulfonic acid (Nafion 117). Analyst 1998, 123, 1923. [Google Scholar] [CrossRef]
  60. Pan, C.J.; Sarma, L.S.; Hwang, B.J. Formation and Characterization of Bimetallic Nanoparticles in Electrochemistry. In Handbook of Nanoelectrochemistry; Aliofkhazraei, M., Makhlouf, A., Eds.; Springer: New York, NY, USA, 2015; pp. 169–239. [Google Scholar]
Figure 1. (a) XRD of Sr0.5Mo0.5O4−δ under different calcination temperatures. (b) Raman of Sr0.5Mo0.5O4−δ under different calcination temperatures, and (c) uncalcined Sr0.5Mo0.5O4−δ.
Catalysts 12 00676 g001
Figure 2. (a) Sr 3d, (b) Mo 3d, and (c) Pt 4f XPS of Pt/different calcination of Sr0.5Mo0.5O4–δ-C.
Catalysts 12 00676 g002aCatalysts 12 00676 g002b
Figure 3. (a) SEM image and (bf) EDS elemental mapping of Pt/uncalcined Sr0.5Mo0.5O4−δ-C electrocatalysts.
Catalysts 12 00676 g003
Figure 4. (a) TEM image, (b) lattice fringes, and (c) EDS of Pt/uncalcined Sr0.50Mo0.50O4−δ-C electrocatalysts.
Catalysts 12 00676 g004
Figure 5. (a) CV curves of MOR, (b) hydrogen electroadsorption voltammetry of Pt/C and Pt/different calcination Sr0.5Mo0.5O4−δ/C electrocatalysts. (c) EIS and (d) CO stripping voltammetry on Pt/C and Pt/different calcination temperature Sr0.5Mo0.5O4−δ/C electrocatalysts.
Catalysts 12 00676 g005
Figure 6. (a) CV curves of MOR, (b) hydrogen electroadsorption voltammetry, (c) Nyquist plots, and (d) CO stripping voltammetry for various electrocatalysts.
Catalysts 12 00676 g006aCatalysts 12 00676 g006b
Figure 7. (a) Pt 4f (b) Mo 3d, and (c) Sr 3d XPS for various electrocatalysts.
Catalysts 12 00676 g007aCatalysts 12 00676 g007b
Figure 8. (a) DMFC performance and (b) the number of cycles of commercial 20%-Pt/C and uncalcined Sr0.5Mo0.5O4−δ-C electrocatalysts with different Pt loading contents.
Catalysts 12 00676 g008
Figure 9. CO stripping of mechanism of Pt/uncalcined Sr0.5Mo0.5O4−δ-C.
Catalysts 12 00676 g009
Table 1. Relative area of Mo 3d and Pt 4f from XPS of Pt/different calcination temperature Sr0.5Mo0.5O4δ-C electrocatalysts.
ElectrocatalystsMo5+ (%)Mo6+ (%)Pt0 (%)Pt2+ (%)Pt4+ (%)
Pt/Uncalcined Sr0.5Mo0.5O4−δ–C74.0 36.054.631.613.8
Pt/200 Sr0.5Mo0.5O4−δ–C72.627.438.251.610.4
Pt/400 Sr0.5Mo0.5O4−δ–C29.570.534.638.227.2
Table 2. The electrochemical performances of Pt/different calcination temperature Sr0.5Mo0.5O4−δ-C electrocatalysts.
ElectrocatalystsForward Peak Current Density (mA/cm2)ECSAH
(m2/g)
Onset Potential-H (mV)Rct
(Ω cm2)
ECSACO
(m2/g)
Onset Potential-co (mV)
Pt/uncalcined MoO3x–C9.5045.37399141062.78535
Pt/uncalcined Sr0.5Mo0.5O4-δ–C12.56116.53344940168.14476
Pt/200 Sr0.5Mo0.5O4-δ–C4.4125.12411460023.57430
Pt/400 Sr0.5Mo0.5O4-δ–C3.6222.52411568220.32450
Table 3. The electrochemical performances of Pt-different SrMoO4/C electrocatalysts.
ElectrocatalystsForward Peak Current Density (mA cm–2)ECSAH
(m2 g–1)
Onset Potential-H (mV)ECSACO
(m2 g–1)
Onset Potential-co (mV)Rct
(Ω cm2)
Pt/C8.8763.8140552.615151220
Pt/Sr0.5Mo0.5O4−δ-C12.56116.53344168.14476940
Pt/Sr0.67Mo0.33O4−δ-C8.8725.1236944.384651590
Pt/Sr0.75Mo0.25O4-δ-C6.3524.1537731.205331900
Pt/Sr0.3Mo0.67O4-δ-C6.5819.9036537.954891860
Table 4. Relative area of Pt 4f XPS for various electrocatalysts.
MaterialsPt0 (%)Pt2+ (%)Pt4+ (%)
Pt/C53.136.410.5
Pt/Sr0.50Mo0.50O4−δ-C54.631.613.8
Pt/Sr0.67Mo0.33O4−δ-C42.542.714.8
Pt/Sr0.75Mo0.25O4-δ-C38.14219.9
Pt/Sr0.33Mo0.67O4-δ-C39.248.512.3
Publisher’s Note: MDPI stays neutral with regard to jurisdictional claims in published maps and institutional affiliations.

