Article

Highly Efficient and Selective Carbon-Doped BN Photocatalyst Derived from a Homogeneous Precursor Reconfiguration

1
School of Materials Science and Engineering, Hebei University of Technology, Tianjin 300130, China
2
Hebei Key Laboratory of Boron Nitride Micro and Nano Materials, Hebei University of Technology, Tianjin 300130, China
3
Hebei Key Laboratory of Photoelectric Control on Surface and Interface, School of Sciences, Hebei University of Science and Technology, Shijiazhuang 050018, China
4
Applying Chemistry Key Laboratory of Hebei Province, State Key Laboratory of Metastable Materials Science and Technology, Yanshan University, Qinhuangdao 066004, China
*
Authors to whom correspondence should be addressed.
Catalysts 2022, 12(5), 555; https://doi.org/10.3390/catal12050555
Submission received: 27 April 2022 / Revised: 16 May 2022 / Accepted: 16 May 2022 / Published: 18 May 2022
(This article belongs to the Special Issue Advances in Heterojunction Photocatalysts)

Abstract

:
The modification of inert boron nitride by carbon doping to make it an efficient photocatalyst has been considered as a promising strategy. Herein, a highly efficient porous BCN (p-BCN) photocatalyst was synthesized via precursor reconfiguration based on the recrystallization of a new homogeneous solution containing melamine diborate and glucose. Two crystal types of the p-BCN were obtained by regulating the recrystallization conditions of the homogeneous solution, which showed high photocatalytic activities and a completely different CO2 reduction selectivity. The CO generation rate and selectivity of the p-BCN-1 were 63.1 μmol·g−1·h−1 and 54.33%; the corresponding values of the p-BCN-2 were 42.6 μmol·g−1·h−1 and 80.86%. The photocatalytic activity of the p-BCN was significantly higher than those of equivalent materials or other noble metals-loaded nanohybrids reported in the literature. It was found that the differences in the interaction sites between the hydroxyl groups in the boric acid and the homolateral hydroxyl groups in the glucose were directly correlated with the structures and properties of the p-BCN photocatalyst. We expect that the developed approach is general and could be extended to incorporate various other raw materials containing hydroxyl groups into the melamine diborate solution and could modulate precursors to obtain porous BN-based materials with excellent performance.

Graphical Abstract

1. Introduction

Hexagonal boron nitride (h-BN), called “white graphene”, is a versatile material used in a number of diverse applications due to its thermal conductivity, mechanical strength, and chemical stability [1,2,3,4]. Although h-BN has so many advantages, it is a wide-band semiconductor (~5.5 eV) and is not suitable for use as a photocatalyst [4]. At present, h-BN is mainly used as a catalyst support, with its high specific surface areas and active edges examined in studies on its application as a photocatalyst [5].
Only a few studies have reported that the band gap of h-BN can be adjusted by doping to make it a suitable photocatalyst [6,7,8,9,10]. Among them, the doped h-BN structures with carbon atoms have been regarded with particular interest due to their simple preparation process and superior photocatalytic performance. The precursors of the reported carbon doping of h-BN (BCN) can be prepared by mechanically mixing a carbon source, boron source, and nitrogen source together using grinding mechanochemistry methods [8,11,12,13,14]. Manual grinding refines the size of the bulk raw materials into desired sizes; however, segregation often occurs in the mixing process due to the different densities of the raw materials, and an unevenly mixed precursor results [15,16]. Moreover, the influence of mechanical energy on the material properties in the grinding process is very complex and uncertain, resulting in the formation difficulty in controlling the crystal type and morphology of the product [17].
However, the chemical synthesis method can effectively avoid the above problems [18,19]. For instance, boric acid and melamine can be dissolved in water to form a homogeneous solution at high temperatures by this method, which are recrystallized to obtain a melamine diborate (C3N6H6·2H3BO3, M·2B) hydrogen-bond adduct with a uniform and definite structure [18,19]. Additionally, M·2B has been used as a highly promising precursor to porous h-BN nanosheets, with a desirable morphology and function [20,21]. In addition, glucose in the furanose form, as a polyhydroxy monosaccharide, can react with boric acid to form boronated complexes [22,23,24]. Therefore, it is expected that glucose as a carbon source can react with the boric acid in the M·2B solution to obtain a new precursor by the rational design, which, upon pyrolysis, could form BCN photocatalysts with a similar morphology as the porous h-BN nanosheets and with superior performance in the photocatalytic reaction. Such an insight makes it possible to tailor-make the synthesis of BCN photocatalysts with the desired properties and structures from the precursor [25].
In this work, a strategy was introduced for preparing precursors with a uniform and definite structure by recrystallization from a homogeneous solution containing M·2B and glucose, which was pyrolyzed to synthesize a highly efficient and selectively porous BCN (p-BCN) photocatalyst. By systematically studying the chemistry of the precursor, it was found that boric acid reacted with both melamine and a pair of adjacent hydroxyl groups on the anomeric carbon C(1) and C(2) or terminal carbon C(4) and C(6) of glucose to obtain the reconfigurated precursors by two cooling modes in the homogeneous solution. The resultant p-BCN photocatalysts showed two distinct structures with excellent photocatalytic activities and distinct selectivity for CO2 conversion. This work is a new case of preparing a high-performance BCN photocatalyst by the recrystallization of a homogeneous solution, which will provide guidance to optimize precursor modulation so as to fully satisfy the application design of h-BN-based functional materials.

2. Results

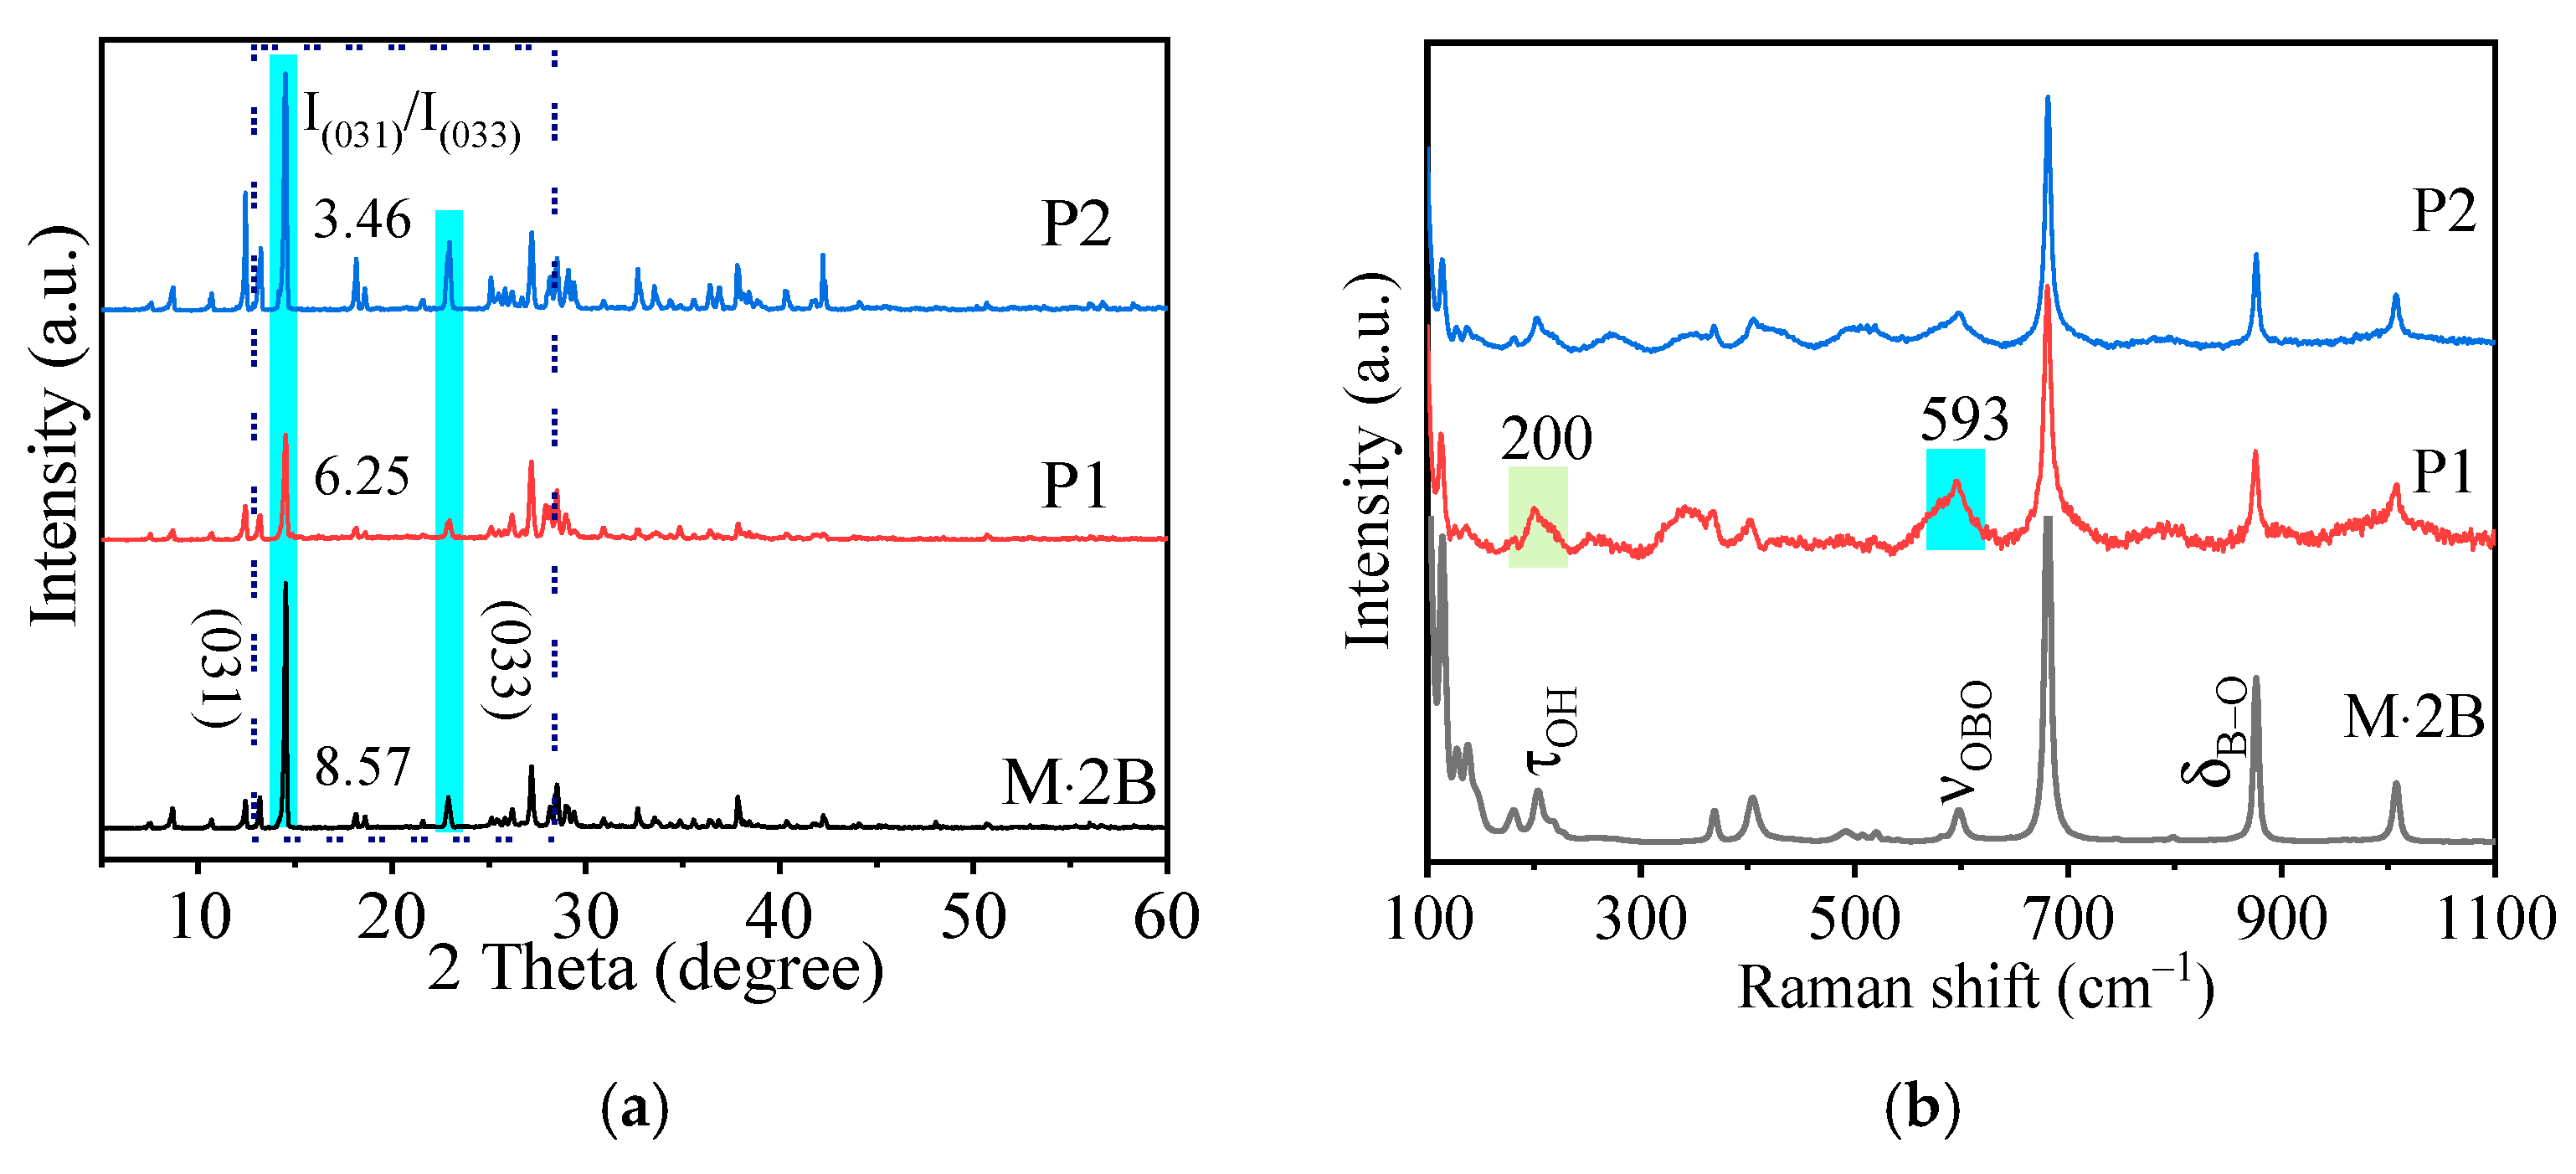
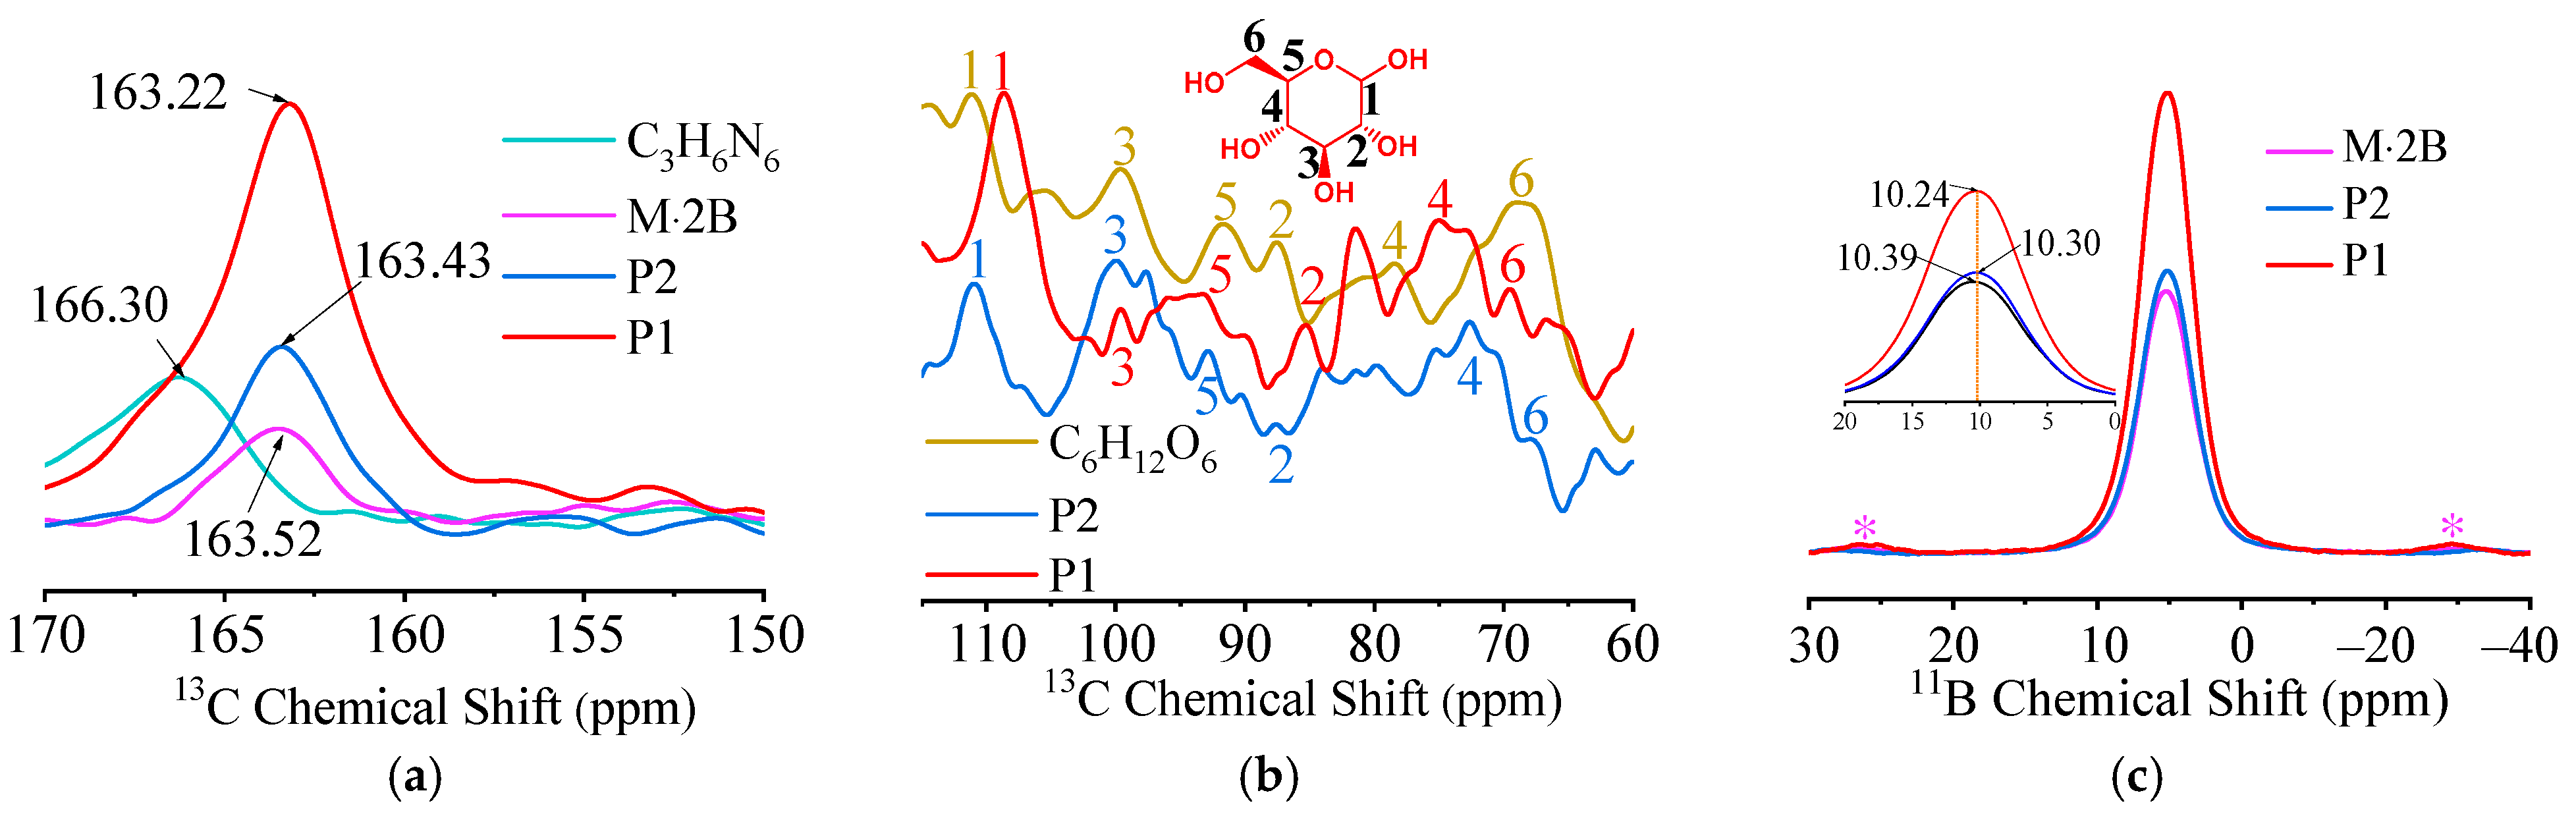
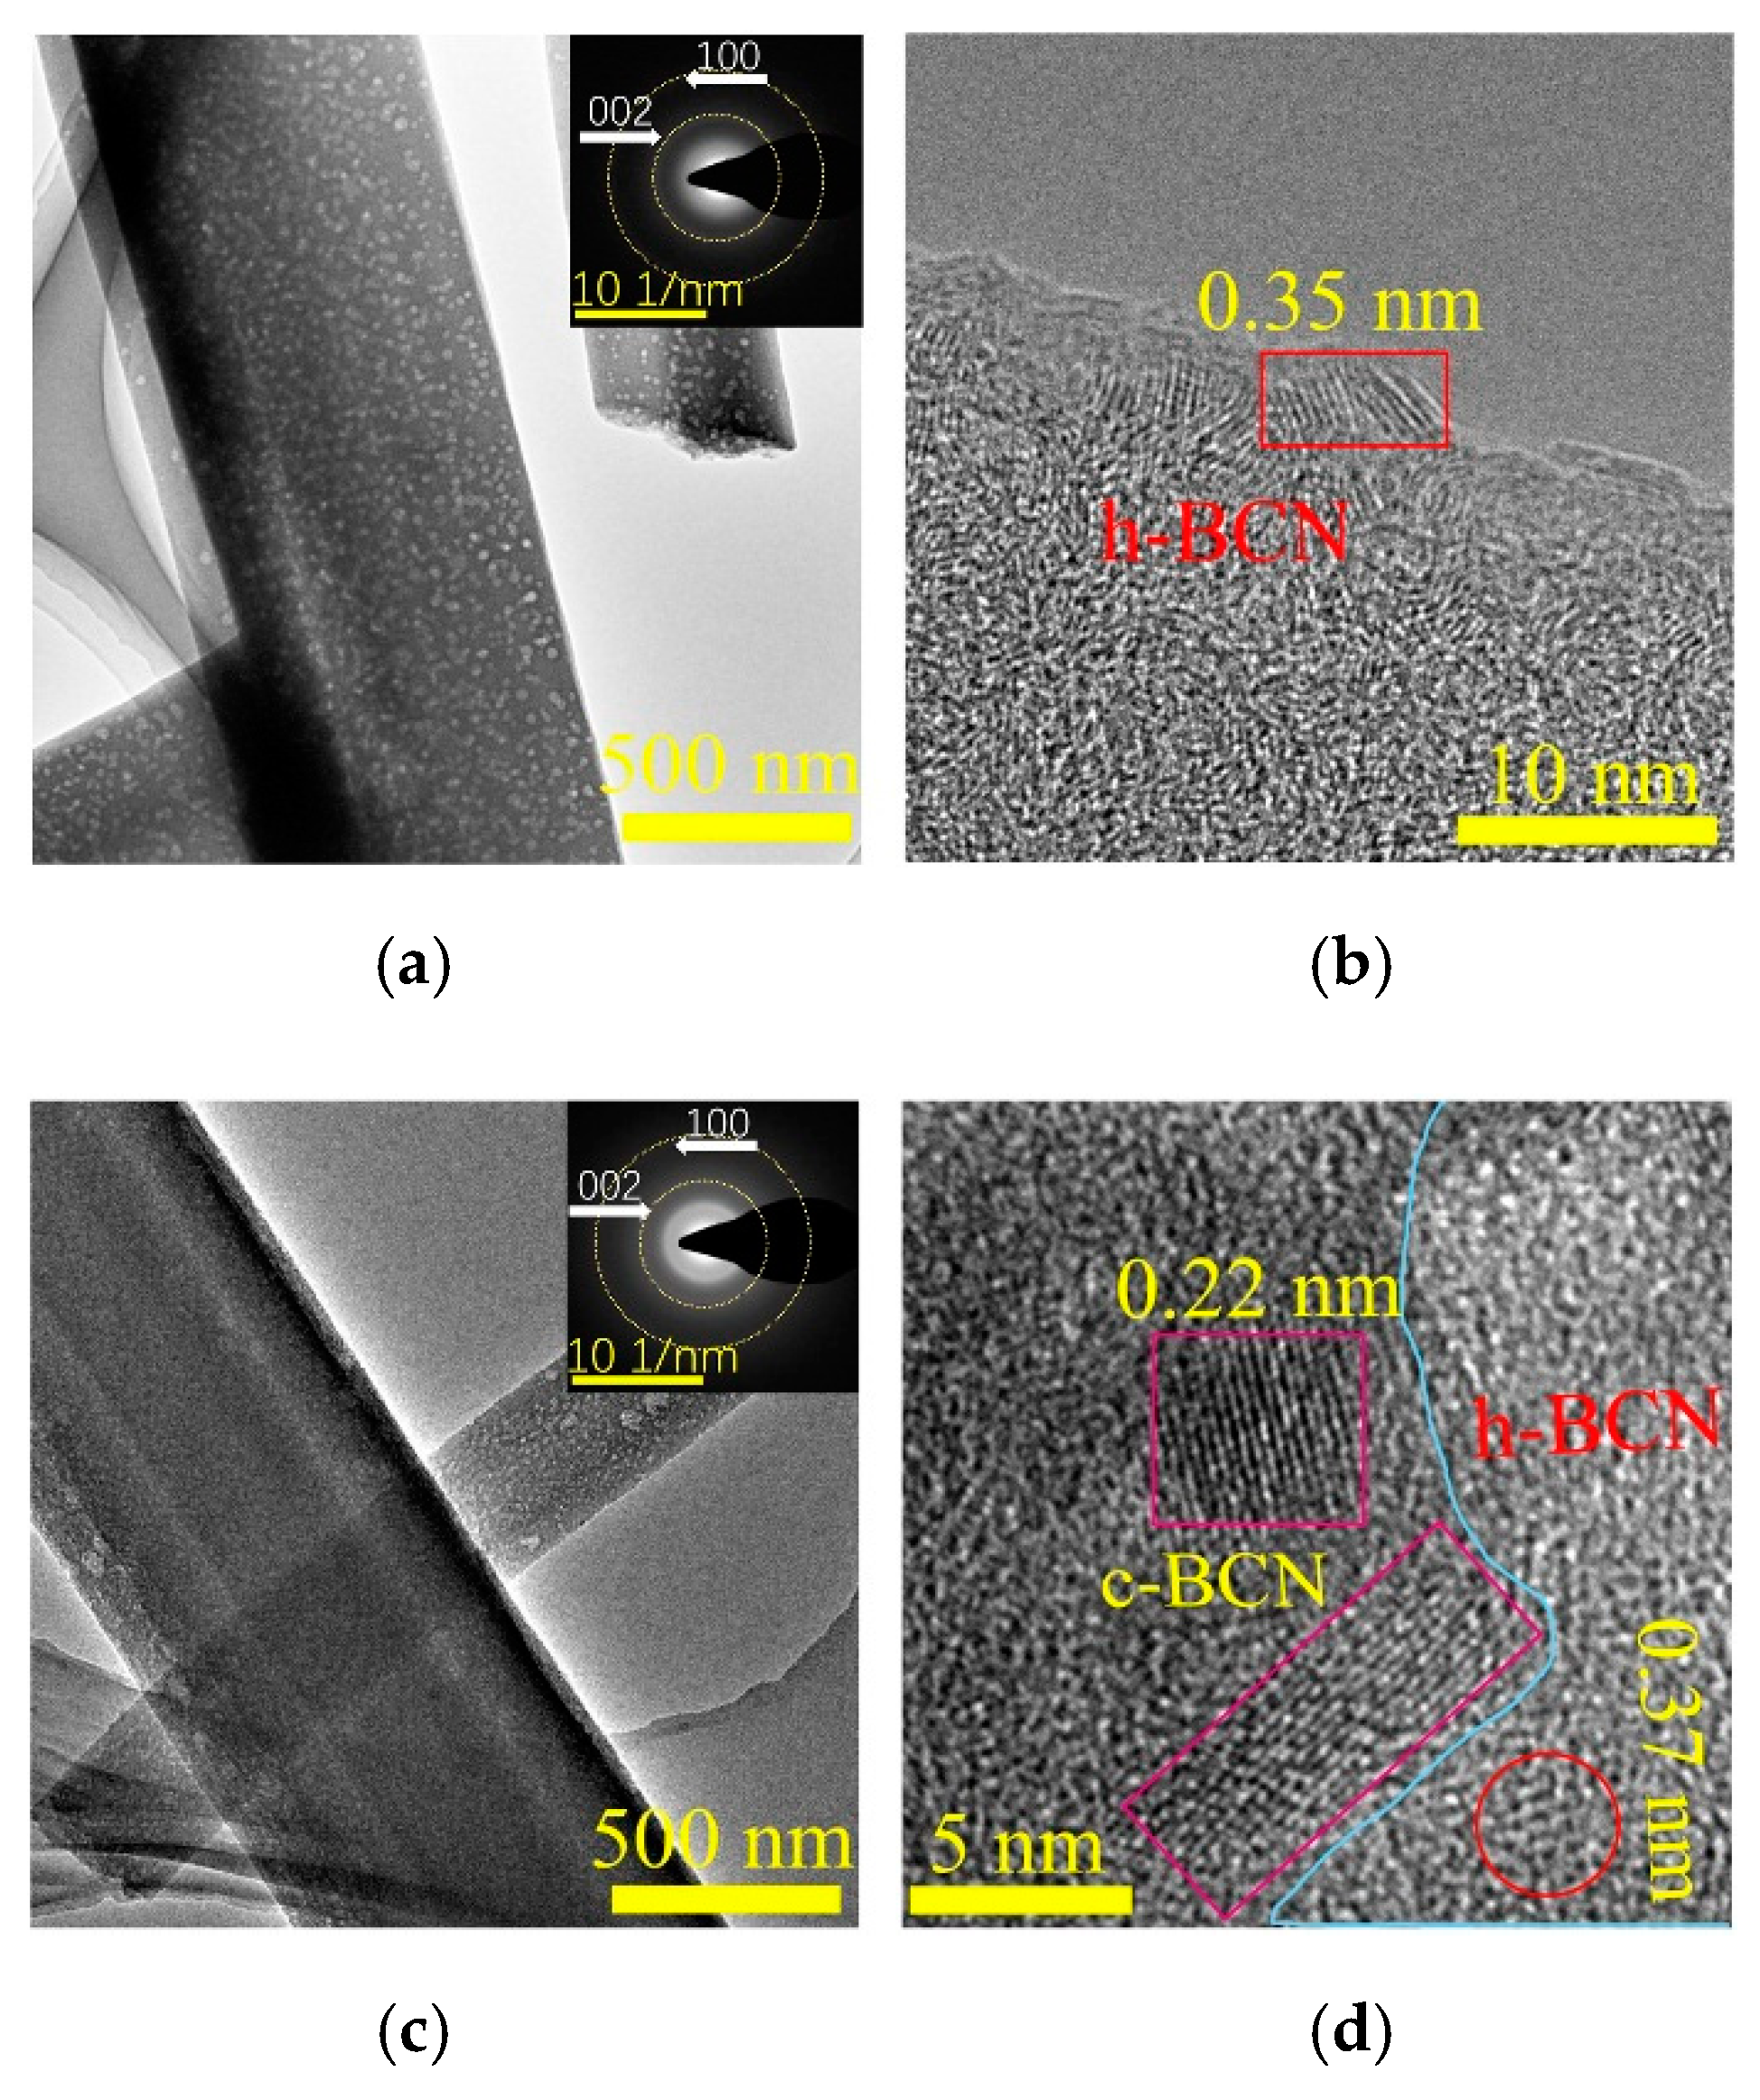
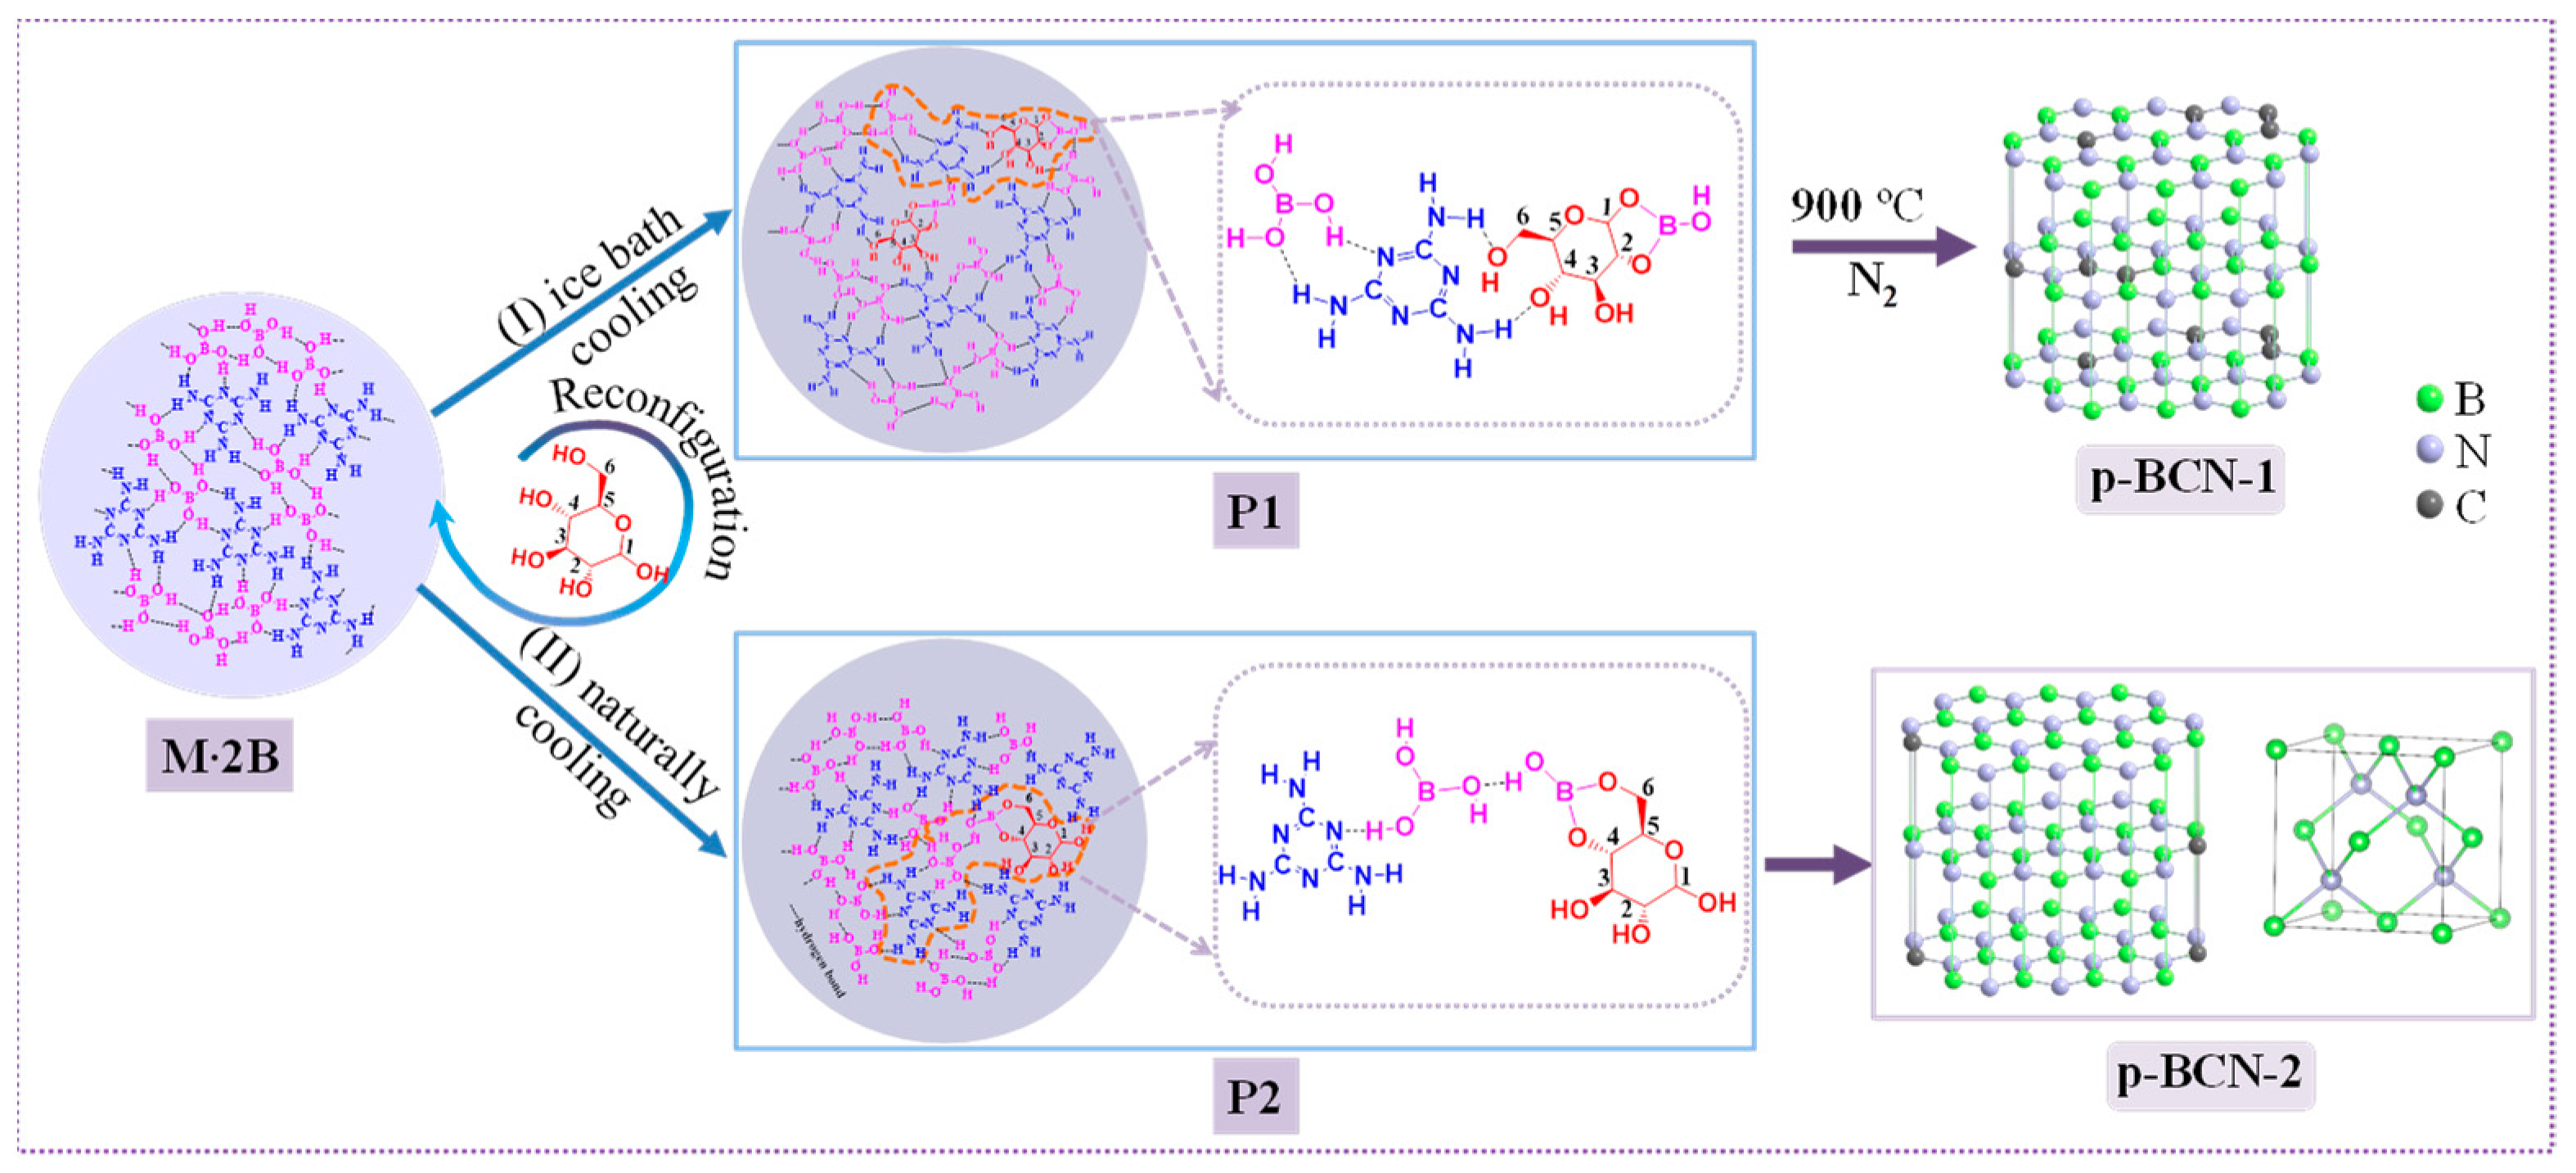
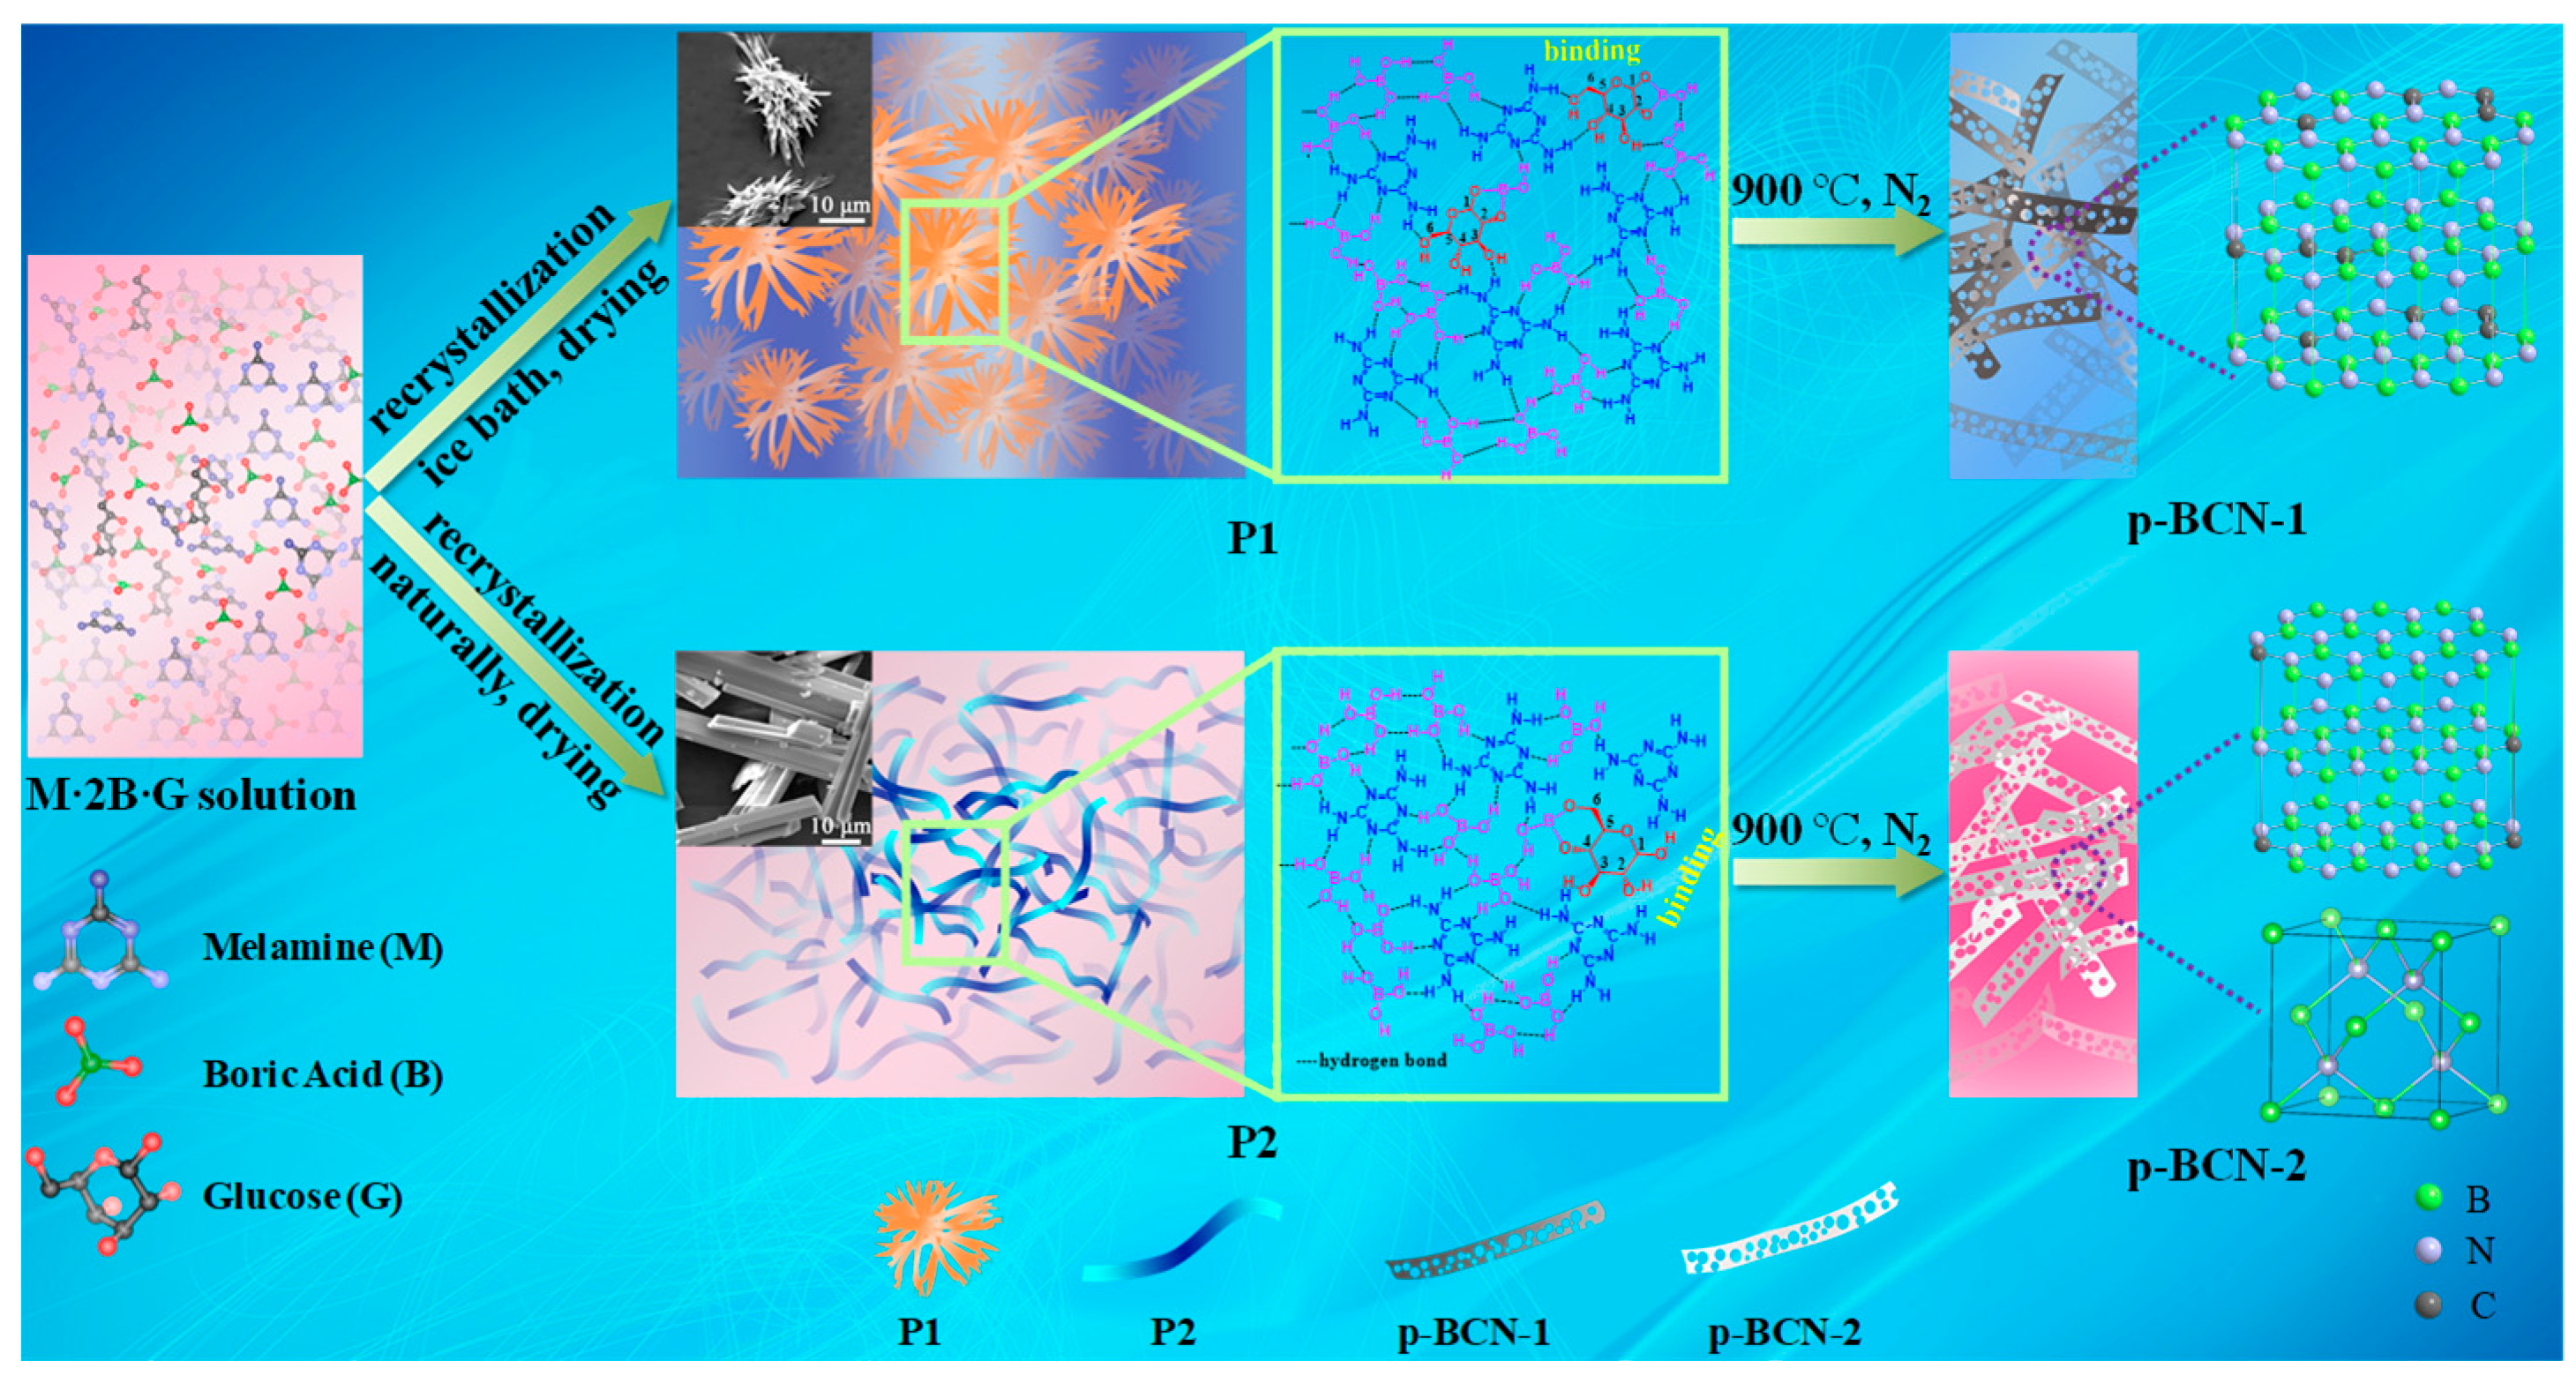
2.1. Characterization of Precursors

The microstructures and composition of the P1 and P2 precursors were studied and Figure 1a shows the crystallographic character of the samples. M·2B was crystallized in a monoclinic P21/m space group by single crystal analysis (Table S1 and Figure S1 in Supplementary Materials) and the I(031)/I(033) values of the XRD of P1 and P2 were lower than that of the M·2B [19,20]. These results imply that the addition of glucose had an evident effect on the crystal structure of the M·2B, which may have been caused by the preferred orientation between the boric acid and the melamine or glucose [19]. Figure 1b shows the Raman spectra of P1 and P2 in the region of 100~1100 cm−1. Compared with the M·2B, the broader and stronger peaks for P1 and P2 at 593 cm−1 and 200 cm−1, assigned to O−B−O bending and O−H twisting, originated from the interaction between the glucose, boric acid, and melamine, which resulted in an increase in the intermolecular distances and weaker intermolecular coupling [18]. Meanwhile, the lost intensity of the internal modes (200~1100 cm−1) with the broadening peaks of both the precursors are attributed to a random arrangement and distortion within or between the molecules. The properties and variations of the N−H and O−H stretching modes of the precursors were further corroborated in the range of 3000~3600 cm−1 (Figure 1c). Since the melamine unit only utilized two N-donor sites to interact with the four boric acid units in the M·2B [20], the weak and wide Raman bands centered at 3362 cm−1 and 3298 cm−1 probably correspond to the stretching modes of the hydrogen-bonded N−H bonds of the melamine, while the strong bands observed at 3518 cm−1, 3483 cm−1, and 3410 cm−1 are assigned to the free N−H bonds of the melamine. Additionally, the O−H stretching mode appeared as weak broad Raman bands around 3187 cm−1. As displayed in Figure 1c, the relative intensity of the free N−H bonds in both P1 and P2 became weaker than that in the M·2B, suggesting that the surplus of the free N−H bonds of the melamine unit reacted with the O−H groups of the glucose through reconfiguration to form hydrogen bonds, resulting in less exposure of the free amino groups in the melamine. The N−H···O hydrogen bonds in P1 and P2, with an increase in the relative intensity of the Raman bands, verified that the O−H bonds of both the boric acid and glucose molecules could link with the N−H bonds of the melamine molecules via N−H···O hydrogen bonds. The results indicated that the addition of glucose had a great influence on the molecular interaction of the M·2B, and the new hydrogen bonds were formed in P1 and P2.
The partial enlargement of the FTIR spectra was performed in two different regions to explicitly investigate the changes in the precursor structures. For P1 and P2, the weak broad band observed at 3189 cm−1 corresponded to the O−H stretching mode (Figure S2) [18,26], which became broader with the addition of glucose. In addition to the peak at 1669 cm−1, which was assigned to −NH2 bending in the range of 1650~1695 cm−1, several new absorption peaks were also detected in P1. The bands at 1681 cm−1, 1672 cm−1, and 1666 cm−1, which were assigned to the C−OH vibrations of the hemiacetal groups in the glucose (Figure 1d), shifted to the lower wavenumbers of 1676 cm−1, 1670 cm−1, and 1663 cm−1 in P1, respectively [23]. These results indicate that glucose molecules existed in P1, and that there may have been hydrogen bonding interactions between the hydroxyl group of the glucose and the amino group of the melamine. The FTIR spectrum of P2 was similar to that of the M·2B; there were no C−OH vibrations of the hemiacetal groups in the glucose molecules. There were also some obvious differences in the FTIR spectra between P1 and P2 (Table S2). The results suggested that some of the peaks of P1 and P2 became broader, less intense, some of them were merged together, and some new peaks were even detected, inferring that the glucose was not simply mixed with the M·2B but interacted with the M·2B in P1 and P2 at a molecular level.
The 13C and 11B solid-state MAS NMR spectra are shown in Figure 2. Compared with the pure melamine, the 13C chemical shifts of the melamine in P1 and P2 decreased to various degrees because of the hydrogen bonds formed between the melamine and glucose (Figure 2a). In addition, the 13C chemical shifts of both C(1) and C(2) in P1 and C(4) and C(6) in P2 were lower than those in the glucose (Figure 2b and Table S3), probably because of the presence of the boron ester deriving from the reaction between the hydroxyl groups on C(1) and C(2) or the hydroxyl groups on C(4) and C(6) of the glucose and boric acid in P1 and P2, respectively [22,27]. Kennedy et al. proved that glucose is mainly complexed with ortho hydroxyl groups by 11B NMR spectra [28]. This inference was further confirmed by 11B MAS NMR spectra analysis. The 11B chemical shift δ of the P1 and P2 samples were lower than that of the M·2B (Figure 2c). Because the electronegativity of the B atoms was lower than that of the H atoms and C atoms, the chemical shift of the 13C moved to the high field due to the inductive effect, resulting in a decrease in the 13C chemical shift. On the contrary, the chemical shift of the 11B moved to the low field due to the inductive effect, resulting in an increases in the 11B chemical shift. These results indicate that the boric acid could not only interact with the melamine to form a M·2B supramolecule, but could also interact with the glucose to form a boron ester. Therefore, the glucose molecules could combine with the boric acid and melamine through chemical bonding in P1 and P2 with large intermolecular distances, weak intermolecular coupling, random arrangement, and distortion, which are favorable for C element doping into the BN lattice to form p-BCN. Moreover, thermogravimetric (TG) analysis performed in N2 confirmed that the temperatures of the endothermic peaks of P1 (150 °C) and P2 (167 °C) were different due to the difference in the hydrogen bonds of P1 and P2 in comparison with the M·2B (Figure S3) [29].

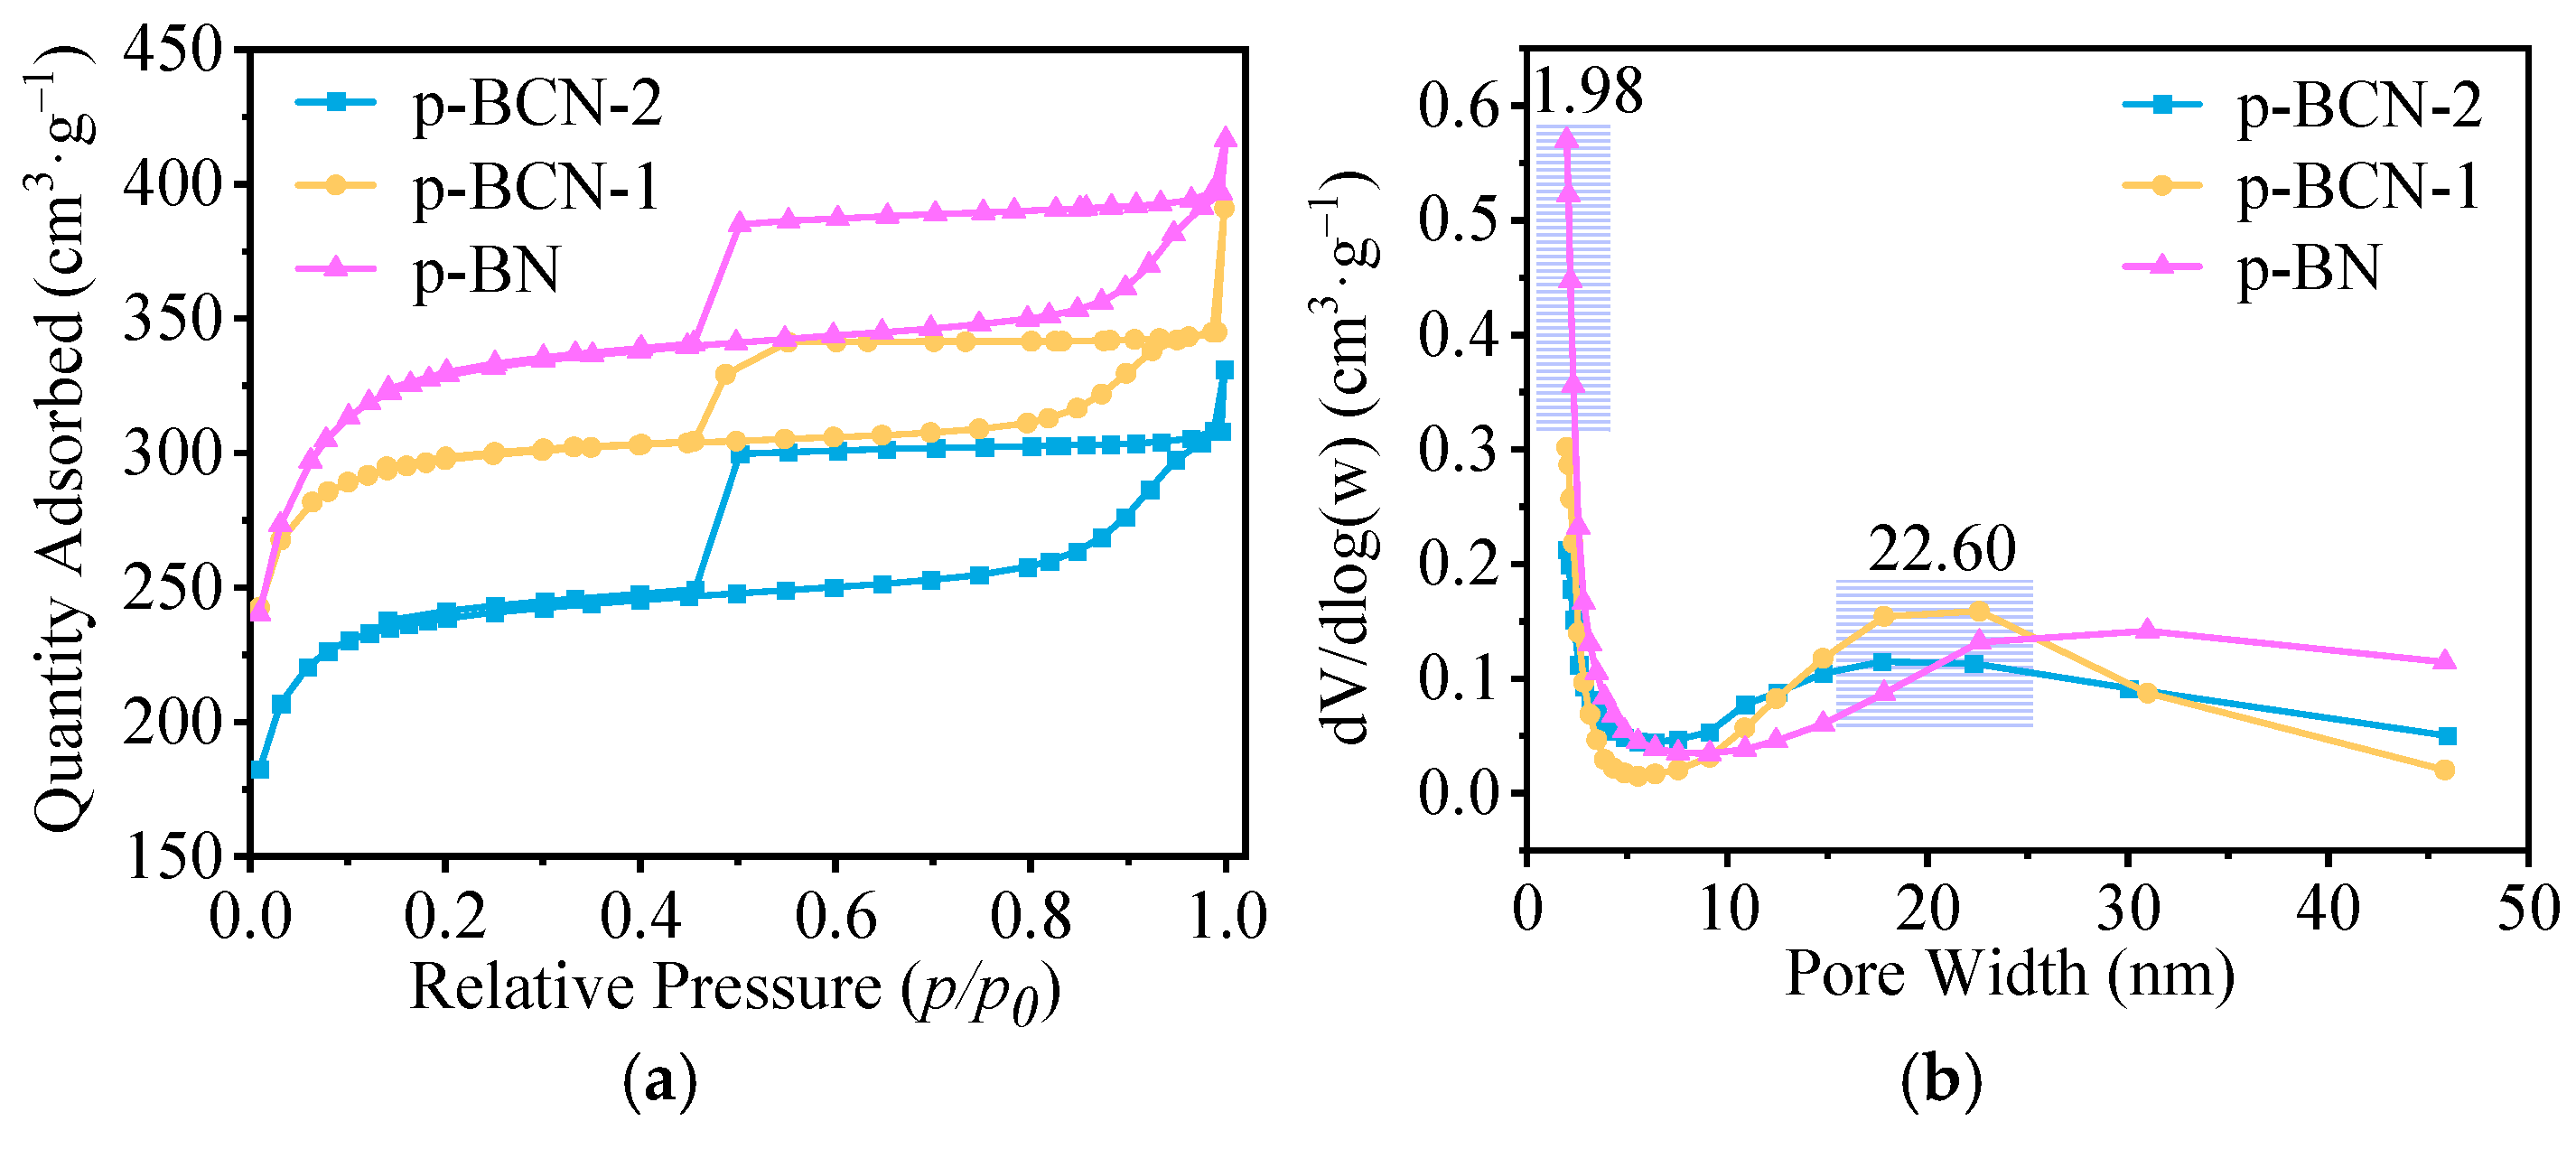
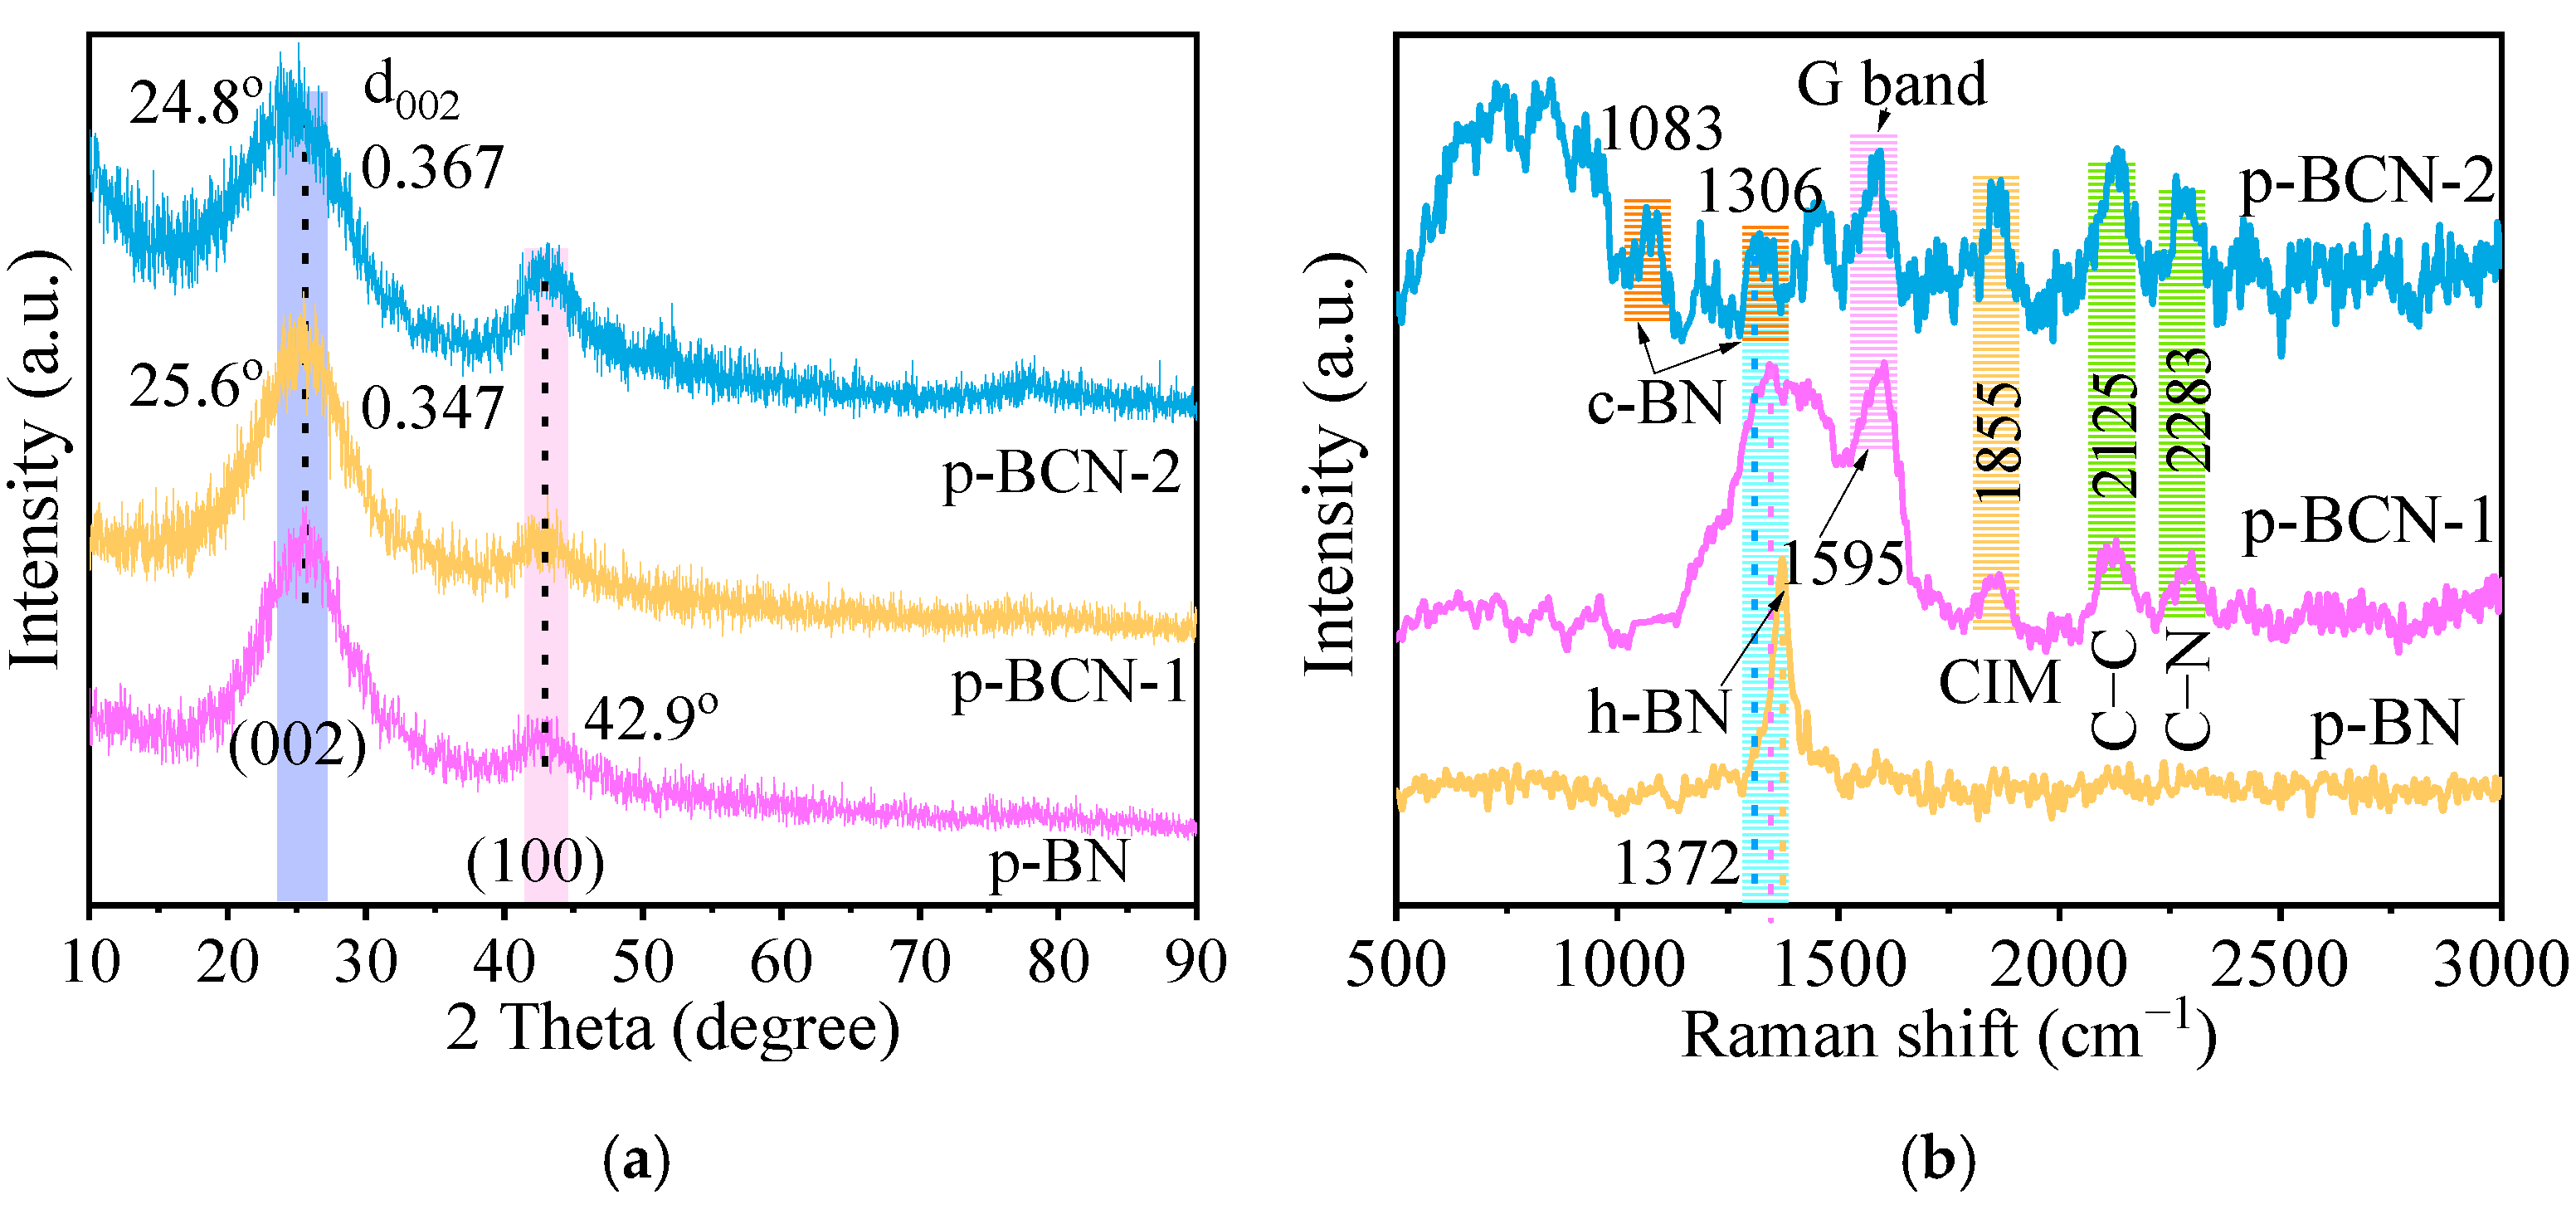
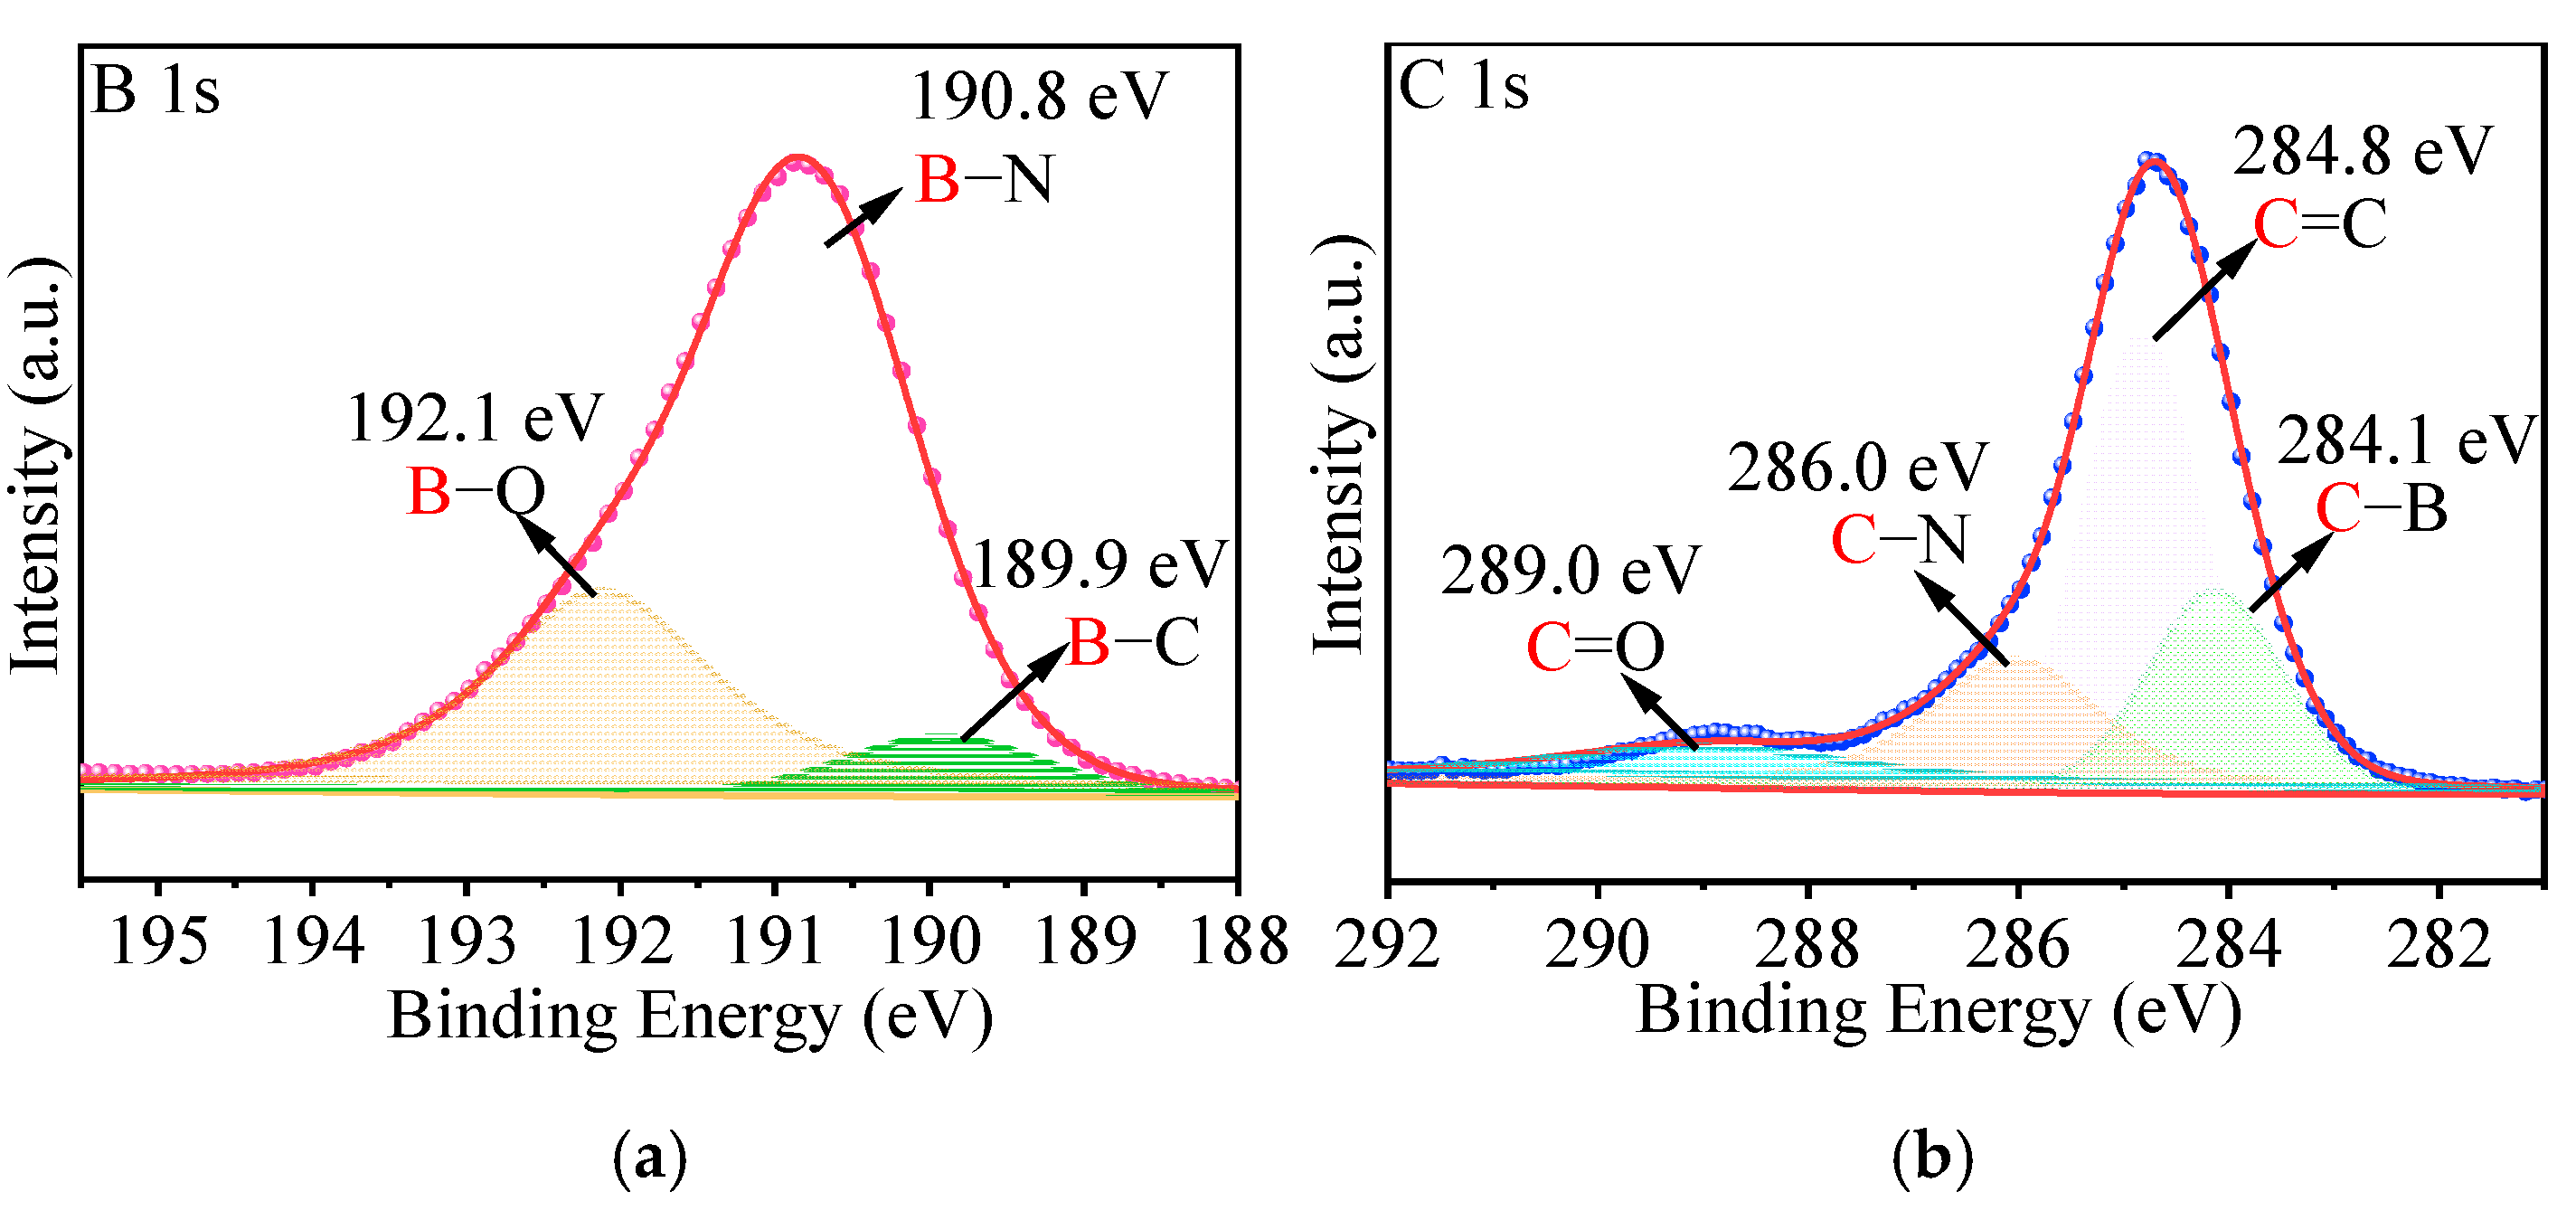
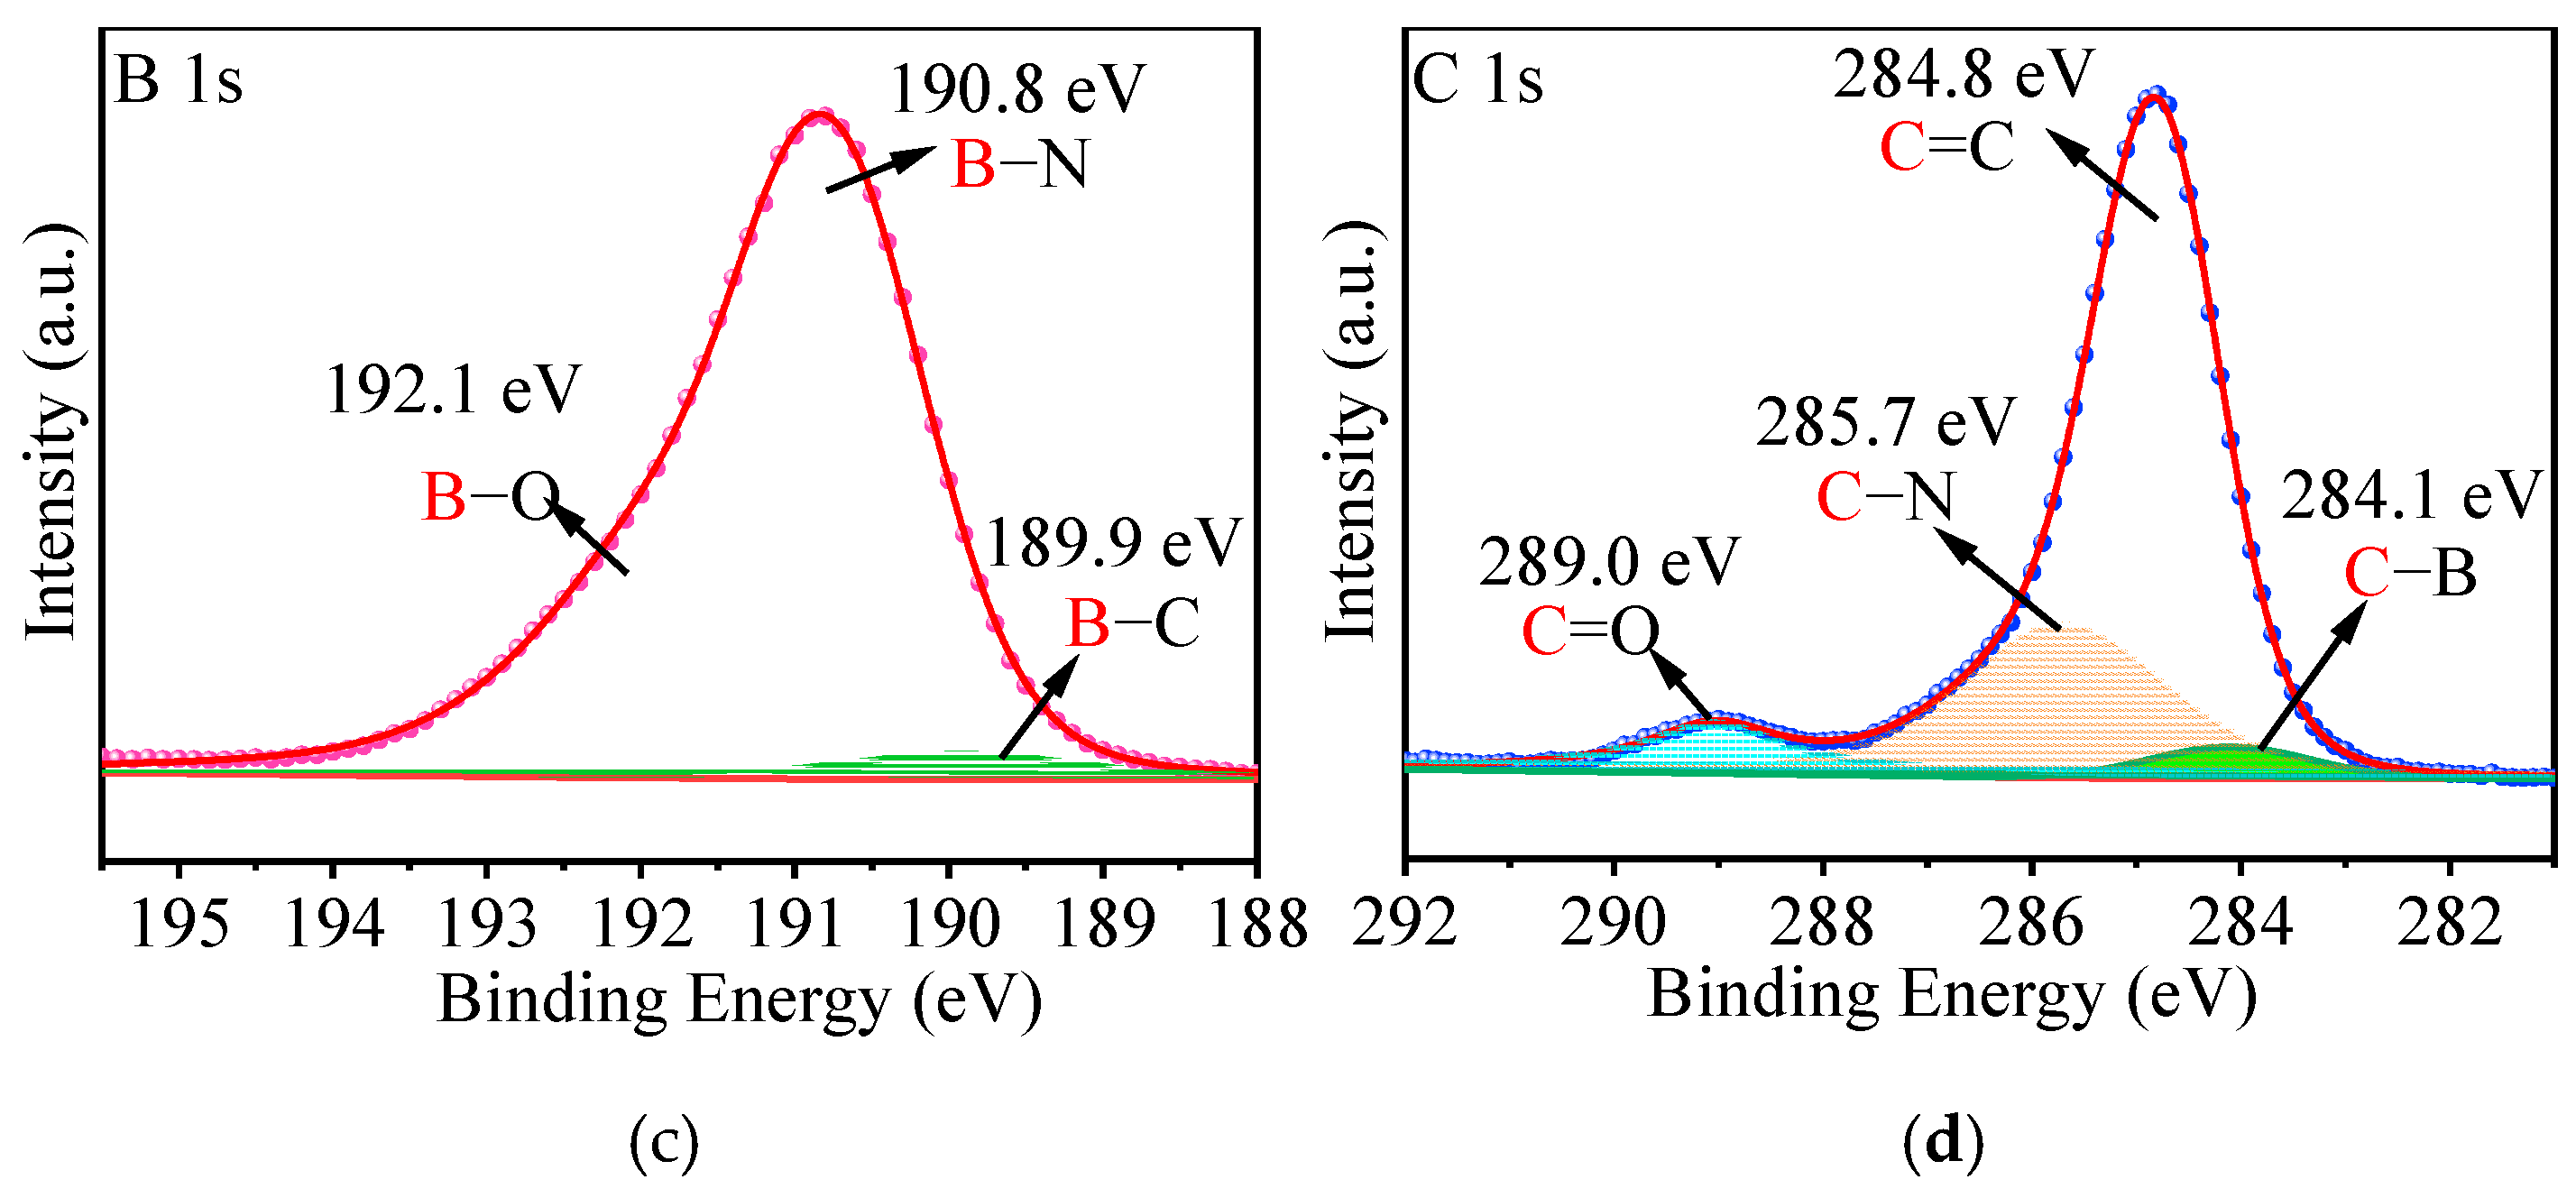
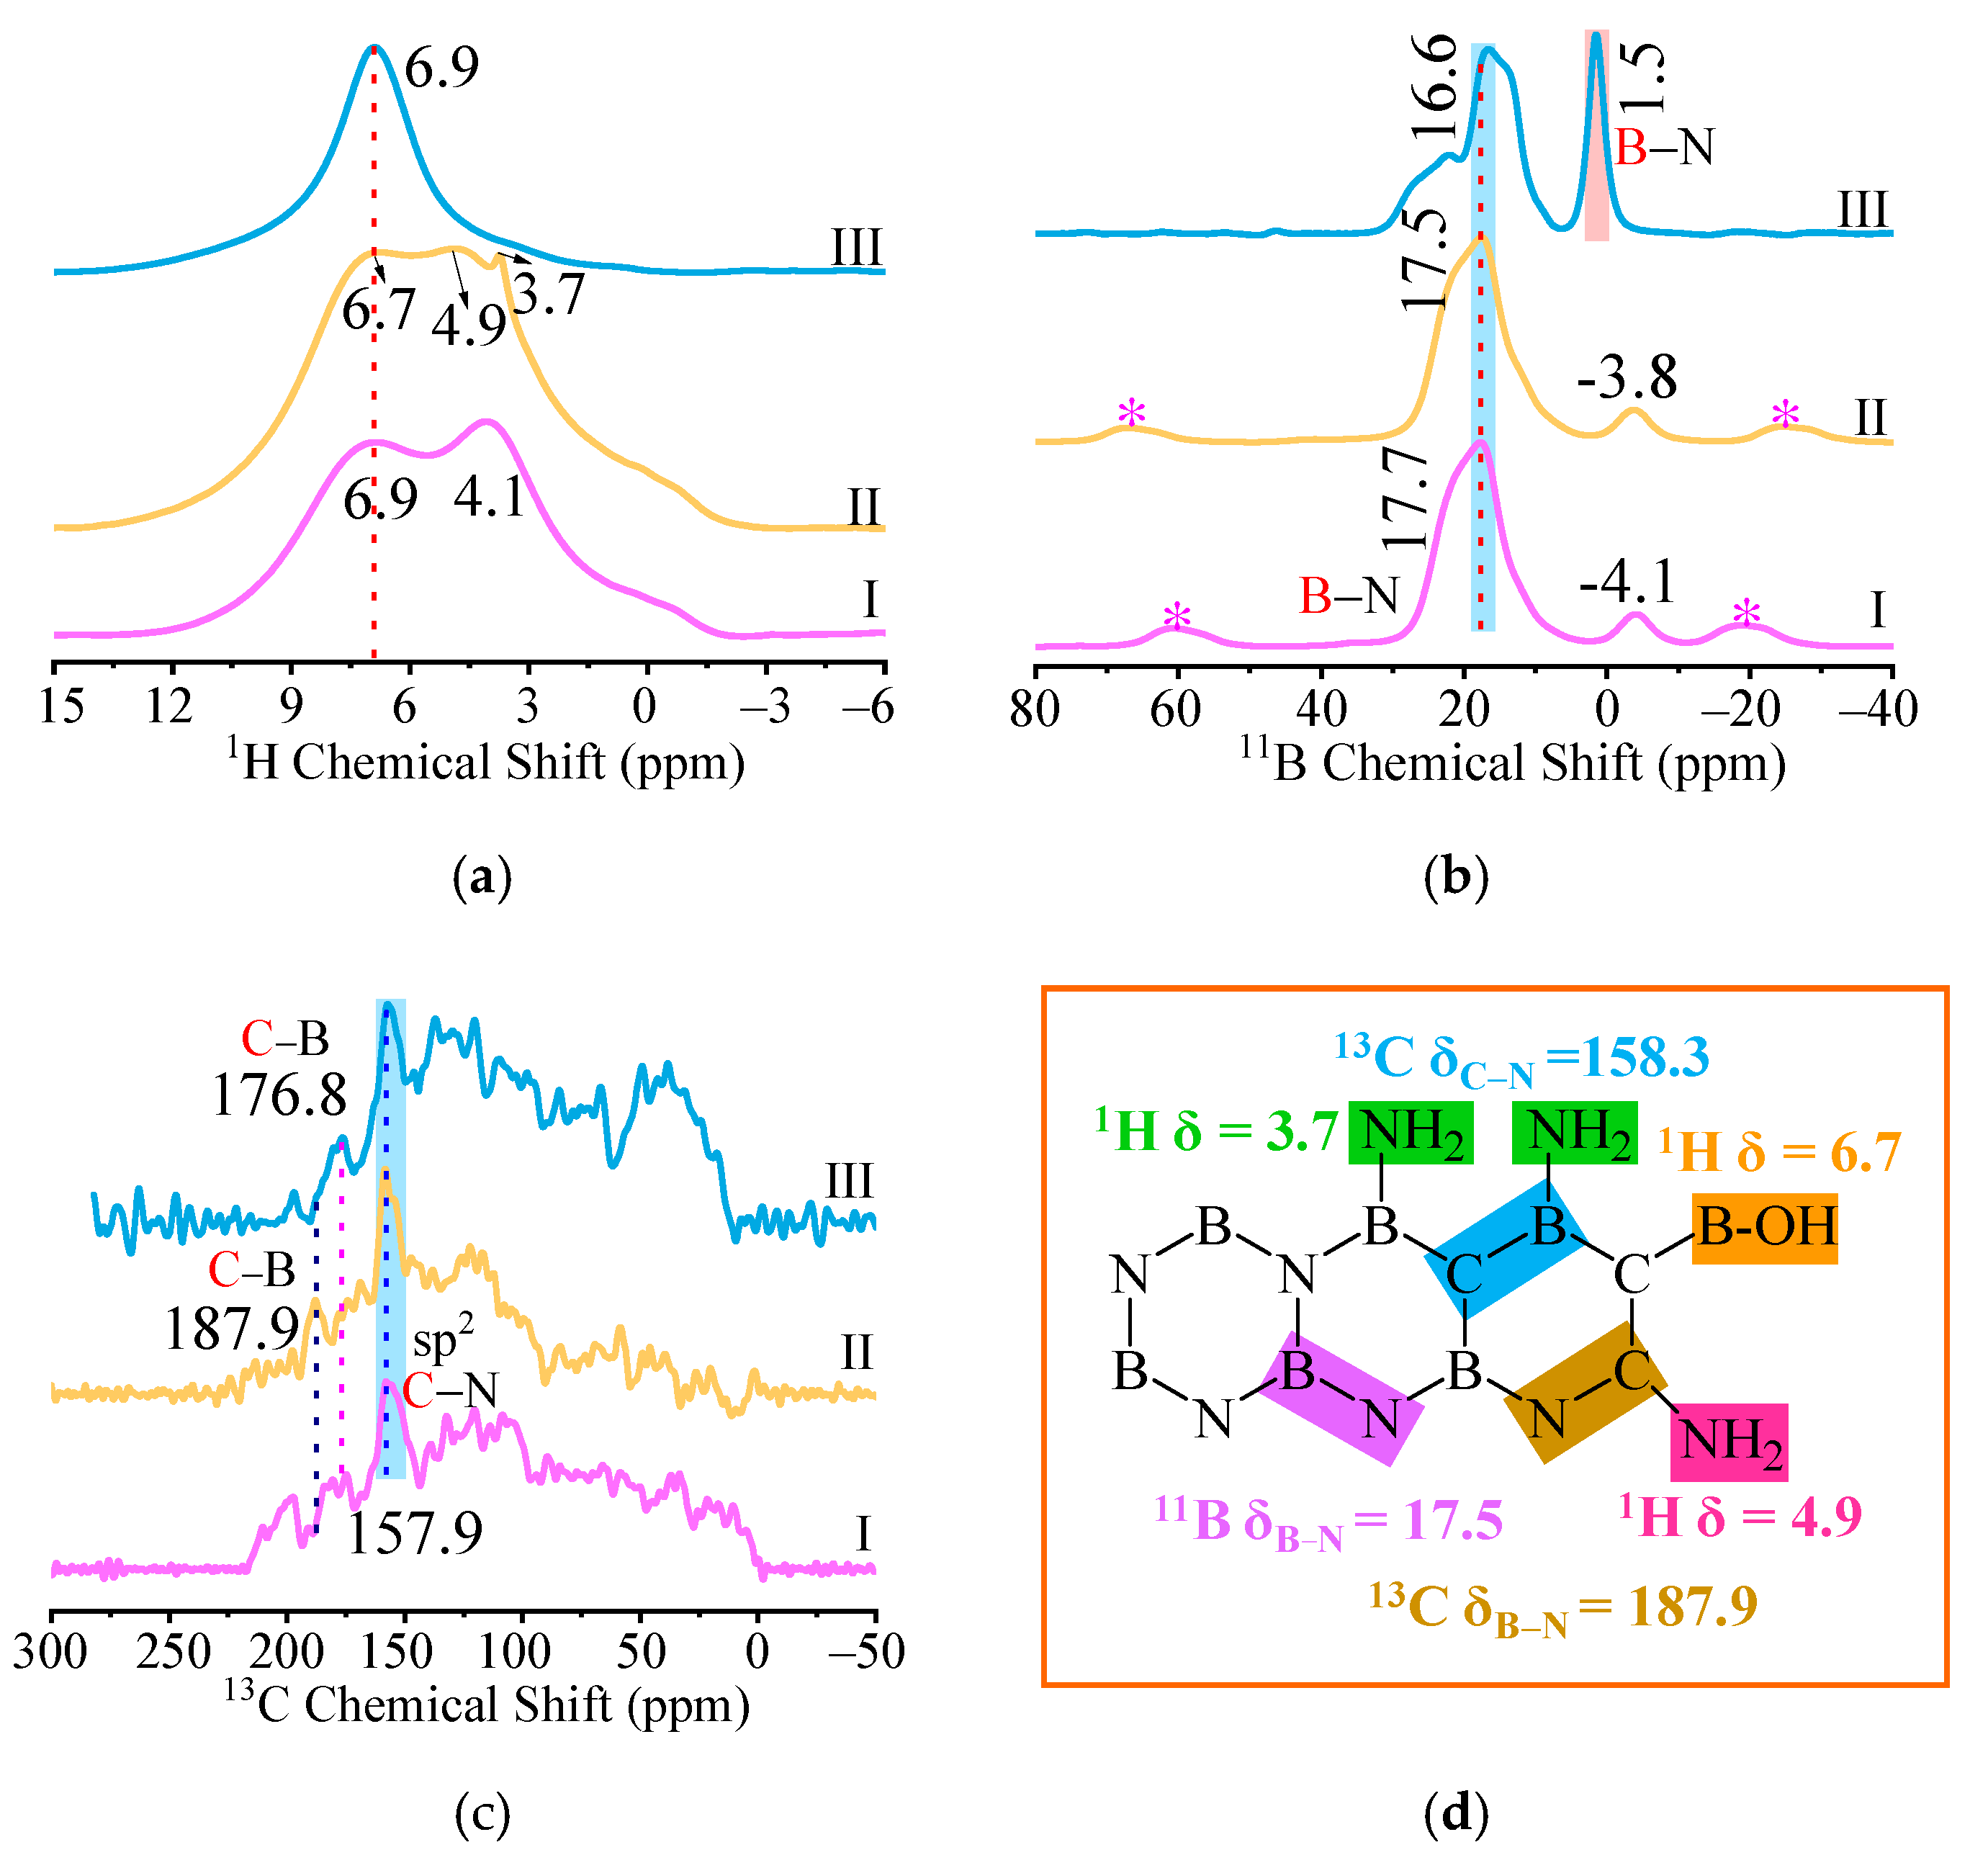
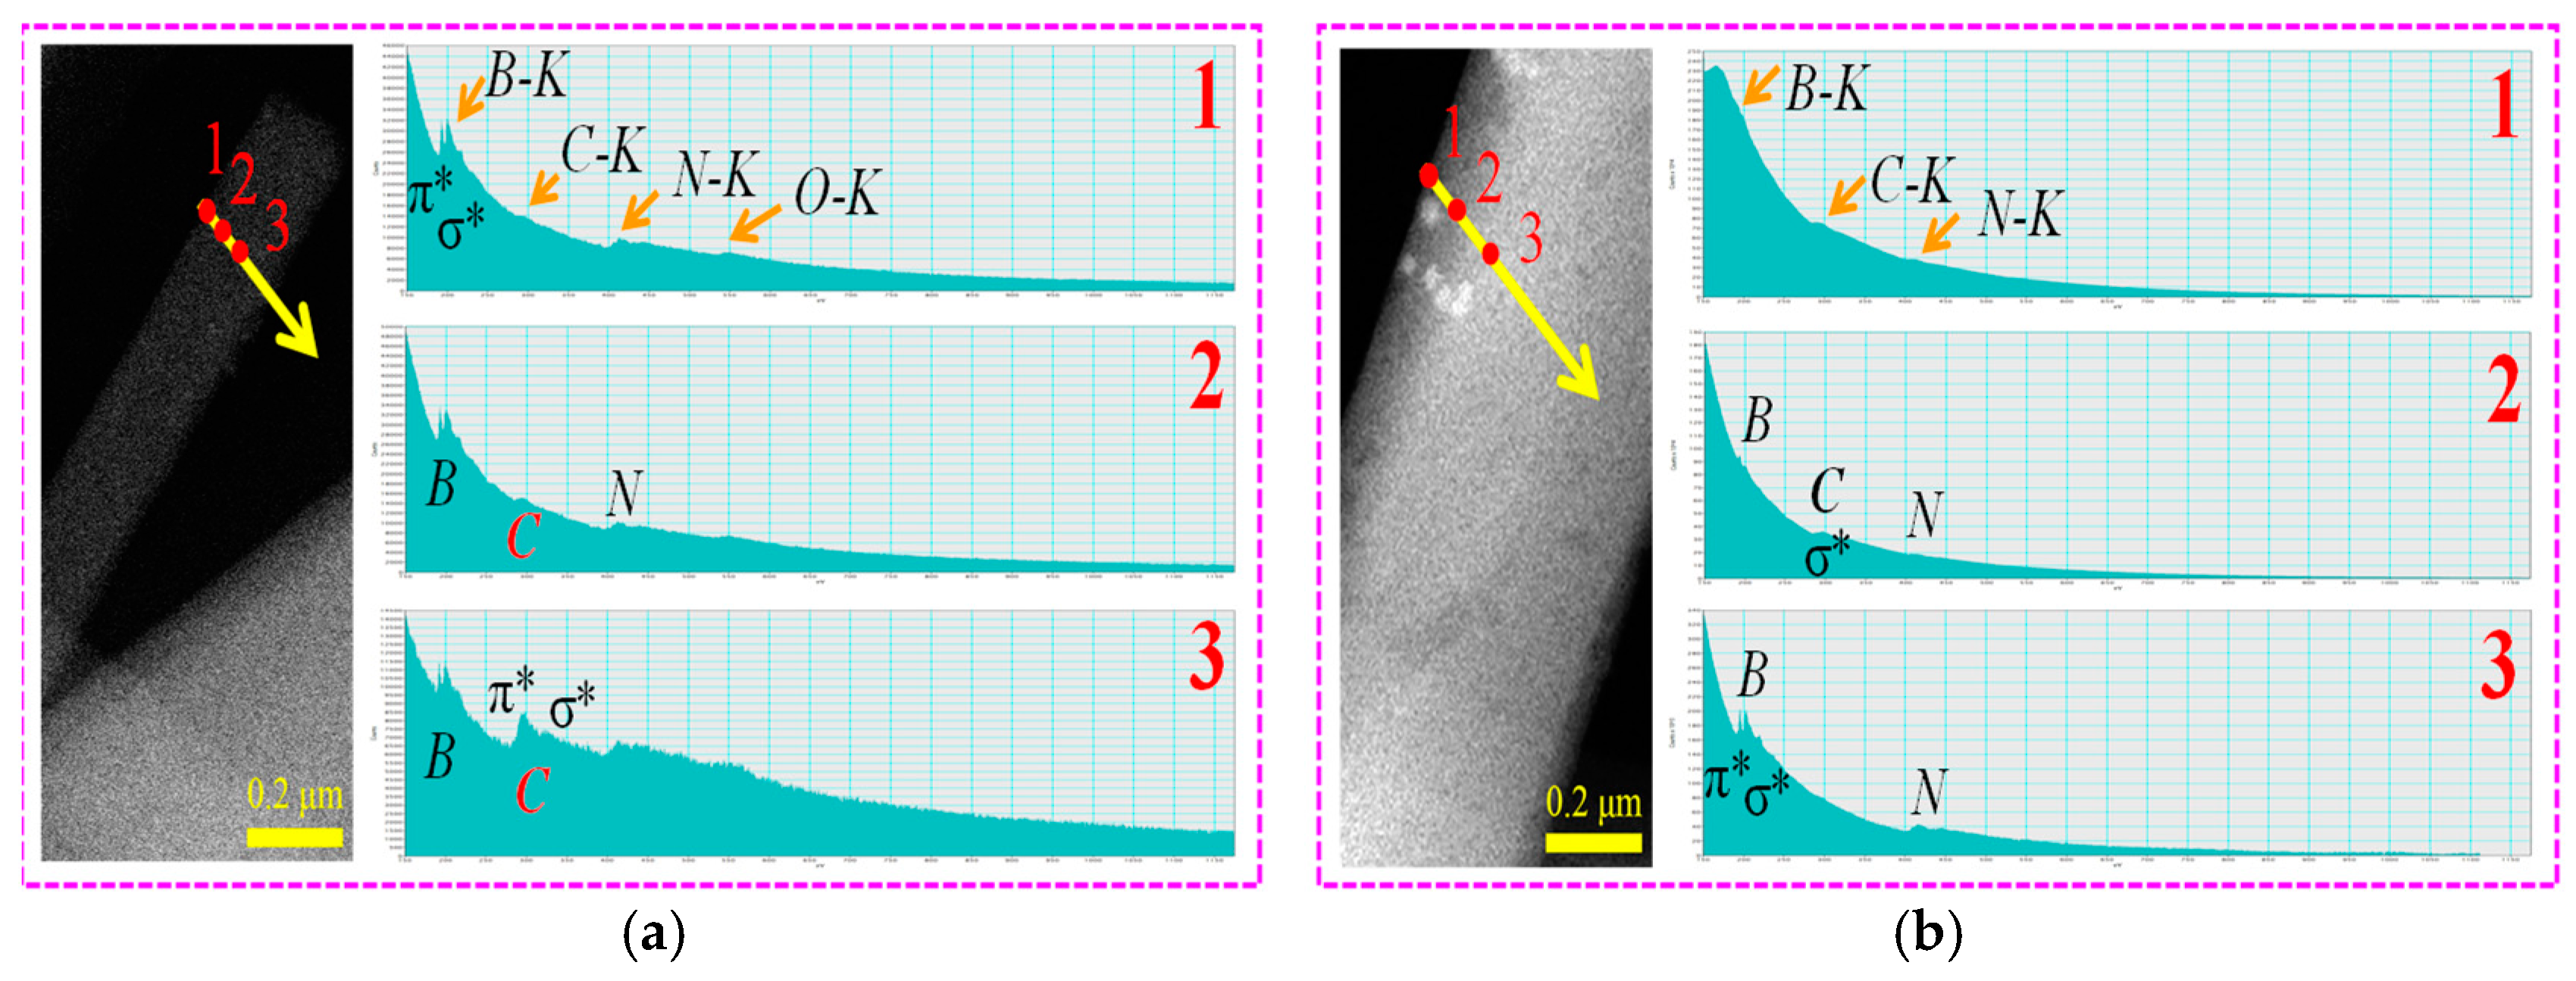
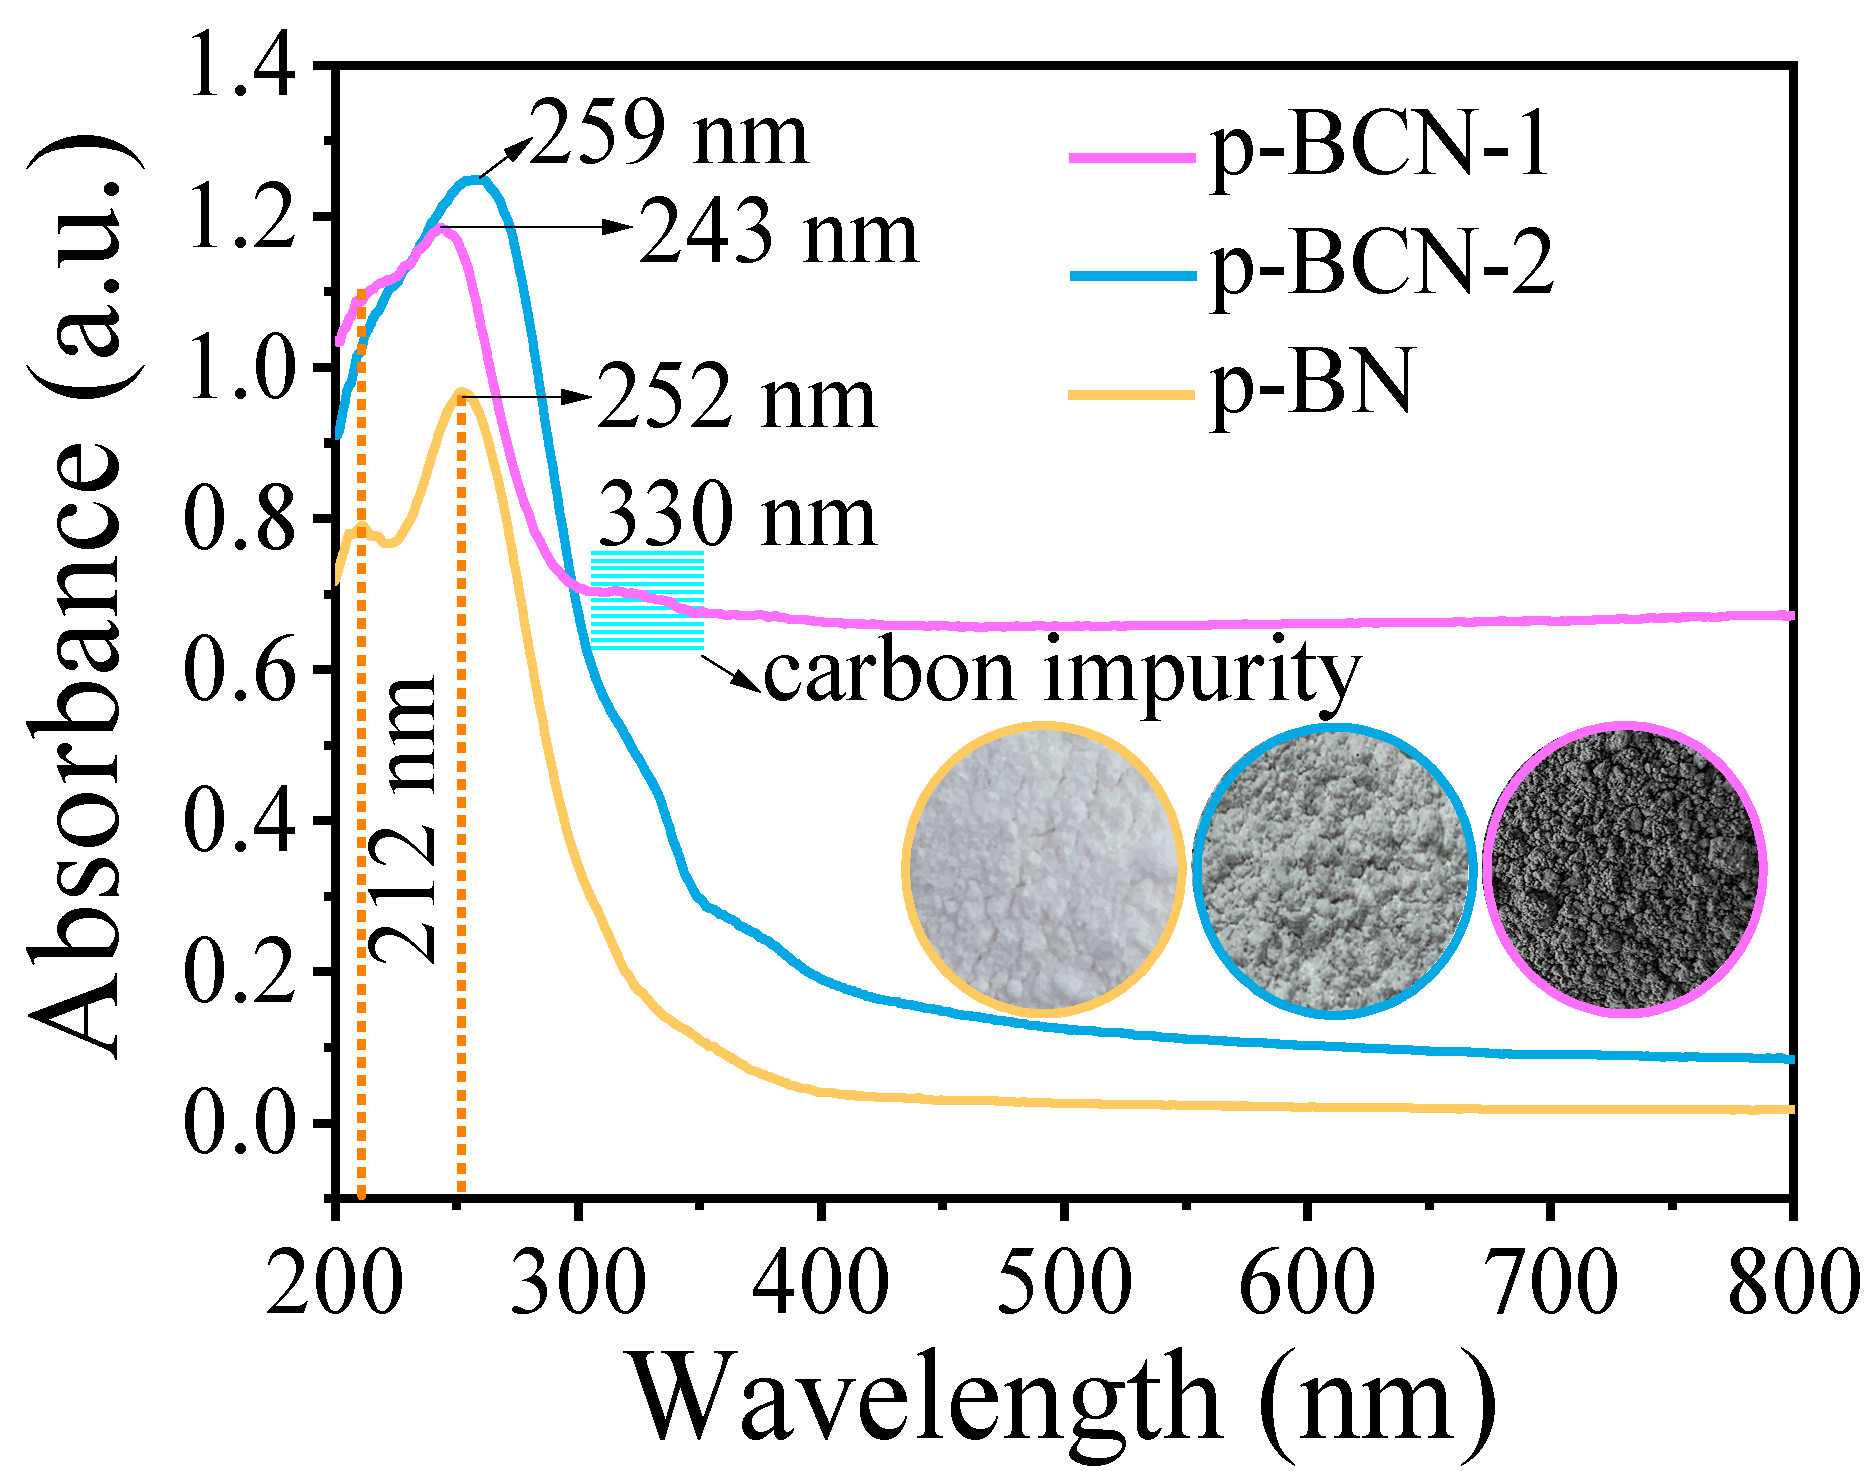
2.2. Characterization of p-BCN Photocatalysts

Figure 3a is a typical TEM image of the p-BCN-1 fibers with a diameter of 0.73 ± 0.40 μm (Figure S4a). It clearly discerns that the p-BCN-1 contained a high-density and uniform porous structure in sizes ranging from 10~20 nm (Figure S4b), which was similar to that of the p-BN (Figure S5a,b). The high-resolution TEM image (Figure 3b) presents the lattice fringes with a measured interspacing of 0.35 nm, accompanied by the selected area electron diffraction (SAED) pattern of the p-BCN-1 (inset of Figure 3a). It was found that the scarcely observed diffraction patterns suggested the poor crystallinity of the p-BCN-1. These results indicate that the p-BCN-1 had both a turbostratic and amorphous structure [12,25]. The p-BCN-2 displayed a non-uniform pore structure (Figure 3c) which was probably formed via bubbles blown by the gas released from the decomposition of the P2 precursor during calcination. Notably, the hexagonal phase (002) planes with a broader lattice fringe of 0.37 nm and the cubic phase (111) planes with a lattice fringe of 0.22 nm are clearly seen in Figure 3d, respectively [30]. It can be inferred that the composition and structure of P1 and P2 played an important role in the microstructure of the p-BCN. The p-BCN-1 and p-BCN-2 basically maintained the high porosity and amorphous structure of the p-BN, which facilitated the reactant diffusion and accommodated the linkage of the reactant transport channels to the catalytic active sites [31].
A N2 adsorption/desorption isotherm and the corresponding pore size distribution of the samples were performed, and the results are summarized in Table S4. It was clearly found that the p-BN, p-BCN-1, and p-BCN-2 all showed a type IV isotherm with an H4 hysteresis loop (Figure 4a). The rapid growth at a low p/p0 and the typical hysteresis loop observed at a higher p/p0 region proved the existence of micropores and mesopores [25,32]. It is noteworthy that the p-BCN-1 and p-BCN-2 exhibited a high Brunauer–Emmett–Teller (BET) surface area of 918 m2·g−1 and 730 m2·g−1, respectively, which can provide abundant active adsorption sites [33]. Furthermore, the characteristic pore sizes of the p-BCN-1 and p-BCN-2 were ca. 22 nm, accompanied by a decrease in the amount of micropores at ca. 2 nm (Figure 4b). Therefore, the morphology of the p-BCN slightly changed in comparison with that of the p-BN. However, their pore size distributions were changed significantly, which further shows that the chemistry of the P1 and P2 precursors had an effect on the structure of the p-BCN.
The X-ray diffraction (XRD) patterns of the samples are shown in Figure 5a. The diffraction peaks of the p-BN located at 25.6° and 42.9° can be ascribed to the (002) and (100) planes of the h-BN (PDF JCPDS No 34-0421), respectively. The p-BCN-1, obtained by P1 being calcinated at 900 °C, possessed the same crystal structure as the p-BN (Figure S6). The 2θ values of the (002) and (100) planes of the p-BCN-1 correspond to those of the p-BN, indicating that the basic characteristic structure of the h-BN was well maintained in the p-BCN-1 materials. The p-BCN-2 sample displayed a lower 2θ value of the (002) plane and a higher interlayer distance than those of the p-BN. These results confirmed that the precursor reconfiguration with the glucose had an effect on the crystal structure of the p-BCN. Figure 5b shows the Raman spectra of the p-BN, p-BCN-1, and p-BCN-2. Only one single peak at 1372 cm−1 was observed in the p-BN, assigned to the E2g mode vibration of the h-BN [34,35]. Two strong peaks centered at 1347 and 1595 cm−1 in the p-BCN-1 were observed. Because the E2g mode of the h-BN and the D band of the carbon were very close, we tended to think that the peak at 1347 cm−1 was the overlap of the above two peaks, and the peak at 1595 cm−1 can be ascribed to the G band of the carbon materials [36,37]. A red shift of the G band (1595 cm−1) in the p-BCN-1 was observed compared with the pure graphene (1580 cm−1), which originated from the structural distortion of the graphitic carbon with different bond lengths of B−N, C−B, and C−N [33]. The Raman peak located at 1855 cm−1 was related to the coalescence-inducing mode (CIM) vibration of the linear carbon chains, which could be detected in the carbon tube materials induced by the boron atoms [38]. The Raman spectrum of the p-BCN-1 also showed two bands at 2125 and 2283 cm−1, corresponding to the C−C and C−N symmetric stretching modes [39]. These results show that the C atoms were incorporated within the h-BN network. The peaks at 1595, 1855, 2125, and 2283 cm−1 in the p-BCN-1 were the same as those in the p-BCN-2. However, two weak peaks around 1083 cm−1 and 1306 cm−1 in the p-BCN-2 may be ascribed to the cubic BN (c-BN) [40], inferring that in addition to the hexagonal phase, a new cubic phase emerged in the p-BCN-2 due to the reaction of the boric acid with the terminal carbon C(4) and C(6) hydroxyl groups of the glucose in P2.
The FTIR spectra of the p-BN, p-BCN-1, and p-BCN-2 samples are shown in Figure 6. The FTIR spectra confirmed that the intrinsic structure of the BN could not be formed in the p-BCN-1 until the calcination temperature of P1 reached 900 °C (Figure S7). Compared with that of the p-BN, the position of the in-plane stretching band of the p-BCN-1 shifted from 792 cm−1 to 799 cm−1, while the out-of-plane B−N bending band shifted from 1380 cm−1 to 1388 cm−1, respectively (Figure 6a). It may be the disruption of the B−N−B bond by the C element due to the conjugative effect of the C−N−B bond [33,41] which lead to a vibration at a higher wavenumber. The position of the in-plane B−N stretching band of the p-BN was consistent with that of the p-BCN-2, while the peak assigned to the out-of-plane B−N bending band at 792 cm−1 for the p-BN blue shifted to 772 cm−1 for the p-BCN-2 (Figure 6b). Due to the typical overlap of the C–N with the B–N bands around 1100~1300 cm−1, the peaks assigned to the C–N bonds faded. The FTIR spectra of the p-BCN-2 also exhibited absorption at 2850 cm−1 and 2922 cm−1, which was assigned to C–H stretching vibrations [42], revealing the presence of an amorphous hydrogenated carbon (α-C:H) in the p-BCN-2. Those results probably led to the vibration of the in-plane B−N stretching bands at a lower wavenumber [43]. The possible chemical composition of the p-BCN-2 is illustrated in the inset of Figure 6b. Compared with the p-BCN-2, the sp3 amorphous hydrogenated carbon band assigned to the C–H stretching vibrations was not found in the p-BCN-1 (Figure S7). The sp2 hybridization of the carbon was in the p-BCN-1 while the sp3 was in the p-BCN-2. The broad bands of the samples ranging from 3100 cm−1 to 3450 cm−1 could be assigned to B−OH and B−NH2, indicating that there were the same B−OH and B−NH2 active groups in the p-BCN-1 and the p-BCN-2 as the p-BN.
The XPS spectra are shown in Figure 7. The B 1s spectra show, for both samples, two components centered at 189.9 eV and 190.8 eV, assigned to the sp2 of the B–C–N and B–N bonds (Figure 7a,b) [44]. The shoulder peak located at 192.1 eV corresponds to the edges or interfacial B atoms dangling bonds linked with –OH [45]. The deconvolution of the C 1s peaks shows that the p-BCN-1 exhibited a stronger preference of carbon to form new bonds with the B atoms than the p-BCN-2, as clearly observed from the intensity of the peaks at 284.1 eV assigned to C–B (Figure 7c,d) [8,11]. However, compared with the p-BCN-1 and p-BCN-2, for the deconvoluted spectra of the B 1s and C 1s, there were no B–C peaks in the p-BN (Figure S8a,b). Meanwhile, the presence of the B–C–N bonds suggests that hybridized atomic layers were formed in the p-BCN-1 and p-BCN-2. The relative atomic percentage calculated by the XPS data indicated that the contents of the B–N bonds were considerably higher than those of the B–C and C–N bonds (Table S5), indicating that the p-BCN-1 and p-BCN-2 retained the main structure of the p-BN.
Solid-state MAS NMR spectroscopy was employed to obtain a closer insight into the chemical environment of the p-BN, p-BCN-1, and p-BCN-2 (Figure 8). As displayed in Figure 8a, the 1H MAS NMR spectrum of the p-BN consisted of two distinct peaks centered at 6.9 and 4.1 ppm, which could be tentatively ascribed to –OH and –NH2 groups, respectively [46]. After the precursor reconfiguration with glucose, the 1H MAS NMR spectrum of the as-prepared p-BCN-1 showed three signal peaks; two peaks appeared at 6.7 and 4.9 ppm along with a small peak at 3.7 ppm. The signal at 3.7 ppm can be assigned to –NH2 groups. The signals at 6.7 and 4.9 ppm, similar to those of the p-BN, can be attributed to –OH and–NH2 groups due to the inductive effect stemming from the electronegativity of the C element [8]. When the N atoms in the BN were replaced by the C atoms, there were less electrons around the C–B–OH (6.7 ppm) bonds compared with those of the N–B–OH bonds in the BN. Similarly, after the B atoms in the BN were replaced by the C atoms, the electrons around C–NH2 (4.9 ppm) were much richer than the B–NH2 bonds in the BN. The only one peak that appeared at 6.9 ppm in the p-BCN-2 was assigned to the –OH group. Figure 8b shows the 11B MAS NMR spectra of the samples. There was a single main signal at 17.7 ppm assigned to B in trigonal coordination (turbostratic B3N3) due to the B element’s nature of sp2 hybridization in the p-BN, as already reported by Marchett’s group [47]. In addition, a small resonance at ca. −4.0 ppm was detected, indicating the presence of a small quantity of 4-coordinate boron (BO4) in the p-BN [47,48]. Compared with the p-BN, the 11B position of the p-BCN-1 shifted slightly (0.2 ppm), which was probably because a small amount of C atoms reduced the chemical shielding of the boron atoms in the 3-coordinate boron compounds. In other words, some N atoms in the BN domains were partly substituted by C atoms, leading to a change in the chemical environment of the p-BCN-1. However, the 11B spectrum of the p-BCN-2 showed mainly two signals at 16.6 ppm and 1.5 ppm, which correspond to the B in the h-BN and c-BN, respectively. This result indicates that both h-BN and c-BN were found in the p-BCN-2. The 13C MAS NMR spectra of the samples are displayed in Figure 8c. The peak at ca. 158 ppm was assigned to the sp2 C–N bonds, which originated from C3N3 rings with a similar electron density [49] and were also detected in the p-BCN-1 and p-BCN-2. This may have been because there were still parts of the carbon atoms from the melamine remaining in the samples [50]. The new peaks centered at 187.9 and 176.8 ppm were detected in the p-BCN-1 and p-BCN-2, respectively, which could account for the sp2 B–C bonds [51]. The presence of the h-BN and c-BN phases in the p-BCN-2 can be connected with the difference in the chemical shift of the B–C bonds between the p-BCN-1 and p-BCN-2. It was also further confirmed that the C atoms were doped into the BN for the p-BCN, providing insights into the chemical bonding scheme within the two p-BCN materials. According to the above results, an illustration of the as-synthesized p-BCN-1 and p-BCN-2 is exhibited in Figure 8d.
XPS and NMR have often been used to validate the C doping of BCN, but the location of the C species on the plane has been vaguely described [8]. Herein, electron energy loss spectroscopy (EELS) was employed to probe the location of the C species in the p-BCN (Figure 9) since the light elements (B, C, N, and O) in p-BCN can be detected by EELS with the same resolution as TEM. The EELS of the p-BCN-1 obviously exhibited four distinct absorption peaks located at ~195, 295, 414, and 533 eV, which corresponds to the K-shell ionization edges of boron, carbon, nitrogen, and oxygen elements, respectively (Figure 9a). The sharp doublet of the 1s–π* and 1s–σ* K edges of the B and N are in accordance with those of the h-BN, which are characteristic peaks for the sp2 hybridized B−N bonds, confirming that the intrinsic hexagonal structure of the h-BN still remained in the p-BCN-1 [8,52]. The C–K peak of the p-BCN-1 at ~295 eV in areas one, two, and three were observed, and the peak intensity along the edges of the p-BCN-1 was weak. However, the closer the area was to the center, the stronger the C–K peak intensity was. In addition, the signal C–K (π*) and C–K (σ*) also demonstrated rather perfect sp2 bonding with the B and N for the C positions [8], confirming the introduction of C dopants into the BN lattice. The EELS of the p-BCN-2 obviously exhibited three distinct absorption peaks located at ~195, 295, and 414 eV, which correspond to the K-shell ionization edges of the boron, carbon, and nitrogen elements, respectively, and no O–K peak was detected (Figure 9b). The C–K peak of the p-BCN-2 at ~295 eV only in areas one and two were observed. The C–K peak intensity along the edges of the p-BCN-2 was strong. However, the closer the area was to the center, the weaker the C–K peak intensity was. The signal C–K (σ*) demonstrated an sp3 hybridization with the B and N for the C positions, which is consistent with the FTIR analysis. The 1s–π* and 1s–σ* peaks corresponding to the B–K edge and N–K edge in area three confirmed that the intrinsic hexagonal structure of the h-BN still remained in the p-BCN-2. Based on the results, the structures of the p-BCN-1 and p-BCN-2 changed dramatically, which is attributed to the unique structures of the P1 and P2 precursors.
The UV–vis diffuse reflectance spectrum (DRS) of the as-prepared p-BN, p-BCN-1, and p-BCN-2 are shown in Figure 10. The obvious color variation of these samples corresponds to the absorbance curves (inset of Figure 10). It was observed that the p-BN sample was white and so nearly 100% transmittance throughout visible spectra occurred. The p-BCN-1 was dark gray and had enhanced absorption throughout the visible spectra by the modification of carbon atoms (Figure S9). The color of the p-BCN-2 was a mixture of white and dark grey; the absorption intensity was only slightly broadened compared with that of the p-BN. The absorption peak at 212 nm is attributed to the band gap transition absorption of the h-BN phase in the p-BN, which disappeared in the p-BCN-1 and p-BCN-2, indicating that bonding occurred among the B, C, and N atoms. Compared with the peak at 252 nm in the p-BN, the broad absorption peak at 243 nm in the p-BCN-1 and at 259 nm in the p-BCN-2 were observed, which can be attributed to the resonant exciton effects due to the π-π* transition that occurred for the samples [42]. Moreover, a new absorption peak appeared at 330 nm in the p-BCN-1, which is associated with defects such as vacancies and impurities [53].
As calculated by the Tauc plot method from the DRS spectra and the VB values (Figure S10), the energy levels (Figure S11) show that the bandgaps of the p-BCN-1 and p-BCN-2 narrowed with the addition of the C atoms from 3.57 eV of the p-BN to 2.97 eV and 3.28 eV. Considering that the electronegativity of the C element was lower than the N element but higher than the B element, the dopant atoms underwent a charge transfer with the atoms through the B–C and N–C bonds, which in turn altered their electronic structure [54,55]. Furthermore, as shown in Figure 11a, the higher transient photocurrent response was observed for the p-BCN-1 and p-BCN-2 in contrast to the p-BN. This result demonstrated the more efficient separation of the photogenerated electron holes at the p-BCN interface, owing to the donation of the carbon doping in the p-BCN [7]. The electrochemical impedance spectroscopy (EIS) in Figure 11b displayed that the p-BCN-1 and p-BCN-2 composites exhibited a much smaller diameter of the semicircular Nyquist plots compared with that of the p-BN, revealing that the decreased electron transfer resistance in the p-BCN-1 and p-BCN-2 could effectively promote the interface charge transport compared with the p-BN.

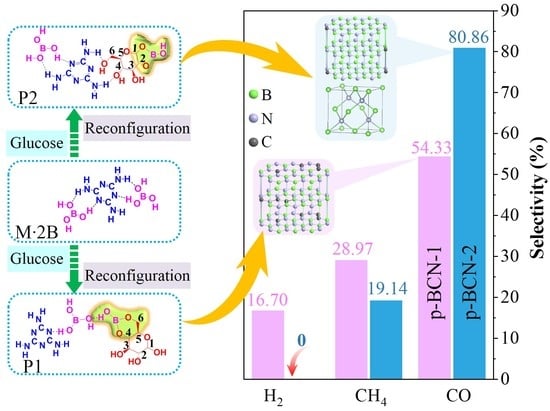
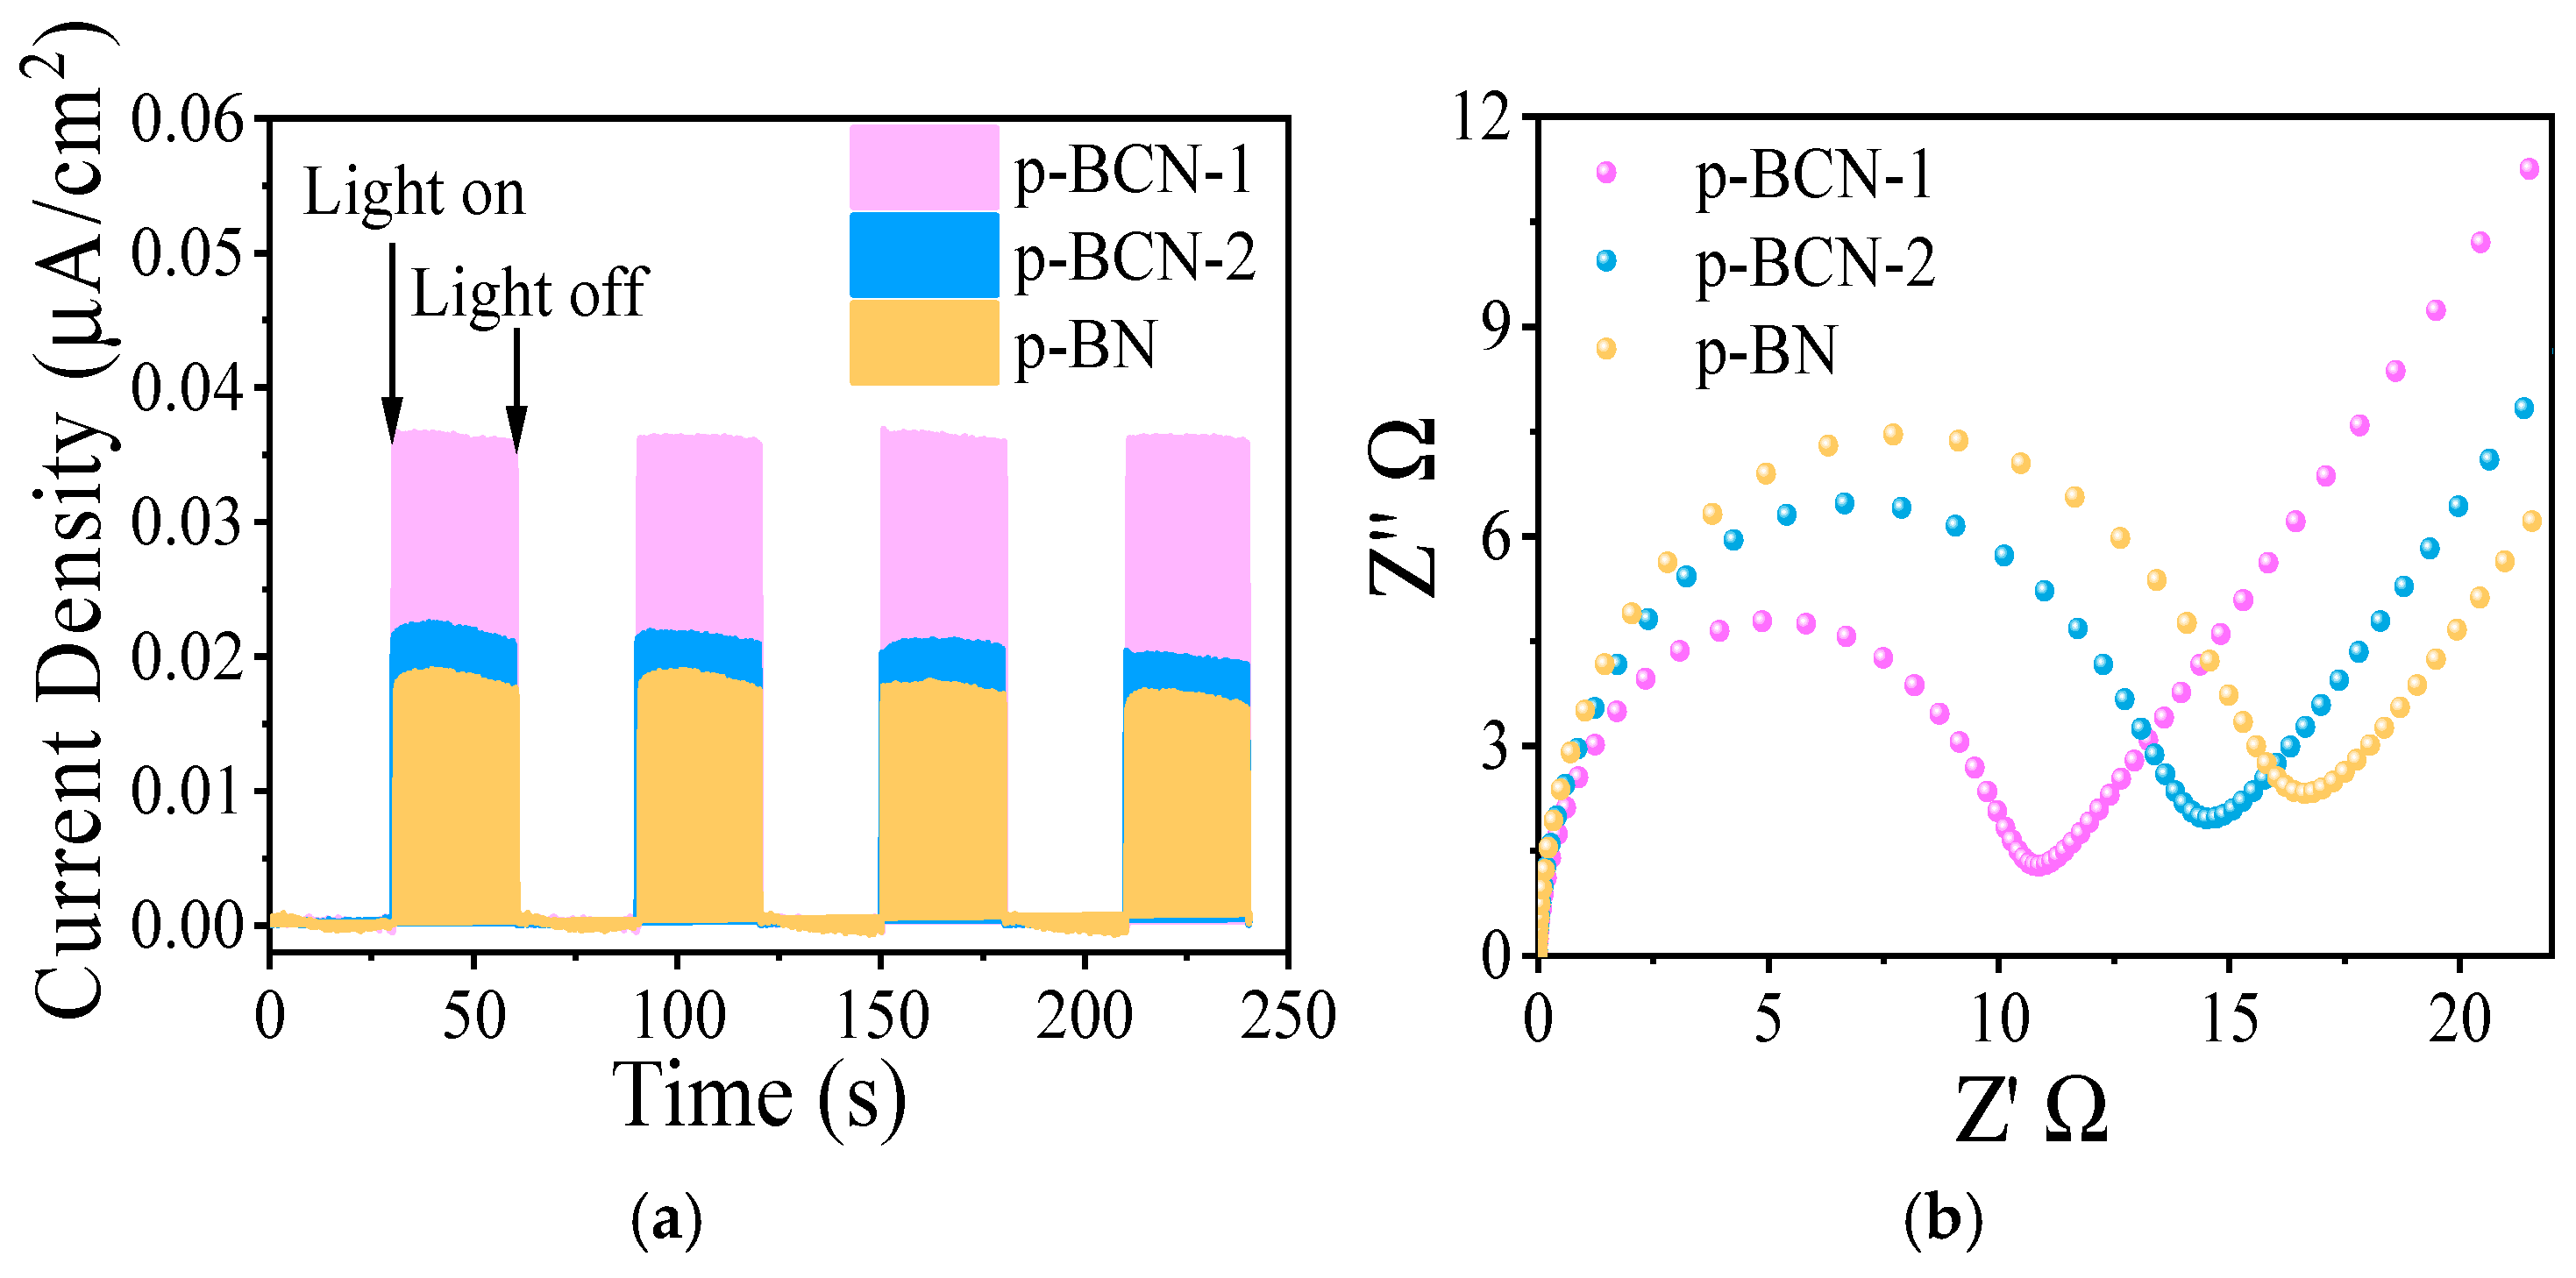
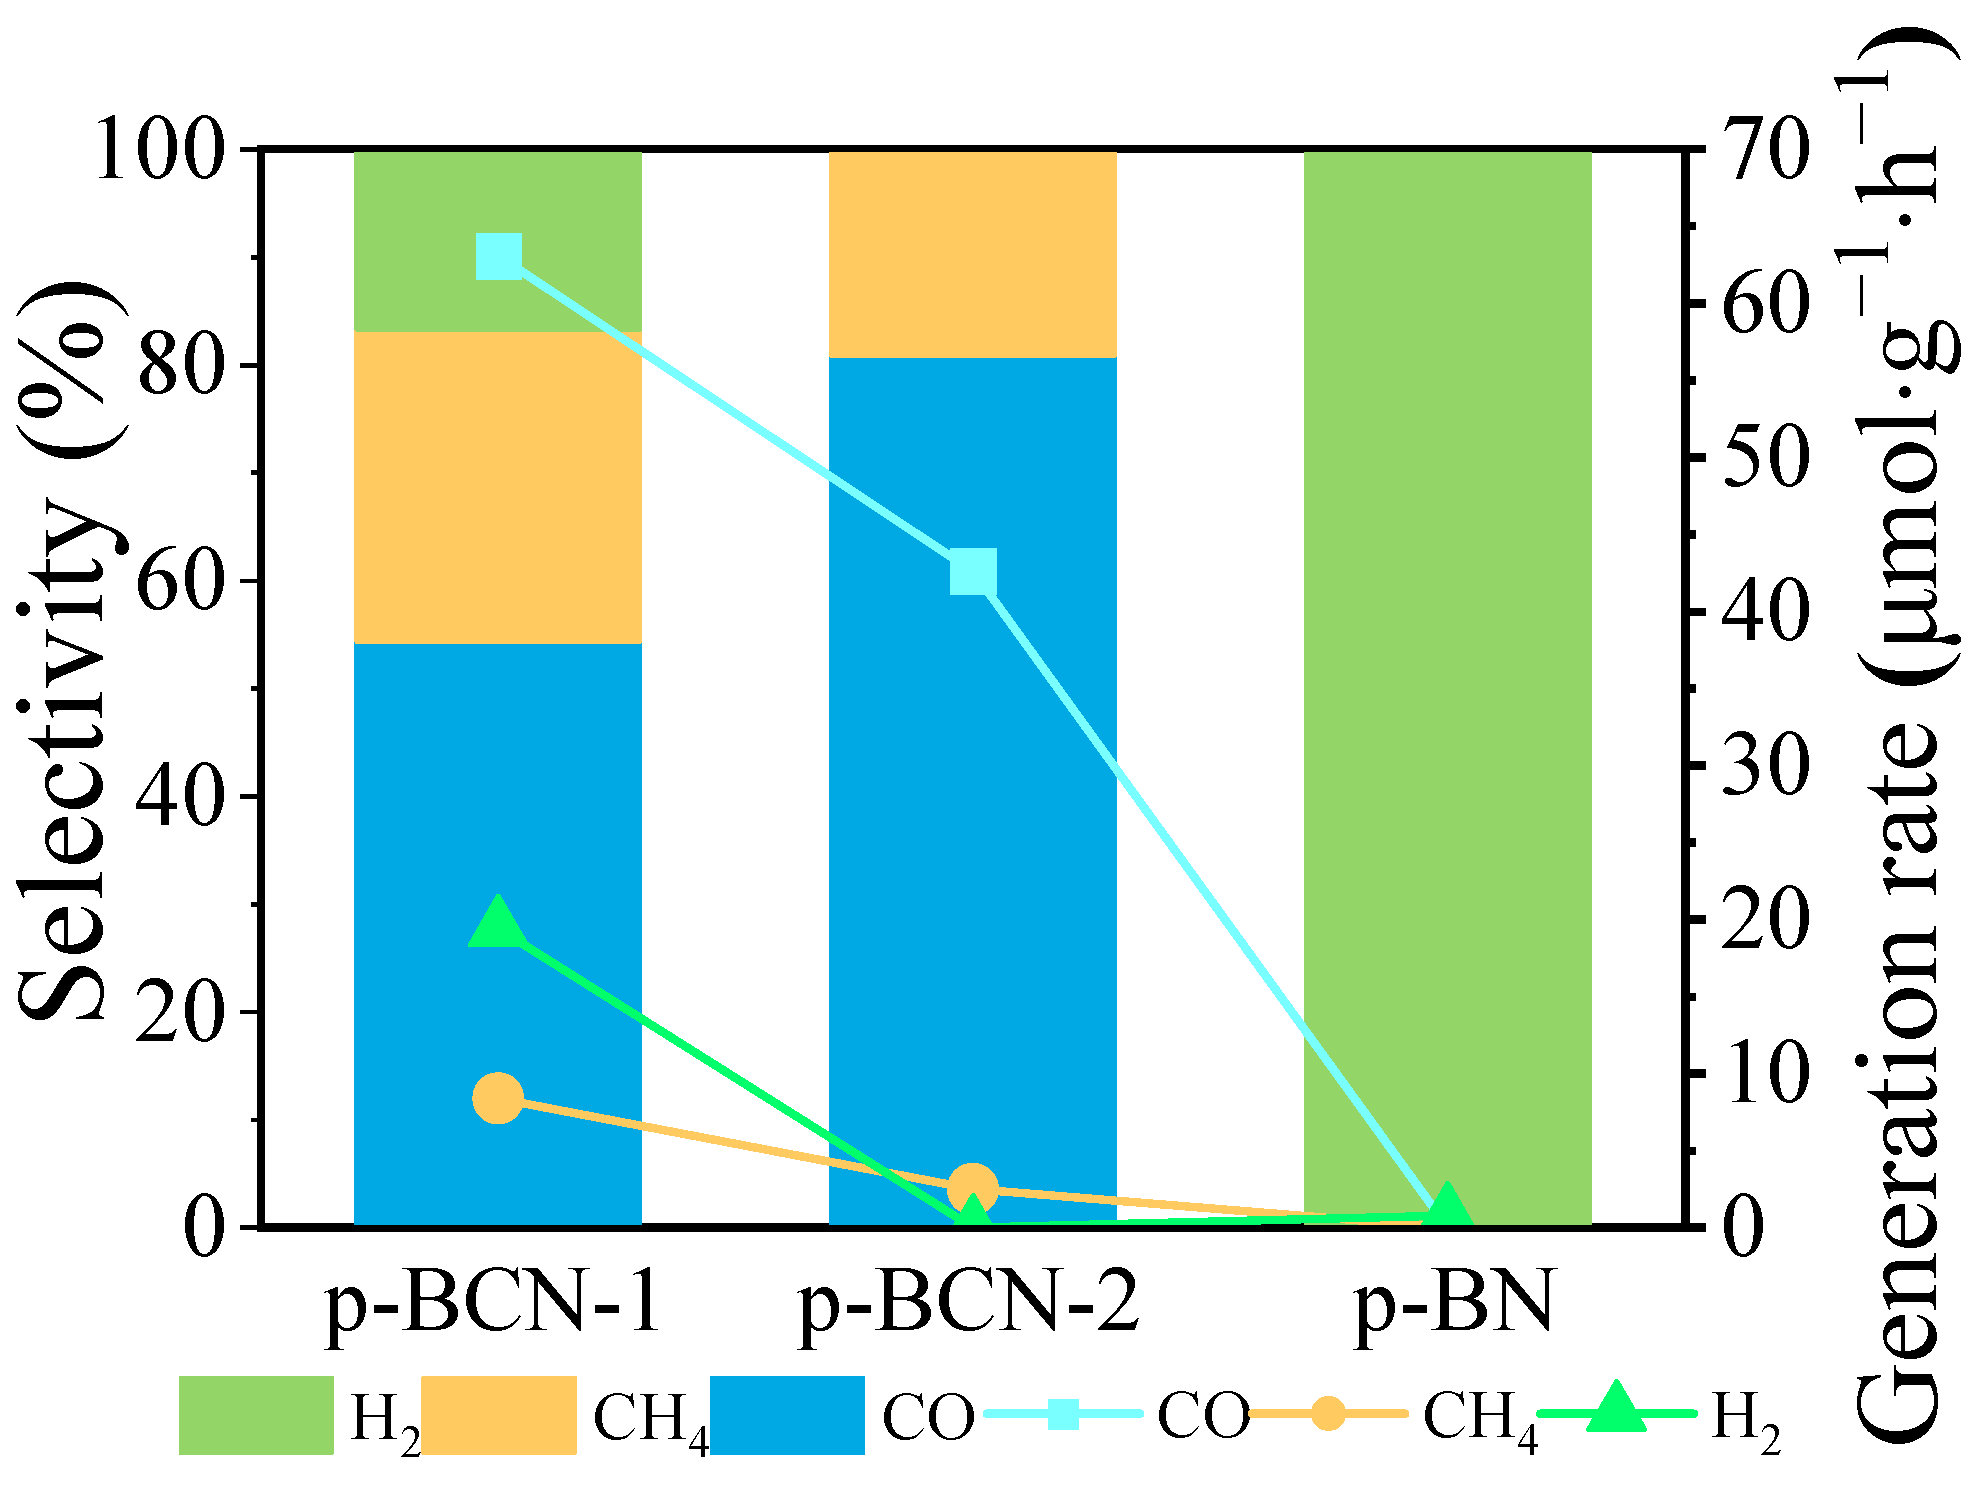
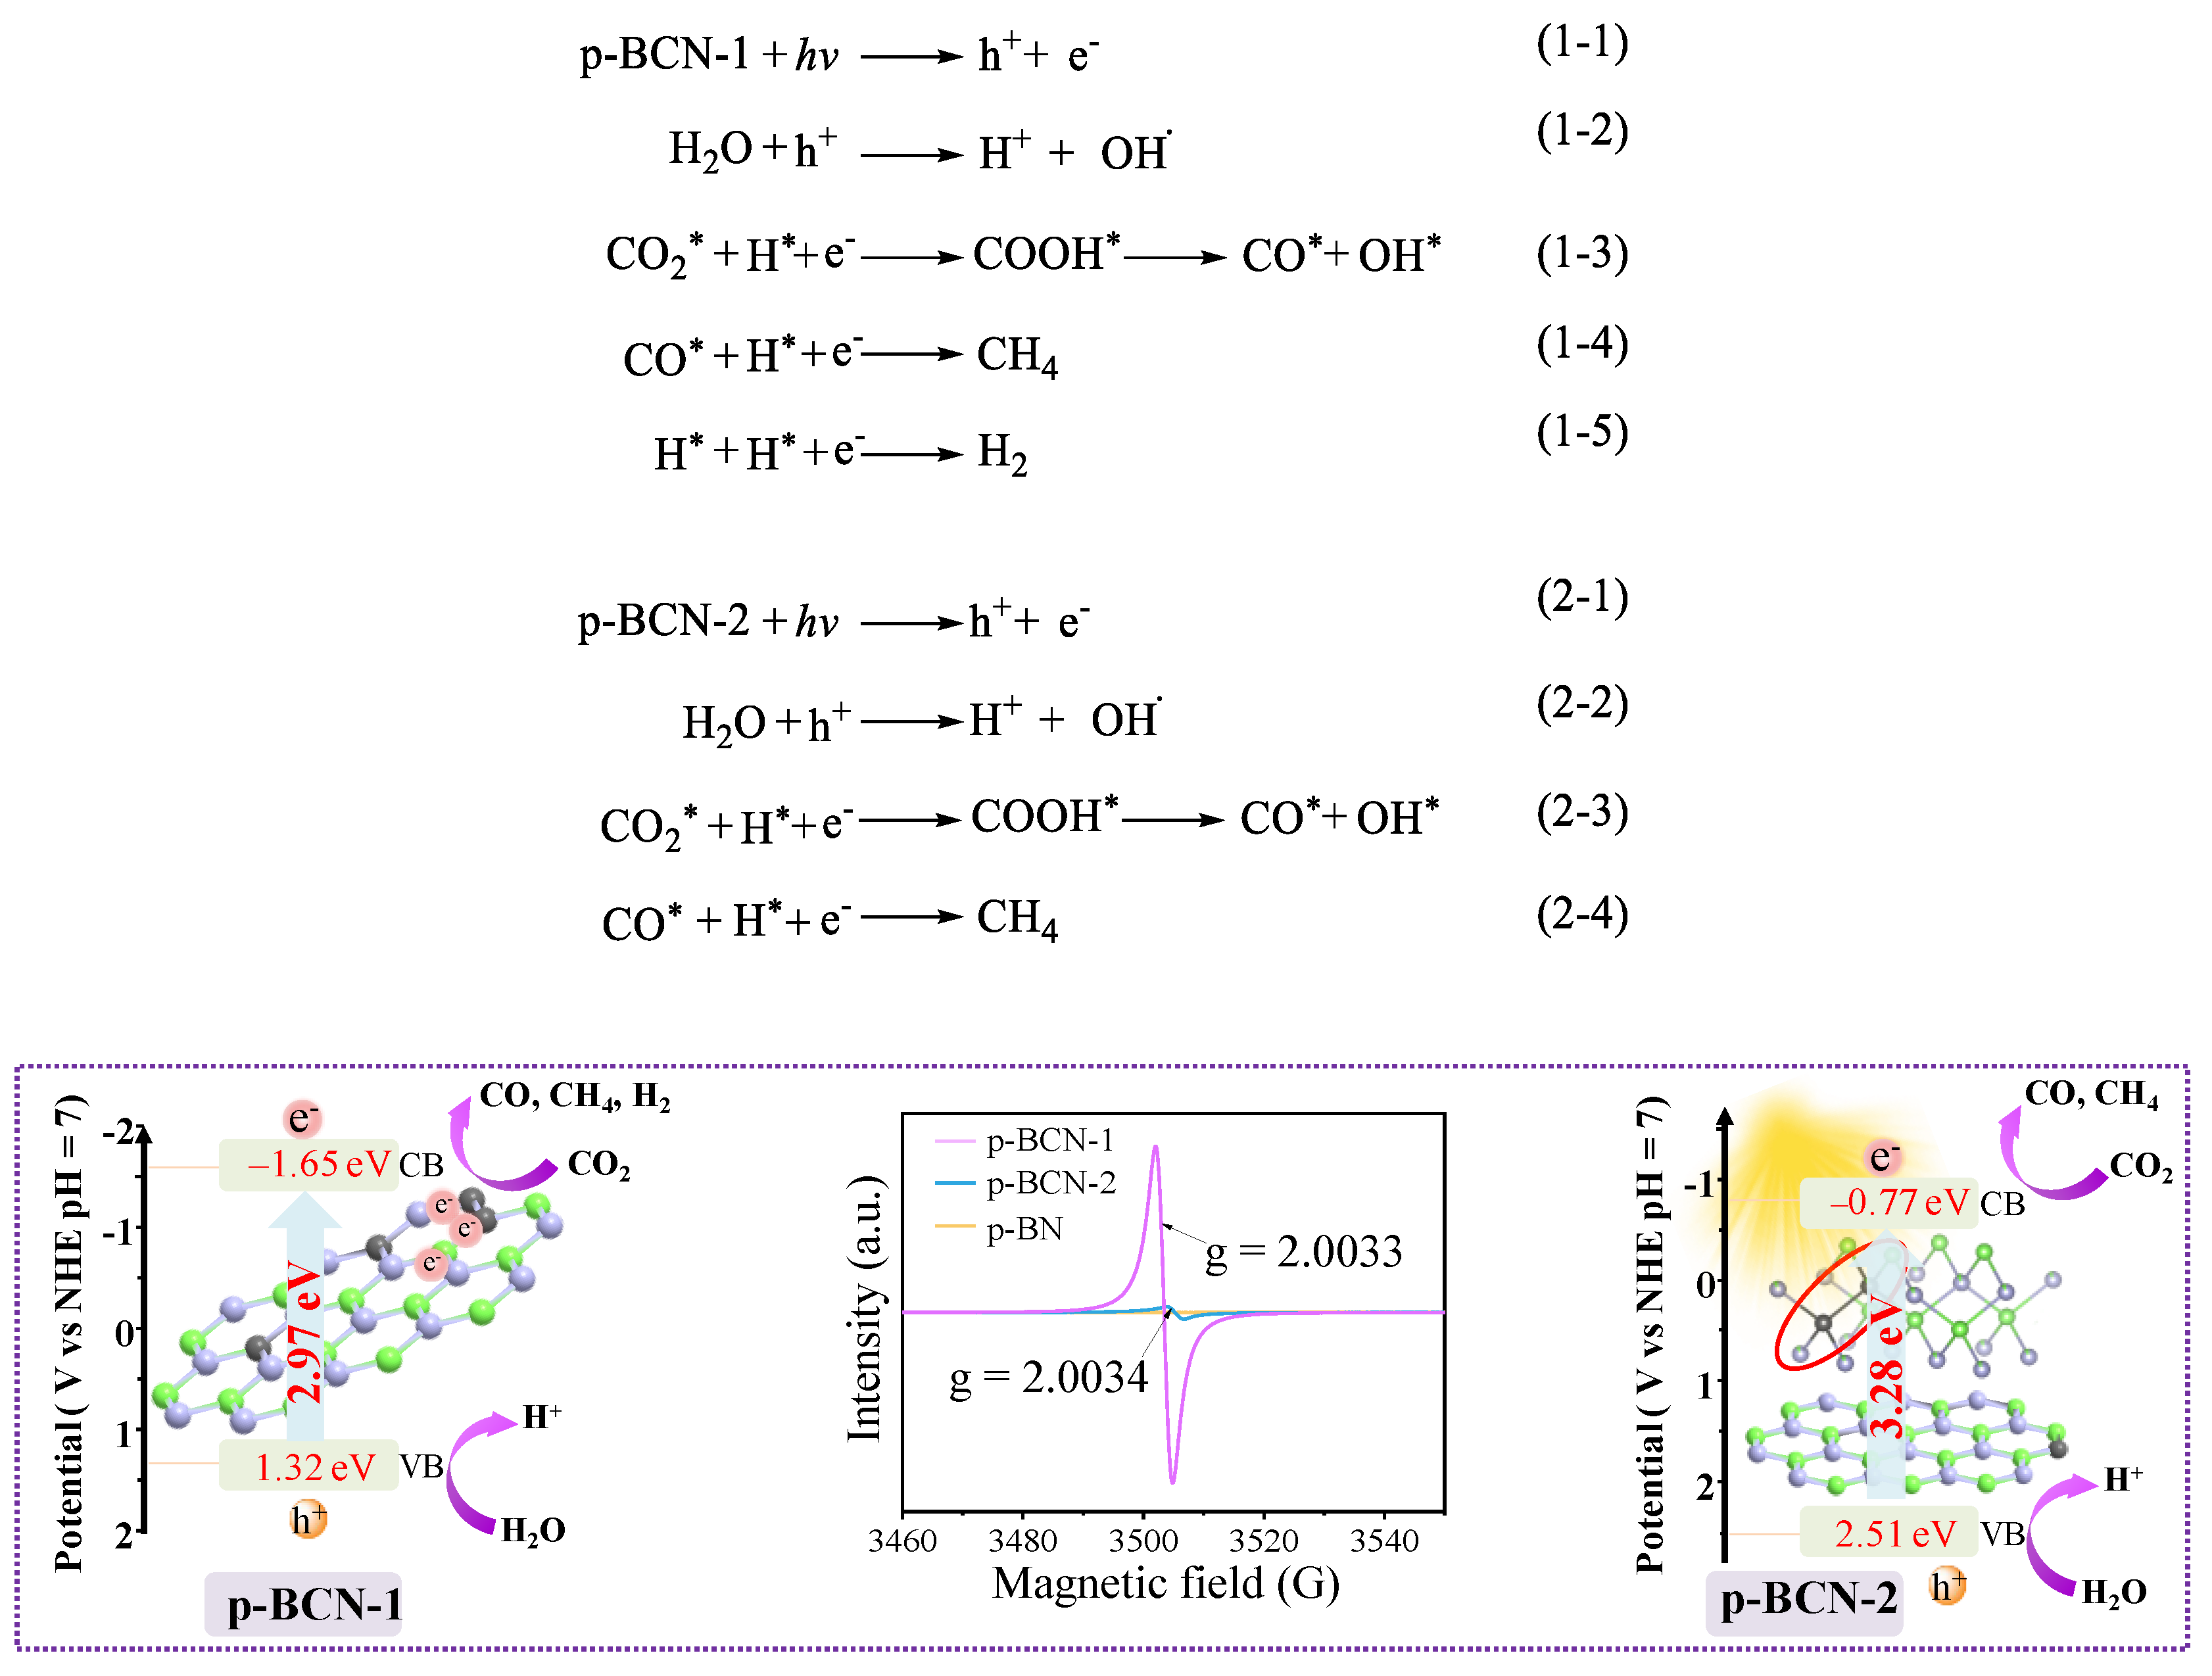
2.3. Photocatalytic CO2 Reduction Performance of p-BCN

The photocatalytic CO2 reduction performances of the p-BN, p-BCN-1, and p-BCN-2 were studied as displayed in Figure 12 and Figure S12. The p-BN sample exhibited a very poor photocatalytic performance of a CO2 reduction reaction with a H2 generation rate of 0.78 μmol·g−1·h−1, and H2 was the only product. However, for the p-BCN-1, the products included not only 69.4% CO but also 21.4% H2 and 9.2% CH4, and their generation rates were 63.1 μmol·g−1·h1, 19.4 μmol·g−1·h−1, and 8.4 μmol·g−1·h−1, respectively. Remarkably, CO instead of H2 became the main product of the CO2 conversion. The selectivity of the CO, CH4, and H2 was 54.33%, 28.97%, and 16.70%, respectively, which means that CO2 was more likely to reduce into CO than CH4 and H2. With the coexistence of the two-phase structure in the p-BCN-2, the products of the CO2 reduction reaction were 94.4% CO and 5.60% CH4 over the p-BCN-2, and their generation rates were 42.6 and 2.52 μmol·g−1·h−1, respectively. Moreover, no H2 products were observed. The selectivity of the p-BCN-2 for CO was improved significantly (80.86% for p-BCN-2 and 54.33% for p-BCN-1, Figure 12), indicating that the p-BCN-2 had a higher catalytic selectivity for CO2 reduction to CO in comparison with the p-BCN-1. Meanwhile, as shown in Table 1, the photocatalytic CO2 reduction performances of the p-BCN-1 and p-BCN-2 were significantly higher than those of equivalent materials or other noble metals-loaded nanohybrids reported in the literature. These results indicate that the formation of p-BCN-1 with a hexagonal (h) type can significantly promote CO2 conversion, while the formation of p-BCN-2 with an h type and cubic (c) type can not only improve CO2 conversion, but also remarkably improve the CO selectivity.
Based on the above characterization and analysis results, as shown in Figure 13, p-BCN with different crystal structures can be prepared by regulating the recrystallization conditions of the homogeneous precursor solution. Condition (I): The P1 precursor was prepared when boric acid reacted with both melamine and the hydroxyl groups on the C(1) and C(2) of glucose according to cooling in bath ice. The resultant p-BCN-1 sample with a homogeneous h-type crystal was successfully developed by the calcination of P1. Condition (II): The P2 precursor was prepared when boric acid reacted with both melamine and the hydroxyl groups on the C(4) and C(6) of glucose according to natural cooling. A p-BCN-2 sample with an h-type and c-type coexistent crystal was developed by the calcination of P2. Furthermore, the differences between P1 and P2 were found to be directly correlated with the photocatalytic performance of the p-BCN.
A Strong Electron paramagnetic resonance (EPR) signal was detected at a magnetic field of ~3503 G with a calculated g-value of 2.0033 in the p-BCN-1 and 2.0034 in the p-BCN-2 (Figure 14). This implies the presence of free electrons along with the substitution of B or N with C atoms in a BN lattice in the p-BCN and an increase in the density state of conduction band electrons from the electron donation by C atoms [7,60]. The N atom had one extra electron in comparison with the substituted C atom, which resulted in the presence of unpaired electrons after the in-plane bonding with the B atoms in the p-BCN. The free electrons promoted electron separation to improve photocatalytic CO2 reduction activity. As a comparison, no such resonance peak was observed for the p-BN. In addition, the difference in the photocatalytic activity and selectivity between the p-BCN-1 and p-BCN-2 under simulated solar irradiation depends on the energy band structure [61]. It was reported that the required energy for the conversion of CO2 into CO, CH4, and H2 production is −0.52 eV, −0.24 eV, and −0.41 eV (vs. NHE), respectively [62,63]. The main factors influencing the selectivity of photocatalytic CO2 reduction reactions include light-excitation attributes, band structures, charge separation efficiencies, and so on. Here, the position of the CB of the p-BCN-1 (−1.65 eV) was more negative than that of the p-BCN-2 (−0.77 eV), resulting in the p-BCN-1 having a higher reduction potential to drive charge transfer. Moreover, the band gap of the p-BCN-1 (2.97 eV) was narrower than that of the p-BCN-2 (3.28 eV), making the p-BCN-1 absorb a wider wavelength of light and produce more photogenerated electrons. Additionally, more free electrons caused by C doping in the p-BCN-1 improved the charge separation efficiency. Therefore, the higher surface density of the photogenerated electrons in the p-BCN-1 was more conducive to the occurrence of CO2 reduction reactions, producing higher reduced state products. When the p-BCN-1 and p-BCN-2 photocatalysts were excited by the same incident light, on one hand, the faster and more photogenerated electrons transfer made a more complete reduction reaction in the p-BCN-1, while on the other hand, the greater energy level difference between the CB of the p-BCN-1 and the reduction potential of the reaction product (CO, CH4, and H2) provided a stronger driving force for the charge transfer between them. However, there were not enough electrons in the p-BCN-2 to reduce the H+ to H2 and to, in turn, improve the selectivity of the CO. As a result, photocatalytic performance tests indicated that the CO and CH4 production yields of the p-BCN-1 were significantly higher than those of the p-BCN-2, but the selectivity of the CO of the p-BCN-1 was lower than that of the p-BCN-2. Furthermore, the p-BCN provided a high surface area for CO2 adsorption and abundant active sites at the edges of the p-BCN for the reduction reaction. A possible photocatalytic CO2 reduction mechanism of the p-BCN photocatalysts was proposed and is shown in Figure 14. “*” is the adsorption state at the surface of the photocatalysts. The surfaces of the catalysts adsorbed the CO2 molecules. Firstly, the p-BCN-1 effectively absorbed the UV–vis light and generated electron holes. Secondly, the holes on the VB of the p-BCN-1 oxidized H2O to generate OH and protons (H+). Thirdly, CO2* reacted with photogenerated electrons and H+ to reduce into CO*. Fourthly, CO* combined with photogenerated electrons and H+ to form CH4. Lastly, the photogenerated electrons and H+ were further reduced to H2. The process of the photocatalytic reduction of the CO2 of the p-BCN-2 is similar to that of the p-BCN-1. However, there were not enough photogenerated electrons in the p-BCN-2 to reduce H+ to H2. Therefore, H+ could not be reduced to H2. Furthermore, the catalytic performance and selectivity of the CO2 reduction of the p-BCN were also correlated with its phase structure, which will be the focus of our future research.

3. Materials and Methods

3.1. Materials

Melamine (M), boric acid (B), and D-glucose (G) were obtained from Shanghai Aladdin Biochemical Technology Co., Ltd., Shanghai, China. All chemicals were used as received without further purification. Deionized water was used in the experiment.

3.2. Synthesis of C-Doped BN (p-BCN)

The p-BCN samples were prepared by a two-step-synthesis method using melamine, boric acid, and glucose as the source materials, which is based on the previous preparation method of p-BNNS [25]. Firstly, the solution was prepared at 95 °C upon mixing 18.92 g of melamine (M, N source), 18.55 g of boric acid (B, B source), and 13.5 g of D-glucose (G, C source) in 1000 mL deionized water. Subsequently, the transparent and homogeneous solution was heated at 90 °C for 6 h. The mixture precursor solution was labeled as M·2B·G. The solid precursor named P1 was obtained by the prompt recrystallization from the homogeneous solution in an ice bath (Figures S13 and S14a) then was filtered and dried at 70 °C for 24 h. Secondly, P1 was pyrolyzed at 300 °C for 1 h, 550 °C for 1 h, and 900 °C for 2 h under a N2 atmosphere (a heat rate of 2 °C·min−1) to obtain a sample named p-BCN-1. Meanwhile, the solid precursor named P2 was obtained by recrystallization from the homogeneous solution via natural cooling to room temperature (Figures S13 and S14b). The p-BCN-2 was prepared by calcining P2 under the same conditions. Figure 15 and Figure S13 describe the preparation process of the p-BCN-1 and p-BCN-2 samples by different cooling modes. As a comparison, when the glucose was removed, the p-BN sample was further prepared by calcining the M·2B precursor under the same condition as P2.

4. Conclusions

In summary, p-BCN photocatalysts were synthesized by the pyrolysis of new precursors prepared by the recrystallization of a homogeneous solution with M·2B and glucose. This experimental study suggests that the two precursors were obtained from the reactions between boric acid and specific hydroxyl groups (on anomeric carbons C(1) and C(2) or on terminal carbons C(4) and C(6)) of glucose during the recrystallization of the homogeneous solution. The chemical composition and structure of the precursors could be remarkably changed by adjusting the recrystallization conditions of the homogeneous solution, leading to the resultant p-BCN products with distinctly different structures and properties. The resultant p-BCN-1 sample with a homogeneous h-type crystal and a p-BCN-2 sample with an h-type and c-type crystal exhibited excellent photocatalytic activity and high selectivity for CO2 conversion, respectively, accompanying with the changes in the structure and properties of the p-BCN, such as narrowing the band gap, broadening the range of visible light absorption, promoting the interface charge transport, and efficiently separating photo-generated electron holes. This work provides a novel strategy to modulate precursors to design and develop BN-based materials with superior performance and to broaden the potential applications of BN-based materials.

Supplementary Materials

The following supporting information can be downloaded at: www.mdpi.com/article/10.3390/catal12050555/s1, Experimental details for the apparatus and characterization, and photocatalytic performance test for CO2 reduction. Table S1. Crystal data and structure refinement for M·2B; Figure S1. Arrangements of melamine and boric acid molecules in the crystal of M·2B; Figure S2. (a) Raman and FTIR spectra of M·2B (black line), P1 (red line), and P2 (blue line): (b) in the 500~4000 cm−1 region: (c) in the 3000~3600 cm−1 region; Table S2. Spectral data (cm−1) and band assignments of M∙2B, P1 and P2; Table S3. Chemical shifts of 13C of glucose, P1, and P2; Figure S3. TGA thermograms of M·2B, P1 and P2 samples: (a) from 40 to 1000 °C in N2; (b) from 40 to 300 °C in N2; and (c) DSC curves of M·2B, P1, and P2 samples from 40 °C to 1000 °C in N2; Figure S4. (a) The SEM image of p-BCN-1, inset: the diameter distribution histogram. (b) HRTEM image of p-BCN-1; Figure S5. Morphologies of the p-BN: (a) TEM (scale bar: 500 nm); (b) HRTEM (scale bar: 10 nm); and (c) Measured the layer distance of the red rectangle of (b); Table S4. Physical and textural properties of p-BN, p-BCN-1, and p-BCN-2; Figure S6. Powder XRD patterns of calcined product p-BCN-1 of the P1 at different temperatures; Figure S7. FTIR spectra of the calcined product p-BCN-1 of P1 at different temperatures; Figure S8. XPS high-resolved spectra of p-BN, (a) B 1s and (b) C 1s; Table S5. The peak position and relative atomic percentage of various functional groups in p-BN, p-BCN-1, and p-BCN-2 samples; Figure S9. UV–vis diffuse reflectance spectra of the calcined product p-BCN-1 of P1 at different temperatures; Figure S10. (a) Plots of ε0.5/λ versus 1/λ based on the optical absorption data from p-BN, p-BCN-1, and p-BCN-2 samples, respectively. VB-XPS spectra of (b) p-BN, (c) p-BCN-1, and (d) p-BCN-2; Figure S11. Schematic illustration of the band structures of p-BN, p-BCN-1, and p-BCN-2 samples; Figure S12. Photocatalytic activities over the p-BN, p-BCN-1, and p-BCN-2 samples: (a) CO production, (b) H2 production, and (c) CH4 production; Figure S13. Photographic synthesis of the p-BCN samples by two different cooling modes; Figure S14. Cooling curves of (a) P1 and (b) P2. [18,20,33,61,64]

Author Contributions

Conceptualization, Q.L. (Qiong Lu), J.A., Y.D., Q.L. (Qingzhi Luo), C.T. and D.W.; data curation, Q.L. (Qiong Lu); investigation, Q.L. (Qiong Lu); methodology, Q.L. (Qiong Lu), J.A., Y.D., Q.L. (Qingzhi Luo), Y.S., C.T. and D.W.; resources, Q.L. (Qingzhi Luo), Q.L. (Qiunan Liu), Y.T., J.H. and R.Y.; writing—original draft, Q.L. (Qiong Lu); writing—review and editing, Q.L. (Qiong Lu), J.A., Y.D., C.T. and D.W. All authors have read and agreed to the published version of the manuscript.

Funding

This work was financially supported by the Natural Science Foundation of Hebei Province (No. B2021208007), the Science and Technology Research Project of Higher Education of Hebei Province (No. ZD2021321), the Science and Technology Project of Hebei Education Department (ZD2022122) and the S&T Program of Hebei (No. 199676242H).

Conflicts of Interest

The authors declare no conflict of interest.

References

  1. Gong, Y.; Xu, Z.-Q.; Li, D.; Zhang, J.; Aharonovich, I.; Zhang, Y. Two-dimensional hexagonal boron nitride for building Next-generation energy-efficient devices. ACS Energy Lett. 2021, 6, 985–996. [Google Scholar] [CrossRef]
  2. Kim, K.K.; Lee, H.S.; Lee, Y.H. Synthesis of hexagonal boron nitride heterostructures for 2D van der Waals electronics. Chem. Soc. Rev. 2018, 47, 6342–6369. [Google Scholar] [CrossRef] [PubMed]
  3. Zhang, J.; Tan, B.; Zhang, X.; Gao, F.; Hu, Y.; Wang, L.; Duan, X.; Yang, Z.; Hu, P. Atomically thin hexagonal boron nitride and its heterostructures. Adv. Mater. 2020, 33, 2000769. [Google Scholar] [CrossRef] [PubMed]
  4. Weng, Q.; Wang, X.; Wang, X.; Bando, Y.; Golberg, D. Functionalized hexagonal boron nitride nanomaterials: Emerging properties and applications. Chem. Soc. Rev. 2016, 45, 3989–4012. [Google Scholar] [CrossRef] [PubMed] [Green Version]
  5. Zhou, C.; Lai, C.; Zhang, C.; Zeng, G.; Huang, D.; Cheng, M.; Hu, L.; Xiong, W.; Chen, M.; Wang, J.; et al. Semiconductor/boron nitride composites: Synthesis, properties, and photocatalysis applications. Appl. Catal. B 2018, 238, 6–18. [Google Scholar] [CrossRef]
  6. Mendelson, N.; Chugh, D.; Reimers, J.R.; Cheng, T.S.; Gottscholl, A.; Long, H.; Mellor, C.J.; Zettl, A.; Dyakonov, V.; Beton, P.H.; et al. Identifying carbon as the source of visible single-photon emission from hexagonal boron nitride. Nat. Mater. 2020, 20, 321–328. [Google Scholar] [CrossRef]
  7. Chen, L.; Zhou, M.; Luo, Z.; Wakeel, M.; Asiri, A.M.; Wang, X. Template-free synthesis of carbon-doped boron nitride nanosheets for enhanced photocatalytic hydrogen evolution. Appl. Catal. B 2019, 241, 246–255. [Google Scholar] [CrossRef]
  8. Huang, C.; Chen, C.; Zhang, M.; Lin, L.; Ye, X.; Lin, S.; Antonietti, M.; Wang, X. Carbon-doped BN nanosheets for metal-free photoredox catalysis. Nat. Commun. 2015, 6, 7698. [Google Scholar] [CrossRef] [Green Version]
  9. Zheng, M.; Shi, J.; Yuan, T.; Wang, X. Metal-free dehydrogenation of N-heterocycles by ternary h-BCN nanosheets with visible light. Angew. Chem. Int. Ed. 2018, 57, 5487–5491. [Google Scholar] [CrossRef]
  10. Shi, J.; Yuan, T.; Zheng, M.; Wang, X. Metal-free heterogeneous semiconductor for visible-light photocatalytic decarboxylation of carboxylic acids. ACS Catal. 2021, 11, 3040–3047. [Google Scholar] [CrossRef]
  11. Guo, F.; Yang, P.; Pan, Z.; Cao, X.-N.; Xie, Z.; Wang, X. Carbon-doped BN nanosheets for the oxidative dehydrogenation of ethylbenzene. Angew. Chem. Int. Ed. 2017, 56, 8231–8235. [Google Scholar] [CrossRef] [PubMed]
  12. Zheng, M.; Yuan, T.; Shi, J.; Cai, W.; Wang, X. Photocatalytic oxygenation and deoxygenation transformations over BCN nanosheets. ACS Catal. 2019, 9, 8068–8072. [Google Scholar] [CrossRef]
  13. Wang, B.; Anpo, M.; Lin, J.; Yang, C.; Zhang, Y.; Wang, X. Direct hydroxylation of benzene to phenol on h-BCN nanosheets in the presence of FeCl3 and H2O2 under visible light. Catal. Today 2019, 324, 73–82. [Google Scholar] [CrossRef]
  14. Zhou, M.; Wang, S.; Yang, P.; Huang, C.; Wang, X. Boron carbon nitride semiconductors decorated with CdS nanoparticles for photocatalytic reduction of CO2. ACS Catal. 2018, 8, 4928–4936. [Google Scholar] [CrossRef]
  15. Garay, A.L.; Pichon, A.; James, S.L. Solvent-free synthesis of metal complexes. Chem. Soc. Rev. 2007, 36, 846–855. [Google Scholar] [CrossRef]
  16. Ambika, S.; Devasena, M.; Nambi, I.M. Synthesis, characterization and performance of high energy ball milled meso-scale zero valent iron in Fenton reaction. J. Environ. Manag. 2016, 181, 847–855. [Google Scholar] [CrossRef]
  17. Blanco, M.C.; Cámara, J.; Gimeno, M.C.; Laguna, A.; James, S.L.; Lagunas, M.C.; Villacampa, M.D. Synthesis of gold-silver luminescent honeycomb aggregates by both solvent-based and solvent-free methods. Angew. Chem. Int. Ed. 2012, 51, 9777–9779. [Google Scholar] [CrossRef]
  18. Wang, K.; Duan, D.; Wang, R.; Lin, A.; Cui, Q.; Liu, B.; Cui, T.; Zou, B.; Zhang, X.; Hu, J.; et al. Stability of hydrogen-bonded supramolecular architecture under high pressure conditions: Pressure-induced amorphization in melamine-boric acid adduct. Langmuir 2009, 25, 4787–4791. [Google Scholar] [CrossRef]
  19. Kawsaki, T.; Kuroda, Y.; Nishikawa, H. The crystal structure of melamine diborate. J. Ceram. Soc. Jpn. 1996, 104, 935–938. [Google Scholar] [CrossRef] [Green Version]
  20. Roy, A.; Choudhury, A.C.; Rao, N.R. Supramolecular hydrogen-bonded structure of a 1:2 adduct of melamine with boric acid. J. Mol. Struct. 2002, 613, 61–66. [Google Scholar] [CrossRef] [Green Version]
  21. Atalay, Y.; Avcı, D.; Başoğlu, A.; Okur, İ. Molecular structure and vibrational spectra of melamine diborate by density functional theory and ab initio Hartree-Fock calculations. J. Mol. Struc. THEOCHEM 2005, 713, 21–26. [Google Scholar] [CrossRef]
  22. Norrild, J.C.; Eggert, H. Evidence for mono-and bisdentate boronate complexes of glucose in the furanose form. Application of 1JC-C coupling constants as a structural probe. J. Am. Chem. Soc. 1995, 117, 1479–1484. [Google Scholar] [CrossRef]
  23. Franco, A.; Ascenso, J.R.; Ilharco, L.; Diogo, H.P.; André, V.; da Silva, J.A.L. Ribose-borate esters as potential components for prebiological evolution. J. Mol. Struct. 2019, 1184, 281–288. [Google Scholar] [CrossRef]
  24. Cordes, D.B.; Gamsey, S.; Singaram, B. Fluorescent quantum dots with boronic acid substituted viologens to sense glucose in aqueous solution. Angew. Chem. Int. Ed. 2006, 45, 3829–3832. [Google Scholar] [CrossRef]
  25. Lu, Q.; An, J.; Duan, Y.; Luo, Q.; Yin, R.; Li, X.; Tang, C.; Wang, D. A strategy for preparing efficient Ag/p-BNNS nanocatalyst with a synergistic effect between Ag and p-BNNS. J. Catal. 2021, 395, 457–466. [Google Scholar] [CrossRef]
  26. Panicker, C.Y.; Varghese, H.T.; John, A.; Philip, D.; Nogueira, H.I.S. Vibrational spectra of melamine diborate, C3N6H62H3BO3. Spectrochim. Acta A 2002, 58, 1545–1551. [Google Scholar] [CrossRef]
  27. Bagno, A.; Rastrelli, F.; Saielli, G. Prediction of the 1H and 13C NMR spectra of α-D-glucose in water by DFT methods and MD simulations. J. Org. Chem. 2007, 72, 7373–7381. [Google Scholar] [CrossRef]
  28. Henderson, W.G.; How, M.J.; Kennedy, G.R.; Mooney, E.F. The interconversion of aqueous boron species and the interaction of borate with diols: A 11B NMR study. Carbohydr. Res. 1973, 28, 1–12. [Google Scholar] [CrossRef]
  29. Zhang, S.; Mandai, T.; Ueno, K.; Dokko, K.; Watanabe, M. Hydrogen-bonding supramolecular protic salt as an “all-in-one” precursor for nitrogen-doped mesoporous carbons for CO2 adsorption. Nano Energy 2015, 13, 376–386. [Google Scholar] [CrossRef] [Green Version]
  30. Pascallon, J.; Stambouli, V.; Ilias, S.; Bouchier, D.; Nouet, G.; Silva, F.; Gicquel, A. Deposition of c-BN films on diamond: Influence of the diamond roughness. Mater. Sci. Eng. B 1999, 59, 239–243. [Google Scholar] [CrossRef]
  31. Taguchi, A.; Schüth, F. Ordered mesoporous materials in catalysis. Microporous Mesoporous Mater. 2005, 77, 1–45. [Google Scholar] [CrossRef]
  32. Song, Q.; Fang, Y.; Liu, Z.; Li, L.; Wang, Y.; Liang, J.; Huang, Y.; Lin, J.; Hu, L.; Zhang, J.; et al. The performance of porous hexagonal BN in high adsorption capacity towards antibiotics pollutants from aqueous solution. Chem. Eng. J. 2017, 325, 71–79. [Google Scholar] [CrossRef]
  33. Wang, J.; Hao, J.; Liu, D.; Qin, S.; Portehault, D.; Li, Y.; Chen, Y.; Lei, W. Porous boron carbon nitride nanosheets as efficient metal-free catalysts for the oxygen reduction reaction in both alkaline and acidic solutions. ACS Energy Lett. 2017, 2, 306–312. [Google Scholar] [CrossRef] [Green Version]
  34. Weng, Q.H.; Wang, X.B.; Zhi, C.Y.; Bando, Y.; Golberg, D. Boron nitride porous microbelts for hydrogen storage. ACS Nano 2013, 7, 1558–1565. [Google Scholar] [CrossRef] [PubMed]
  35. Wang, L.; Wu, B.; Liu, H.; Huang, L.; Li, Y.; Guo, W.; Chen, X.; Peng, P.; Fu, L.; Yang, Y.; et al. Water-assisted growth of large-sized single crystal hexagonal boron nitride grains. Mater. Chem. Front. 2017, 1, 1836–1840. [Google Scholar] [CrossRef]
  36. Liu, A.C.Y.; Arenal, R.; Montagnac, G. In situ transmission electron microscopy observation of keV-ion irradiation of single-walled carbon and boron nitride nanotubes. Carbon 2013, 62, 248–255. [Google Scholar] [CrossRef]
  37. Qin, L.; Yu, J.; Kuang, S.; Xiao, C.; Bai, X. Few-atomic-layered boron carbonitride nanosheets prepared by chemical vapor deposition. Nanoscale 2012, 4, 120–123. [Google Scholar] [CrossRef]
  38. Endo, M.; Kim, Y.A.; Hayashi, T.; Muramatsu, H.; Terrones, M.; Saito, R.; Villalpando-Paez, F.; Chou, S.G.; Dresselhaus, M.S. Nanotube coalescence-inducing mode: A novel vibrational mode in carbon systems. Small 2006, 2, 1031–1036. [Google Scholar] [CrossRef]
  39. Dargelos, A.; Karamanis, P.; Pouchan, C. Ab-initio calculations of the IR spectra of dicyanodiacetylene (C6N2) beyond the harmonic approximation. Chem. Phys. Lett. 2019, 723, 155–159. [Google Scholar] [CrossRef]
  40. Yu, L.L.; Gao, B.; Chen, Z.; Sun, C.T.; Cui, D.L.; Wang, C.J.; Wang, Q.L.; Jiang, M.H. In situ FTIR investigation on phase transformations in BN nanoparticles. Chin. Sci. Bull. 2005, 50, 2827–2831. [Google Scholar]
  41. Zeng, X.; Chen, H.; He, X.; Zhang, H.; Fang, W.; Du, X.; Li, W.; Huang, Z.; Zhao, L. In-situ synthesis of non-phase-separated boron carbon nitride for photocatalytic reduction of CO2. Environ. Res. 2022, 207, 112178. [Google Scholar] [CrossRef] [PubMed]
  42. López-Salas, N.; Ferrer, M.L.; Gutiérrez, M.C.; Fierro, J.L.G.; Cuadrado-Collados, C.; Gandara-Loe, J.; Silvestre-Albero, J.; del Monte, F. Hydrogen-bond supramolecular hydrogels as efficient precursors in the preparation of freestanding 3D carbonaceous architectures containing BCNO nanocrystals and exhibiting a high CO2/CH4 adsorption ratio. Carbon 2018, 134, 470–479. [Google Scholar] [CrossRef] [Green Version]
  43. Lei, W.; Portehault, D.; Liu, D.; Qin, S.; Chen, Y. Porous boron nitride nanosheets for effective water cleaning. Nat. Commun. 2013, 4, 1777. [Google Scholar] [CrossRef] [PubMed]
  44. Giusto, P.; Cruz, D.; Heil, T.; Tarakina, N.; Patrini, M.; Antonietti, M. Chemical vapor deposition of highly conjugated, transparent boron carbon nitride thin films. Adv. Sci. 2021, 8, 2101602. [Google Scholar] [CrossRef] [PubMed]
  45. Weng, Q.; Zeng, L.; Chen, Z.; Han, Y.; Jiang, K.; Bando, Y.; Golberg, D. Hydrogen storage in carbon and oxygen Co-doped porous boron nitrides. Adv. Funct. Mater. 2020, 31, 2007381. [Google Scholar] [CrossRef]
  46. Torii, S.; Jimura, K.; Hayashi, S.; Kikuchi, R.; Takagaki, A. Utilization of hexagonal boron nitride as a solid acid-base bifunctional catalyst. J. Catal. 2017, 355, 176–184. [Google Scholar] [CrossRef]
  47. Marchetti, P.S.; Kwon, D.; Schmidt, W.R.; Interrante, L.V.; Maciel, G.E. High-field boron-11 magic-angle spinning NMR characterization of boron nitrides. Chem. Mater. 2002, 3, 482–486. [Google Scholar] [CrossRef]
  48. Bawari, S.; Sharma, K.; Kalita, G.; Madhu, P.K.; Narayanan, T.N.; Mondal, J. Structural evolution of BCN systems from graphene oxide towards electrocatalytically active atomic layers. Mater. Chem. Front. 2020, 4, 2330–2338. [Google Scholar] [CrossRef]
  49. Portehault, D.; Giordano, C.; Gervais, C.; Senkovska, I.; Kaskel, S.; Sanchez, C.; Antonietti, M. High-surface-area nanoporous boron carbon nitrides for hydrogen storage. Adv. Funct. Mater. 2010, 20, 1827–1833. [Google Scholar] [CrossRef]
  50. Chen, S.; Li, P.; Xu, S.; Pan, X.; Fu, Q.; Bao, X. Carbon doping of hexagonal boron nitride porous materials toward CO2 capture. J. Mater. Chem. A 2018, 6, 1832–1839. [Google Scholar] [CrossRef]
  51. Wrackmeyer, B. Carbon-13 NMR spectroscopy of boron compounds. Prog. Nucl. Magn. Reson. Spectrosc. 1979, 12, 227–259. [Google Scholar] [CrossRef]
  52. Tay, R.Y.; Li, H.; Tsang, S.H.; Zhu, M.; Loeblein, M.; Jing, L.; Leong, F.N.; Teo, E.H.T. Trimethylamine borane: A new single-source precursor for monolayer h-BN single crystals and h-BCN thin films. Chem. Mater. 2016, 28, 2180–2190. [Google Scholar] [CrossRef]
  53. Liu, F.; Yu, J.; Ji, X.; Qian, M. Nanosheet-structured boron nitride spheres with a versatile adsorption capacity for water cleaning. ACS Appl. Mater. Inter. 2015, 7, 1824–1832. [Google Scholar] [CrossRef] [PubMed]
  54. Liu, Q.; Chen, C.; Du, M.; Wu, Y.; Ren, C.; Ding, K.; Song, M.; Huang, C. Porous hexagonal boron nitride sheets: Effect of hydroxyl and secondary amino groups on photocatalytic hydrogen evolution. ACS Appl. Nano Mater. 2018, 1, 4566–4575. [Google Scholar] [CrossRef]
  55. Bhattacharya, A.; Bhattacharya, S.; Das, G.P. Band gap engineering by functionalization of BN sheet. Phys. Rev. B 2012, 85, 035415. [Google Scholar] [CrossRef] [Green Version]
  56. Cao, Y.; Zhang, R.; Zhou, T.; Jin, S.; Huang, J.; Ye, L.; Huang, Z.; Wang, F.; Zhou, Y. B–O bonds in ultrathin boron nitride nanosheets to promote photocatalytic carbon dioxide conversion. ACS Appl. Mater. Interfaces 2020, 12, 9935–9943. [Google Scholar] [CrossRef]
  57. Zhao, L.; Ye, F.; Wang, D.; Cai, X.; Meng, C.; Xie, H.; Zhang, J.; Bai, S. Lattice engineering on metal cocatalysts for enhanced photocatalytic reduction of CO2 into CH4. ChemSusChem 2018, 11, 3524–3533. [Google Scholar] [CrossRef]
  58. Xie, S.; Wang, Y.; Zhang, Q.; Deng, W.; Wang, Y. MgO- and Pt-promoted TiO2 as an efficient photocatalyst for the preferential reduction of carbon dioxide in the presence of water. ACS Catal. 2014, 4, 3644–3653. [Google Scholar] [CrossRef]
  59. Shankar, R.; Sachs, M.; Francàs, L.; Lubert-Perquel, D.; Kerherve, G.; Regoutz, A.; Petit, C. Porous boron nitride for combined CO2 capture and photoreduction. J. Mater. Chem. A 2019, 7, 23931–23940. [Google Scholar] [CrossRef] [Green Version]
  60. Weng, Q.; Kvashnin, D.G.; Wang, X.; Cretu, O.; Yang, Y.; Zhou, M.; Zhang, C.; Tang, D.-M.; Sorokin, P.B.; Bando, Y.; et al. Tuning of the optical, electronic, and magnetic properties of boron nitride nanosheets with oxygen doping and functionalization. Adv. Mater. 2017, 29, 1700695. [Google Scholar] [CrossRef] [Green Version]
  61. Fu, J.; Jiang, K.; Qiu, X.; Yu, J.; Liu, M. Product selectivity of photocatalytic CO2 reduction reactions. Mater. Today 2020, 32, 222–243. [Google Scholar] [CrossRef]
  62. Park, H.-a.; Choi, J.H.; Choi, K.M.; Lee, D.K.; Kang, J.K. Highly porous gallium oxide with a high CO2 affinity for the photocatalytic conversion of carbon dioxide into methane. J. Mater. Chem. 2012, 22, 5304. [Google Scholar] [CrossRef]
  63. White, J.L.; Baruch, M.F.; Pander, J.E., III; Hu, Y.; Fortmeyer, I.C.; Park, J.E.; Zhang, T.; Liao, K.; Gu, J.; Yan, Y.; et al. Light-driven heterogeneous reduction of carbon dioxide: Photocatalysts and photoelectrodes. Chem. Rev. 2015, 115, 12888–12935. [Google Scholar] [CrossRef] [PubMed]
  64. Wu, C.; Wang, B.; Wu, N.; Han, C.; Zhang, X.; Shen, S.; Tian, Q.; Qin, C.; Li, P.; Wang, Y. Molecular-scale understanding on the structure evolution from melamine diborate supramolecule to boron nitride fibers. Ceram. Int. 2020, 46, 1083–1090. [Google Scholar] [CrossRef]
Figure 1. (a) Powder XRD patterns. (b,c) Raman spectra in the different wavenumber range. (d) An enlarged view of the FTIR spectra in the range of 1700~1650 cm−1 for glucose, M∙2B, P1, and P2.
Catalysts 12 00555 g001aCatalysts 12 00555 g001b
Figure 2. (a,b) 13C Solid-state MAS NMR spectra of M∙2B, P1, and P2. Arabic numerals in inset of (b) represent the location of carbon of glucose. (c) 11B Solid-state MAS NMR spectra, * denotes spinning side band.
Catalysts 12 00555 g002
Figure 3. (a) TEM and (b) HRTEM images of p-BCN-1, inset of (a) selected area electron diffraction (scale bar: 500 nm and 10 nm). (c) TEM and (d) HRTEM image of p-BCN-2 (scale bar: 500 nm and 5 nm).
Catalysts 12 00555 g003
Figure 4. (a) N2 adsorption–desorption isotherms. (b) The corresponding pore size distributions calculated by the BJH method of samples.
Catalysts 12 00555 g004
Figure 5. (a) Powder XRD patterns and (b) Raman spectra of p-BN, p-BCN-1, and p-BCN-2.
Catalysts 12 00555 g005
Figure 6. (a) FTIR spectra of p-BN, p-BCN-1, and p-BCN-2. (b) An enlarged view of the FTIR spectra of p-BCN-2 in the range of 3000~2400 cm−1 (rose rectangle), an enlarged view of the FTIR spectra of the light green rectangle in the range of 1500~1300 cm−1, and the light purple rectangle in the range of 820~760 cm−1 in (a).
Catalysts 12 00555 g006
Figure 7. XPS high-resolved spectra of (a) B 1s and (b) C 1s of p-BCN-1 and (c) B 1s and (d) C 1s of p-BCN-2, respectively.
Catalysts 12 00555 g007aCatalysts 12 00555 g007b
Figure 8. Solid-state MAS NMR spectra of p-BN (I), p-BCN-1 (II), and p-BCN-2 (III) samples: (a) 1H MAS NMR spectra; (b) 11B MAS NMR spectra. * denotes spinning side band; (c) 13C MAS NMR spectra; and (d) the idealized structure determined by analysis of p-BCN-1.
Catalysts 12 00555 g008
Figure 9. EELS mappings of (a) p-BCN-1 and (b) p-BCN-2. The Arabic digits on the yellow arrow represent the location of the tested sample, and the Arabic digits on the spectrograms represent the EELS mappings determined at the corresponding location of samples.
Catalysts 12 00555 g009
Figure 10. UV–vis diffuse reflectance spectra of p-BN, p-BCN-1, and p-BCN-2 samples.
Catalysts 12 00555 g010
Figure 11. (a) Transient photocurrent density responses and (b) EIS Nyquist plots of p-BN, p-BCN-1, and p-BCN-2 samples.
Catalysts 12 00555 g011
Figure 12. Catalytic performance of p-BN and p-BCN photocatalyzed CO2 conversion.
Catalysts 12 00555 g012
Figure 13. Schematic illustration of p-BCN with different crystal forms prepared by regulating recrystallization conditions of the homogeneous precursor solution: (I) P1-induced h-type p-BCN formation; (II) P2-induced h-type and c-type p-BCN formation.
Catalysts 12 00555 g013
Figure 14. The possible scheme of p-BCN-1 and p-BCN-2 for photoreduction of CO2 under simulated solar irradiation.
Catalysts 12 00555 g014
Figure 15. Schematic synthesis of p-BCN-1 and p-BCN-2 samples.
Catalysts 12 00555 g015
Table 1. Photocatalytic CO2 reduction performance of different photocatalysts in the presence of H2O.
PhotocatalystsFormation Rate (μmol·g−1·h−1)
COCH4H2
BN [56]0-0.7
O/BN [56]12.5-3.3
g-C3N4 [57]0.10.071.0
TiO2 [58]1.20.382.1
Pt-TiO2 [58]1.15.233
Pd-TiO2 [58]1.14.325
Rh-TiO2 [58]0.623.518
Au-TiO2 [58]1.53.120
Ag-TiO2 [58]1.72.116
Porous BN [59]1.17--
p-BN a000.78
p-BCN-1 a63.18.419.4
p-BCN-2 a42.62.52-
a this work.
Publisher’s Note: MDPI stays neutral with regard to jurisdictional claims in published maps and institutional affiliations.

