Article

Undercooling, Thermal Stability, and Application in Exothermic Catalytic Reaction of SiO2 Encapsulated SnZnCu Microspheres

College of Chemical Engineering, Zhejiang University of Technology, Hangzhou 300014, China
*
Author to whom correspondence should be addressed.
Catalysts 2022, 12(2), 205; https://doi.org/10.3390/catal12020205
Submission received: 31 December 2021 / Revised: 27 January 2022 / Accepted: 27 January 2022 / Published: 9 February 2022

Abstract

:
SiO2 encapsulated SnZnCu microspheres (several micrometers to about 30 μm in diameter) with very low undercooling, narrow freezing/melting range, and high thermal cycling stability have been produced and used as the temperature stabilizer of the packed bed in highly exothermic Fischer–Tropsch reaction. The core–shell structured SnZnCu@SiO2 microspheres are prepared in a two-step way, namely SnZnCu microspheres are firstly produced via a molten LiCl–KCl–CsCl eutectic-based metal emulsion method, and then a sol–gel approach is employed to coat them with a uniform, anti-leakage SiO2 layer. It is found that raising the amount of Zn to 4.0 at.% is critical for achieving a very low undercooling (<5 °C for SnZn0.04Cux@SiO2 vs. about 84 °C for Sn@SiO2) and a narrow freezing/melting peak width, and both undercooling and peak width are almost unchanged as the Cu content (x) increases from 1.5 to 3.0 at.%. However, their thermal cycling stability depends positively on the amount of Cu and can be remarkably improved when 3.0 at.% Cu is added. The results also show that low undercooling and narrow freezing/melting peak width are associated with the formation of Sn–Zn–Cu ternary eutectic and metastable phase Cu5Zn8, and poor thermal cycling stability of SnZn0.04Cux@SiO2 microspheres with low Cu content is related to the decomposition of Cu5Zn8 during thermal cycling. By embedding thermally stable SnZn0.04Cu0.03@SiO2 microspheres into the Co/SiO2 catalyst for Fischer–Tropsch synthesis, the temperature gradient in the catalyst bed can be significantly reduced by suppressing the formation of hot spots or thermal runaway and thus rapid deactivation of Co catalyst that occurs in the SnZn0.04Cux@SiO2-absent Co/SiO2 catalyst can be avoided.

1. Introduction

Solid–liquid phase change materials (PCMs), a class of materials that can store or release thermal energy during the process of melting or freezing, are widely used in the field of latent heat storage [1,2,3,4,5,6], e.g., as temperature regulators in building (by coating PCMs into the structure’s surfaces or blending PCMs with the construction materials) [1,2] and food storage during transport [5]. A wide range of materials can be used as PCMs, including organics [3] and inorganics (e.g., salts [4] and metals [6]). In comparison with organics or inorganic salts, metal-based PCMs generally have a much higher thermal conductivity which favors rapid thermal energy transfer [4,6], and higher density that allows a high storage density on a volume basis. As a result, liquid metals have found applications in a variety of fields, such as thermal energy storage in a concentrated solar power station [6,7] and chip cooling in USB flash memory [8] or smartphones [9]. However, the direct use of liquid metals as PCMs suffers from significant drawbacks, including the leakage or coalescence of metal droplets during operation and the difficulty in handling them compared to their solid counterparts. To overcome these problems, effectively encapsulating them in chemically stable oxides, e.g., SiO2, Al2O3, or TiO2, to form microcapsules [10] has drawn increasing attention in recent years [11,12,13,14,15].
Like the inorganic salt-based PCMs and encapsulated organic PCMs [16,17], however, one of the main obstacles for practical application of these metal PCMs is their high undercooling [17]. Undercooling, also known as supercooling, is a phenomenon that commonly takes place during the solidification of metal PCMs, where the metal remains liquid until a temperature below the freezing point reaches. This will lead to a reduced solidification temperature and thus the latent heat is released at a lower temperature. As a result, the freezing temperature may not fall within the temperature range controlled by a system and the energy consumption will increase [17]. To fully utilize the latent heat, therefore, a large temperature difference between charging and discharging is needed, which is undesirable for efficient energy storage applications [16]. For instance, the authors are interested in the use of metal-based PCM microparticles for stabilizing the temperature of catalyst bed (embedded in the catalysts or as the core of the catalyst support) in highly exothermic gas–solid catalytic reactions, e.g., Fischer–Tropsch synthesis [18], and an important requirement for this special PCM is that its undercooling should be very small so that the temperature of catalyst bed can be controlled in a narrow range, namely between the endset freezing temperature and the onset melting temperature of PCMs (note: in order to achieve such a goal, a narrow freezing/melting range is also needed). From the practical point of view, therefore, depressing the undercooling lever of metal PCMs is critical for their application in thermal energy storage.
As a non-toxic, low-melting-point (about 231 °C), high-density (about 7.3 g/cm3) metal, with a much higher thermal conductivity (about 67 W⋅m−1⋅K−1 at 20 °C [19]) compared to the inorganic salts (e.g., the thermal conductivity of commercial molten salts for applications over 200–1000 °C is in the range of 0.515–0.586 W⋅m−1⋅K−1 [4]), Sn microparticles encapsulated in chemically stable oxides should be potential phase change material (PCM) for latent heat storage [13,15]. For example, they might serve as substitutes for nitrate-based PCMs in thermal energy storage due to having a melting point close to some of nitrate eutectic salts-based PCMs [4] or a potential candidate for temperature stabilizer of the catalyst bed in low-temperature (220–240 °C) Fischer–Tropsch synthesis because of their melting point matches well with the reaction temperature. However, an extremely high undercooling required for the occurrence of liquid–solid phase transition is normally observed for small-sized Sn. For example, the undercooling of single Sn microparticles is size-dependent and their undercooling rises from 50 °C to about 95 °C when their size decreases from about 640 to 460 μm [20]. For SiO2 encapsulated Sn microspheres of about 40 μm in diameter, undercooling of about 76 °C can be found in Bao’s work [13]. A similar result can be observed for Al2O3 microencapsulated Sn particles in Zhu’s work [15]. The very high undercooling of micro-sized Sn greatly restricts their practical application as PCMs. Fortunately, although no work on the undercooling suppression of microencapsulated Sn-based PCMs can be found in the literature, reducing the undercooling of bulk Sn by doping traces of elements has been well studied in the past [21,22,23] thanks to the fact that Sn is a dominant component of Pb-free solders. For example, the introduction of both Cu (1.1–1.7 at.%) and another non-noble metal, such as Co (1.2–1.7 at.%) [23], Ni (0.3–0.7 at.%) [22], or Zn (1.1 atm.%) [23], into Sn is found to be an extremely effective way to depress the undercooling of Sn-based solders. For example, an undercooling of 6.8 °C was reported in SnCu0.017Zn0.011 solders [23]. Unfortunately, when preparing Cu and Zn-doped Sn microcapsules of very low undercooling and narrow freezing/melting range so that they can serve as temperature stabilizer of the catalyst bed in Fischer–Tropsch synthesis, problems arise. (i) Probably due to the size effect, doping with the same amounts of Cu and Zn (namely 1.7 at.% Cu and 1.1 atm.% Zn) is much less effective for reducing the undercooling of Sn microparticles (diameter ranging from several micrometers to about 30 μm) [24] compared to the result observed in Sn-based solders [23]. Furthermore, a very broad freezing peak is often observed in these microencapsulated Sn-based microparticles [24] and thus a lower temperature is needed for totally releasing the latent heat, which is unfavorable for their practical application. In particular, the key factors responsible for the undercooling suppression in Cu and Zn-doped Sn microcapsules are still unknown. (ii) While the thermal cycling stability of Sn-based solders is normally not studied, it is a very important property of PCMs for their long-term application. However, up to now, there is no work on the thermal cycling stability of microencapsulated Sn-based multicomponent PCMs, especially the factors governing the thermal cycling stability. From a practical point of view, therefore, solving these problems to obtain microencapsulated Sn-based PCMs with very low undercooling, narrow freezing/melting range, and high thermal cycling stability is of great importance.
In this article, a study on the synthesis, phase change properties, thermal cycling stability, and application in exothermic catalytic reactions of SiO2 encapsulated SnZnCu microspheres is presented. By doping with high amounts of both Zn (3–5 at.%) and Cu (1.5–4 at.%) into Sn microspheres, the goal of this work is to find a type of SiO2 microencapsulated SnZnCu microspheres (several micrometers to about 30 μm in diameter) that meets the above three requirements for use as the temperature stabilizer of the packed bed in highly exothermic Fischer–Tropsch reaction and unveil the factors responsible for undercooling suppression and thermal stability enhancement. The content of this work mainly includes four aspects. (i) Prepare SnZnCu microspheres via a molten LiCl–KCl–CsCl eutectic-based metal emulsion method [24] and coat them with a uniform, anti-leakage SiO2 layer by a sol–gel approach [25]. (ii) Examine the effect of Cu and Zn addition on the phase composition and phase change properties of SnZnCu@SiO2 microspheres. (iii) Study the thermal cycling stability of SnZnCu@SiO2 microspheres and gain an insight into the factors governing the thermal stability. (iv) Embed the SnZnCu@SiO2 microspheres with desired properties into the Co/SiO2 catalyst for Fischer–Tropsch synthesis and evaluate the effect of the presence of PCM on the temperature of the catalyst bed.

2. Results and Discussion

2.1. Preparation and SiO2 Encapsulation of SnZnCu Microspheres

The SnZnCu microspheres were prepared by a molten LiCl–KCl–CsCl eutectic-based metal emulsion method [24]. Since the melting points of bulk Cu are about 1080 °C, in the previous work, an annealing temperature of 1000 °C was chosen to melt micro-sized Cu powder [24]. In this work, Cu powder was replaced by Cu nanowires. As shown in Figure S1 (see Supplementary Materials), Cu nanowires with an average diameter of about 120 nm have an initial melting temperature of about 500 °C, and at 700 °C all Cu nanowires, whether their diameters are large or small, are melted. Therefore, an annealing temperature of 750 °C was used to melt Cu nanowires. 
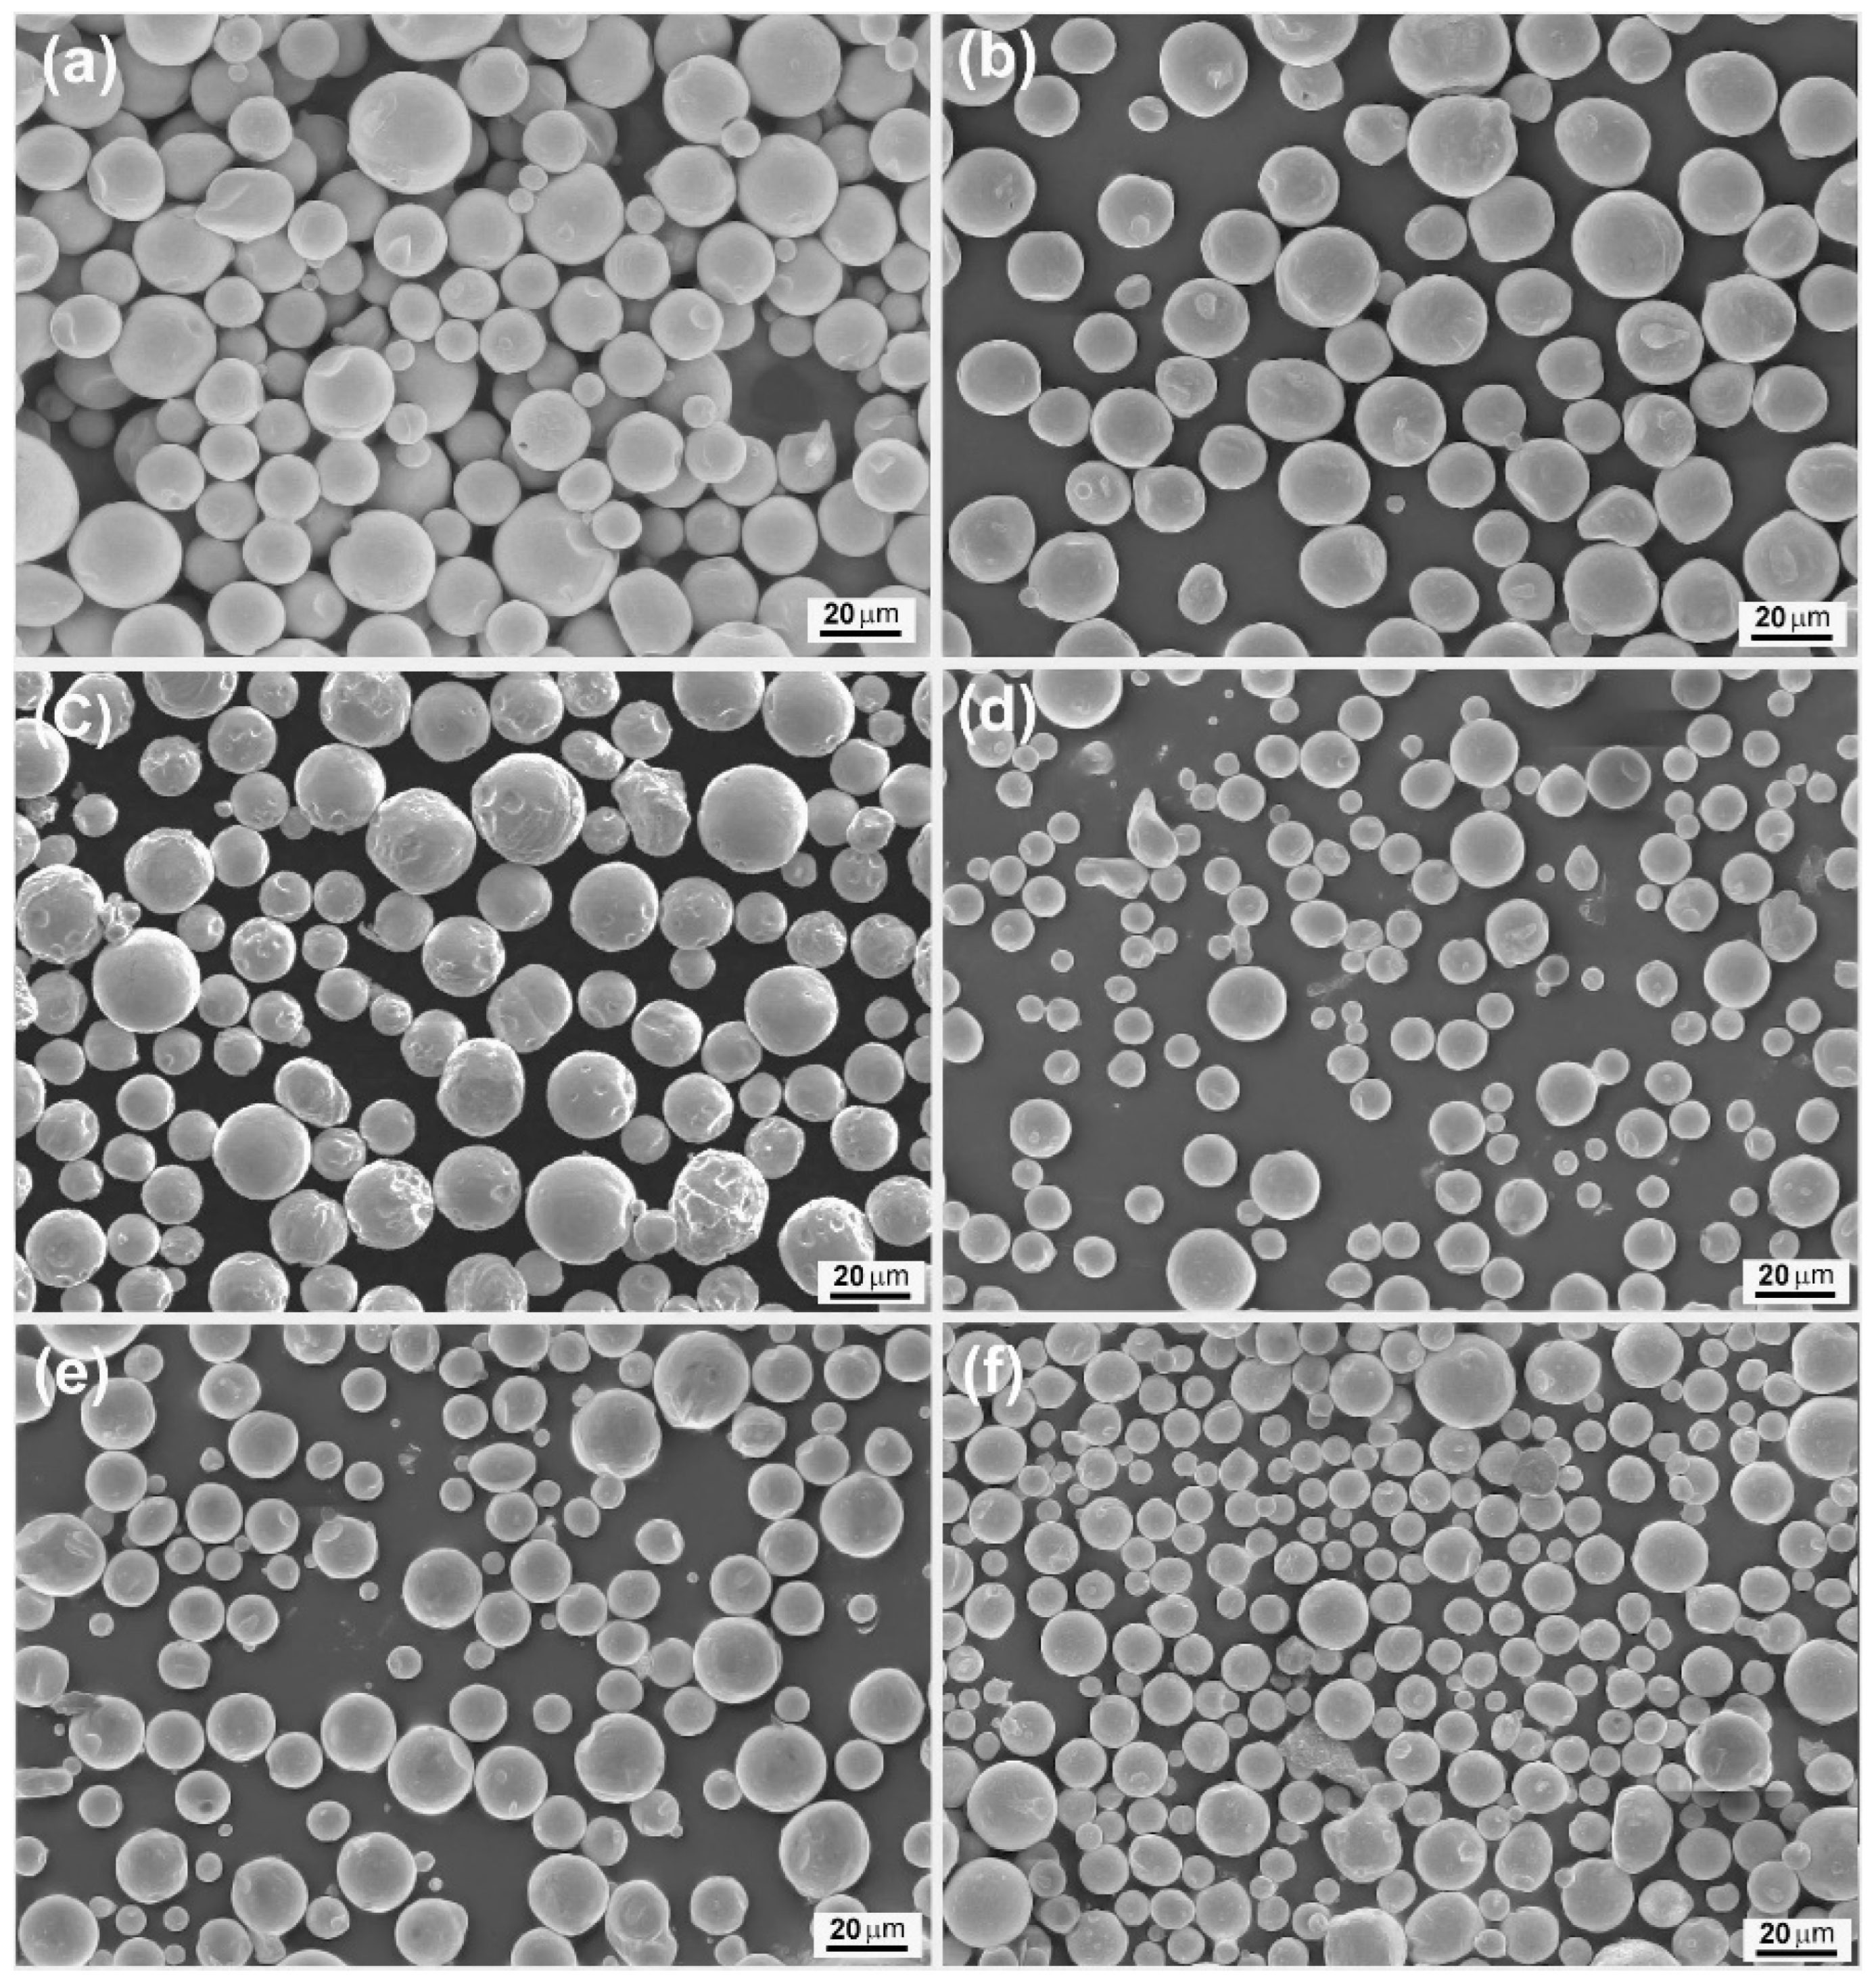
Figure 1 presents the SEM images of some SnZnCu samples (namely SnZn0.04Cu0.015, SnZn0.04Cu0.02, and SnZn0.04Cu0.03) prepared by the molten salt-based metal emulsion method. For the sake of comparison, the SEM images of Sn, SnCu0.015, and SnZn0.04 are also shown. It is obvious from these SEM images that all the products of different chemical compositions are dominantly composed of spherical microparticles, and the diameters of these microspheres are typically in the range of several micrometers to more than twenty micrometers under the employed experimental conditions. Since the metal microspheres originate from rapid solidification of the metal droplets in the molten salts, this result suggests that the Sn-based liquid metal can be ultrasonically emulsified into the molten LiCl–KCl–CsCl eutectic as micro-sized droplets, and such molten salt-based metal emulsion method is an effective way for preparing well-shaped SnZnCu microspheres.
Encapsulation of SnZnCu microspheres in SiO2 is achieved by a sol–gel method [25]. 
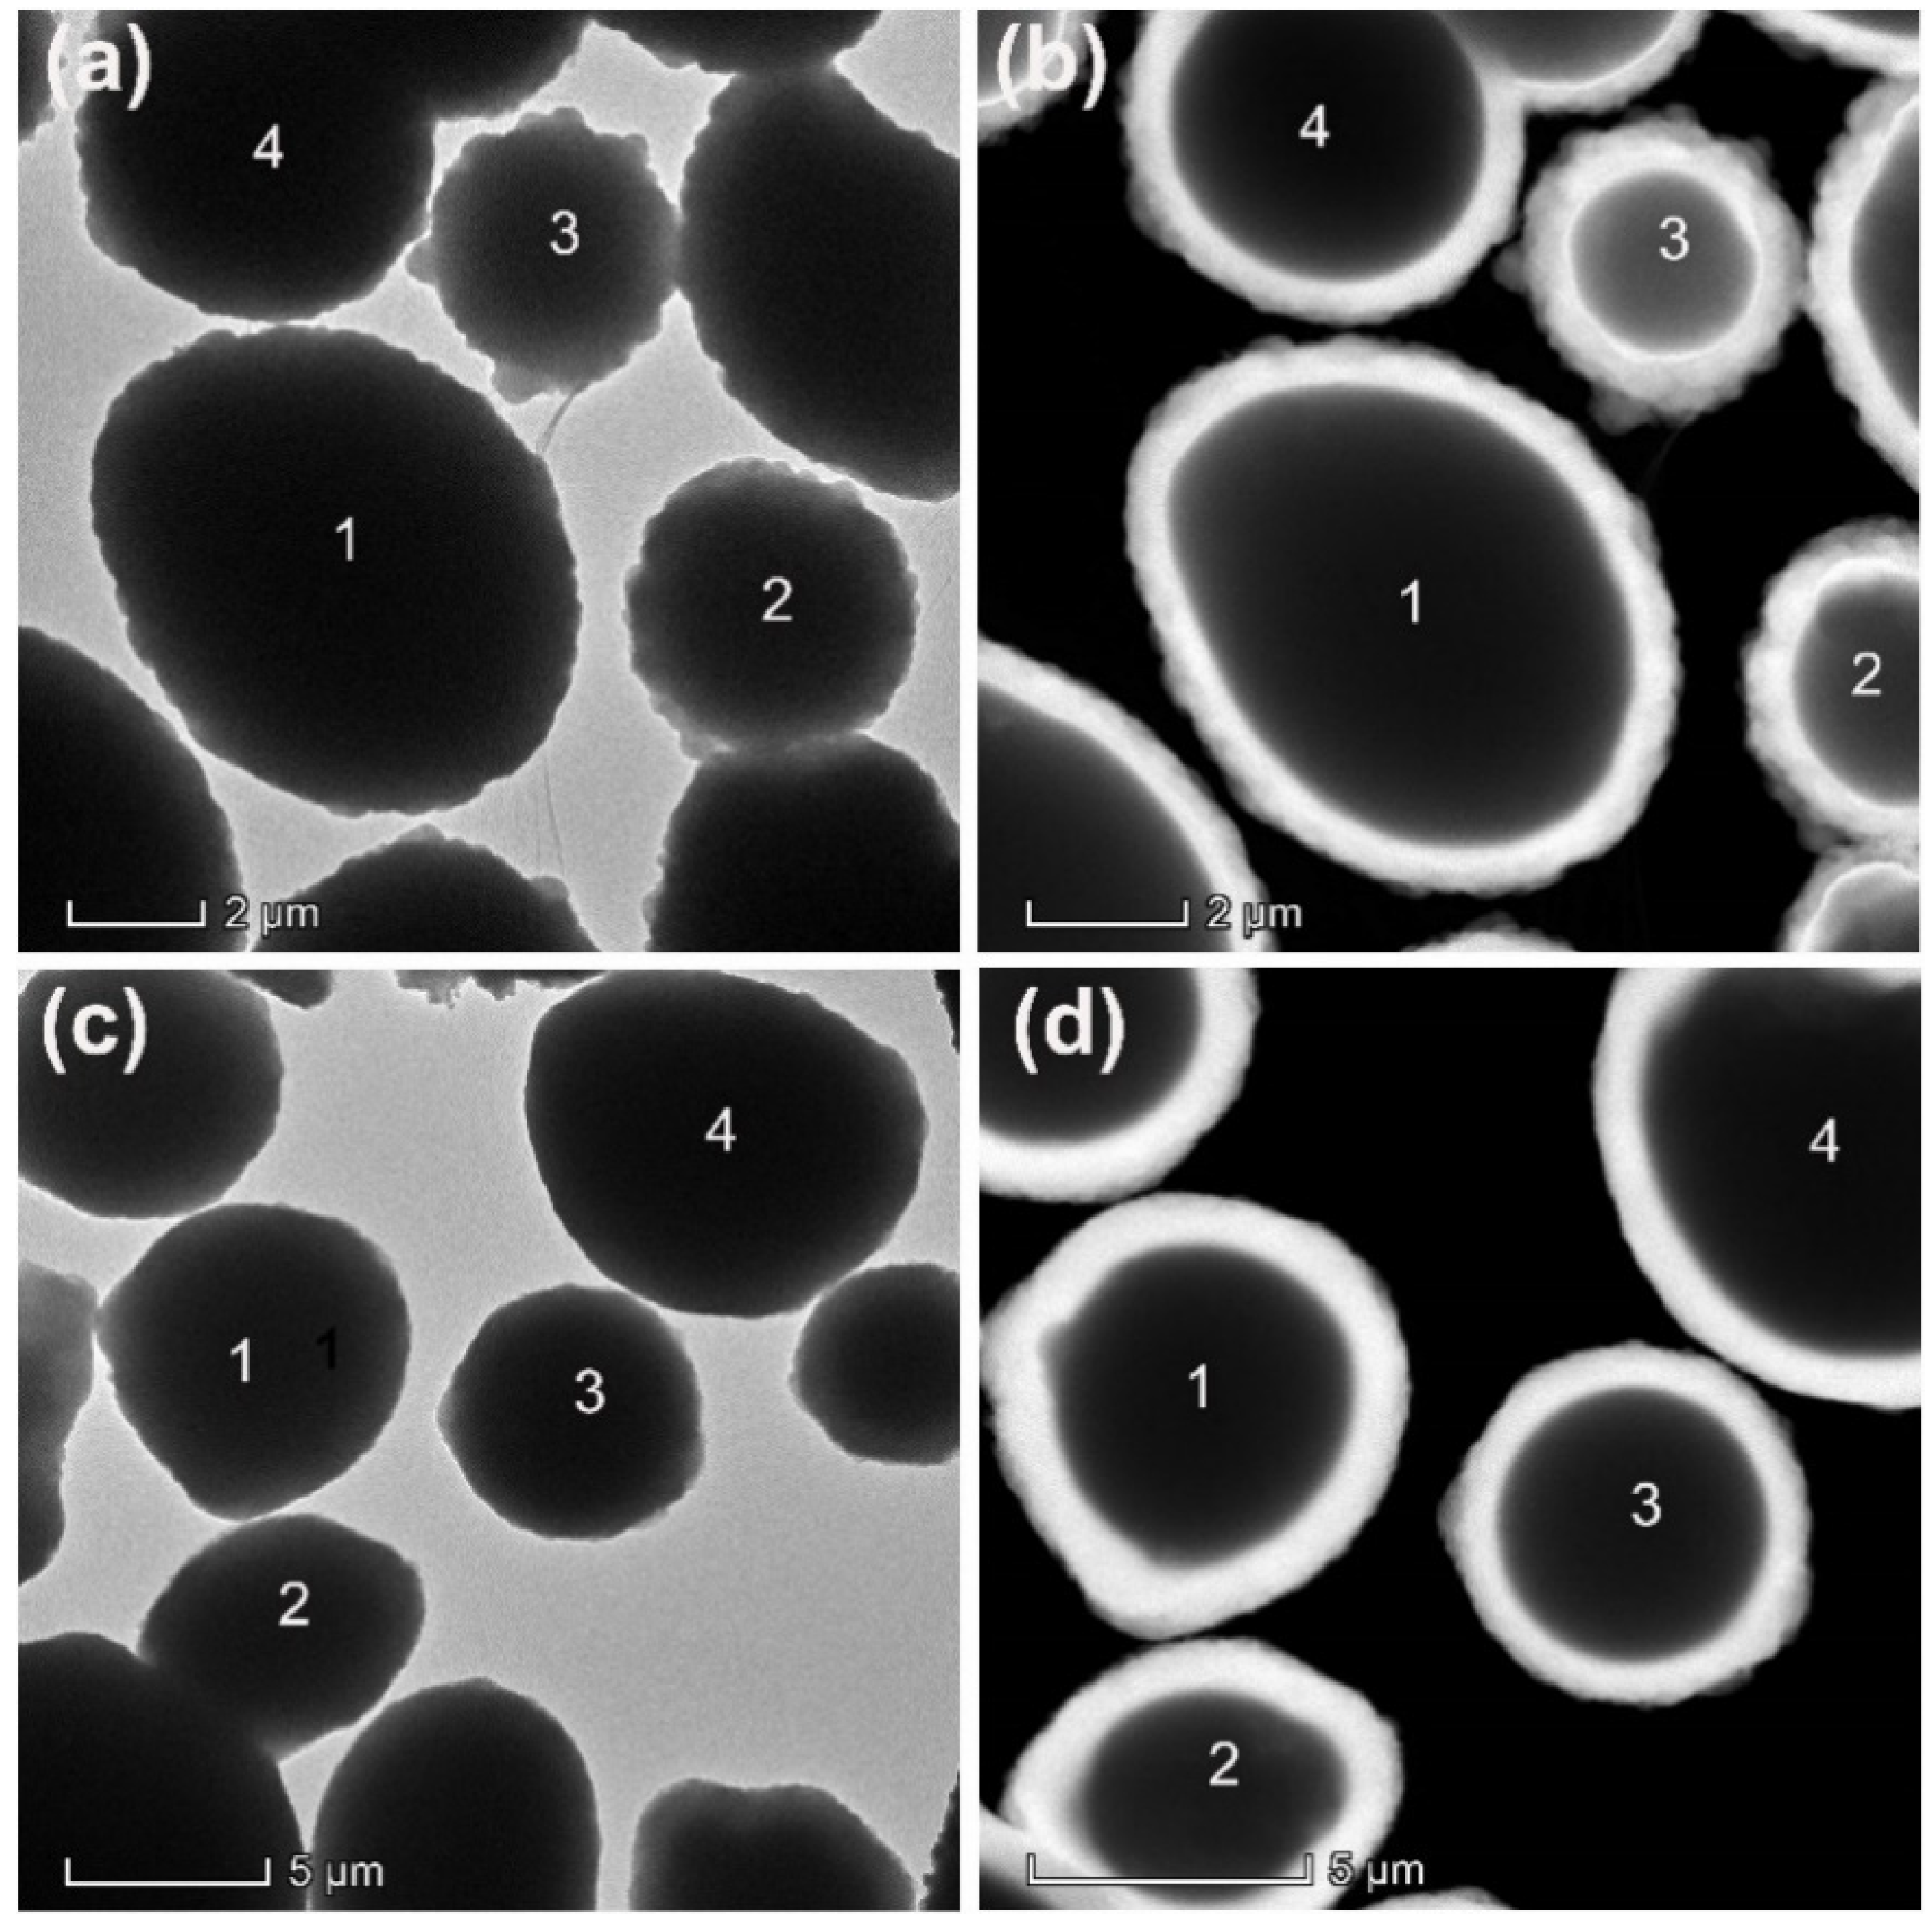
Figure 2 presents the SEM, TEM, and scanning transmission electron microscopy (STEM) images of SnZn0.04Cu0.015 after being encapsulated in SiO2. It is clear from the TEM and STEM images that these metal microspheres are coated with a uniform layer of SiO2 whose thickness is about 260 nm under the employed experimental conditions. In addition, the thickness of the SiO2 layer can be easily raised by simply repeating the encapsulation procedure. As shown in Figure 3, the thickness of the SiO2 layer can be raised to more than 700 nm or 1 micrometer after repeating encapsulation three or five times. These results suggest that this sol–gel method is extremely effective for coating SnZnCu microspheres with a uniform SiO2 layer of desired thickness. In order to ensure the practical application of SiO2-encapsulated SnZnCu microspheres as PCMs for latent heat storage, the SiO2 layer should have the ability to prevent the leakage of liquid metal cores during operation. The anti-leakage experiment is conducted at 400 °C, a temperature well above the melting point of SnZnCu microspheres. Since the metals might form a thin layer of oxide that may help to prevent their leakage if the microspheres are tested in air at 400 °C, the anti-leakage of the SiO2 layer is evaluated in the atmosphere of N2. Figure 4 presents the SEM images of SiO2-encapsulated SnZn0.04Cu0.015 microsphere (encapsulation times = 3) before and after calcination at 400 °C in N2 for 6 h. No obvious change in the morphology of these microcapsules can be observed before and after calcination, indicating that the SiO2 layer as the shell of SnZnCu microcapsules can prevent the leakage of liquid metals during operation.

2.2. Effect of Addition of Cu and Zn on Both Phase Composition of Sn Microspheres and the Undercooling of Sn Microcapsules

Thermodynamically, undercooling is an inherent feature of liquid to solid phase transition via homogeneous nucleation. Unlike heterogeneous nucleation which starts at nucleation sites on surfaces or pre-existing nuclei in the old phase, homogeneous nucleation needs the creation of new nuclei of very small size that are thermodynamically unstable and thus requires the undercooling of the medium. Doping of Sn with trace elements may introduce new clusters as nucleation sites or new phases whose surface can provide nucleation sites to induce heterogeneous nucleation and thus reduce the undercooling. Therefore, understanding the phase composition of doped Sn will help to identify which phase can provide more effective nucleation sites for heterogeneous nucleation.
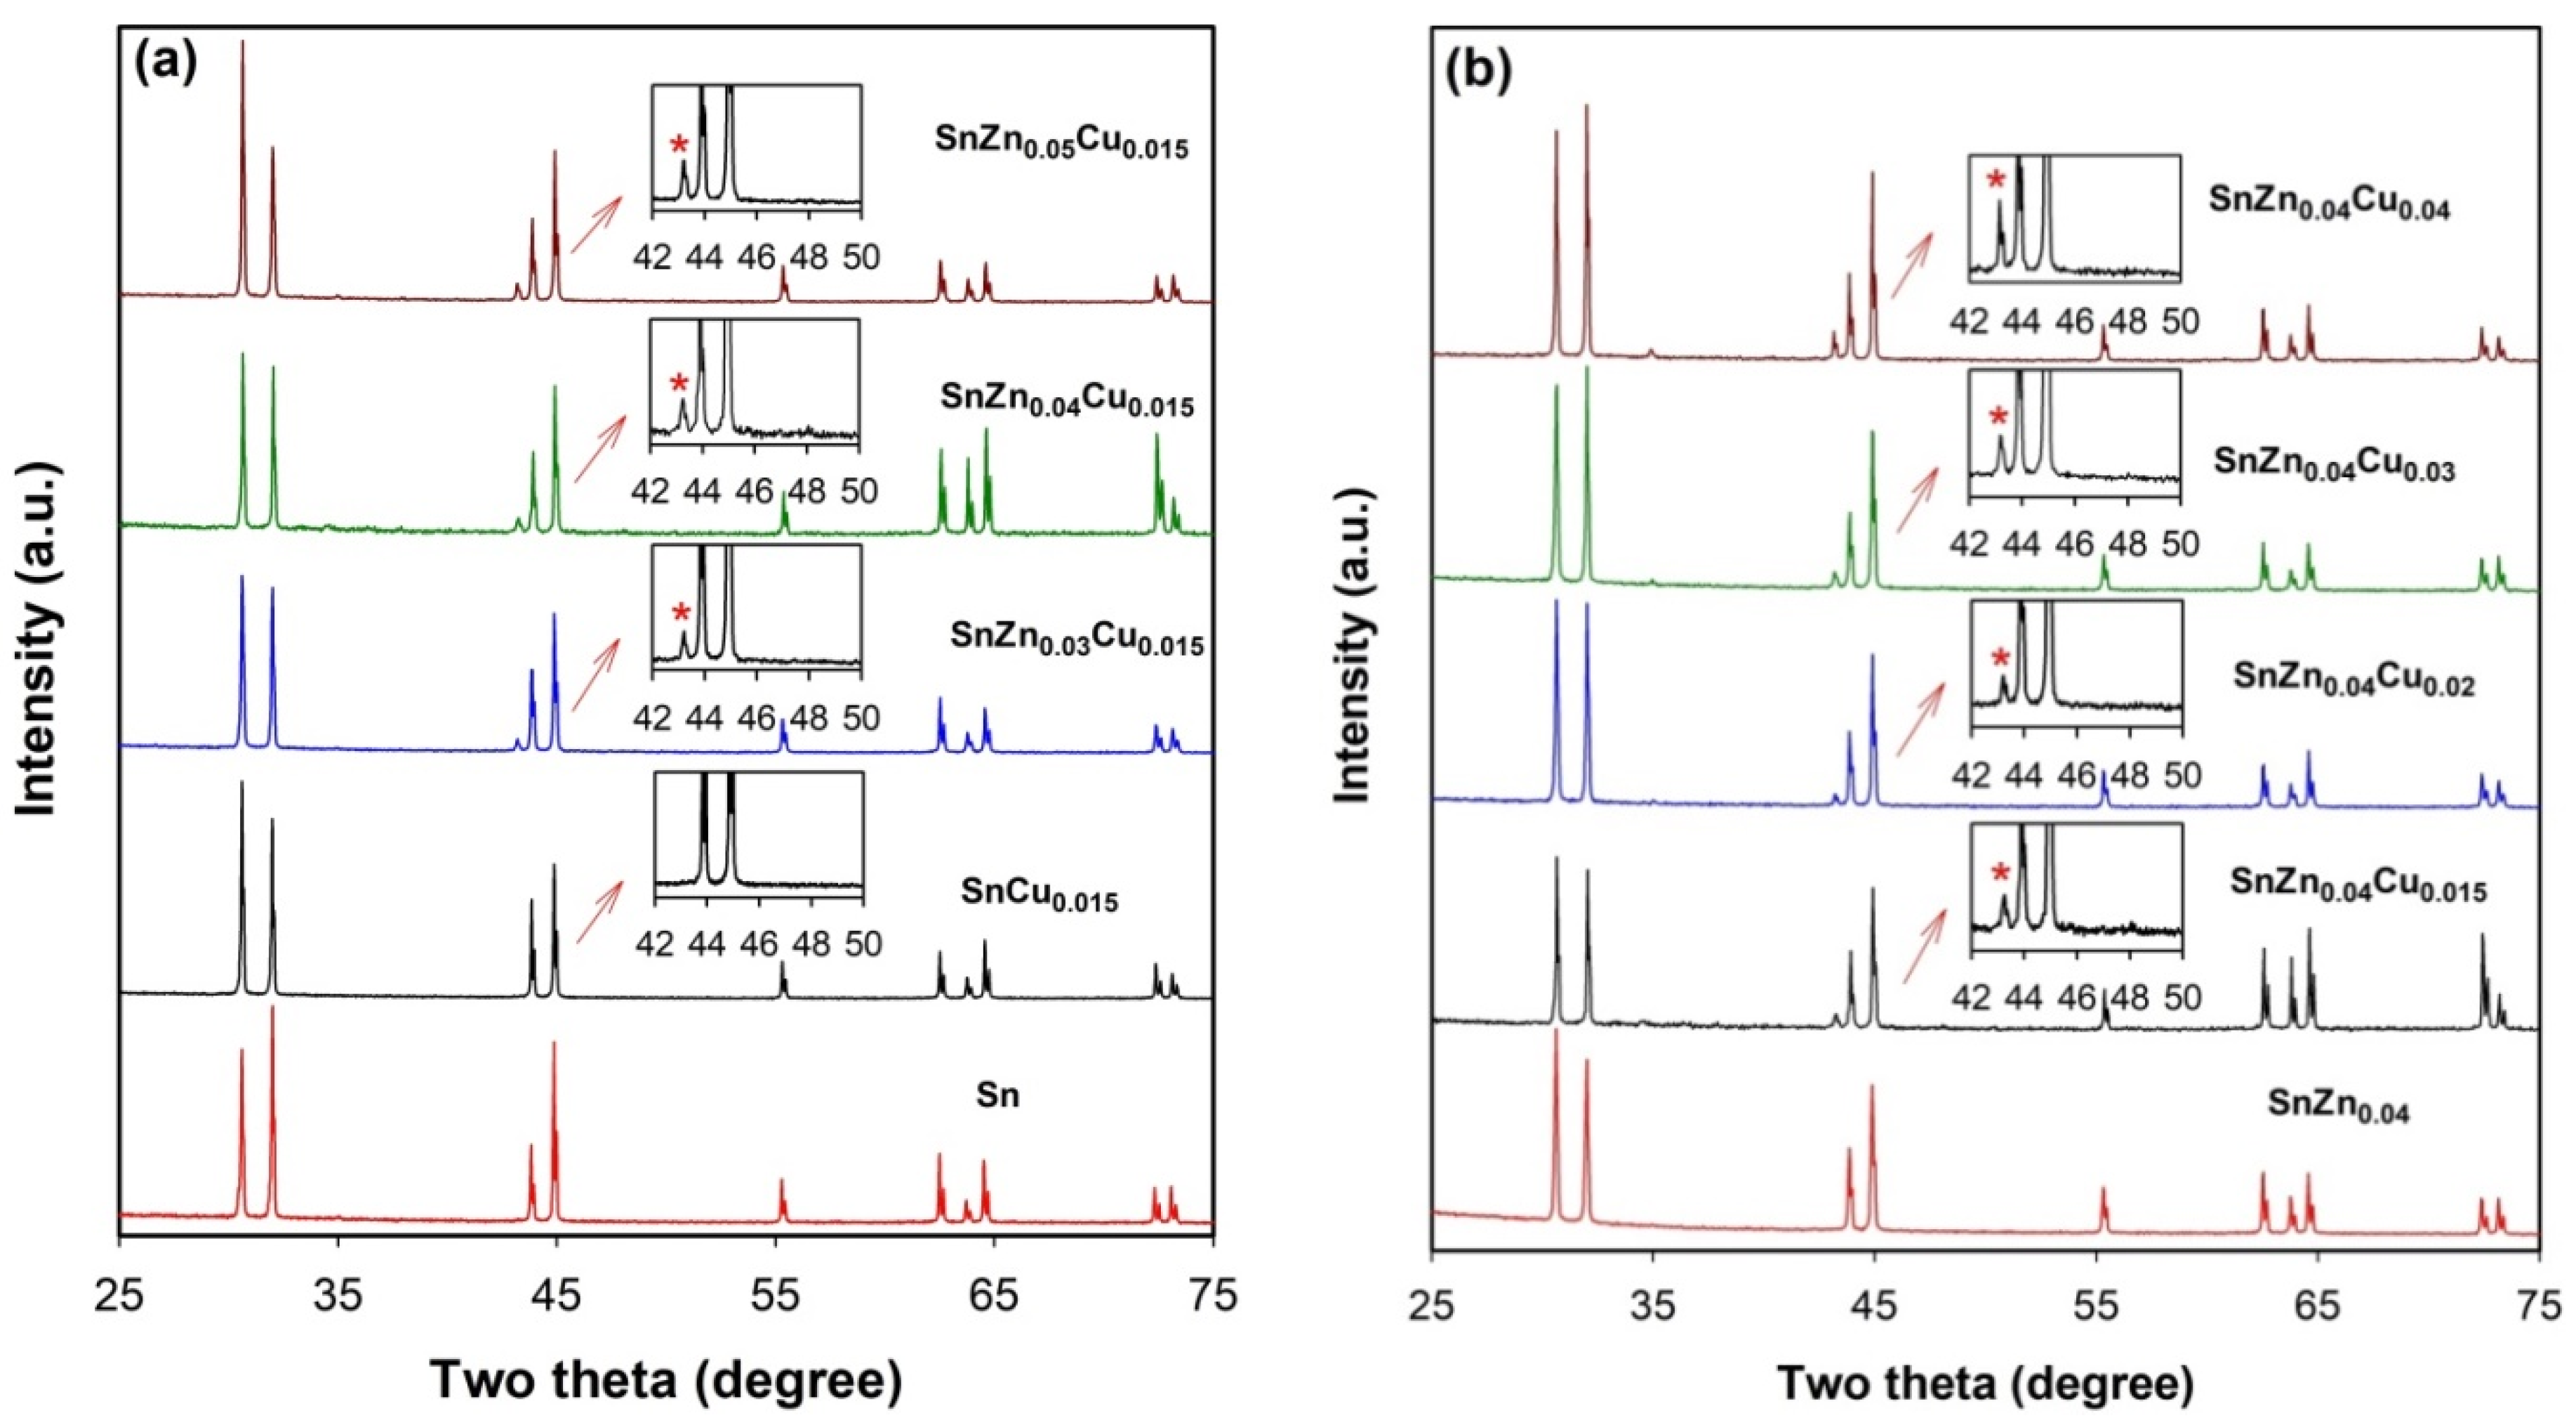
Figure 5 presents the XRD patterns of as-prepared SnZnCu microspheres with different amounts of Zn (Figure 5a) or different amounts of Cu (Figure 5b). For comparison, the XRD patterns of Sn, SnCu0.015, and SnZn0.04 are also shown. For all microspheres, the peaks observed at 2θ of 30.6°, 32.0°, 43.9°, 44.9°, 55.4°, 62.5°, 63.8°, 64.6°, 72.4°, and 73.1° can all be indexed to metal Sn with a tetragonal structure (space group I41/amd, JCPDS 04-0673) and correspond to the diffractions of (200), (101), (220), (211), (301), (112), (400), (321), (420), and (411) planes, respectively. The absence of the diffraction peaks of Sn oxides, Cu oxides, or Zn oxides indicates that the Ar gas protection can avoid the oxidation of metal droplets during ultrasonic emulsification. In the XRD patterns of SnCu0.015 microspheres (Figure 5a), no peaks which can be attributed to Cu or Sn–Cu intermetallic compounds can be observed. A similar phenomenon can be found in the XRD patterns of SnZn0.04 microspheres where no diffraction peaks of Zn appear (Figure 5b). According to the phase diagrams of Sn–Cu [26] and Sn–Zn [27], there is a eutectic reaction L = Cu6Sn5 + Sn at 1.66 at.% Cu and a temperature of 227 °C in the Sn–Cu system and a eutectic reaction L = Zn + Sn at about 14.9 at.% Zn and 199 °C in the Sn–Zn system. Hence, at a low solidification rate, Cu6Sn5 or Zn phase should be observed when the temperature of the system reaches room temperature. No Cu6Sn5 or Zn phase observed in SnCu0.015 or SnZn0.04 microspheres indicate that Cu or Zn is highly dispersed in the Sn matrix due to rapid cooling.
Owing to the much lower solubility of Cu in Sn compared to that of Zn in Sn at a temperature close to the melting point of Sn [26,27], however, new peaks appear in the XRD patterns of SnCu microspheres when the amount of Cu is raised to 3.0 at.% (Figure S2). These peaks at 2θ of 30.1°, 42.3°, and 43.3° can be attributed to the diffractions of (22-1), (132), and (42-2) of the intermetallic compound Cu6Sn5 with a monoclinic structure (space group C2/c, JCPDS 45-1488). The formation of the Cu6Sn5 phase, rather than the Cu phase, is consistent with the result obtained from the Sn–Cu phase diagram for a system containing small amounts of Cu [26]. However, such an intermetallic phase cannot be found when both Zn and Cu are added to Sn, e.g., 3.0–5.0 at.% of Zn is added into SnCu0.015 (see Figure 5a) or 1.5–4.0 at.% of Cu is added into SnZn0.04 (see Figure 5b). Instead, a new peak at 2θ of about 43.2° appears in the XRD patterns of these SnZnCu microspheres. Since this peak is absent in the XRD patterns of SnCu0.015, SnCu0.02, SnCu0.03, and SnZn0.04 microspheres, it is speculated that this peak should be related to the formation of another intermetallic phase Cu5Zn8 with a cubic structure and correspond to the diffraction of (330) plane (JCPDS 41-1435). This Cu5Zn8 phase has been reported to be formed via an interfacial reaction between the Sn–Zn solders and Cu substrate [28] or by melting Cu and Zn powders in an electric arc discharge synthesis [29]. In fact, the Cu5Zn8 phase is an equilibrium phase for a system containing 3.0–5.0 at.% of Zn and 1.5 at.% of Cu at room temperature based on the isothermal sections of the Sn–Zn–Cu system at 210 °C [30]. The formation of the Cu5Zn8 phase in SnZnCu microspheres demonstrates that Cu atoms are preferentially segregated to Zn atoms, rather than Sn atoms. As will be shown below, the presence of the Cu5Zn8 phase is much more effective than the Cu6Sn5 phase for inducing heterogeneous nucleation that may significantly reduce the undercooling.
The undercooling in this work is defined as the difference between the onset temperatures of melting (Tonset,m) and solidification (Tonset,s) in DSC measurement [20,21,
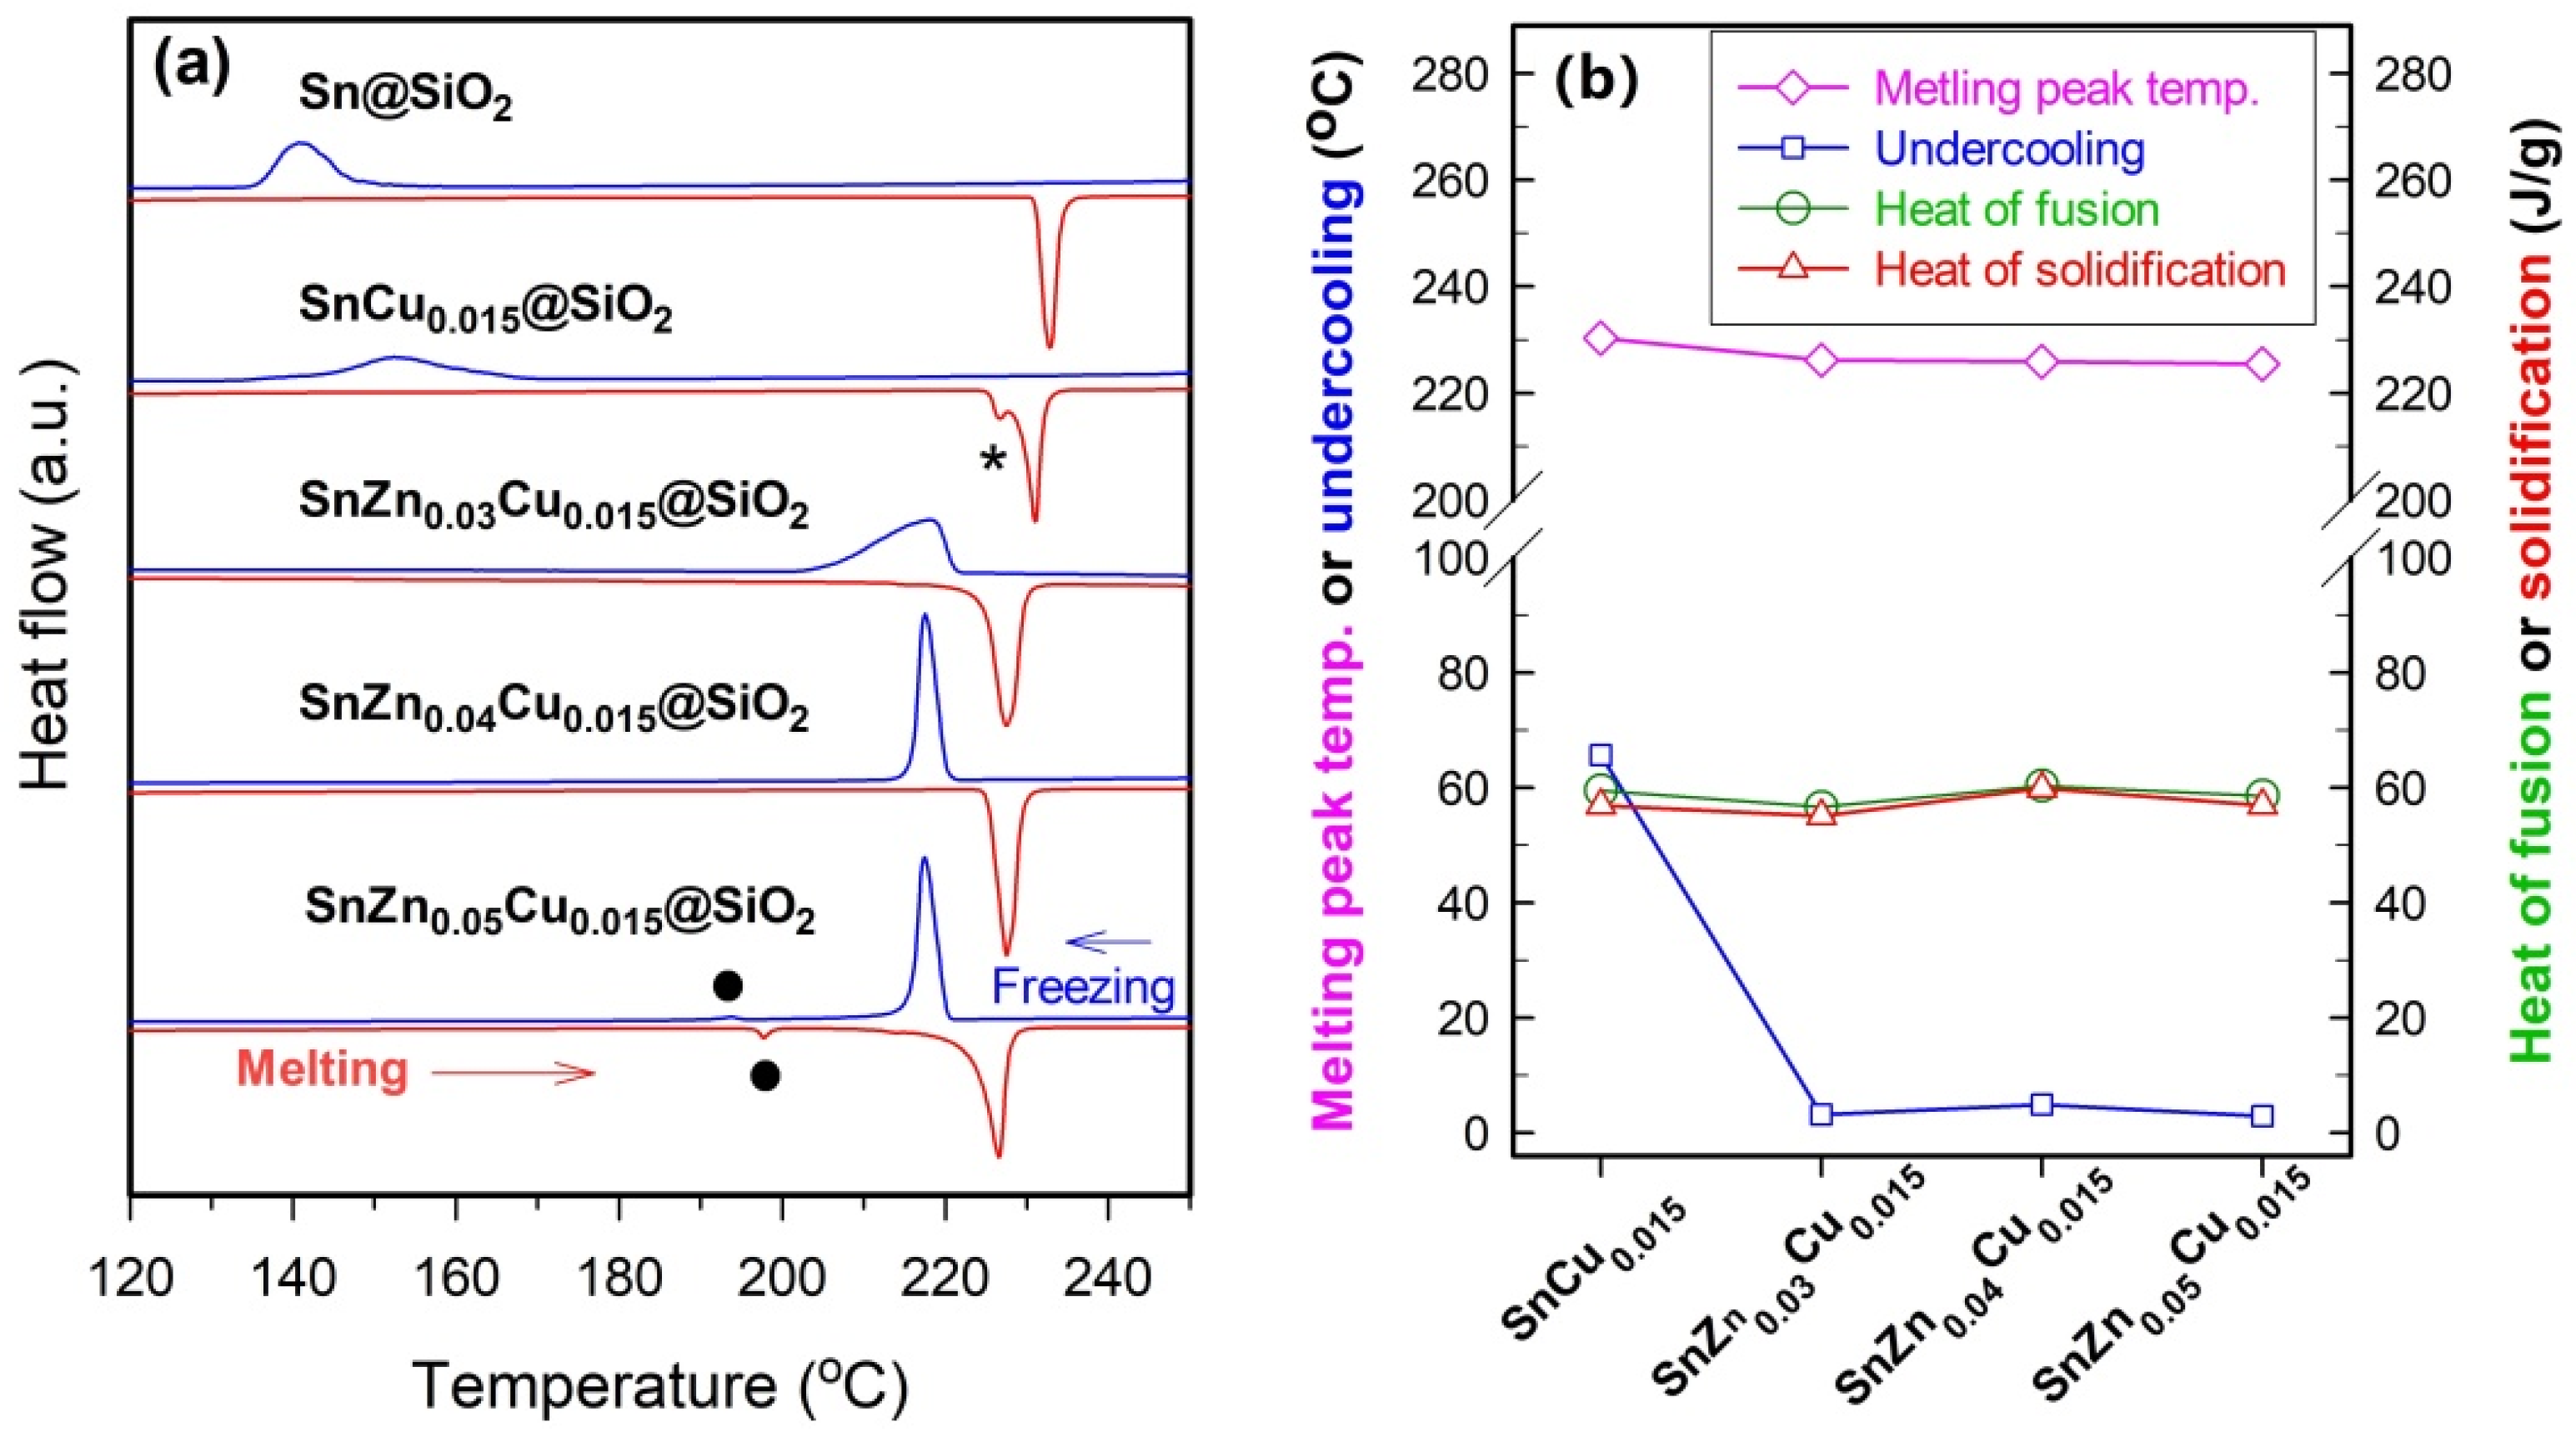
23]. The value of the onset temperature of melting or solidification was determined by the intersection of the heat flow curve with the baseline during the melting or solidification process. As shown in Figure 6a, the onset temperature of solidification of Sn in Sn@SiO2 microspheres is about 147.0 °C and the undercooling obtained is around 83.7 °C. The very high undercooling observed for Sn@SiO2 microspheres indicates that the homogenous nucleation dominates in the Sn solidification process despite the presence of SiO2 shell. Although the addition of small amounts of Cu (1.5 at.%) may facilitate the solidification of Sn and thus SnCu0.015@SiO2 microspheres have a lower undercooling (about 57 °C) compared to Sn@SiO2 microspheres (Figure 6b), the resulting undercooling is still too high for practical application. In addition, a very broad freezing peak is observed in SnCu0.015@SiO2 microspheres. Since under the same experimental conditions, a wider melting/freezing peak implies a broader melting/freezing range despite that the value of the peak width depends on the heating/cooling rate and the mass of the sample measured, the broad freezing peak suggests a wide temperature range needed for totally releasing the latent heat. This phenomenon also exists in SnCu0.02@SiO2 or SnCu0.03@SiO2 microspheres with the presence of the Cu6Sn5 phase (Figure S3 in Supplementary Materials). These results hint that the Cu6Sn5 phase cannot provide very effective sites for rapid nucleation and solidification of liquid Sn.
To further reduce the undercooling and narrow the freezing range, 3.0–5.0 at.% of Zn, which is much higher than 1.1 at.% used in Sn-based solders, is introduced into SnCu0.015@SiO2 microspheres (Figure 6). The addition of 3.0–5.0 at.% Zn can significantly reduce undercooling. For example, the values of undercooling of SnZn0.03Cu0.015@SiO2, SnZn0.04Cu0.015@SiO2, and SnZn0.05Cu0.015@SiO2 microspheres are about 3.2, 4.9, and 2.8 °C, respectively. Furthermore, the exothermic peak of SnZn0.04Cu0.015@SiO2 or SnZn0.05Cu0.015@SiO2 microspheres is much sharper than that of Sn@SiO2 or SnCu0.015@SiO2 microspheres, suggesting that addition of 4.0 or 5.0 at.% Zn can greatly reduce the freezing range. As indicated by the difference in phase composition between SnCu0.015@SiO2 and SnZn0.03–0.05Cu0.015@SiO2 microspheres (Figure 5a), the significant promotion effect on the solidification of liquid Sn observed in these SnZnCu@SiO2 microspheres should be related to the formation of the Cu5Zn8 phase. In addition, by comparing these observations with the result obtained from SnCu0.03@SiO2 microspheres in the presence of Cu6Sn5 phase, it is inferred that the Cu5Zn8 phase can provide much more effective sites for heterogeneous nucleation than the Cu6Sn5 phase. This result is similar to the observation in Sn–Cu–Ni solders that the Ni3Sn4 phase is more effective for undercooling suppression than the Cu6Sn5 phase [22].
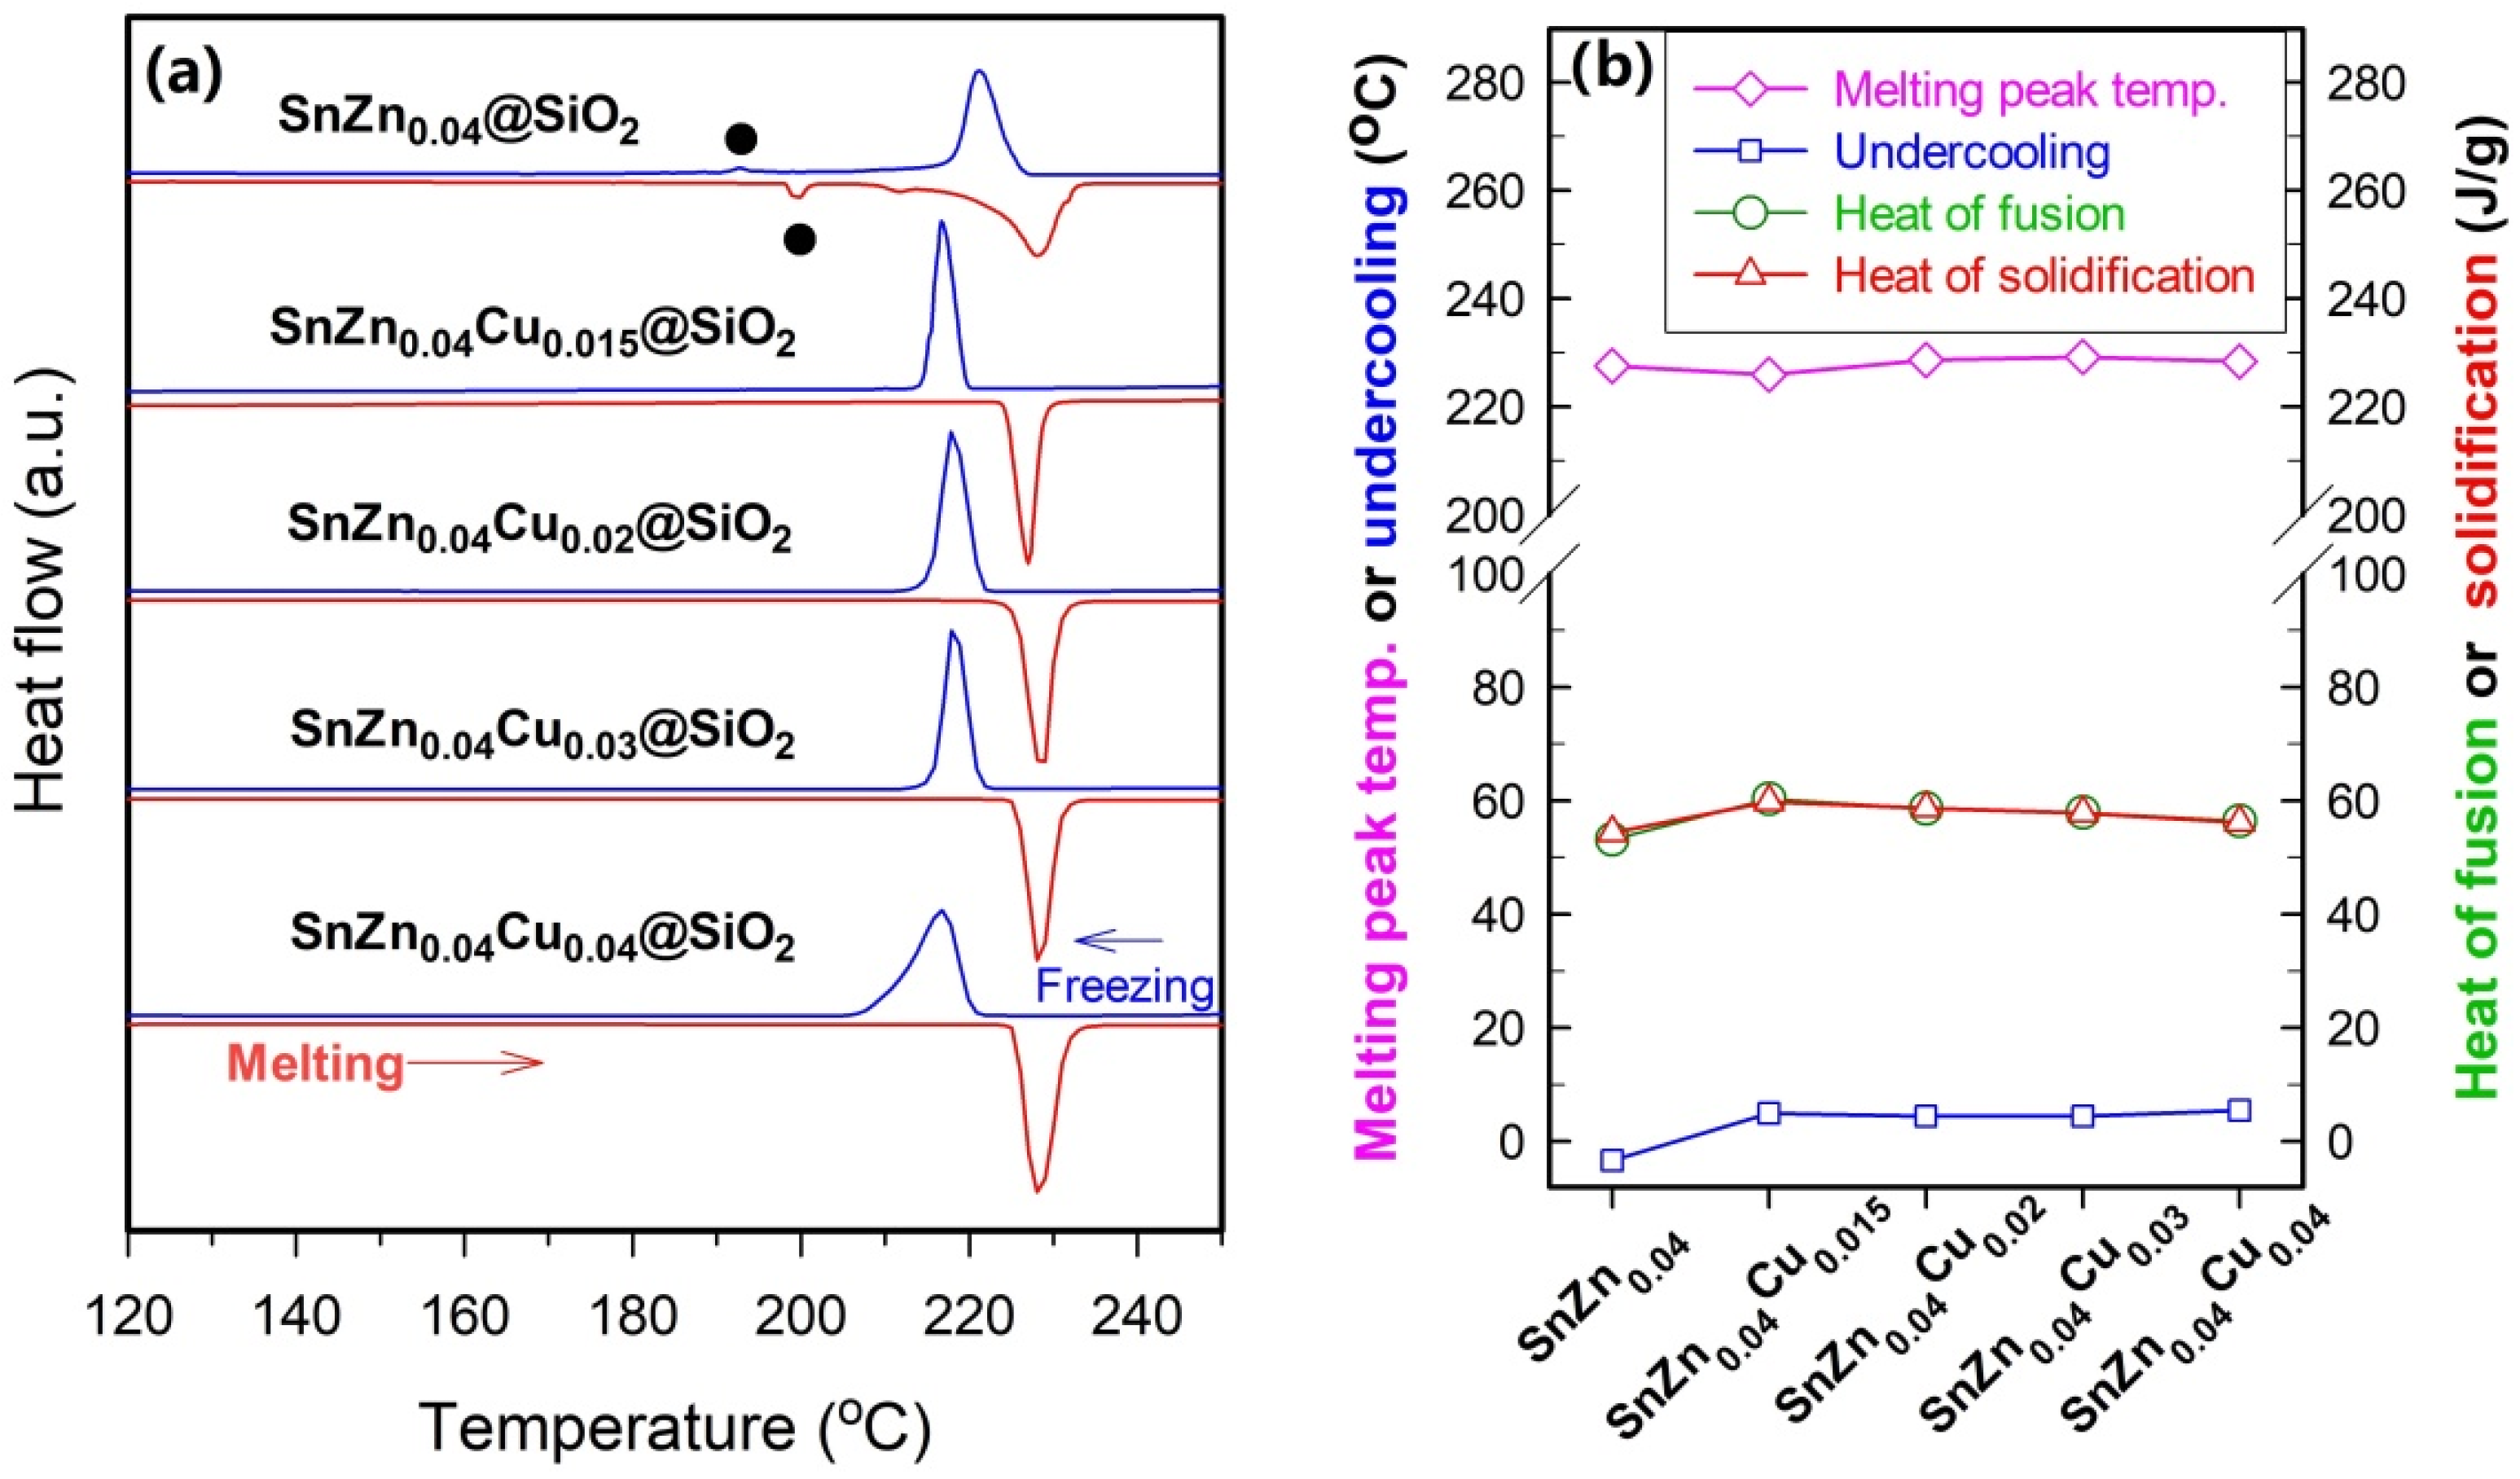
Besides reducing the undercooling and narrowing the freezing range, the addition of 4.0 at.% Zn also results in a sharp, symmetrical melting peak with its peak temperature being slightly lower than that of Sn@SiO2 microspheres (Figure 6a). The sharp melting peak hints at a very narrow melting range, which is a common feature of a pure substance or a eutectic mixture, hinting that Sn–Zn–Cu eutectic forms in SnZn0.04Cu0.015@SiO2 microspheres probably because the chemical composition of SnZn0.04Cu0.015 microspheres is close to that of Sn–Zn–Cu eutectic. According to the method for determination of eutectic by DSC [31], the speculation that the addition of 4 at.% Zn leads to a chemical composition close to the composition of Sn–Zn–Cu eutectic is supported by the result that when 3.0 or 5.0 at.% Zn is added, the melting peak is obviously broader than that of SnZn0.04Cu0.015@SiO2 microspheres (Figure 6a). In addition, when 5.0 at.% Zn is added, a pair of new but weak peaks appear in the melting and solidification processes (indicated by solid circles in Figure 6a), indicating that 5.0 at.% Zn is obviously larger than the amount of Zn in the Sn–Zn–Cu eutectic. Based on the Sn–Zn phase diagram [27], an endothermic peak temperature of around 197 °C hints at the formation of SnZn0.15 eutectic in SnZn0.05Cu0.015@SiO2 microspheres. It is also interesting to note that the chemical composition of SnZn0.04Cu0.015 microspheres is very similar to that of another Sn-based ternary eutectic, namely Sn–Ag–Cu eutectic with 3.5 wt.% Ag and 0.9 wt.% Cu (namely about 3.81 at.% Ag and 1.66 at.% Cu) [32].
The above results demonstrate that addition of 4.0 at.% Zn is crucial for achieving a type of SnZnCu@SiO2 microsphere (namely SnZn0.04Cu0.015@SiO2 microsphere) with very low undercooling and narrow freezing/melting peak width via the formation of both Sn–Zn–Cu ternary eutectic and intermetallic phase Cu5Zn8. In order to further understand the effect of Cu amount on the phase change properties of SnZnCu@SiO2 microspheres, the amount of Cu is raised from 1.5 to 4.0 at.% (Figure 7). In the absence of Cu, the primary endothermic peak of SnZn0.04@SiO2 microspheres is broad and asymmetrical, and a pair of weak peaks appear in the melting and solidification processes (indicated by solid circles in Figure 7a), hinting at the formation of a small amount of SnZn0.15 eutectic. Based on the Sn–Zn phase diagram [27], the observed broad and asymmetrical endothermic peak is consistent with the fact that its chemical composition greatly deviates from that of Sn–Zn eutectic and is the reason for a negative value (−3.41 °C) of undercooling obtained in SnZn0.04@SiO2 microspheres. It is interesting to find that raising the amount of Cu from 1.5 at.% to 2.0 or 3.0 at.% has no significant impact on both the undercooling and the freezing/melting peak width, and all three types of SnZnCu@SiO2 microspheres, namely SnZn0.04Cu0.015@SiO2, SnZn0.04Cu0.02@SiO2, and SnZn0.04Cu0.03@SiO2 microspheres, own a very low undercooling and sharp freezing/melting peaks. However, when the amount of Cu is raised to 4.0 at.%, both the melting peak and the freezing peak become broader compared to those of SnZn0.04Cu0.015@SiO2 microspheres, suggesting that the chemical composition has obviously deviated from that of Sn–Zn–Cu ternary eutectic.

2.3. Thermal Cycling Stability of SnZnCu@SiO2 Microspheres and the Factors Governing Thermal Stability

The understanding of the thermal cycling stability of SnZnCu@SiO2 microspheres is important for their long-term application. Since SnZn0.04Cu0.015@SiO2, SnZn0.04Cu0.02@SiO2, and SnZn0.04Cu0.03@SiO2 microspheres show similar phase change properties despite having different amounts of Cu, the thermal cycling stability of all three samples is investigated by measuring their phase change properties after repeated heating-cooling cycles between 200 and 250 °C. 
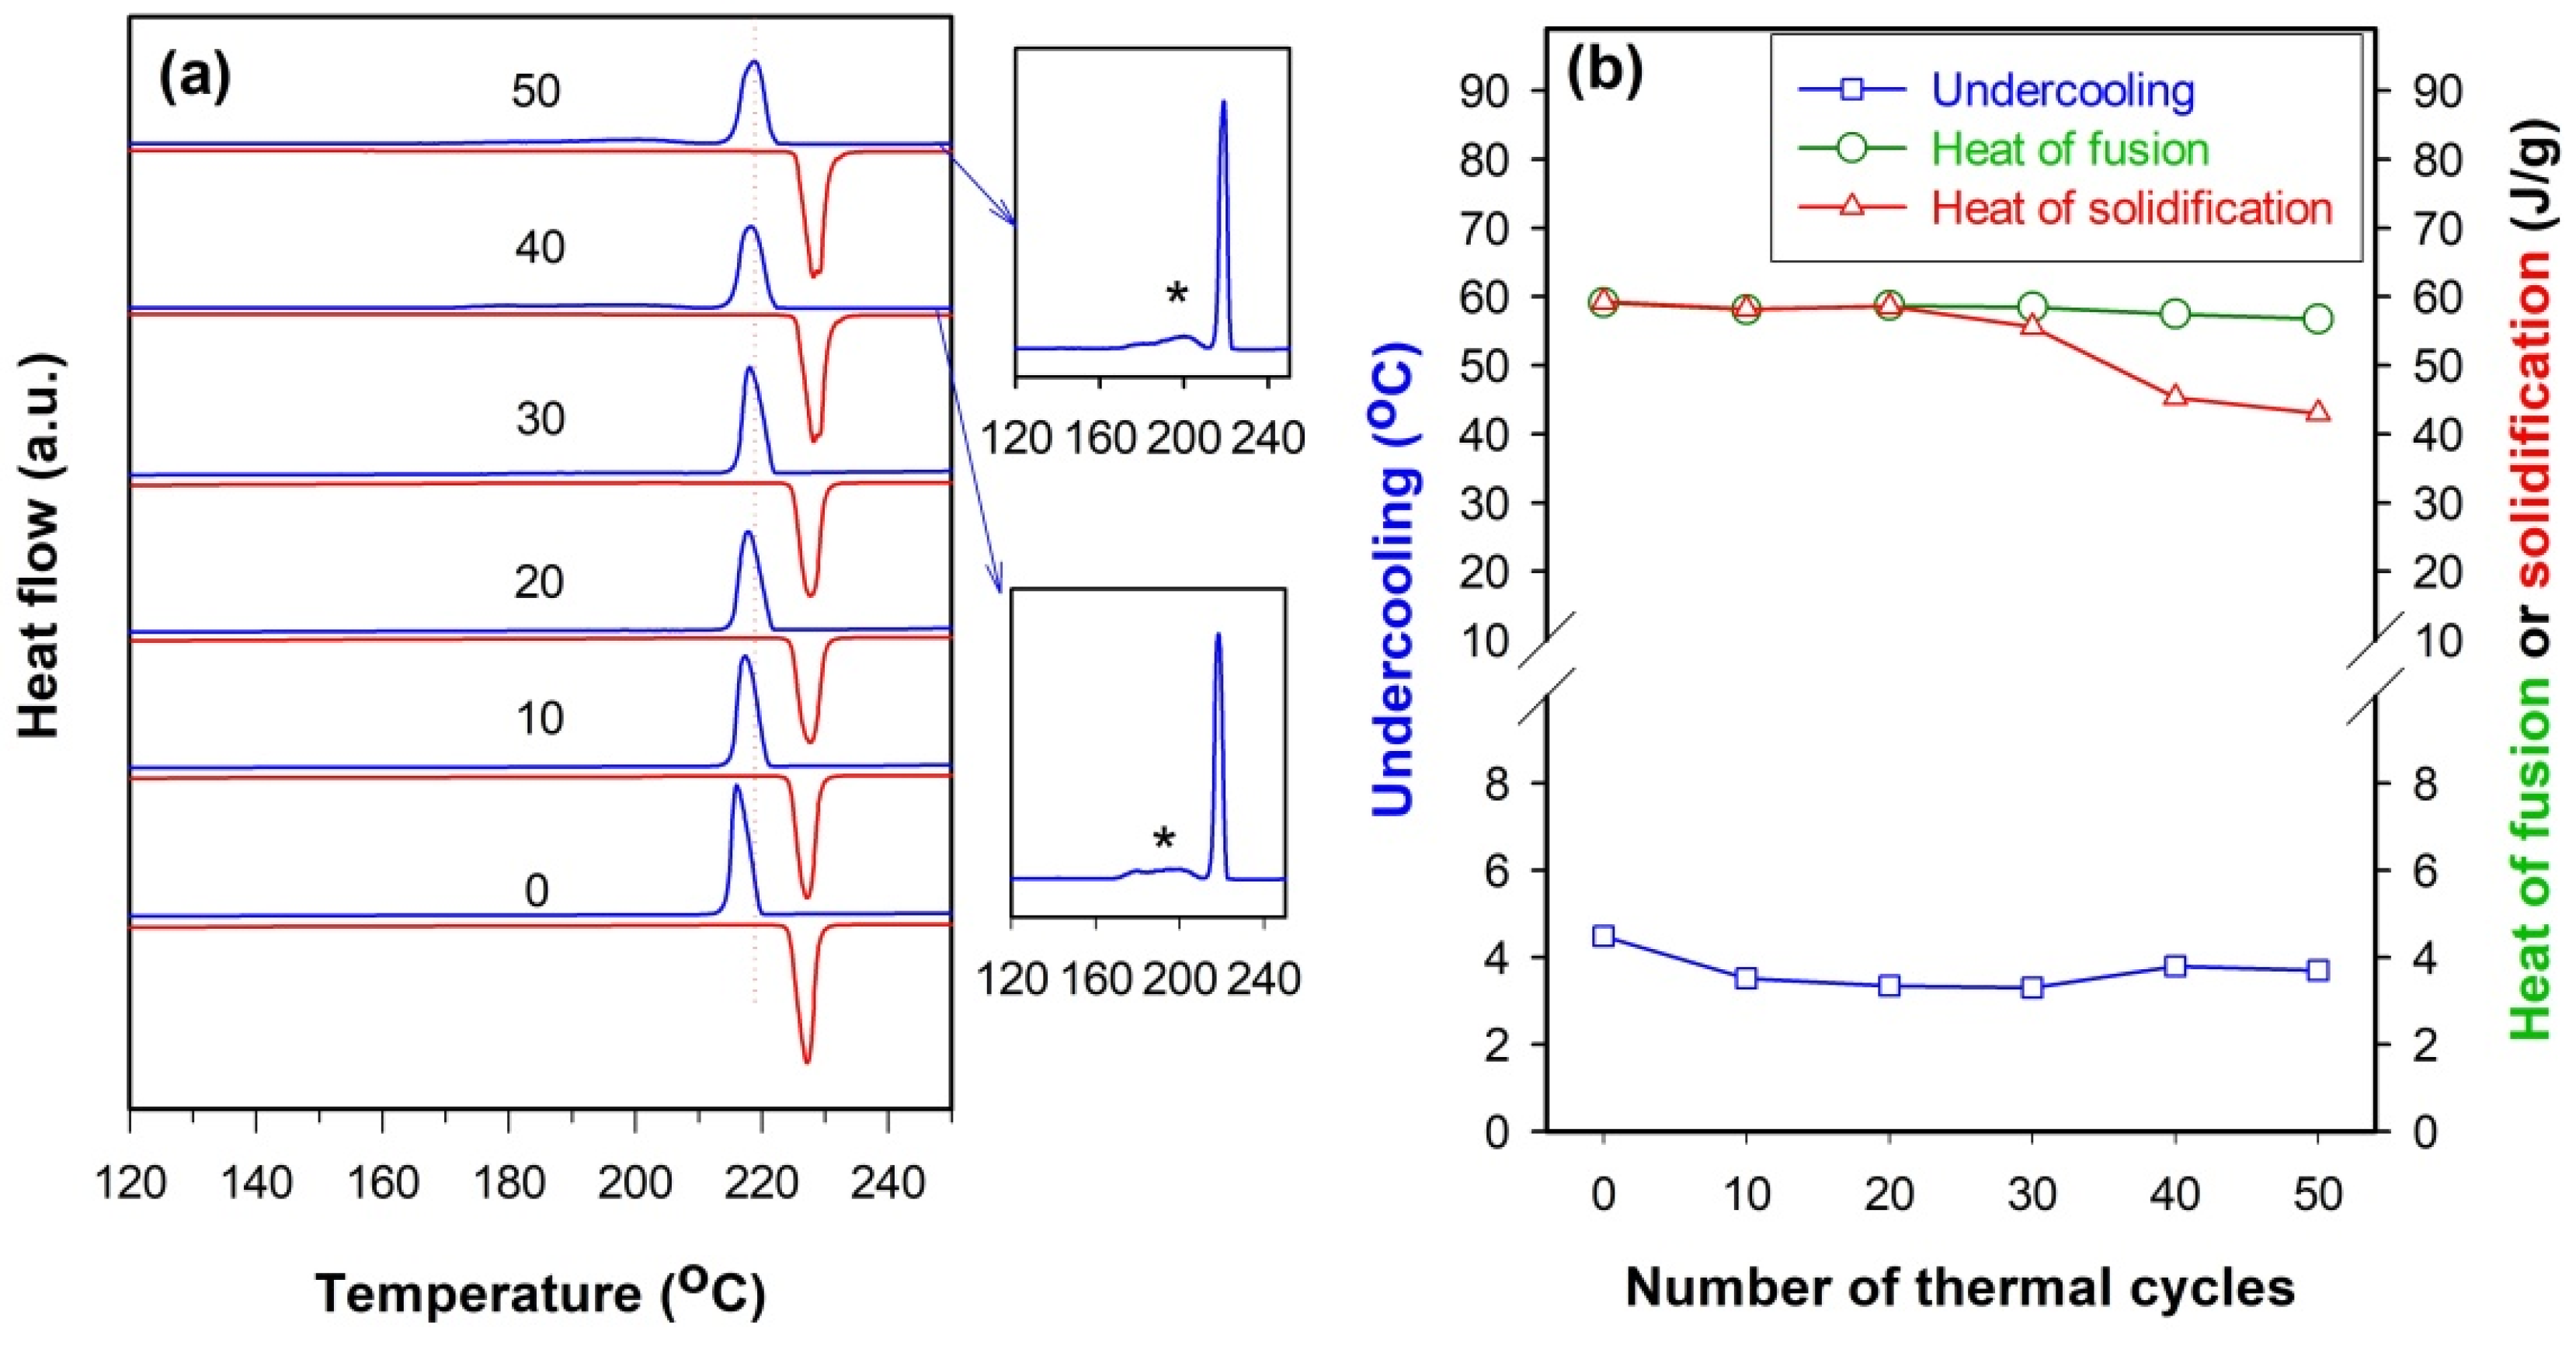
Figure 8a displays the DSC curves of the SnZn0.04Cu0.015@SiO2 microspheres after being subjected to different numbers of thermal cycles. The plot of both the undercooling and the heat of fusion or solidification as a function of the number of thermal cycles is shown in Figure 8b (note that the heat of solidification is calculated based on the first exothermic peak if there are two or more peaks appearing in the solidification process). It is clear from Figure 8 that, although the freezing peak gradually shifts to the right and thus the undercooling decreases slightly as the number of thermal cycles increases to 30, there is no remarkable change in both heat of fusion and heat of solidification with the latter being almost equal to the former if the number of thermal cycles is not more than 30. When the number of thermal cycles reaches 40 or above, however, a new broad exothermic peak appears in the low-temperature region (indicated by a star in the insets of Figure 8a) and thus results in an obvious decrease in heat of solidification that is calculated on the first exothermic peak (see Figure 8b). These observations suggest that SnZn0.04Cu0.015@SiO2 microspheres become thermally unstable after 40 thermal cycles.
In the thermal cycling test of the SnZn0.04Cu0.02@SiO2 microspheres, a similar thermal instability can be observed (see Figure 9). However, the broad exothermic peak is observed clearly only when the number of thermal cycles reaches more than 80 (see insets of Figure 9a). This indicates that the SnZn0.04Cu0.02@SiO2 microspheres are more thermally stable than the SnZn0.04Cu0.015@SiO2 microspheres and a rise in the amount of Cu can improve the thermal cycling stability of SnZnCu@SiO2 microspheres. The positive effect of the amount of Cu on the thermal cycling stability of SnZnCu@SiO2 microspheres is further supported by the result obtained from the SnZn0.04Cu0.03@SiO
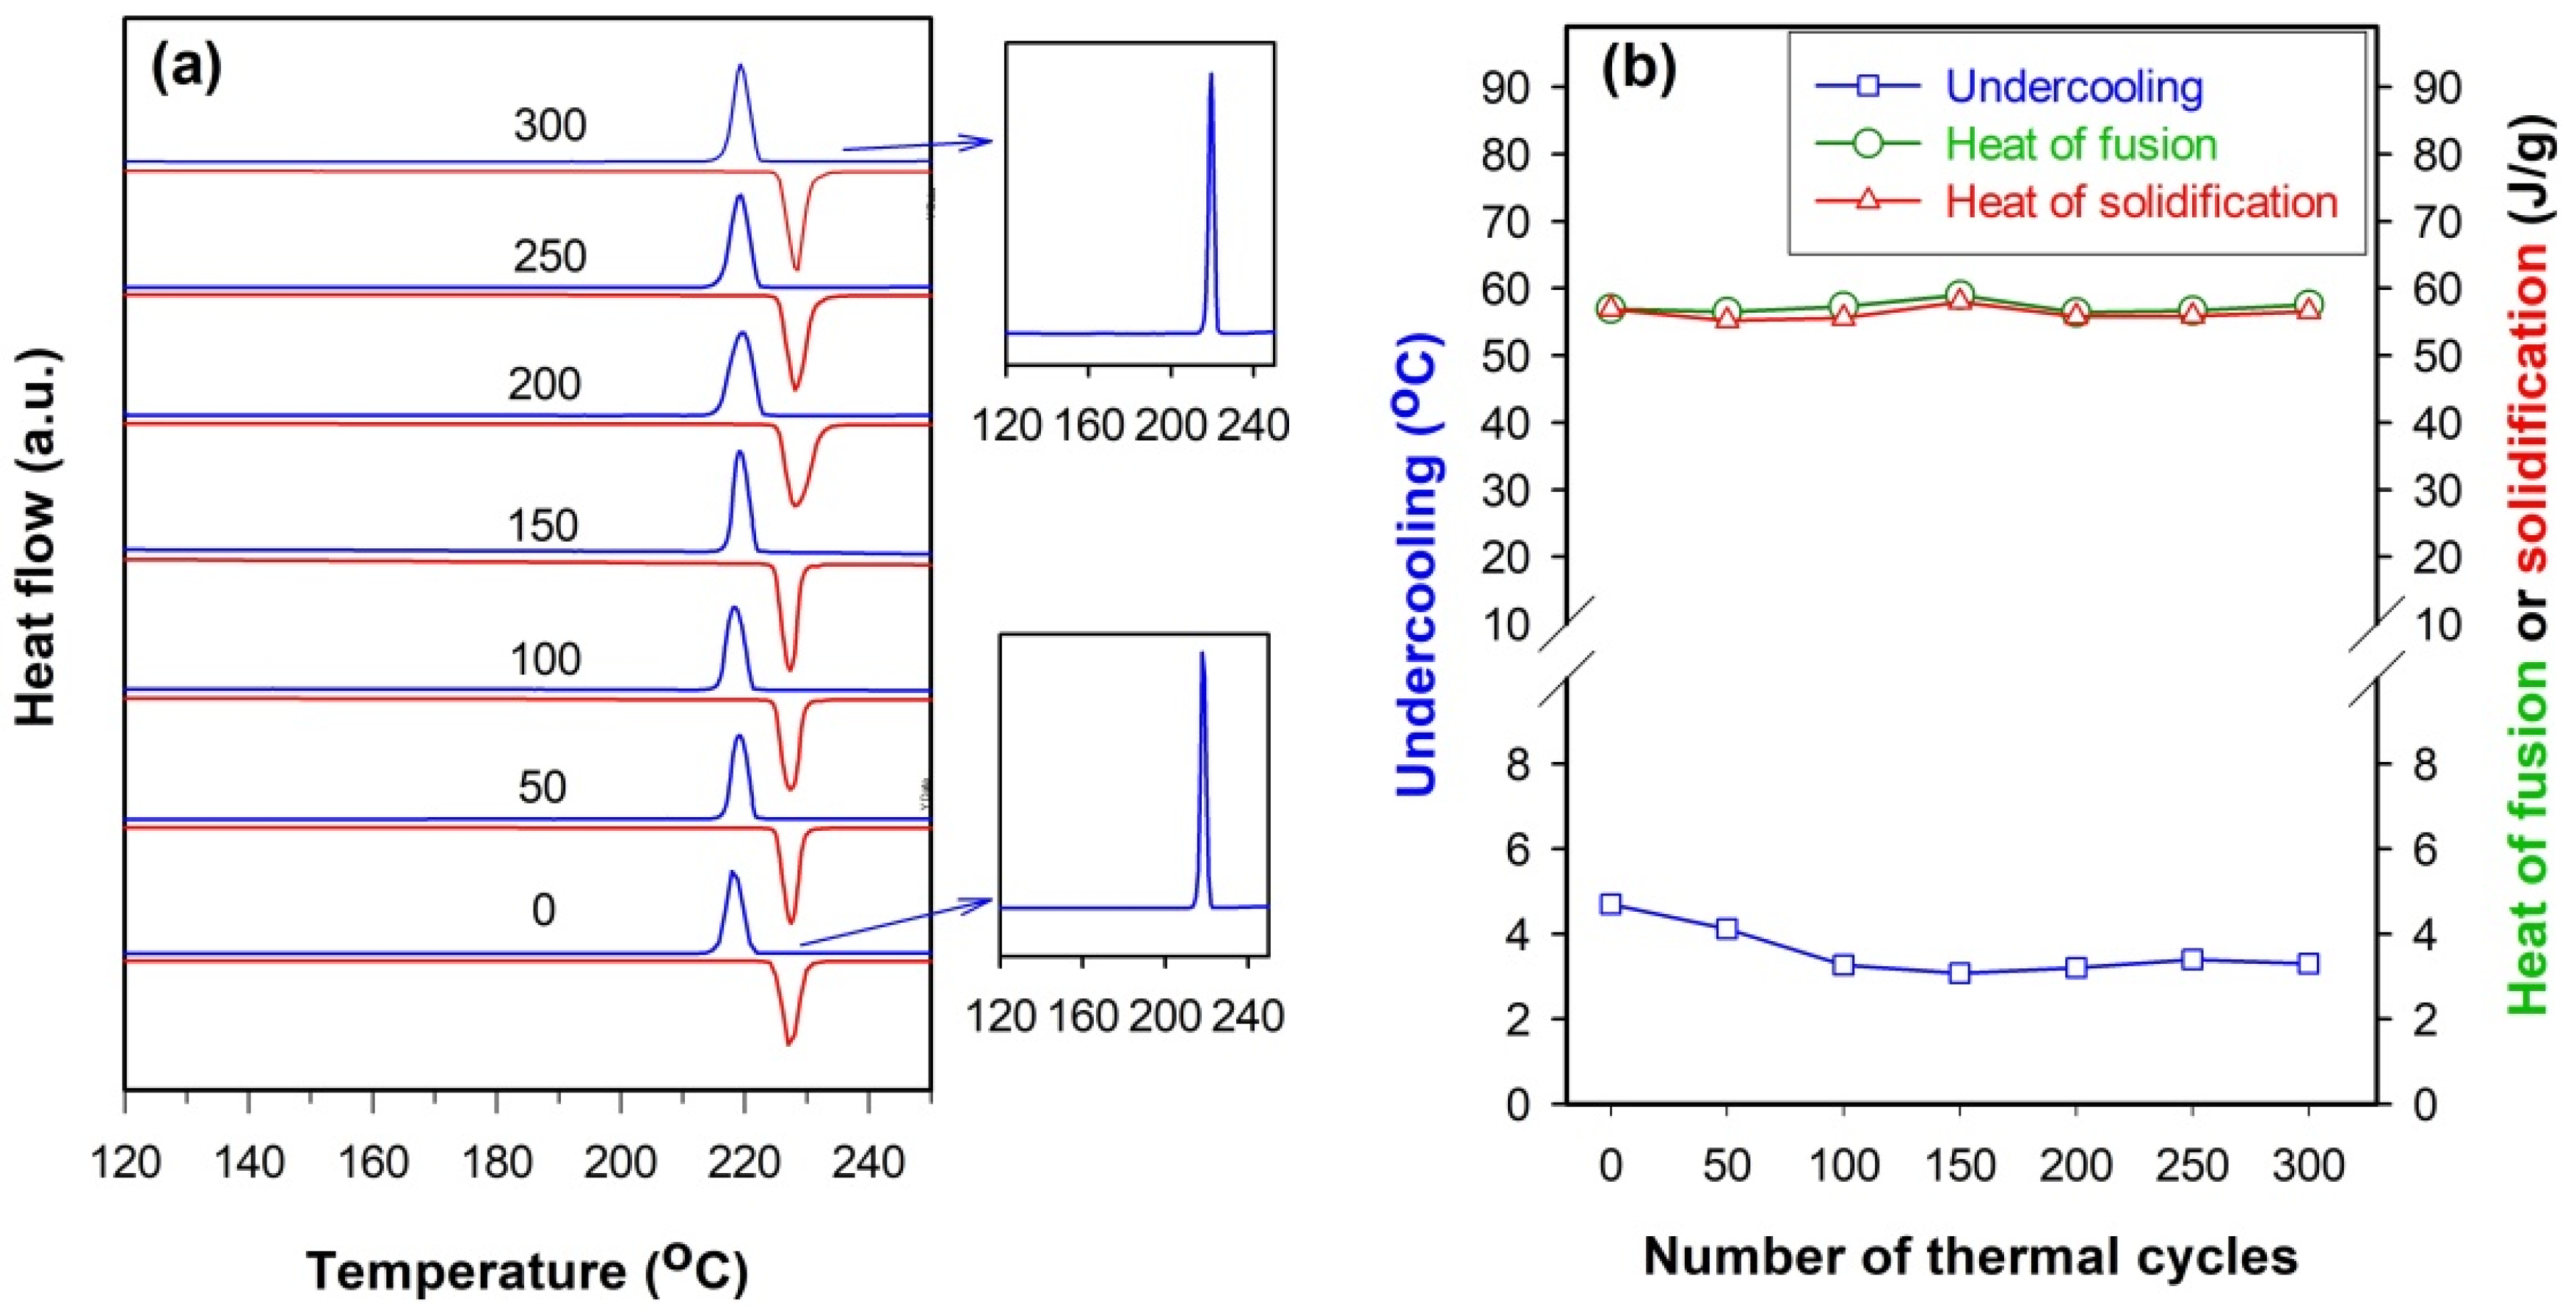
2 microspheres. As shown in Figure 10, except that the undercooling decreases slightly as the number of thermal cycles increases to 150, there is almost no change in heat of fusion or solidification of SnZn0.04Cu0.03@SiO2 microspheres even after 300 thermal cycles. Similar to the untreated sample, no broad exothermic peak appears in the solidification curve after 300 thermal cycles (see insets of Figure 10a), hinting that the thermal cycling stability of the SnZnCu@SiO2 microspheres can be remarkably improved as the amount of Cu increases to about 3.0 at.%.
The high thermal stability of the SnZn0.04Cu0.03@SiO2 microspheres, as well as their very low undercooling and narrow freezing/melting peak width, suggests that they should be a promising PCM for latent heat storage. Table 1 gives a comparison of the properties between SnZn0.04Cu0.03@SiO2 microspheres and some PCMs with a melting point ranging from 220 to 240 °C, including encapsulated Sn and some nitrate salt-based PCMs. Besides having very poor thermal conductivity [4], it is clear from Table 1 that the latent heat of fusion on a volume basis of the nitrate-based PCMs with a melting point close to that of Sn is also less than that of SnZn0.04Cu0.03@SiO2 microspheres, giving SnZn0.04Cu0.03@SiO2 microspheres an edge over those nitrate salts as PCMs used in the case where a limited room is available for PCMs.
As has been mentioned above, a new exothermic peak normally appears in the solidification process when the SnZnCu@SiO2 microspheres are not thermally stable. Compared with the first exothermic peak, this peak is much broader and appears in the lower temperature region. This feature demonstrates that the solidification of some liquid metal needs high undercooling and occurs slowly, which is similar to the solidification process in the SnCu0.015@SiO2 (see Figure 6a) or SnCu0.02@SiO2 microspheres (see Figure S3 in Supplementary Materials). Since the Cu5Zn8 phase contributes significantly to both much lower undercooling and narrower freezing peak of SnZnCu@SiO2 microspheres compared to those of SnCu@SiO2 microspheres, it is speculated that the appearance of a broad exothermic peak indicates a possibility of the decomposition of this phase, which has been observed in the soldered Sn–Ag–Zn/Cu interface [38]. Therefore, the Cu5Zn8 phase was investigated by XRD to understand the origin of thermal instability observed in the SnCuZn@SiO2 microspheres after thermal cycling.
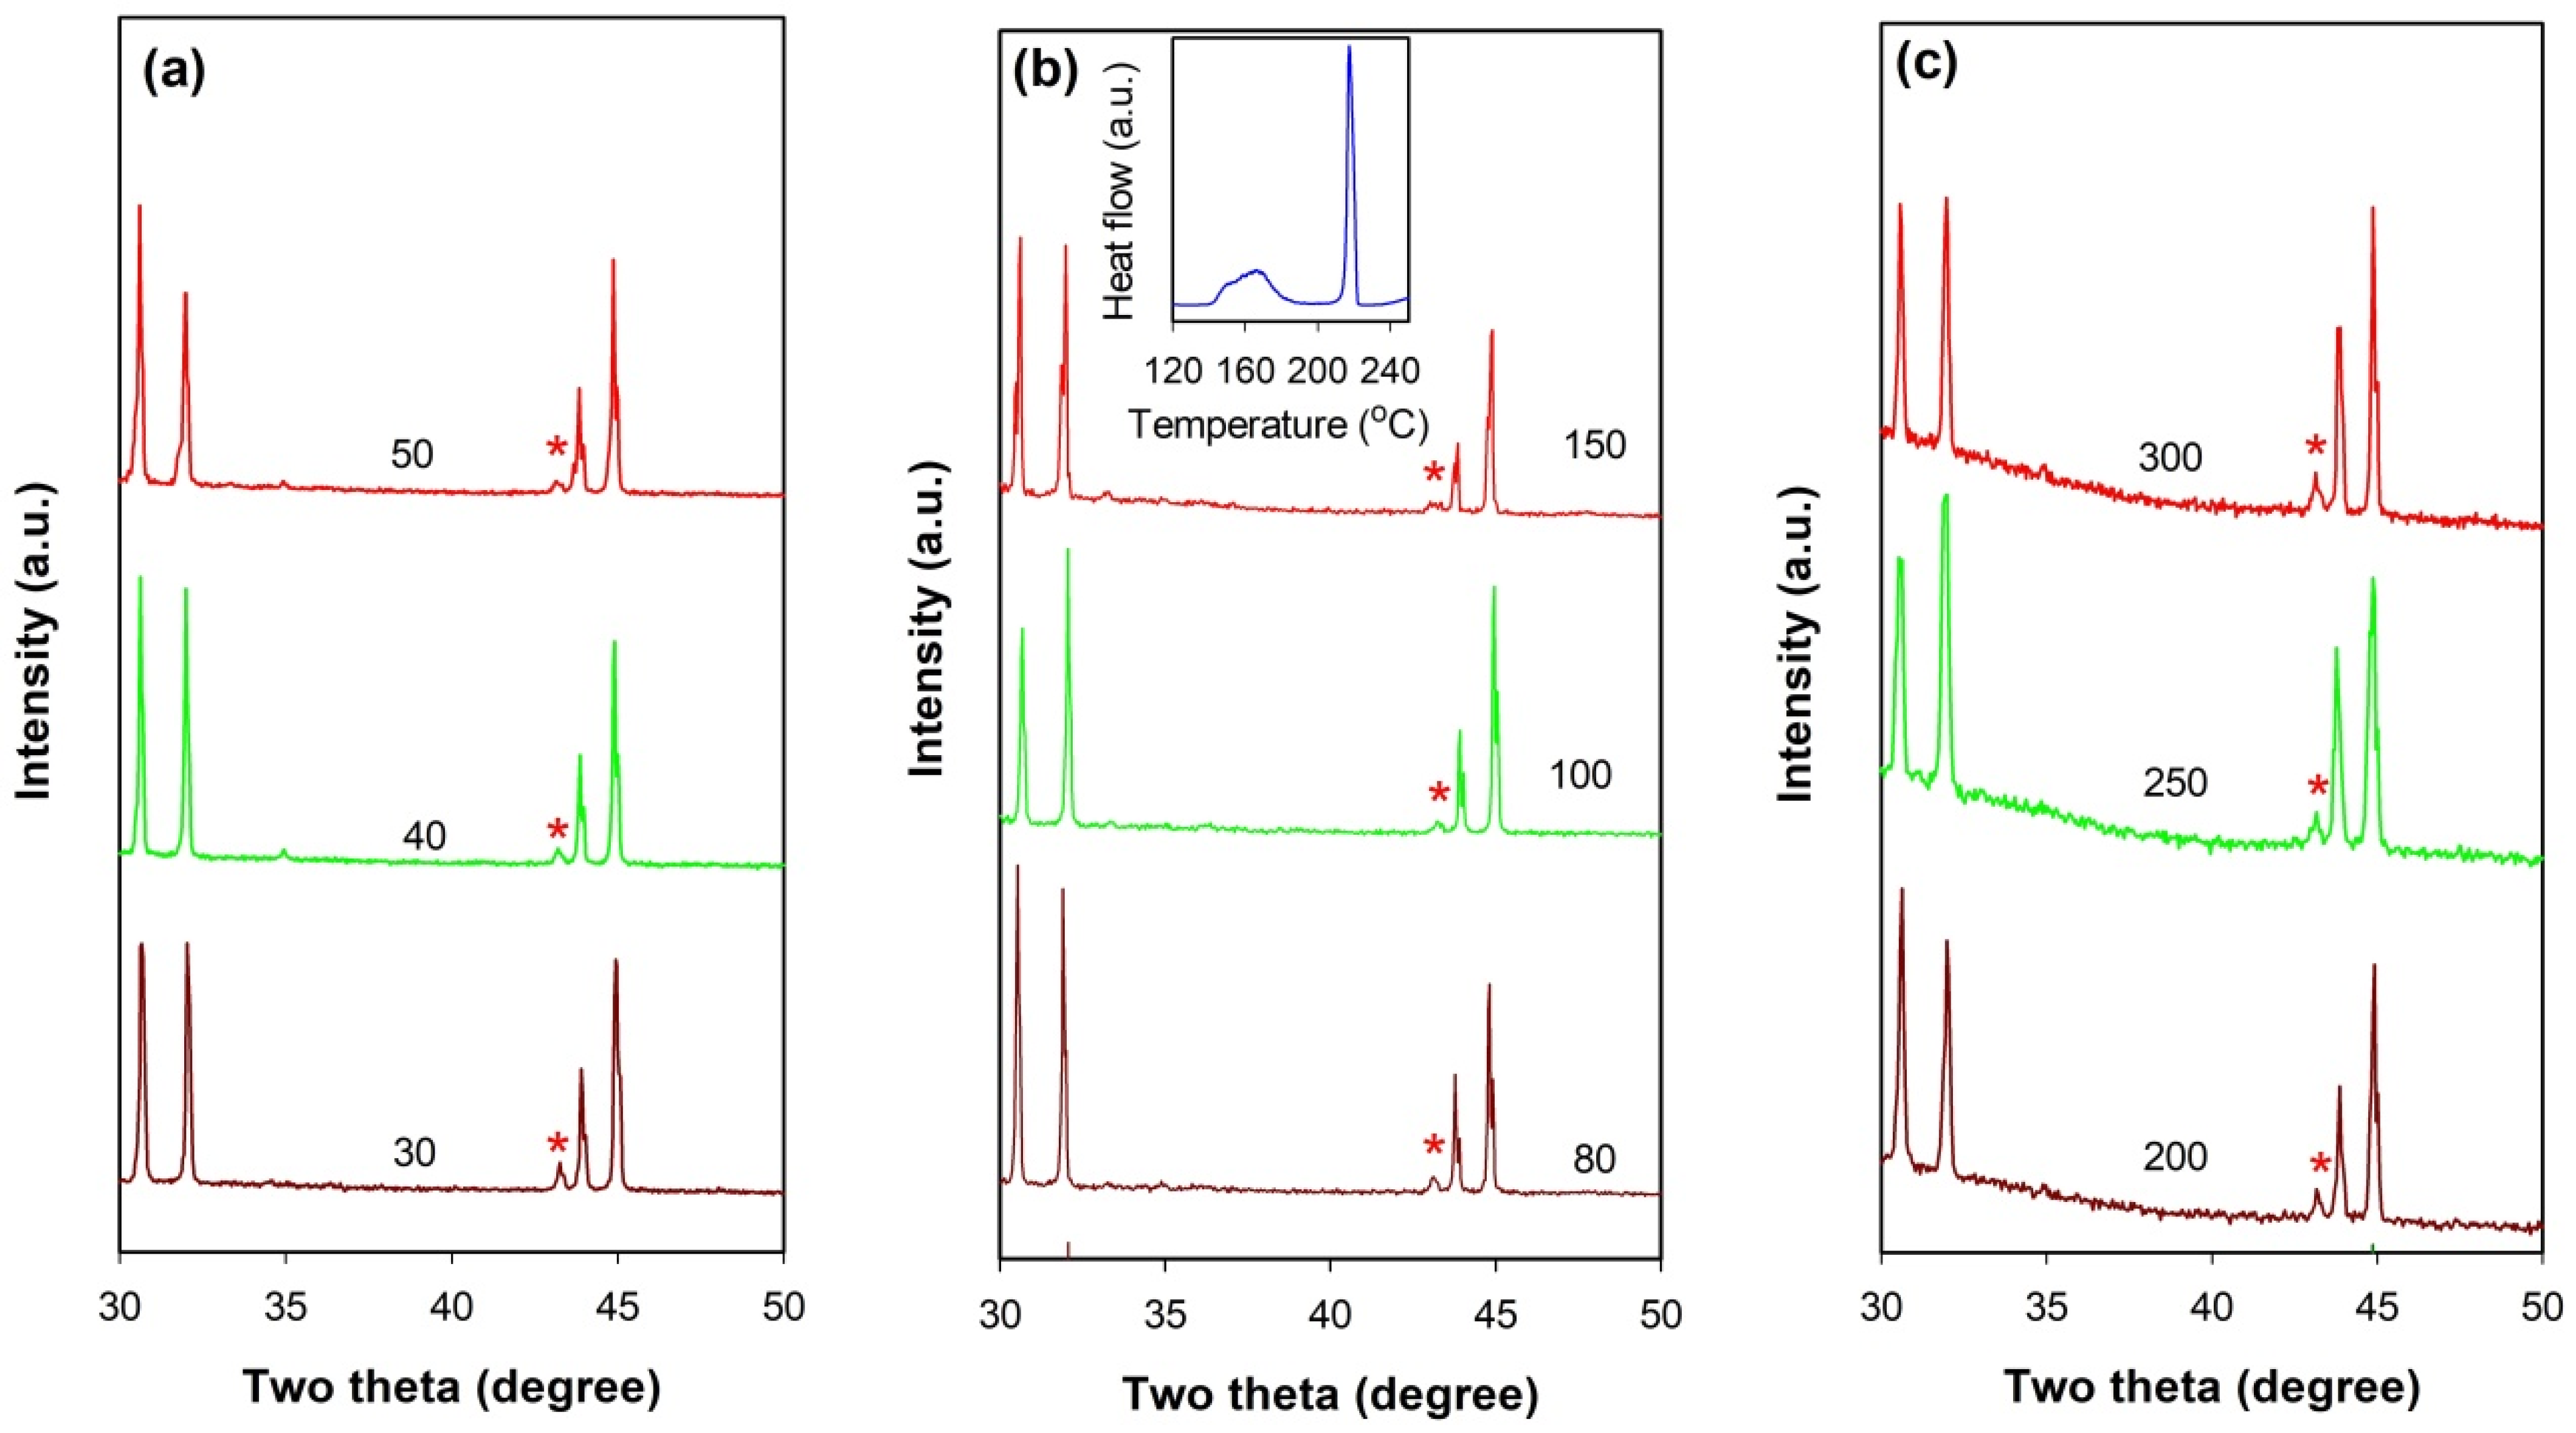
Figure 11 presents a comparison between the XRD patterns of thermally stable and unstable SnZnCu@SiO2 microspheres after thermal cycling. For all three types of SnZnCu@SiO2 microspheres, whether thermally stable or unstable, the Cu5Zn8 phase can be found in their XRD patterns (indicated by a red star). However, an obvious decrease in diffraction intensity of this phase is observed in the SnZn0.04Cu0.015@SiO2 microspheres after 40 or 50 thermal cycles compared to those after 30 thermal cycles (Figure 11a). The crystal size of the Cu5Zn8 phase estimated by Scherrer’s equation is reduced from about 50 nm (after 30 thermal cycles) to 30 nm (after 50 thermal cycles). A similar phenomenon can also be observed in the SnZn0.04Cu0.02@SiO2 microspheres after 100 thermal cycles (Figure 11b), especially the sample subjected to another 50 thermal cycles (namely 100 thermal cycles totally) which becomes more unstable as indicated by an obvious rise in the peak intensity of the second exothermic peak in the DSC curve (see inset of Figure 11b). The crystal size of the Cu5Zn8 phase is reduced from about 45 nm (after 80 thermal cycles) to 20 nm (after 150 thermal cycles). However, this phenomenon cannot be observed in the SnZn0.04Cu0.03@SiO2 microspheres after 300 thermal cycles (Figure 11c). These observations imply the occurrence of the decomposition of Cu5Zn8, and the thermal cycling stability of SnZnCu@SiO2 microspheres is strongly related to this phase. The fact that the decomposition of Cu5Zn8 does not occur in the SnZn0.04Cu0.03@SiO2 microspheres after 300 thermal cycles demonstrates that an increase in the amount of Cu can improve its stability. This can be understood from the thermodynamic point of view. The decomposition of Cu5Zn8 during thermal cycling should take place at a temperature where Sn is liquefied. When the decomposition of Cu5Zn8 occurs, the Cu atoms formed will be highly dispersed into the liquid Sn phase as suggested by the above XRD result that no Cu phase is detected even at room temperature. Thermodynamically, therefore, an increase in the amount of Cu present in the liquid Sn phase is unfavorable for the decomposition of Cu5Zn8.

2.4. Application of SnZn0.04Cu0.03@SiO2 Microspheres in Fischer–Tropsch Synthesis for Stabilizing the Temperature of the Catalyst Bed

Fischer–Tropsch synthesis is an important process for converting coal or natural gas to liquid fuels. As a highly exothermic catalytic reaction (ΔH = −165 kJ/mol of CO) [39], efficient heat removal from the packed bed is critical because an undesirable temperature rise may lead to catalyst deactivation, negative effect on product selectivity, and even thermal runaway. To facilitate the heat transfer across the catalyst bed, improving the thermal conductivity of the catalysts, e.g., depositing the catalyst on monolith [40], growing the catalyst on metal foam [41], and entrapping metal microfiber into the catalyst [18], is a common strategy. In contrast, this work presents a tentative study on the possibility of using metal-based PCMs to improve the thermal stability of the catalyst bed by embedding SnZn0.04Cu0.03@SiO2 microspheres into the Co/SiO2 catalyst. 
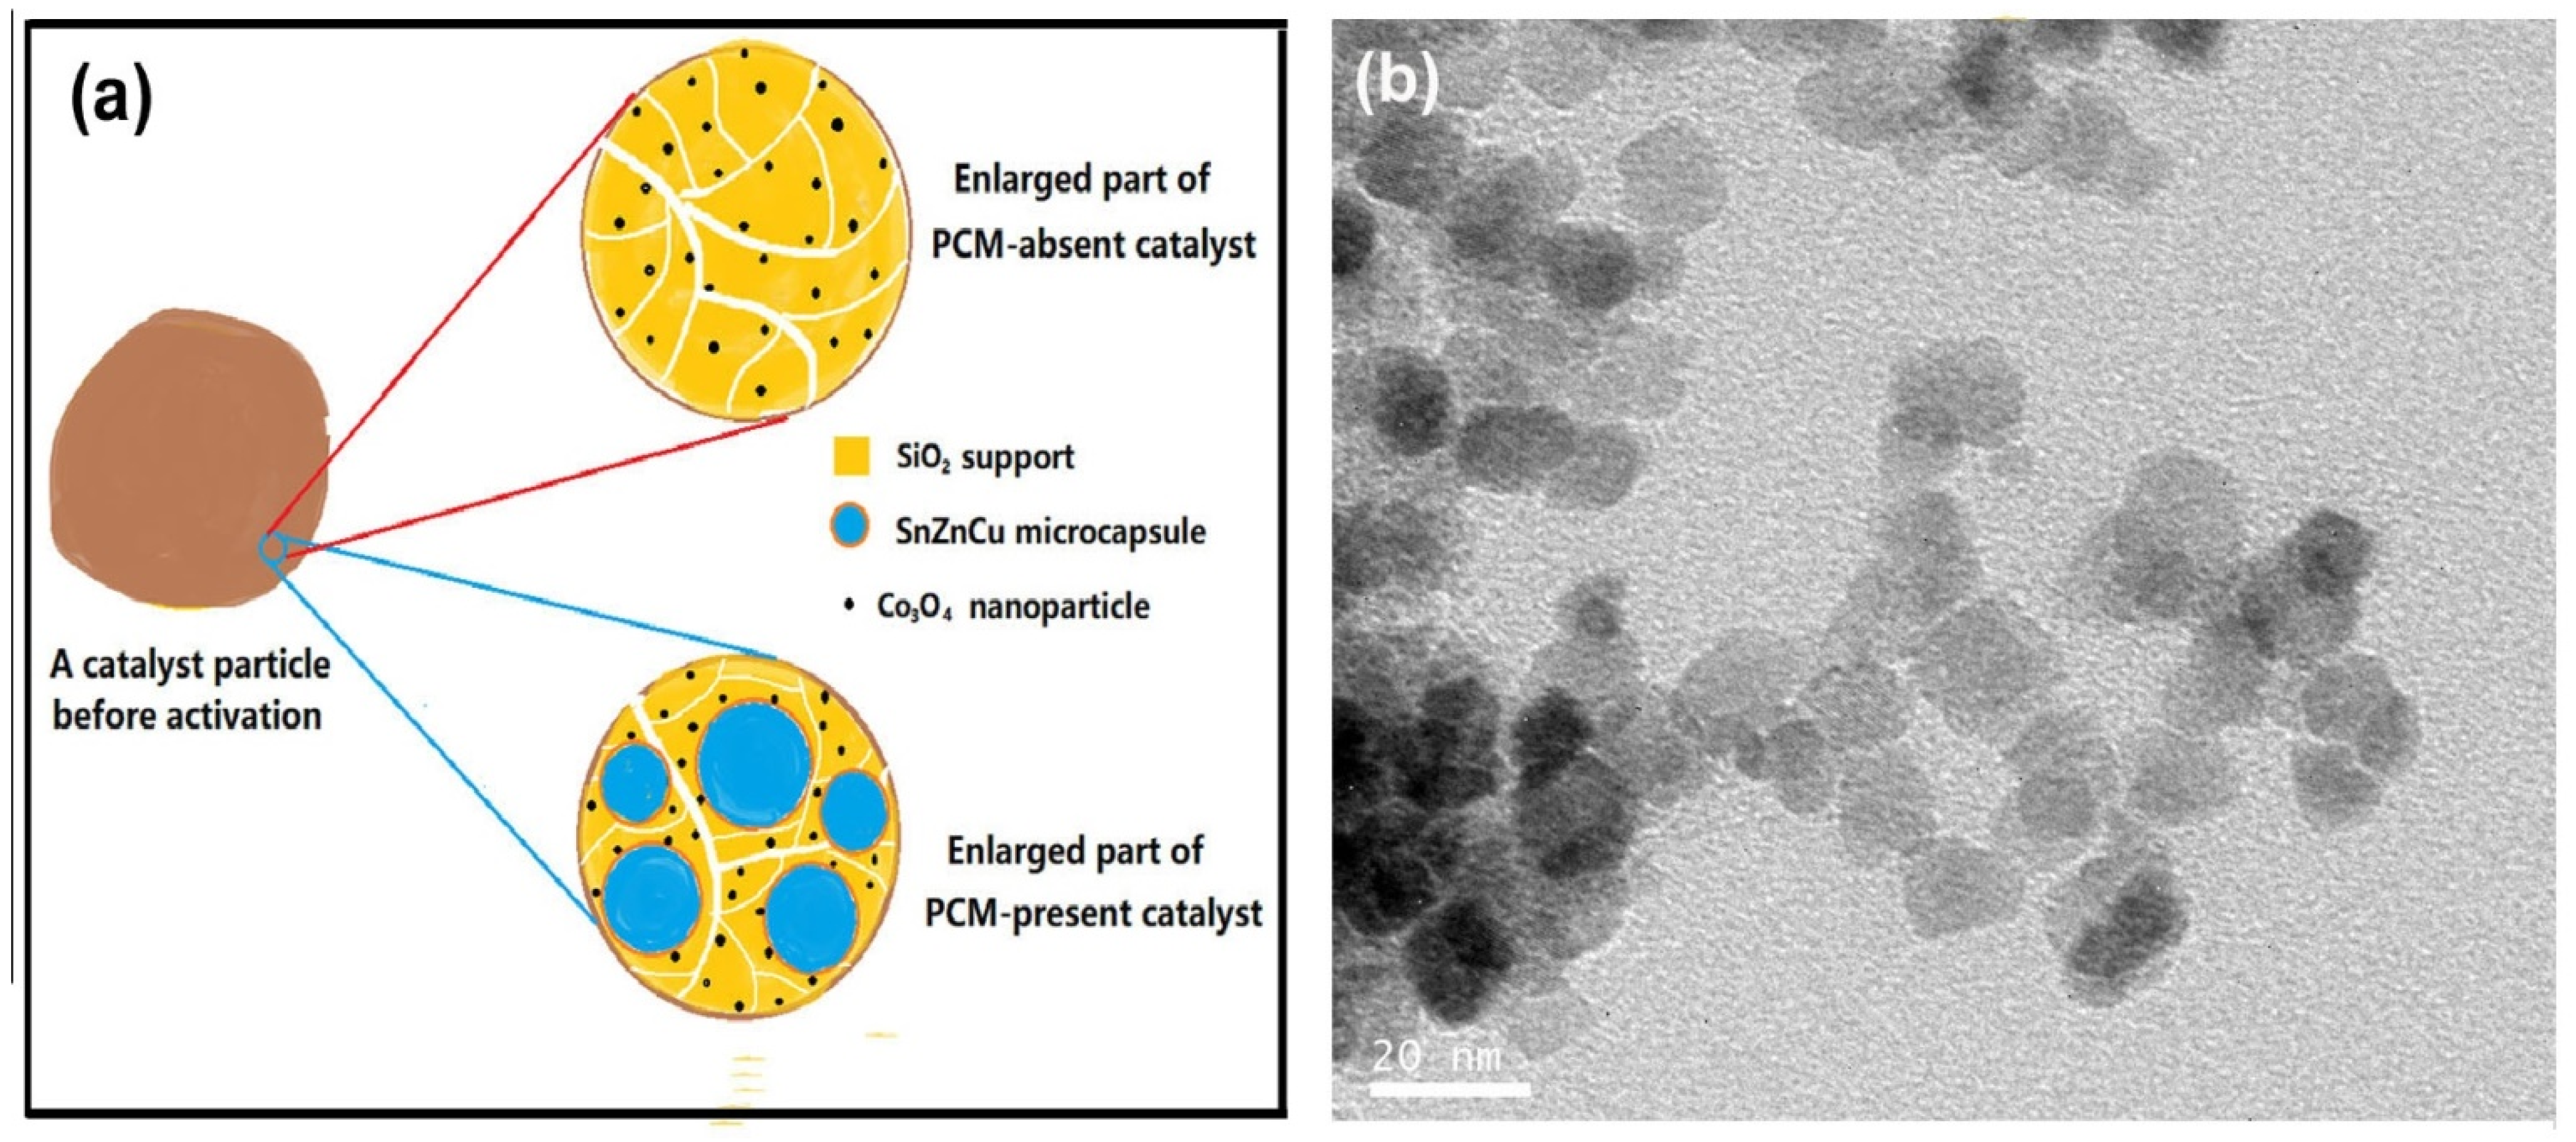
Figure 12a illustrates the structural difference between PCM-absent and PCM-present catalysts before activation. To make a reasonable comparison between PCM-absent and PCM-present catalysts, the pre-synthesized Co3O4 nanoparticles (see Figure 12b), rather soluble cobalt salts, are used as the precursor to ensure that the size of active component Co in two catalysts is the same. In addition, the amount of Co loaded in the packed bed in two cases should be as close as possible.
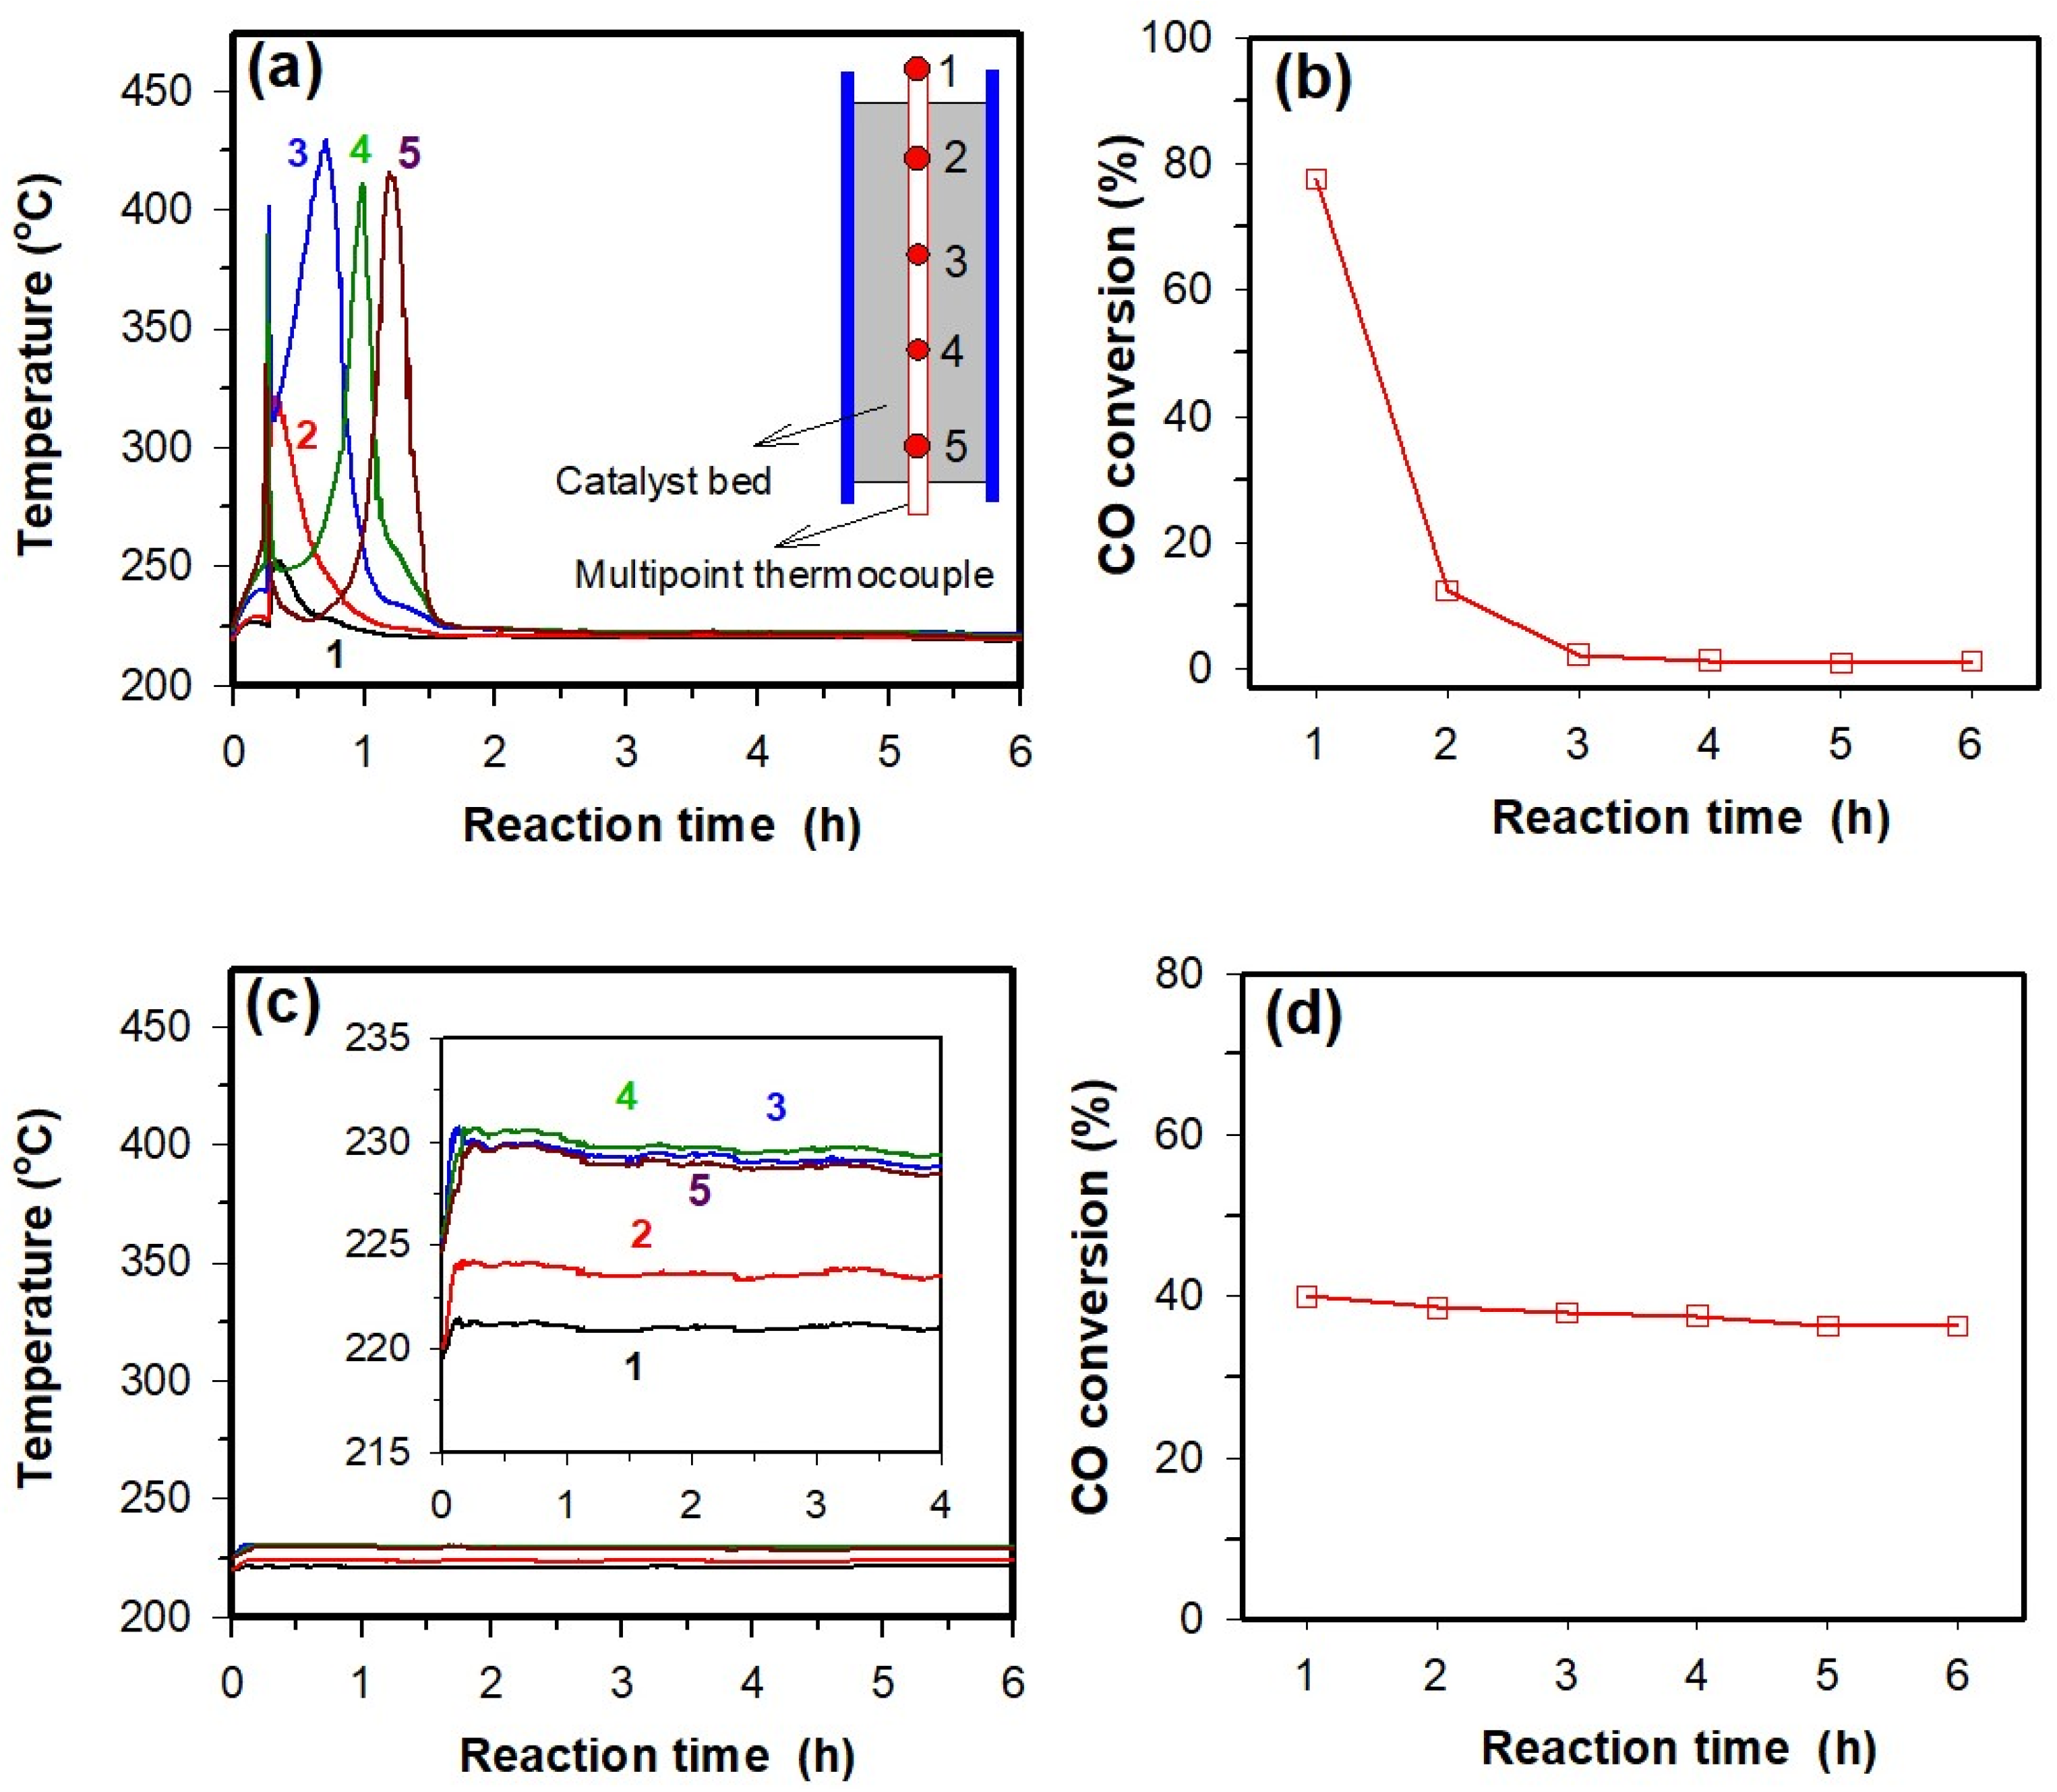
Figure 13 presents the temperature profiles at the centerline of the packed beds of two catalysts measured by a multi-point thermocouple (locations of thermocouple no. 1–5 is shown in the inset of Figure 13a) and the CO conversions over two catalysts. For the PCM-absent Co/SiO2 catalyst (Figure 13a), the temperature of the catalyst bed increases rapidly at the beginning and hot spots with an amplitude of 100–200 °C can be observed. The hot spot is initially located at the top of the catalyst bed and then moves in a downstream direction, probably due to loss of catalyst activity with time. The maximum temperature difference in the axial direction is about 200 °C. After about 1.5 h, the catalyst bed reaches a steady temperature distribution with a negligible temperature difference in the axial direction, suggesting that the catalyst should be totally deactivated. This is confirmed by the data of catalytic activity measured (Figure 13b), where the conversion of CO is reduced from about 80% to 1% when the catalyst bed reaches a steady temperature distribution. The rapid deactivation of the catalyst should be associated with the high temperature of the hot spot or thermal runaway which may accelerate re-oxidation [18], carbon deposition [42], or sintering of cobalt nanocrystals [43]. As shown in the inset of Figure 13c, however, the temperature profiles at the centerline of the packed bed of the PCM-present Co/SiO2 catalyst are quite different from that of PCM-absent Co/SiO2 catalyst. Hot spots can be suppressed and thus no thermal runaway is found, and the catalyst bed almost reaches a steady temperature distribution during the startup period. The maximum temperature difference in the axial direction is about 6.5 °C (see inset of Figure 13c), much lower than the value of about 200 °C observed in the PCM-absent Co/SiO2 catalyst bed. As a result, deactivation of the catalyst due to thermal runaway is not found and the CO conversion remains in a steady state with a value close to 40% (Figure 13d). These observations demonstrate that the presence of Sn–Zn–Cu PCM in the catalyst can greatly improve the thermal stability of the catalyst bed in Fischer–Tropsch synthesis.
The positive effect on the thermal stability of the catalyst bed observed in the PCM-present Co/SiO2 catalyst should be related to the fact that Sn–Zn–Cu PCM not only owns a much higher thermal conductivity than the amorphous SiO2 but also has the ability to store thermal energy released by the reaction. First, because the thermal conductivities of both Cu and Zn (about 386 and 113 W⋅m−1⋅K−1 at 293 K, respectively [19]) are higher than that of Sn (about 67 W⋅m−1⋅K−1 at 293 K), the Sn–Zn–Cu PCM should have a thermal conductivity higher than that of Sn. The much higher thermal conductivity of Sn–Zn–Cu PCM compared to the amorphous SiO2 (about 1 W⋅m−1⋅K−1 at 300 K [44]) allows the bed of the PCM-present catalyst a high heat removal rate (via heat transfer through the walls), which is critical for achieving a steady catalyst bed temperature distribution and avoiding thermal runaway in the case where high CO conversion is high (namely high heat generation rate). Second, since Sn–Zn–Cu PCM can absorb the heat of reaction via solid–liquid phase change when the temperature of catalyst bed reaches its melting point, the presence of PCM can help to suppress the formation of hot spots, especially the one caused by the unexpected, temporary variation in the operating conditions. In addition, since the Sn–Zn–Cu PCM can release the absorbed heat via liquid–solid phase transition, the use of a PCM-containing catalyst may also reduce the electric heating time of the reactor and thus save energy if the PID controlled reaction temperature is set slightly below the melting point of PCM.

3. Materials and Methods

3.1. Materials and Chemicals

Except carboxymethylcellulose sodium (Chemical pure, 300–800 mPa·s), all other chemicals were of analytical grade and used as received. Except for Sn (≥99.5%, MCLean Biochemical Technology Co., Ltd., Shanghai, China), ethanol (purchased from Anhui Ante Food Co., Ltd., Suzhou, China), ethylenediamine (purchased from Shanghai Wulian Chemical Co., Ltd., Shanghai, China), Cu(OH)2 (purchased from Shanghai Zhenxin Reagent Factory, Shanghai, China), and carboxymethylcellulose sodium (Sinopharm Chemical Reagent Co., Ltd., Shanghai, China), all other reagents, including Zn (≥99.9%), were obtained from Aladdin Chemical Reagent Co., Ltd. (Shanghai, China). Cu nanowires (CuNWs) used were prepared via a cheap and environmentally friendly method developed by the authors [45], and Co3O4 nanoparticles were prepared by a method reported by Dong et al. [46].

3.2. Preparation of SnZnCu@SiO2 Microspheres and PCM-Present Co/SiO2 Catalyst

Preparation of SnZnCu microspheres by a molten salt-based metal emulsion method. (1) Synthesis of bulk SnZnCu. About 3.0 g of Sn and a given amount of CuNWs were put into a corundum tube filled with Ar gas. Then both Sn and CuNWs were covered by about 22.1 g of LiCl–KCl–CsCl eutectic (54.4 wt.% CsCl, 30.3 wt.% LiCl, and 15.3 wt.% KCl), and the tube was heated to 750 °C in about 15 min. After stirring at 750 °C for 20 min, the liquid metals were cooled down to 600 °C and then a given amount of Zn powder was added under the Ar gas protection. After being kept at 600 °C for 1 h under stirring, the liquid metals were rapidly cooled down by dumping them into an Ar-filled steel container which was put in an ice-water bath. (2) Ultrasonically dispersing bulk SnZnCu into molten salts. The above cooled mixture was transferred into a quartz tube and then heated to 600 °C under argon gas protection. After the LiCl–KCl–CsCl eutectic was molten (about 10 min), the mixture was cooled to 380 °C and then emulsified via ultrasonic cavitation (20 KHz, 960 W, 3 s interval between every 2 s duty) for about 5 min with the distance between the sonotrode tip (φ20 mm) and the molten salt–metal interface being about 8 mm. (3) Rapidly cooling the emulsion and removing the salts. The metal emulsion was quickly cooled to room temperature by dumping them into an Ar-filled steel container which was put in an ice-water bath. The chloride salts were separated from the metals by dissolving them in deionized water. After removal of the salts, the solid product was washed with deionized water and then dried in a vacuum at 65 °C for 3 h. For comparison, Sn and SnCu microspheres were also prepared by such a molten salt-based metal emulsion method. A total 11 samples were prepared and the nominal atomic concentrations of Zn or/and Cu are summarized in Table 2.
Ultrasound-assisted encapsulation via a sol–gel method. Typically, about 0.50 g metal microparticles, 0.12 mL of NH4F aqueous solution (containing about 0.0008 g NH4F), 0.48 mL glycerol, and about 0.016 g Triton X-100 were added into a plastic tube, and the mixture was stirred until blended. A total of 10 mL cyclohexane was added into the formed slurry, and then the tube was placed into a water bath to prevent overheating due to ultrasonic cavitation. The Sn-containing slurry was dispersed into cyclohexane by probe sonication (duty ratio 3/5, sonotrode tip diameter = 10 mm, the distance between the sonotrode tip and the cyclohexane–slurry interface is ~8 mm) for 2 min. After dispersing, about 0.6 mL of tetraethyl orthosilicate (TEOS) was added dropwise into the tube under ultrasonic cavitation in 2 min. To complete the hydrolysis–condensation reactions of TEOS, the ultrasonic cavitation further lasted for 30 min. After the reaction, the solid product was collected by centrifugation (5000 rpm). The obtained product was then washed with water and ethanol and dried under a vacuum.
Preparation of the PCM-present Co/SiO2 catalyst. Typically, about 0.95 g of Co3O4 was ultrasonically dispersed into about 5 mL of ethanol in an ice-water bath (600 W, 3 s interval between every 2 s duty). Then, about 5 mL of PCM microcapsules were added to the above mixture. After sonication for several minutes, 1 mL H2O, 5 mL TEOS, and 0.6 mL aqueous ammonia (25 wt.%) were successively added. After 20 min of sonication, about 0.035 g of carboxymethylcellulose sodium was added under mechanical stirring. The mixture was further stirred for 5 h at a temperature of 50 °C and then cooled down to room temperature, dried at 80 °C for about 5 min to obtain a thick slurry. The slurry was shaped into catalyst particles of about 1 to 2 mm in diameter. Finally, the catalyst particles were dried at 80 °C for 3 h and calcined at 400 °C in N2 for 4 h. For the sake of comparison, the PCM-absent Co/SiO2 catalyst was also prepared by a similar procedure except that no PCM microcapsules were used and the amounts of TEOS, H2O, ethanol, and aqueous ammonia were doubled.

3.3. Thermal Cycling Test and Catalyst Testing

Thermal cycling test. The thermal cycling test of SiO2-encapsulated SnZnCu microspheres was performed in a quartz tub heated by a tubular electrical furnace. The sample of about 0.5 g was put into an alumina open crucible, and then the crucible was introduced into the quartz tube to conduct the experiments under an N2 flux (20 mL/min). In each melting/solidification cycle, a heating/cooling rate of about 10 °C/min was applied between 200 and 250 °C, with isothermal steps of 10 min at minimum (200 °C) and maximum temperatures (250 °C). The sample was subjected to a given number of melting/solidification cycles. During the experiments, the cycling was interrupted after each consecutive 10, 20, or 50 thermal cycles depending on the sample, and the sample was taken out to measure its phase composition and phase change properties.
Catalyst testing. The catalysts were tested in a fixed bed reactor with a 0.63 m 316 L tube of 0.012 m in internal diameter. The outlet of the reactor was connected with a hot trap (150 °C) and a cold trap (0 °C). A thin sheath multi-point thermocouple with low axial thermal conductivity (Omega, 5 points, 25.4 mm separation intervals) was used to measure the temperatures in the catalyst beds at different heights. After in situ reduction of the catalyst at 400 °C for 10 h, the packed bed was cooled to the desired temperature. Then syngas with a H2/CO ratio of 2:1 was fed to the reactor at a pressure of 2 MPa (the space velocity is 2000 h−1). The outlet gas after the cold trap was were measured online by gas chromatography (GC, Fuli 9790, Zhejiang Fuli Analytical Instrument Co., Ltd., Taizhou, China) with two packed columns (GDX-502 and TDX-01, Lanzhou Zhongke Kaidi Chemical New Technology Co., Ltd., Lanzhou, China) for analysis of H2, CO, CO2, and CH4 concentrations (nitrogen as the internal standard) by a TCD detector (Zhejiang Fuli Analytical Instrument Co., Ltd., Taizhou, China) and a capillary column (PLOT AL2O3) for analysis of uncondensed C2-C10 in the residual gas by an FID detector (Zhejiang Fuli Analytical Instrument Co., Ltd., Taizhou, China).

3.4. Characterization

The morphology of the samples was examined using a scanning electron microscope (SEM, Hitachi S-4700, Hitachi High-Technologies Corporation, Tokyo, Japan) operating at 15 kV. The phase composition was analyzed by X-ray diffraction (XRD), which was performed on a Thermo ARL XTRA X-ray diffractometer (Thermo Fisher Scientific, Waltham, MA, USA) using Cu Kα X-ray source. The phase composition was analyzed by the Jade software (Version 5, Materials Data, Livermore, CA, USA) with a PDF2-2004 databank. The microstructure investigations were performed with a Tecnai G2 F30 S-Twin transmission electron microscopy (TEM) operating at 300 kV or an FEI Talos-S transmission electron microscope (Thermo Fisher Scientific, Waltham, MA, USA) operating at 200 kV. Measurements of solid–liquid phase change temperatures and latent heat of PCMs were carried out by using a differential scanning calorimeter instrument (DSC, Mettler Toledo, Zurich, Switzerland) or NETZSCH DSC 200F3 (NETZSCH-Gerätebau GmbH, Selb, Germany) under nitrogen atmosphere and at a heating/cooling rate of 10 °C/min.

4. Conclusions

In summary, well-shaped SnZnCu@SiO2 microspheres can be prepared by combining a molten salt-based metal emulsion method and a sol–gel approach. The uniform SiO2 layer can prevent the leakage of liquid metals at high temperatures but cannot induce heterogeneous nucleation that may significantly reduce the undercooling of Sn microspheres. However, the addition of a suitable amount of Cu (1.5–3.0 at.%) and Zn (4.0 at.%) into Sn microspheres can achieve a type of SnZnCu@SiO2 microspheres with very low undercooling (<5.0 °C at a ramp rate of 10 °C) and a narrow freezing/melting peak width, which should be a result of the formation of both Sn–Zn–Cu ternary eutectic and metastable phase Cu5Zn8. A rise in the amount of Cu has a positive effect on the thermal cycling stability of SnZnCu@SiO2 microspheres, and SnZn0.04Cu0.03@SiO2 is highly stable. The thermal cycling stability of SnZnCu@SiO2 microspheres is governed by the stability of the Cu5Zn8 phase, and thermodynamically, an increase in the amount of Cu is unfavorable for its decomposition. Measurement of both the catalyst bed temperature and catalytic activity for Fischer–Tropsch synthesis of the Co/SiO2 catalysts with or without PCM reveals that the presence of SnZn0.04Cu0.03 PCM, which not only owns a much higher thermal conductivity than the amorphous SiO2 but also has the ability to store the thermal energy released by the reaction, can significantly reduce the temperature gradient in the catalyst bed by suppressing the formation of hot spots or thermal runaway and thus prevent rapid deactivation of Co catalyst that occurs in the PCM-absent Co/SiO2 catalyst.

Supplementary Materials

The following are available online at https://www.mdpi.com/article/10.3390/catal12020205/s1, Figure S1: SEM images of Cu nanowires before and after calcinated for 30 min in Ar atmosphere at different temperatures, Figure S2: XRD patterns of SnCu0.02 and SnCu0.03 microspheres. Figure S3: DSC curves of SnCu0.02@SiO2 and SnCu0.03@SiO2 microspheres.

Author Contributions

H.T. and Z.L. conceived and designed the experiments; X.Z., Y.Y. and J.L. performed the experiments; Y.Z. helped with the characterization of the samples; H.T., X.Z. and Z.L. wrote the paper. All authors have read and agreed to the published version of the manuscript.

Funding

This research was supported by the National Natural Science Foundation of China (Grant No. 21776256).

Data Availability Statement

Data is contained within the article and Supplementary Material.

Conflicts of Interest

The authors declare no conflict of interest.

References

  1. Souayfane, F.; Fardoun, F.; Biwole, P.-H. Phase change materials (PCM) for cooling applications in buildings: A review. Energy Build. 2016, 129, 396–431. [Google Scholar] [CrossRef]
  2. Baetens, R.; Jelle, B.P.; Gustavsen, A. Phase change materials for building applications: A state-of-the-art review. Energy Build. 2010, 42, 1361–1368. [Google Scholar] [CrossRef] [Green Version]
  3. Zhao, Y.X.; Zhang, X.L.; Hua, W.S. Review of preparation technologies of organic composite phase change materials in energy storage. J. Mol. Liq. 2021, 336, 115923. [Google Scholar] [CrossRef]
  4. Li, Q.; Li, C.; Du, Z.; Jiang, F.; Ding, Y. A review of performance investigation and enhancement of shell and tube thermal energy storage device containing molten salt based phase change materials for medium and high temperature applications. Appl. Energy 2019, 255, 113806. [Google Scholar] [CrossRef]
  5. Singh, S.; Gaikwad, K.K.; Lee, Y.S. Phase change materials for advanced cooling packaging. Environ. Chem. Lett. 2018, 16, 845–859. [Google Scholar] [CrossRef]
  6. Fernández, A.I.; Barreneche, C.; Belusko, M.; Segarra, M.; Bruno, F.; Cabeza, L.F. Considerations for the use of metal alloys as phase change materials for high temperature applications. Sol. Energy Mater. Sol. Cells 2017, 171, 275–281. [Google Scholar] [CrossRef] [Green Version]
  7. Pacio, J.; Singer, C.; Wetzel, T.; Uhlig, R. Thermodynamic evaluation of liquid metals as heat transfer fluids in concentrated solar power plants. Appl. Therm. Eng. 2013, 60, 295–302. [Google Scholar] [CrossRef]
  8. Ge, H.; Liu, J. Phase change effect of low melting point metal for an automatic cooling of USB flash memory. Front. Energy 2012, 6, 207–209. [Google Scholar] [CrossRef]
  9. Lin, Y.; Cooper, C.; Wang, M.; Adams, J.J.; Genzer, J.; Dickey, M.D. Handwritten, Soft Circuit Boards and Antennas Using Liquid Metal Nanoparticles. Small 2015, 11, 6397–6403. [Google Scholar] [CrossRef]
  10. Giro–Paloma, J.; Martinez, M.; Cabeza, L.F.; Fernandez, A. Types, methods, techniques, and applications for microencapsulated phase change materials (MPCM): A review. Renew. Sust. Energ. Rev. 2016, 53, 1059–1075. [Google Scholar] [CrossRef] [Green Version]
  11. Nomura, T.; Zhu, C.; Sheng, N.; Saito, G.; Akiyama, T. Microencapsulation of Metal-based Phase Change Material for High-temperature Thermal Energy Storage. Sci. Rep. 2015, 5, srep09117. [Google Scholar] [CrossRef] [PubMed] [Green Version]
  12. Hsu, T.H.; Chung, C.H.; Chung, F.J.; Chang, C.C.; Lu, M.C.; Chueh, Y.L. Thermal hysteresis in phase−change materials: Encapsulated metal alloy core−shell microparticles. Nano Energy 2018, 51, 563–570. [Google Scholar] [CrossRef]
  13. Zhu, S.; Nguyen, M.T.; Tokunaga, T.; Yonezawa, T. Size-Tunable Alumina-Encapsulated Sn-Based Phase Change Materials for Thermal Energy Storage. ACS Appl. Nano Mater. 2019, 2, 3752–3760. [Google Scholar] [CrossRef]
  14. Li, Q.L.; Ma, X.D.; Zhang, X.Y.; Zhang, J.B.; Ma, J.Q.; Hu, X.W.; Lan, Y.F. Preparation of a new capsule phase change material for high temperature thermal energy storage. J. Alloy Compd. 2021, 868, 159179. [Google Scholar] [CrossRef]
  15. Bao, J.; Zou, D.; Zhu, S.; Ma, Q.; Wang, Y.; Hu, Y. A medium-temperature, metal-based, microencapsulated phase change material with a void for thermal expansion. Chem. Eng. J. 2021, 415, 128965. [Google Scholar] [CrossRef]
  16. Safari, A.; Saidur, R.; Sulaiman, F.A.; Xu, Y.; Dong, J. A review on of phase change materials in thermal energy storage systems. Renew. Sust. Energ. Rev. 2017, 70, 905–919. [Google Scholar] [CrossRef]
  17. Zahir, H.; Mohamed, S.A.; Saidur, R.; Al-Sulaiman, F.A. Supercooling of phase-change materials and the techniques used to mitigate the phenomenon. Appl. Energy 2019, 240, 793–817. [Google Scholar] [CrossRef]
  18. Sheng, M.; Yang, H.; Cahela, D.R.; Yantz, W.R.; Gonzalez, C.F.; Tatarchuk, B.J. High conductivity catalyst structures for applications in exothermic reactions. Appl. Catal. A Gen. 2012, 445–446, 143–152. [Google Scholar] [CrossRef]
  19. Carvill, J. Thermodynamics and heat transfer. Mech. Eng. Data Handb. 1993, 102–145. [Google Scholar] [CrossRef]
  20. Yang, B.; Gao, Y.; Zou, C.; Zhai, Q.; Zhuravlev, E.; Schick, C. Size-dependent undercooling of pure Sn by single particle DSC measurements. Chin. Sci. Bull. 2010, 55, 2063–2065. [Google Scholar] [CrossRef]
  21. Parks, G.; Faucett, A.; Fox, C.; Smith, J.; Cotts, E. The Nucleation of Sn in Undercooled Melts: The Effect of Metal Impurities. JOM 2014, 66, 2311–2319. [Google Scholar] [CrossRef]
  22. Cho, M.G.; Kang, S.K.; Seo, S.-K.; Shih, D.-Y.; Lee, H.M. Effects of under bump metallization and nickel alloying element on the undercooling behavior of Sn-based, Pb-free solders. J. Mater. Res. 2009, 24, 534–543. [Google Scholar] [CrossRef] [Green Version]
  23. Kang, S.K.; Cho, M.G.; Lauro, P.; Shih, D.-Y. Critical Factors Affecting the Undercooling of Pb-free, Flip-Chip Solder Bumps and In-situ Observation of Solidification Process. In Proceedings of the 2007 Proceedings 57th Electronic Components and Technology Conference, Sparks, NV, USA, 29 May–1 June 2007; pp. 1597–1603. [Google Scholar]
  24. Zheng, X.L.; Luo, W.; Yu, Y.; Xue, Z.B.; Zheng, Y.F.; Liu, Z.J. Metal emulsion−based synthesis, characterization, and properties of Sn−based microsphere phase change materials. Molecules 2021, 26, 7449. [Google Scholar] [CrossRef] [PubMed]
  25. Tian, Y.W.; Luo, W.; Wang, Y.D.; Yu, Y.; Huang, W.Z.; Tang, H.D.; Zheng, Y.F.; Liu, Z.J. Ultrasound−assisted fast encapsulation of metal microparticles in SiO2 via an interface–confined sol–gel method. Ultrason. Sonochem. 2021, 73, 105484. [Google Scholar] [CrossRef] [PubMed]
  26. Li, D.; Franke, P.; Fürtauer, S.; Cupid, D.; Flandorfer, H. The Cu–Sn phase diagram part II: New thermodynamic assessment. Intermetallics 2013, 34, 148–158. [Google Scholar] [CrossRef]
  27. Moser, Z.; Dutkiewicz, J.; Gasior, W.; Salawa, J. The Sn−Zn (tin-zinc) system. Bull. Alloy Phase Diagr. 1985, 6, 330–334. [Google Scholar] [CrossRef]
  28. Chen, C.M.; Chen, C.H. Interfacial reactions between eutectic SnZn solder and bulk or thin–film Cu substrates. J. Electron. Mater. 2007, 36, 1363–1371. [Google Scholar] [CrossRef]
  29. Farbod, M.; Mohammadian, A. Single phase synthesis of g–brass (Cu5Zn8) nanoparticles by electric arc discharge method and investigation of their order–disorder transition temperature. Intermetallics 2014, 45, 1–4. [Google Scholar] [CrossRef]
  30. Chou, C.Y.; Chen, S.W. Phase equilibria of the Sn–Zn–Cu ternary system. Acta Mater. 2006, 54, 2393–2400. [Google Scholar] [CrossRef]
  31. Rycerz, L. Practical remarks concerning phase diagrams determination on the basis of differential scanning calorimetry measurements. J. Therm. Anal. 2013, 113, 231–238. [Google Scholar] [CrossRef] [Green Version]
  32. Loomans, M.E.; Fine, M.E. Tin-silver-copper eutectic temperature and composition. Met. Mater. Trans. A 2000, 31, 1155–1162. [Google Scholar] [CrossRef]
  33. Zhao, C.; Ji, Y.; Xu, Z. Investigation of the Ca(NO3)2–NaNO3 mixture for latent heat storage. Sol. Energy Mater. Sol. Cells 2015, 140, 281–288. [Google Scholar] [CrossRef]
  34. Li, Y.; Guo, B.; Huang, G.; Kubo, S.; Shu, P. Characterization and thermal performance of nitrate mixture/SiC ceramic honeycomb composite phase change materials for thermal energy storage. Appl. Therm. Eng. 2015, 81, 193–197. [Google Scholar] [CrossRef]
  35. Xiao, J.; Huang, J.; Zhu, P.; Wang, C.; Li, X. Preparation, characterization and thermal properties of binary nitrate salts/expanded graphite as composite phase change material. Thermochim. Acta 2014, 587, 52–58. [Google Scholar] [CrossRef]
  36. Aguanno, B.D.; Karthik, M.; Grace, A.N.; Floris, A. Thermostatic properties of nitrate molten salts and their solar and eutectic mixtures. Sci. Rep. 2018, 8, 10485. [Google Scholar]
  37. Bauer, T.; Bonk, A. Semi-empirical Density Estimations for Binary, Ternary and Multicomponent Alkali Nitrate–Nitrite Molten Salt Mixtures. Int. J. Thermophys. 2018, 39, 134. [Google Scholar] [CrossRef]
  38. Liu, Y.C.; Wan, J.B.; Gao, Z.M. Intermediate decomposition of metastable Cu5Zn8 phase in the soldered Sn–Ag–Zn/Cu inter-face. J. Alloys Compd. 2008, 465, 205–209. [Google Scholar] [CrossRef]
  39. Kölbel, H.; Ralek, M. The Fischer-Tropsch Synthesis in the Liquid Phase. Catal. Rev. 1980, 21, 225–274. [Google Scholar] [CrossRef]
  40. Zhu, C.; Gamliel, D.P.; Valla, J.A.; Bollas, G.M. Fischer-tropsch synthesis in monolith catalysts coated with hierarchical ZSM-5. Appl. Catal. B Environ. 2021, 284, 119719. [Google Scholar] [CrossRef]
  41. Harmel, J.; Peres, L.; Estrader, M.; Berliet, A.; Maury, S.; Fécant, A.; Chaudret, B.; Serp, P.; Soulantica, K. Hcp–Co nanowires grown on metallic foams as catalysts for the fischer–tropsch synthesis. Angew. Chem. Int. Ed. 2018, 57, 10579–10583. [Google Scholar] [CrossRef]
  42. Moodley, D.J.; Loosdrecht, J.; Saib, A.M.; Overett, M.J.; Datye, A.K.; Niemantsverdriet, J.W. Carbon deposition as a deactivation mechanism of cobalt–based fischer–tropsch synthesis catalysts under realistic conditions. Appl. Catal. A 2009, 354, 102–110. [Google Scholar] [CrossRef]
  43. Tsakoumis, N.E.; Rønning, M.; Borg, Ø.; Rytter, E.; Holmen, A. Deactivation of cobalt based fischer–tropsch catalysts: A review. Catal. Today 2010, 154, 162–182. [Google Scholar] [CrossRef]
  44. Zhu, W.; Zheng, G.; Cao, S.; He, H. Thermal conductivity of amorphous SiO2 thin film: A molecular dynamics study. Sci. Rep. 2018, 8, 1–9. [Google Scholar] [CrossRef] [PubMed] [Green Version]
  45. Zheng, Y.; Liang, J.; Chen, Y.; Liu, Z. Economical and green synthesis of Cu nanowires and their use as a catalyst for selective hydrogenation of cinnamaldehyde. RSC Adv. 2014, 4, 41683–41689. [Google Scholar] [CrossRef]
  46. Dong, J.; Song, L.; Yin, J.-J.; He, W.; Wu, Y.; Gu, N.; Zhang, Y. Co3O4 Nanoparticles with Multi-Enzyme Activities and Their Application in Immunohistochemical Assay. ACS Appl. Mater. Interfaces 2014, 6, 1959–1970. [Google Scholar] [CrossRef]
Figure 1. SEM images of metal microspheres of different chemical compositions prepared via a molten salt-based metal emulsion method:(a) Sn, (b) SnCu0.015, (c) SnZn0.04, (d) SnZn0.04Cu0.015, and (e) SnZn0.04Cu0.02 and (f) SnZn0.04Cu0.03.
Catalysts 12 00205 g001
Figure 2. SEM, TEM, and STEM images of SiO2-encapsulated SnZn0.04Cu0.015 microspheres via an interface-confined sol–gel method: (a,b) SEM, (c) TEM, and (d) STEM.
Catalysts 12 00205 g002
Figure 3. TEM and STEM images of SiO2-encapsulated SnZn0.04Cu0.015 microspheres obtained via the interface-confined sol–gel method with different encapsulation times: (a,b) 3 and (c,d) 5.
Catalysts 12 00205 g003
Figure 4. SEM images of SiO2-encapsulted SnZn0.04Cu0.015 microspheres (encapsulation times = 3) before (a,b) and after calcination (c,d) at 400 °C in N2 for 6 h.
Catalysts 12 00205 g004
Figure 5. XRD patterns of SnZnCu microspheres with different amounts of Zn (a) and different amounts of Cu (b). XRD patterns of Sn, SnCu0.015, and SnZn0.04 microspheres are also shown for comparison.
Catalysts 12 00205 g005
Figure 6. DSC curves (a) and phase change properties (b) of SiO2-encapsulated SnZnCu (encapsulation times = 1) of different amounts of Zn. The results obtained from Sn@SiO2 and SnCu0.015@SiO22 microspheres are also shown for comparison.
Catalysts 12 00205 g006
Figure 7. DSC curves (a) and phase change properties (b) of SiO2-encapsulated SnZnCu (encapsulation times = 1) of different amounts of Cu. The result obtained from SnZn0.04@SiO2 microspheres is also shown for comparison.
Catalysts 12 00205 g007
Figure 8. (a) DSC curves of SnZn0.04Cu0.015@SiO2 microspheres (encapsulation times = 3) after different numbers of thermal cycles and (b) plot of both the undercooling and latent heat vs. the number of thermal cycles.
Catalysts 12 00205 g008
Figure 9. (a) DSC curves of SnZn0.04Cu0.02@SiO2 microspheres (encapsulation times = 3) after different numbers of thermal cycles and (b) plot of both the undercooling and latent heat vs. the number of thermal cycles.
Catalysts 12 00205 g009
Figure 10. (a) DSC curves of SnZn0.04Cu0.03@SiO2 microspheres (encapsulation times = 3) after different numbers of thermal cycles and (b) plot of both the undercooling and latent heat vs. the number of thermal cycles.
Catalysts 12 00205 g010
Figure 11. XRD patterns of SnZnCu@SiO2 microspheres (encapsulation times = 3) after different numbers of thermal cycles: (a) SnZn0.04Cu0.015@SiO2, (b) SnZn0.04Cu0.02@SiO2, and (c) SnZn0.04Cu0.03@SiO2. The Cu5Zn8 phase is indicated by a red star. The inset of Figure 10b is the DSC curve of the SnZn0.04Cu0.02@SiO2 microspheres after 150 thermal cycles.
Catalysts 12 00205 g011
Figure 12. (a) Illustration for the structural difference between PCM-absent and PCM-present Co/SiO2 catalysts before activation and (b) TEM image of Co3O4 nanoparticles.
Catalysts 12 00205 g012
Figure 13. Temperature profiles at the centerline of the packed beds of PCM-absent (a) and PCM-present (c) Co/SiO2 catalysts measured by a multi-point thermocouple (locations of thermocouple no. 1–5 are shown in the inset) and CO conversion as a function of reaction time over PCM-absent (b) and PCM-present (d) Co/SiO2 catalysts. Inset in (c) is a magnified version of the plot of temperature vs. reaction time (from 0 to 4 h).
Catalysts 12 00205 g013
Table 1. A comparison between the properties of SnZn0.04Cu0.03@SiO2 microspheres and some PCMs with a melting peak temperature ranging from 220 to 240 °C.
No.Phase Change MaterialMelting Peak Temperature/°CUndercooling/°CHeat of Fusion on a Mass Basis (J/g)Heat of Fusion on a Volume Basis (J/cm3)Ref.
1Sn@Al2O3-1600233.6~7846.01unknown[16]
2Sn@ SiO2 microspheres235.076.257.8unknown[14]
3Ca(NO3)2/NaNO3 (30:70 mol.%)~230unknown135.8269 a[33]
4KNO3/NaNO3 (50:50 mol.%)226.0~5106.3207 a[34]
5KNO3/NaNO3 (50:50 mol.%)/SiC(30 wt.%)226.7~572.8<207 a[34]
6H220220unknown100200[4]
7NaNO3/KNO3 (60:40 wt.%)223.2unknown142.2275 a[35]
8NaNO3/KNO3 (60:40 wt.%)/graphite (1 wt.%)224.8unknown128.4<275 a[35]
9SnZn0.04Cu0.03@SiO2
microspheres
229.24.357.9330 bThis work
a Estimated based on the density data at 493 K found in the Refs. [36,37]. b The density measured is about 5.7 g/cm3 at 25 °C.
Table 2. Nominal atomic concentration of Zn or/and Cu in the samples.
Sample No.Sample CodeNominal Atomic Concentration of Zn or/and Cu
Zn (at.%)Cu (at.%)
1Sn00
2SnCu0.01501.5
3SnCu0.0202.0
4SnCu0.0303.0
5SnZn0.044.00
6SnZn0.03Cu0.0153.01.5
7SnZn0.04Cu0.0154.01.5
8SnZn0.05Cu0.0155.01.5
9SnZn0.04Cu0.024.02.0
10SnZn0.04Cu0.034.03.0
11SnZn0.04Cu0.044.04.0
Publisher’s Note: MDPI stays neutral with regard to jurisdictional claims in published maps and institutional affiliations.

