Article

Photocatalytic Degradation of Fluoroquinolone Antibiotics in Solution by Au@ZnO-rGO-gC3N4 Composites

1
Arecibo Observatory, Universidad Ana G. Méndez, Cupey Campus, San Juan, PR 00926, USA
2
Department of Chemistry, University of Puerto Rico, Rio Piedras Campus, San Juan, PR 00925, USA
3
Nanomaterials Research Group, Department of Natural Sciences and Technology, Division of Natural Sciences, Technology and Environment, Universidad Ana G. Méndez, Gurabo Campus, Gurabo, PR 00778, USA
4
International Federation for the Promotion of Mechanism and Machine Science (IFToMM), Romanian Association for Theory of Machines and Mechanisms (ARoTMM), Bucharest Polytechnic University, 060042 Bucharest, Romania
5
Department of Applied Physics, Instituto de Ciencia de Materiales Nicolás Cabrera, Autonomous University of Madrid, 28049 Madrid, Spain
*
Authors to whom correspondence should be addressed.
Catalysts 2022, 12(2), 166; https://doi.org/10.3390/catal12020166
Submission received: 8 January 2022 / Revised: 20 January 2022 / Accepted: 22 January 2022 / Published: 28 January 2022

Abstract

:
The photocatalytic degradation of two quinolone-type antibiotics (ciprofloxacin and levofloxacin) in aqueous solution was studied, using catalysts based on ZnO nanoparticles, which were synthesized by a thermal procedure. The efficiency of ZnO was subsequently optimized by incorporating different co-catalysts of gC3N4, reduced graphene oxide, and nanoparticles of gold. The catalysts were fully characterized by electron microscopy (TEM and SEM), XPS, XRD, Raman, and BET surface area. The most efficient catalyst was 10%Au@ZnONPs-3%rGO-3%gC3N4, obtaining degradations of both pollutants above 96%. This catalyst has the largest specific area, and its activity was related to a synergistic effect, involving factors such as the surface of the material and the ability to absorb radiation in the visible region, mainly produced by the incorporation of rGO and gC3N4 in the semiconductor. The use of different scavengers during the catalytic process, was used to establish the possible photodegradation mechanism of both antibiotics.

1. Introduction

Antibiotics have become emerging pollutants due to their widespread use and persistence in the environment [1,2,3]. The origin is very varied, although they come mainly from medical treatments, agricultural, livestock, and industrial production [4,5,6,7]. The presence of antibiotics in the natural environment presents a serious health risk, since they can lead to the development of antibiotic-resistant bacteria and, in general, promote the destabilization of the natural environment [8,9]. Fluoroquinolone-based antibiotics, particularly ciprofloxacin and levofloxacin, are widely used in human and veterinary medicine [1,2,3]. They are used to fight bacterial infections like pneumonia, kidney or prostate infections, and even skin infections. In fact, this family of antibiotics is by far the most widely used for medical and veterinary treatments. Due to the chemical structure, after consumption by humans or animals, only between 15 and 20% is metabolized, so the non-metabolized antibiotic is eliminated into the environment through urine or feces [10]. Once released into the natural environment, these antibiotics are highly recalcitrant to degradation, which is why they have been detected in very worrying quantities in wastewater, surface water, ground water, and even in drinking water [11]. In general, some antibiotics can be eliminated from water bodies by different techniques such as adsorption, nanofiltration, coagulation, electrolysis, or even biodegradation [12,13]. These decontamination techniques have been implemented in wastewater processing plants, especially in developed countries, although these methods are very expensive, require large spaces and are not very efficient. In fact, already treated waters continue to show high levels of these pollutants [14]. As an alternative procedure to those already mentioned above, it is worth highlighting the chemical transformation through advanced oxidation processes (AOPs), and especially those involving semiconductor photocatalysts [15]. These processes are based on the catalytic photodegradation of organic pollutants in aqueous solution, being much more efficient than conventional methods, as well as being friendly with the environment [15]. The AOPs produce highly oxidized species such as radicals and other reactive species, which degrade, through a chain reaction, organic pollutants in solution allowing complete mineralization [16,17].
Among the most widely used semiconductor materials, it is worth mentioning titanium oxide (TiO2) and zinc oxide (ZnO), due to their low cost, non-toxicity, large specific surface area of some of their forms, and high catalytic activity [18,19]. The main limitation of both semiconductors is the wide bandgap (ca. 3.2 eV in TiO2 anatase and 3.0 eV in TiO2 rutile, and 3.37 eV in ZnO wurtzite), which requires irradiation with UV light for the photoactivation process [20]. UV radiation from the solar spectrum is limited to about 5% of the total radiation reaching the earth’s surface, so these catalysts are clearly inefficient [21]. However, alternatives such as doping these semiconductors with metallic nanoparticles and other additives deposited on the surface have made it possible to reduce bandgap and substantially promote electron-hole separation, avoiding rapid recombination processes [22]. The incorporation of Au nanoparticles on the surface of semiconductors enables the appearance of surface plasmon resonance (SPR), greatly improving the storage capacity and charge separation which increases the photocatalytic activity of the heterostructure [23,24]. Nevertheless, there are many other factors that decisively affect the photocatalytic behavior of the material, especially morphology, particle size, crystallinity and specific area, controlled during the synthesis procedure [25]. Graphene and especially graphene oxide (GO) provides scaffolds to anchor other components, due to their two-dimensional structure and large surface area [26]. There are many examples of nanohybrids prepared with GO with extraordinary optical, electrical, and thermal properties that have a direct effect on the catalytic activity of the material [27,28]. On the other hand, the incorporation of GO to ZnO has been shown to increase the activity, reducing the photocorrosion of the semiconductor, facilitating the separation of charges and the inhibition of the electron-hole recombination processes [29]. Additionally, the two-dimensional structure of GO greatly improves the interaction with organic pollutants, accelerating the subsequent photocatalytic degradation [30]. Graphitic carbon nitride (gC3N4) [31], is an allotropic material of carbon nitride, rich in nitrogen, and with truly extraordinary properties that allow its use in different applications such as catalysis, photodegradation of organic pollutants, CO2 fixation, catalysis and even in energy storage systems [32,33,34]. Among the most relevant properties, it is worth highlighting its great thermal and chemical stability, its two-dimensional structure capable of facilitating interaction with other materials, and its simple synthesis method [34]. The purpose of doping with noble metal nanoparticles and the manufacture of complex hybrid composites has been to develop more efficient catalytic heterostructures, capable of showing reduced bandgap, altered electronic properties that allow efficient generation of hole-electron pairs, and inhibition of recombination processes [35]. Over the last few years, complex systems have been developed, with improved and increasingly outstanding properties, which have been applied to many processes, and especially to the degradation of highly persistent organic pollutants. In this sense, it is worth highlighting the catalysts based on metallic nanoparticles, dispersed on semiconductors such as TiO2, ZnO, Fe2O3, ZnS, or CdS [36]. Other catalysts, based on heterostructures formed by rare earth metal oxides, combined with graphitic carbon nitride have also been designed, showing good catalytic behavior [37].
Taking into account all the previous research, the objective of this work has been to obtain catalysts, based on the incorporation of gold nanoparticles on the surface of heterostructures formed by ZnO nanoparticles, to which reduced GO (rGO) and graphitic carbon nitride have been incorporated. These catalysts were used for the photodegradation of ciprofloxacin (CFX) and levofloxacin (LFX) in aqueous solution. The structural properties and morphology of the most active catalyst has been investigated using different spectroscopic and analytical techniques, such as XRD, XPS, Raman, DRS, SEM, TEM, and BET analysis. Finally, based on the results obtained, a possible photodegradation mechanism of the two antibiotics studied is proposed.

2. Results

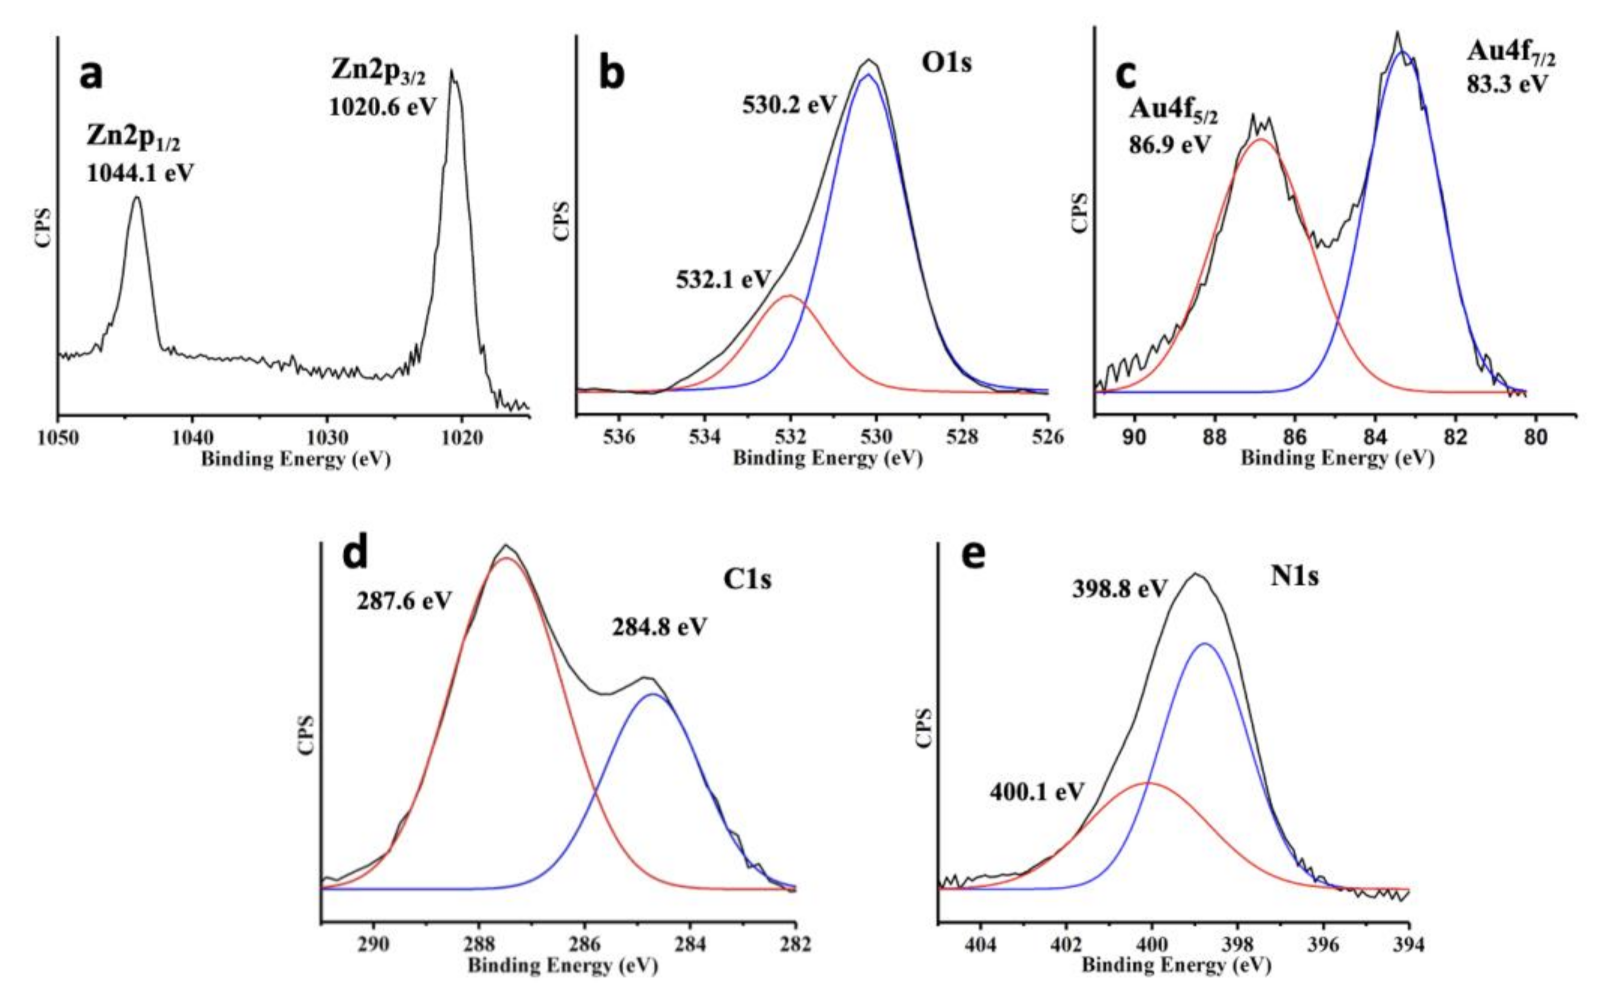
2.1. Characterization of Catalysts

Three types of catalysts were synthesized, based on Au@ZnONPs, Au@ZnONPs-3%rGO, and Au@ZnONPs-3%rGO-3%gC3N4. In these catalysts, the percentage of rGO and gC3N4 was always maintained at 3%, although percentages of Au nanoparticles of 1%, 5% and 10% were used, thus, a total of nine catalysts were obtained. All these catalysts were used for the photodegradation of CFX and LFX, and the most efficient catalyst (10%Au@ZnONPs-3%rGO-3%gC3N4) was the one that was fully characterized by different techniques.
The BET surface area of the catalysts was analyzed (see Table 1). ZnO nanoparticles showed a relatively large surface area of 24 m2g−1. Incorporation of Au on the surface increased the specific area of the material to 58 m2/g in the case of 1%Au@ZnONPs, and continued to increase, as a function of Au loading, up to a maximum value of 78 m2/g in 10%Au@ZnONPs. This behavior, which has been described previously with different metallic nanoparticles, is expected to contribute to the catalytic activity of the material. The incorporation of 3%rGO, which already has a very large surface area, considerably increases the surface area of the material, reaching values as high as 196 m2/g in the case of 10%Au@ZnONPs-3%rGO. The incorporation of gC3N4 also increased the area of the material, although not as drastically as in the case of rGO, reaching area values of 229 m2/g in the case of 10%Au@ZnONPs-3%rGO-3%gC3N4. This last catalyst, with the highest specific area, is the most active in the processes studied, as will be seen later.
The dispersion of 10%Au on the support of ZnONPs was followed by elemental mapping (see Figure 1). Figure 1b,c show the distribution of Zn and Au, respectively, corresponding to the SEM image of Figure 1a. As can be seen, Au presents some aggregates, although, in general, and considering the high percentage of the metal, a good dispersion is observed. Using this material as the starting catalyst, 3% rGO and 3% gC3N4 were incorporated. Figure 2 shows the TEM and HR-TEM images obtained for the most active catalyst in the photodegradation reactions (10%Au@ZnONPs-3%rGO-3%gC3N4). Figure 2a shows the TEM image of the catalyst, in which the heterostructure can be observed, together with the highly dispersed gold nanoparticles on the surface. The inset image presents the selected area electron diffraction (SAED) pattern of the photocatalyst, demonstrating the crystalline nature of the sample. Figure 2b shows the HRTEM image of a ZnO nanoparticle showing the distinct lattice fringes with interplanar spacing of 0.28 nm, indexed to the (100) crystal plane of ZnO with a hexagonal wurtzite structure [38]. Figure 2c shows a region of the catalyst gC3N4. A crystalline structure is observed, whose lattice distance is approximately 0.33 nm, corresponding to the (002) plane of gC3N4 [39,40]. Figure 2d shows the distribution of gold nanoparticles on the heterostructure, together with the area of the sample that has been identified as rGO. One of these nanoparticles is the one that has been magnified in Figure 2e, whose interplanar spacing of ca. 0.23 nm has been indexed to (111) crystal plane of Au [41]. Figure 2f presents the ultra-high resolution detail of a gold nanoparticle just over 1 nm in diameter. This particle has been further enlarged to appreciate the details of the icosahedral structure. The white lines delineate the boundaries between five different crystal domains on the nanoparticle. One of the faces shows the interplanar spacing of 0.23 nm, assigned to Au (111).
10%Au@ZnONPs-3%rGO-3%gC3N4 was also characterized by X-ray diffraction (XRD). Figure 3 shows the diffraction pattern of the catalyst, along with that of rGO, gC3N4, and ZnONPs for comparison purposes. There is a broad peak at ca. 23.8° for rGO, assigned to the (002) crystal plane, indicating that most of the oxygen functional groups, characteristic of GO, have been removed from the surface [42]. Additionally, rGO shows a second peak at about 43° assigned to the (100) plane of the hexagonal carbon structure. The XRD pattern of gC3N4 is shown in Figure 3b. Two broad peaks are observed at ca. 13° and 27.2°, which have been assigned to crystalline planes (100) and (002), respectively [39,40]. The peak shown at 27.2°, and which is also the most intense, corresponds to an interplanar spacing of 0.33 nm, the crystallographic planes which were observed in Figure 1c. The diffraction peaks of ZnONPs (see Figure 3c) can be unambiguously indexed to the ZnO phase of hexagonal wurtzite [43], whose peaks are the dominant ones in the 10%Au@ZnONPs-3%rGO-3%gC3N4 catalyst, as observed in Figure 3d. Neither rGO nor gC3N4 are detected in the XRD of the catalyst, possibly because the proportion of these components in the heterostructure is too small. Additionally, a low intensity peak is observed at ca. 38.1°, which has been assigned to Au (111) [41], and whose crystallographic planes were observed in Figure 2e.
Figure 4 shows the Raman spectrum of 10%Au@ZnONPs-3%rGO-3%gC3N4, along with those of rGO, gC3N4, and ZnONPs. As can be seen, rGO is characterized by two broad bands at 1357 and 1600 cm−1 (Figure 4a) that have been assigned to bands D (A1g mode), and G (E2g mode of sp2 carbon atoms), respectively. The intensity ratio of these bands (IG/ID) is ca. 0.95, indicating that the GO reduction is not too high [43]. gC3N4 (Figure 4b) shows two typical bands, similar to those seen in rGO, although slightly displaced. Band D is associated with the possible presence of sp3 carbon, justified by structural defects and disarrangements, while band G is associated, in the same way as in rGO, with the presence of sp2 carbon [44]. ZnONPs is characterized by showing two peaks at at ca. 566 cm−1 and 1143 cm−1 (see Figure 4c), which have been assigned to A1-LO and E1-LO vibration modes of ZnO, respectively [45,46]. Both peaks are indicative that ZnONPs has a wurtzite-like crystal structure, as established by XRD. The Raman spectrum of 10%Au@ZnONPs-3%rGO-3%gC3N4 is characterized by showing a main peak at 1042 cm−1, which could come from the peak observed at 1143 cm−1 in ZnONPs. Around ca. 630 cm−1 an undefined peak is observed, which could also have its origin in the peak observed at 566 cm−1 in ZnONPs. The displacements observed in the peaks of the catalyst support the fact that this material is an integrated heterostructure separate from its different components. Additionally, two small peaks are observed at ca. 1301 and 1588 cm−1 that must necessarily have their origin in the contribution of rGO and gC3N4.
The absorption of radiation by catalysts is crucial for their catalytic activity, so the different systems were analyzed using Tauc plots. As shown in Figure 5a, ZnONPs shows a bandgap in the UV region (3.23 eV). The incorporation of Au nanoparticles on the surface of the semiconductor (Figure 5b) produces a slight shift at 3.21 eV, still in the UV region. gC3N4 (Figure 5c) and rGO (Figure 5d) show bandgaps at 2.79 and 2.33 eV, respectively, already in the visible range. The addition of these components will be able to displace the bandgap of the catalyst towards the visible region. In fact, Figure 5e shows how the bandgap moves towards 2.77 eV in the 10%Au-ZnONPs-3%rGO composite. The addition of gC3N4 (Figure 5f) still causes a greater displacement, in this case up to 2.73 eV, falling squarely in the visible region. The results obtained justify the activity of the 10%Au@ZnONPs-3%rGO-3%gC3N4 heterostructure under irradiation with visible light, as will be described in the section corresponding to catalytic results.
10%Au@ZnONPs-3%rGO-3%gC3N4 was also characterized by XPS. As shown in Figure 6a, two peaks at 1020.6 eV and 1044.1 eV have been assigned to the binding energies of Zn2p3/2 and Zn2p1/2, respectively, indicating the presence of Zn2+ [47]. Furthermore, the spin-orbit splitting of these two peaks at 23.5 eV also confirmed the presence of ZnO [48]. The transition corresponding to O1s (see Figure 6b) showed a major peak at ca. 530.2 eV, which was assigned to O2− species in the ZnO network, and a shoulder at ca. 532.1 eV, assigned to O2− in oxygen-deficient regions, respectively [49]. The Au4f peak (Figure 6c) was fitted to two peaks at 83.3 and 86.9 eV, attributed to Au4f7/2 and Au4f5/2 double peaks, respectively, in metallic gold (Au0) [50]. The C1s transition (Figure 6d) showed a peak at 287.6 eV, which was assigned to C-N-C bonds, and a less intense one at 284.8 eV attributed to the aromatic C atom in the s-triazine ring, respectively [51,52]. Nitrogen from graphitic carbon nitride was evidenced by the N1s transition (see Figure 6e). This clearly asymmetric peak could be deconvolved into two components, showing an intense peak at 398.7 eV, which was assigned to C=N-C, indicating the presence of triazine rings, and a less intense peak at 400.1 eV that was assigned to the presence of tertiary N atoms (N-(C)3) [53,54]. As previously shown, the XPS analysis further confirmed the association of the different components (Au, ZnO, rGO, and gC3N4) in the heterostructure.

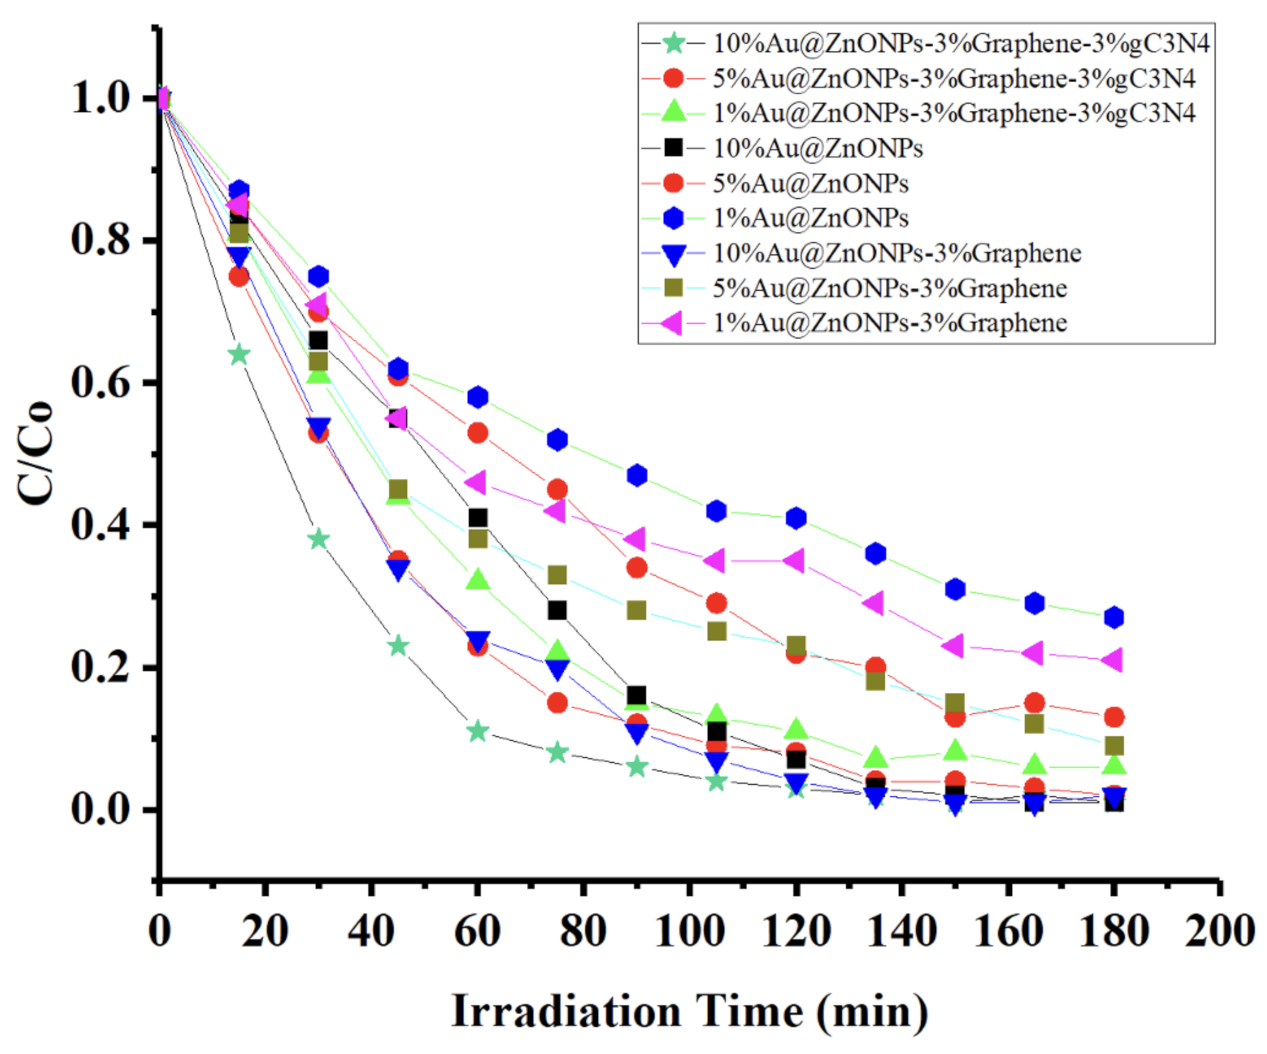
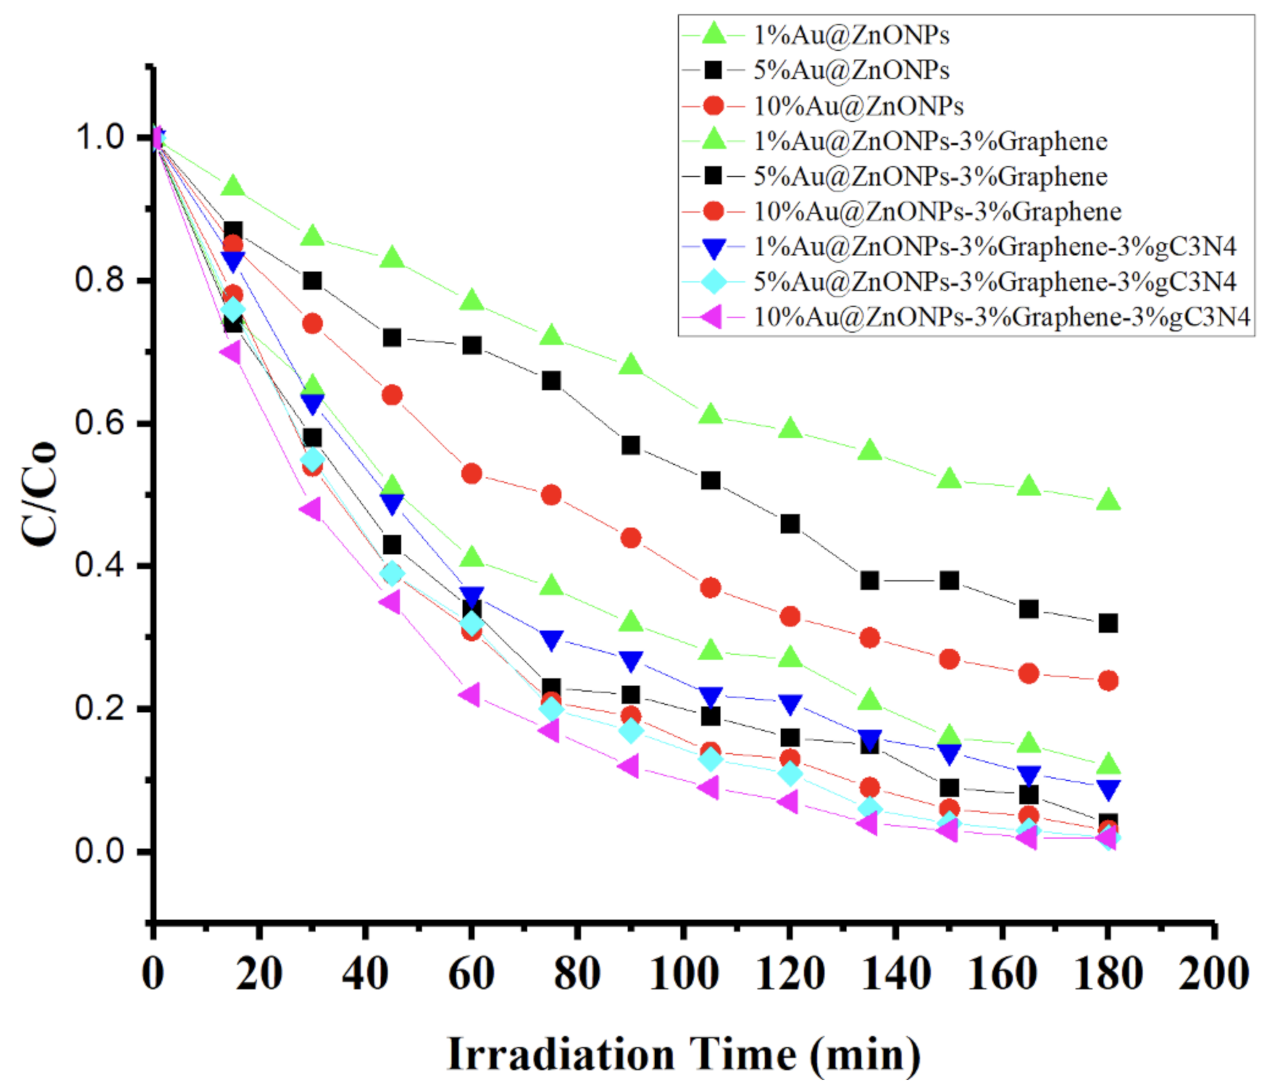
2.2. Photocatalytic Degradation

Before proceeding to the CFX and LFX photodegradation, several preliminary studies were carried out to establish the optimal reaction conditions. To do this, a study of the optimal pH was initially carried out, and it was established that the most appropriate pH for both antibiotics was to use solutions at pH = 7, which guaranteed the maximum solubility of both contaminants in water. Another parameter that was evaluated was the initial antibiotic concentration. For this, the three catalytic systems studied were used, using, in all cases, the highest concentration of Au (10%). The results for CFX and LFX are shown in Figure S1. As can be seen, there is a clear relationship between the percentage of degradation and the initial concentration of the antibiotic. In the case of CFX (Figure S1a), the highest activity in the three catalytic systems studied was obtained at a concentration of 20 mM. In the case of LFX (see Figure S1b), the optimal concentration was half (10 mM), possibly because LFX is slightly less soluble in water than CFX. Another of the preliminary studies that were carried out established the optimal amount of catalyst in the reaction medium. As can be seen in Figure S2, there is a clear correlation between the amount of catalyst and the percentage of degradation. For both antibiotics, a sustained increase in the efficiency of the process was observed, until reaching a load of 1.1 gL−1 in CFX (Figure S2a), and 1 gL−1 in LFX (Figure S2b). From these values, a drop in efficiency was observed, which has been justified on the basis of possible radiation scattering processes that potentially occur from a certain catalyst load. Taking into account the above considerations, the optimal reaction conditions for each antibiotic were established. In the case of CFX, the optimized conditions were: pH = 7, [CFX]i = 20 mM, and catalyst loading of 1.1 gL−1, while for LFX, the reaction conditions were: pH = 7, [CFX]i = 10 mM, and catalyst loading of 1 gL−1.
Figure 7 and Figure 8 show the results of photodegradation of CFX and LFX, respectively, for each of the catalysts studied. The study was carried out for a total time of 180 min and, for both contaminants, the behavior was very different depending on the catalyst. In the case of CFX (Figure 7), it was observed that after 3 h, the degradation ranged between 73% and 99%. The highest efficiency was obtained with 10%Au@ZnONPs-3%rGO-3%gC3N4, while the lowest degradation was obtained with 1%Au@ZnONPs. In this last catalyst, the percentage of Au on the surface clearly affects the reaction, facilitating absorption and formation of electron-hole pairs, showing greater efficiency with 5%Au@ZnONPs, and a maximum efficiency with 10%Au@ZnONPs. In the case of LFX, the behavior is similar, showing the highest degradation with 10%Au@ZnONPs-3%rGO-3%gC3N4 (96%), and the lowest with 1%Au@ZnONPs (51%). As seen with CFX, the addition of a higher gold load greatly increased the efficiency of the process. For both CFX and LFX, the incorporation of rGO considerably improved the efficiency of photodegradation, which was maximized with the addition of gC3N4, especially in catalysts with 10%Au. Another observation to consider when comparing the degradation profiles of CFX and LFX is the different rate at which the process is carried out. The degradation of CFX is certainly faster than that of LFX, indicating that CFX is more recalcitrant to degradation. The greater degradation observed when incorporating rGO and, additionally, gC3N4 is due to a synergistic effect of improvement of the electrical and conductive properties of the material, and to an increase in absorption in the visible region, as evidenced by the determination of the bandgap (see Figure 5).
In order to investigate the kinetic behavior of the photodegradation of CFX and LFX, the pseudo-first-order kinetics were studied by representing −ln (C/C0) vs. the irradiation time (see Figure S3). The results obtained are shown in Table S1, indicating that the apparent rate constant of the catalysts increases with an increasing amount of Au on the surface, and when incorporating rGO and gC3N4. The correlation coefficients R2 (see Table S1) are higher for the linear fits of LFX than CFX although, as derived from the results obtained, for both contaminants the degradation clearly follows pseudo-first-order kinetics. This behavior can also be correlated with the BET surface area of these catalysts. Thus, as shown in Table 1, the materials that show the highest BET area values are those that have better catalytic behavior, with higher apparent rate constants.
To further study the photocatalytic activity of 10%Au@ZnONPs-3%rGO-3%gC3N4, control experiments and recyclability tests were carried out. The control experiments for both contaminants were similar (Figure S4). After 3 h of reaction, it was found that CFX and LFX were highly recalcitrant. Under photolysis conditions, that is, in the absence of the catalyst with the rest of the components present, a very slight reduction in the concentration of both CFX and LFX was observed, which indicates that radiation absorption is the only pathway responsible for this change and, as seen in Figure S4, it is clearly inefficient. In the absence of oxygen, a greater degradation of CFX than LFX was observed but, in both cases, the percentage of degradation after 3 h of reaction is not relevant. From control experiments, photocatalysis is shown to be the primary degradation route, indicating that catalysis, or even photolysis, is totally insufficient to degrade antibiotics. The results of recyclability of 10%Au@ZnONPs-3%rGO-3%gC3N4 for the degradation of CFX and LFX during five cycles are shown in Figure S5. The catalyst was recovered after each cycle by centrifugation (3000 rpm for 20 min). After the supernatant was decanted, the catalyst was washed three times with deionized water and once with ethanol (using centrifugation–sonication cycles), and dried for at least 5 h at 60 °C. The parameters used for the degradation of each antibiotic were set to optimal values, as previously described. In CFX (Figure S5a) it was found that the degradation remained practically constant after each cycle, going from 99% after the first cycle to 97% after the fifth cycle. In the case of LFX (Figure S5b), the recyclability was not as good, going from a degradation of 97% in the first cycle to 90% after the fifth cycle. In both cases (CFX and LFX) the photocatalyst recovered after the fifth cycle was analyzed by XRD (not shown) showing a diffraction pattern without notable differences with respect to the XRD of the catalyst before use.

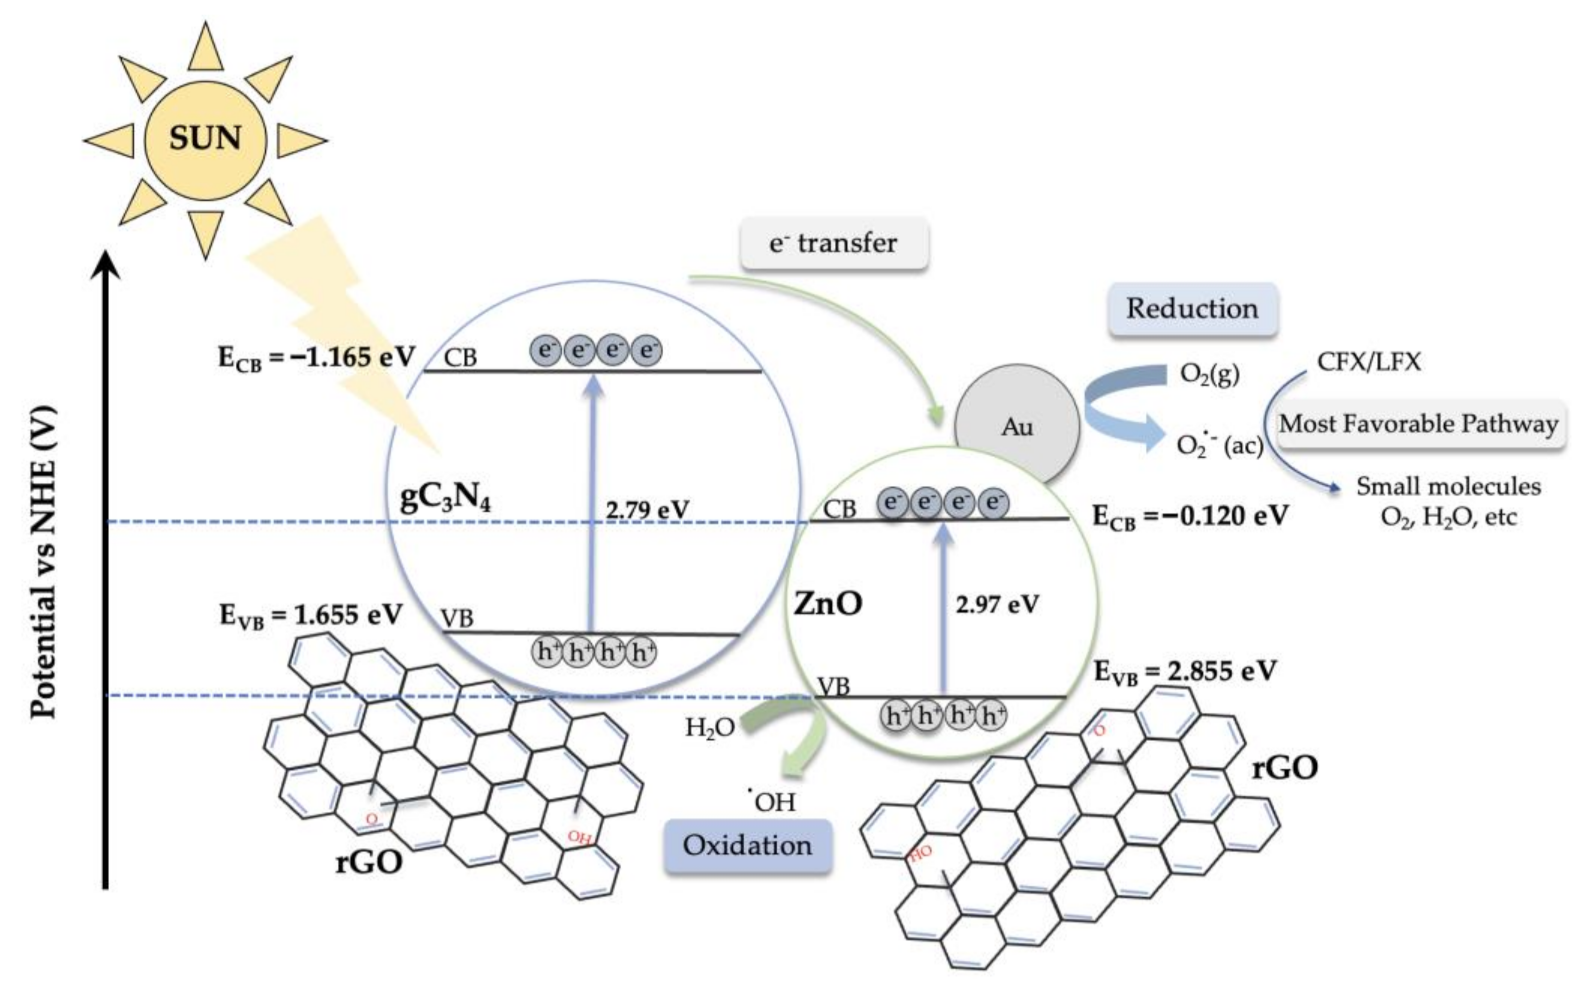
2.3. Proposed Photodegradation Mechanism for CFX and LFX

As previously shown, gold nanoparticles improve catalytic efficiency, which increases appreciably when rGO and gC3N4 are incorporated. The most efficient catalyst for the photodegradation of CFX and LFX (10%Au@ZnONPs-3%rGO-3%gC3N4) incorporates different characteristics that act synergistically on its behavior, that is, increased surface area and smaller bandgap. The considerable increase in the specific area of the catalyst can provide more active sites during the photocatalytic reaction, thus producing more photogenerated electrons, which can also lead to less recombination of photogenerated charge carriers. This decrease in recombination is also favored by the presence of Au nanoparticles, which act as electron sinks. The displacement towards the visible region of the bandgap, with respect to other catalysts studied, is another of the decisive factors for the observed behavior.
In this context, and to evaluate the photodegradation mechanism, some scavengers were added to the reaction. In this photocatalytic study, benzoquinone (BQ), ethylenediaminetetraacetic acid disodium salt (EDTA), and methanol (MetOH), were employed to capture superoxide radicals (·O2−), holes (h+), and hydroxyl radicals (·OH), respectively [55,56], determining the percentage of degradation of CFX and LFX after 3 h of reaction (see Figure S6). As can be seen, BQ hindered photoactivity noticeably, suggesting the main role of the O2− reactive species in the photodegradation process. EDTA and MetOH hindered the reaction to a lesser extent, which supports the fact that h+ and ·OH do not play a prominent role in the degradation process. This effect is similar for both antibiotics (see Figure S6a,b), although in the case of LFX, the effects of all scavengers were certainly greater.
Taking into account these results, together with the determination of the bandgaps (see Figure 5), a photodegradation mechanism of CFX and LFX using 10%Au@ZnONPs-3%rGO-3%gC3N4 (Figure 9) has been proposed. For this, the Mulliken electronegativity theory [57,58] has been used, which allows establishing the band edge position of the different components of the catalyst and, in this way, determining the migration direction of the photogenerated charge carriers in the composite (Equations (1) and (2)).
ECB = X − EC − 0.5Eg
EVB = ECB + Eg
where ECB and EVB are the edge potentials of the valence band (VB) and conduction band (CB), respectively, X is the absolute electronegativity, EC is the energy of free electrons on the hydrogen scale (4.50 eV) [59,60], and Eg is the bandgap. X values for ZnO and gC3N4 are 5.75 [61] and 4.73 eV [62], respectively. The calculated ECB and EVB edge positions for Au@ZnONPs are −0.355 and 2.855 eV, respectively, while for gC3N4 the calculated values were −1.165 and 1.625 eV, respectively, being in agreement with values previously determined in other investigations [62,63].
Under visible radiation (Figure 9), the electrons of the VB of gC3N4 are excited towards the conduction band (CB), giving rise to h+ in the VB. Due to the potential difference with respect to ZnONPs, the electrons of the conduction band of gC3N4 move towards the CB of Au@ZnONPs. Au acts as a sink for electrons [64,65], which is why they move towards Au and it is there that they react with the adsorbed molecular oxygen to generate superoxide anions, which in turn can react with water molecules to form hydroxyl radicals. According to studies carried out with different scavengers, the O2− anion is the one that preferentially participates in the photodegradation process of antibiotics, giving rise to small molecules as a by-product of the reaction, CO2 and water. The holes formed in the VB of gC3N4 and, to a lesser extent in ZnO, will promote the oxidation of CFX and LFX also leading to degradation. However, this second pathway, as evidenced above, is not the most favored pathway. AuNPs, in addition to acting as electron sinks and thus reducing recombination processes, also contribute to the system through the surface plasmon resonance mechanism, reacting with molecular oxygen and generating superoxide anions. Photogenerated electrons are also transferred to rGO that, as in the case of gold, acts as an electron acceptor and transport medium in the photocatalytic system, suppressing the recombination of e-h+ pairs. Photodegradation reactions therefore also occur on rGO sheets, increasing the specific surface area and active reaction sites [65].

3. Materials and Methods

3.1. Reagents and Materials

All the reagents were used as received, without further purification. All the solutions were prepared using deionized water (Milli-Q water, 18.2 MΩcm−1 at 25 °C). Zn(CH3COO)2 (99.99%, trace metal basis), HAuCl4•3H2O (ACS Reagent, 49.0+% Au basis), Ethanol (200 proof, anhydrous, ≥99.5%), NaBH4 (99.99% trace metals basis), melamine (2,4,6-Triamino-1,3,5-triazine, 99%), reduced graphene oxide (rGO), ethylenediaminetetraacetic acid, disodium salt dihydrate (EDTA, ACS Reagent, 99.9+%), P-benzoquinone (Spect. Grade, 99.5+%), and methanol (HPLC Plus, 99.9+%) were provided by Sigma–Aldrich (Darmstadt, Germany). NaOH (98+%) and HCl (36% w/w aq. soln) were acquired from Alfa Aesar. Whatman® Puradisc 13 disposable syringe filters (Clifton, NJ, USA) were used for the aliquot filtration process.

3.2. Synthesis of Nanomaterials

Zinc oxide nanoparticles (ZnONPs) were synthesized by thermal decomposition of anhydrous zinc acetate. In a standard synthesis, 5 g of zinc acetate was introduced into an alumina crucible which was covered by a perforated alumina lid, and subsequently placed in a tube furnace. Next, the sample was subjected to heat treatment in air flow (300 mL/min) using a temperature ramp of 3 °C/min until reaching 450 °C. The sample was kept at this temperature for 2 h then proceeded to cool, maintaining an air flow of 100 mL/min and a ramp of −10 °C/min. The sample was recovered the next day. Graphitic carbon nitride was synthesized using the procedure described by Mo et al. [66]. For this, 2 g of melamine were introduced into a crucible, which was subsequently treated at 650 °C (heating rate of 2 °C/min) in flowing nitrogen (200 mL/min), for 4 h. After treatment, the synthesized material was subjected to exfoliation. For this, 200 mg of gC3N4 were put in contact with 20 mL of concentrated H2SO4 (with stirring for 6 h). The solution was then treated with ultrasound for 2 h. The mixture was decanted and centrifuged, washed with water several times until neutral, and finally rinsed with ethanol to facilitate drying. The gC3N4 crystals obtained after the described process showed a characteristic white color.
The deposition of Au NPs has been described elsewhere [49]. In a typical synthesis, 1g of ZnONPs was dispersed in 100 mL of H2O and the mixture was sonicated for 30 min. After that, the desired amount of the gold precursor (HAuCl4·3H2O) was added to the reaction mixture and kept stirring for 30 min. Finally, a solution of NaBH4 (10 mg in 10 mL of H2O) was added dropwise while maintaining stirring. After the reagent was added, the solution was kept stirring for an additional 30 min. The reaction product was separated by centrifugation, washed 4 times with deionized water, and dried overnight at 80 °C. The different compounds of Au@ZnONPs were identified as 1%Au@ZnONPs, 5%Au@ZnONPs and 10%Au@ZnONPs, where the numbers correspond to the percentage by weight of gold nanoparticles deposited in each sample. The material obtained was used for the following stages of preparation of the catalysts. Thus, 200 mg of ZnONPs containing the gold nanoparticles were dispersed in a solution containing 10 mL of ethanol and 40 mL of deionized water, and the mixture was vigorously stirred for 30 min. Subsequently, the reduced graphene oxide (rGO) was added, and the suspension was kept under stirring for 1 h. Subsequently, the product was separated from the solution by centrifugation, washed 4 times with deionized water and dried overnight at 80 °C. Next, and by same procedure described for rGO, the incorporation of graphitic carbon nitride (gC3N4) was carried out. Finally, the product was collected, sealed, and stored at room temperature. The different catalysts prepared, based on Au@ZnONPs, Au@ZnONPs-rGO, and Au@ZnONPs-rGO-gC3N4 were identified indicating the percentage of gold incorporated on the surface. In all cases, the amount of rGO and gC3N4 used was 3% by weight.

3.3. Characterization of the Catalysts

The morphology of the catalysts was characterized by Scanning Electron Microscopy (SEM), using a Hitachi S-3000N instrument (Westford, MA, USA), equipped with a EDX Quantax EDS X-Flash 6I30 Analyzer, and by High Resolution Transmission Electron Microscopy (HRTEM), using a JEOL 3000F (Peabody, MA, USA). XPS measurements were performed on an ESCALAB 220i-XL spectrometer (East Grinstead, United Kingdom), using the non-monochromated Mg Kα (1253.6 eV) radiation of a twin-anode, operating at 20 mA and 12 kV in the constant analyzer energy mode, with a PE of 40 eV. Brunauer Emmett Teller (BET) specific areas were measured using a Micromeritics ASAP 2020, according to N2 adsorption isotherms at 77 K. Raman spectra were collected using a DXR Raman Microscope (Thermo Scientific, Waltham, MA, USA), employing a 532 nm laser source at 5 mW power and a nominal resolution of 5 cm−1. Diffuse reflectance measurements were carried out on a Perkin Elmer Lambda 365 UV-Vis spectrophotometer (Perkin Elmer, Waltham, MA, USA), equipped with an integrating sphere. The bandgap value was obtained from the plot of the Kubelka–Munk function versus the energy of the absorbed light [67]. X-ray powder diffraction patterns (XRD) were collected using a Bruker D8 Discover X-ray Diffractometer (Madison, WI, USA), in Bragg–Brentano goniometer configuration. The X-ray radiation source was a ceramic X-ray diffraction Cu anode tube type Empyrean of 2.2 kW. XRD diffractograms were recorded in angular range of 30–75° at 1° min−1, operating at 40 kV and 40 mA.

3.4. Photocatalytic Experiments

To test the activity of the synthesized catalysts in the photodegradation process of ciprofloxacin and levofloxacin, a solar simulator composed of three white annular bulbs with a total irradiation power of 90 watts was used. In the case of ciprofloxacin, a 2 × 10⁻⁵ M solution was prepared, while for levofloxacin the concentration used was 10−5 M. Next, the desired catalyst was added, the amount of which also depended on the antibiotic used. After adding the catalyst and adjusting the pH to 7, the system was kept in the dark for 30 min to allow the system to reach adsorption–desorption equilibrium. Then, a small amount of H2O2 (2 mL, 0.005%) was added, and additional oxygen was provided to the system by constantly bubbling air into the reaction mixture. The white bulbs were then turned on and the photocatalytic system was maintained with constant agitation and irradiation. The reaction was monitored for a period of 180 min and photodegradation was followed by taking aliquots every 15 min. After filtering the aliquots with Whatman® Puradisc 13 (Clifton, NJ, USA) disposable syringe filters, the samples were immediately analyzed at room temperature with a Perkin Elmer Lambda 35 UV-vis spectrophotometer (San José, CA, USA).

4. Conclusions

The photocatalytic degradation of two quinolone-type antibiotics (CFX and LFX) in aqueous solution was studied, using catalysts based on ZnONPs, which were synthesized by means of a thermal procedure. Subsequently, the efficiency of ZnONPs was optimized by incorporating different cocatalysts of gold, rGO, and gC3N4, obtaining a total of nine different catalysts that were used in the photodegradation reaction of CFX and LFX. The most efficient catalyst was 10%Au@ZnONPs-3%rGO-3%gC3N4, allowing degradations of both pollutants above 96%. This catalyst has the largest specific area, and its activity has been related to a synergistic effect, involving factors as relevant as the surface of the material and the ability to absorb radiation in the visible region, mainly produced by the incorporation of rGO and gC3N4 to the semiconductor. The use of different scavengers during the catalytic process, together with the determination of bandgaps of the different components of the photocatalyst, has made it possible to establish a possible photodegradation mechanism of CFX and LFX in which superoxide radicals (·O2−) are the main reactive species involved in the process. The results obtained are certainly relevant because, in less than 3 h, almost complete photodegradation of CFX and LFX occurs, with conversions above 96%. Some catalysts based on TiO2 doped with boron have shown high degradation percentages (ca. 88%) [68]. In other cases, copper tungstate (CuWO4) catalysts doped with graphene have made it possible to obtain CFX degradations of ca. 97% [69]. Other catalysts based on ZnO doped with silver allowed degradation to 99% of CFX [49], although preliminary studies showed many difficulties in photodegrading LFX. Considering the results published so far, the catalyst developed in this research is cost effective, easy to synthesize, and highly effective to for the degradation of both CFX and LFX, opening up a wide field of possibilities in environmental decontamination processes. In addition, the developed catalyst could have relevant uses for facing environmental problems generated by other pollutants, from an applied and global point of view.

Supplementary Materials

The following supporting information can be downloaded at: https://www.mdpi.com/article/10.3390/catal12020166/s1, Figure S1: Evaluation of the initial concentration of (a) CFX and (b) LFX on the catalytic efficiency of 10%Au@ZnONPs, 10%Au@ZnONPs-3%rGO, and 10%Au@ZnONPs-3%rGO-3%gC3N4 in the photodegradation reaction; Figure S2: Evaluation of the initial concentration of 10%Au@ZnONPs, 10%Au@ZnONPs-3%rGO, and 10%Au@ZnONPs-3%rGO-3%gC3N4 on the efficiency of the photodegradation reaction of (a) CFX and (b) LFX; Figure S3: Pseudo-first order kinetics of photodegradation of (a) CFX and (b) LFX using different catalysts; Figure S4: Control experiments for 10%Au@ZnONPs-3%rGO-3%gC3N4 with (a) CFX and (b) LFX, under visible radiation; Figure S5: Recyclability of 10%Au@ZnONPs-3%rGO-3%gC3N4 after five consecutive catalytic cycles of photodegradation of (a) CFX and (b) LFX under visible radiation; Figure S6: Photocatalytic activity of 10%Au@ZnONPs-3%rGO-3%gC3N4 on the degradation of (a) CFX and (b) LFX in the presence of various scavengers under visible radiation; Table S1: The pseudo-first-order kinetics constants for the photodegradation of CFX and LFX.

Author Contributions

Conceptualization, A.M., F.M.; methodology, F.M., A.M.; formal analysis, F.M., M.C.C., J.D.; investigation, A.M., K.F., C.M.; resources, F.M., C.M., F.I.P.; writing—original draft preparation, F.M.; writing—review and editing, F.M., A.M., K.F., C.M., M.C.C., J.D.; supervision, A.M., F.M.; project administration, A.M., F.M.; funding acquisition, A.M., F.M., M.C.C., J.D., C.M., F.I.P. All authors have read and agreed to the published version of the manuscript.

Funding

Financial support from the NSF Center for the Advancement of Wearable Technologies-CAWT (Grant 1849243), and from the framework of the UE M-ERA.NET 2018 program under the StressLIC Project (Grant PCI2019-103594) are gratefully acknowledged.

Data Availability Statement

The data is contained in the article and is available from the corresponding authors on reasonable request.

Acknowledgments

The authors thank Raúl S. García for his arduous technical help in the procedures for the synthesis and characterization of materials. Technical assistance of I. Poveda from “Servicio Interdepartamental de Investigacion, SIdI” at Autonomous University of Madrid (Spain), is gratefully acknowledged. The facilities provided by the National Center for Electron Microscopy at Complutense University of Madrid (Spain) is gratefully acknowledged. K.F. thanks PR NASA Space Grant Consortium for a graduate fellowship (#80NSSC20M0052).

Conflicts of Interest

The authors declare no conflict of interest.

References

  1. Wang, J.; Svoboda, L.; Němečková, Z.; Sgarzi, M.; Henych, J.; Licciardello, N.; Cuniberti, G. Enhanced Visible-Light Photodegradation of Fluoroquinolone-Based Antibiotics and E. coli Growth Inhibition Using Ag–TiO2 Nanoparticles. RSC Adv. 2021, 11, 13980–13991. [Google Scholar] [CrossRef]
  2. Rodríguez-López, L.; Cela-Dablanca, R.; Núñez-Delgado, A.; Álvarez-Rodríguez, E.; Fernández-Calviño, D.; Arias-Estévez, M. Photodegradation of Ciprofloxacin, Clarithromycin and Trimethoprim: Influence of PH and Humic Acids. Molecules 2021, 26, 3080. [Google Scholar] [CrossRef] [PubMed]
  3. El-Maraghy, C.M.; El-Borady, O.M.; El-Naem, O.A. Effective Removal of Levofloxacin from Pharmaceutical Wastewater Using Synthesized Zinc Oxid, Graphen Oxid Nanoparticles Compared with Their Combination. Sci. Rep. 2020, 10, 5914. [Google Scholar] [CrossRef] [PubMed] [Green Version]
  4. Larsson, D.G.J.; de Pedro, C.; Paxeus, N. Effluent from Drug Manufactures Contains Extremely High Levels of Pharmaceuticals. J. Hazard. Mater. 2007, 148, 751–755. [Google Scholar] [CrossRef] [PubMed]
  5. Rigos, G.; Bitchava, K.; Nengas, I. Antibacterial Drugs in Products Originating from Aquaculture: Assessing the Risks to Public Welfare. Medit. Mar. Sci. 2010, 11, 33. [Google Scholar] [CrossRef] [Green Version]
  6. Hubeny, J.; Harnisz, M.; Korzeniewska, E.; Buta, M.; Zieliński, W.; Rolbiecki, D.; Giebułtowicz, J.; Nałęcz-Jawecki, G.; Płaza, G. Industrialization as a Source of Heavy Metals and Antibiotics Which Can Enhance the Antibiotic Resistance in Wastewater, Sewage Sludge and River Water. PLoS ONE 2021, 16, e0252691. [Google Scholar] [CrossRef]
  7. Rozman, U.; Duh, D.; Cimerman, M.; Turk, S.Š. Hospital Wastewater Effluent: Hot Spot for Antibiotic Resistant Bacteria. J. Water Sanit. Hyg. Dev. 2020, 10, 171–178. [Google Scholar] [CrossRef]
  8. Church, N.A.; McKillip, J.L. Antibiotic Resistance Crisis: Challenges and Imperatives. Biologia 2021, 76, 1535–1550. [Google Scholar] [CrossRef]
  9. Talebi Bezmin Abadi, A.; Rizvanov, A.A.; Haertlé, T.; Blatt, N.L. World Health Organization Report: Current Crisis of Antibiotic Resistance. BioNanoScience 2019, 9, 778–788. [Google Scholar] [CrossRef]
  10. Sitara, E.; Ehsan, M.F.; Nasir, H.; Iram, S.; Bukhari, S.A.B. Synthesis, Characterization and Photocatalytic Activity of MoS2/ZnSe Heterostructures for the Degradation of Levofloxacin. Catalysts 2020, 10, 1380. [Google Scholar] [CrossRef]
  11. Dawadi, S.; Thapa, R.; Modi, B.; Bhandari, S.; Timilsina, A.P.; Yadav, R.P.; Aryal, B.; Gautam, S.; Sharma, P.; Thapa, B.B.; et al. Technological Advancements for the Detection of Antibiotics in Food Products. Processes 2021, 9, 1500. [Google Scholar] [CrossRef]
  12. Hassan, M.; Zhu, G.; Lu, Y.; AL-Falahi, A.H.; Lu, Y.; Huang, S.; Wan, Z. Removal of Antibiotics from Wastewater and Its Problematic Effects on Microbial Communities by Bioelectrochemical Technology: Current Knowledge and Future Perspectives. Environ. Eng. Res. 2020, 26, 16–30. [Google Scholar] [CrossRef]
  13. Huang, A.; Yan, M.; Lin, J.; Xu, L.; Gong, H.; Gong, H. A Review of Processes for Removing Antibiotics from Breeding Wastewater. Int. J. Environ. Res. Public Health 2021, 18, 4909. [Google Scholar] [CrossRef] [PubMed]
  14. Rodriguez-Mozaz, S.; Vaz-Moreira, I.; Varela Della Giustina, S.; Llorca, M.; Barceló, D.; Schubert, S.; Berendonk, T.U.; Michael-Kordatou, I.; Fatta-Kassinos, D.; Martinez, J.L.; et al. Antibiotic Residues in Final Effluents of European Wastewater Treatment Plants and Their Impact on the Aquatic Environment. Environ. Int. 2020, 140, 105733. [Google Scholar] [CrossRef]
  15. Mahdi, M.H.; Mohammed, T.J.; Al-Najar, J.A. Advanced Oxidation Processes (AOPs) for Treatment of Antibiotics in Wastewater: A Review. IOP Conf. Ser. Earth Environ. Sci. 2021, 779, 012109. [Google Scholar] [CrossRef]
  16. Cuerda-Correa, E.M.; Alexandre-Franco, M.F.; Fernández-González, C. Advanced Oxidation Processes for the Removal of Antibiotics from Water. An Overview. Water 2019, 12, 102. [Google Scholar] [CrossRef] [Green Version]
  17. Akbari, M.Z.; Xu, Y.; Lu, Z.; Peng, L. Review of Antibiotics Treatment by Advance Oxidation Processes. Environ. Adv. 2021, 5, 100111. [Google Scholar] [CrossRef]
  18. Li, H.; Zhang, W.; Liu, Y. HZSM-5 Zeolite Supported Boron-Doped TiO2 for Photocatalytic Degradation of Ofloxacin. J. Mater. Res. Technol. 2020, 9, 2557–2567. [Google Scholar] [CrossRef]
  19. Lops, C.; Ancona, A.; Di Cesare, K.; Dumontel, B.; Garino, N.; Canavese, G.; Hérnandez, S.; Cauda, V. Sonophotocatalytic Degradation Mechanisms of Rhodamine B Dye via Radicals Generation by Micro- and Nano-Particles of ZnO. Appl. Catal. B Environ. 2019, 243, 629–640. [Google Scholar] [CrossRef]
  20. Fujishima, A.; Zhang, X.; Tryk, D. TiO2 Photocatalysis and Related Surface Phenomena. Surf. Sci. Rep. 2008, 63, 515–582. [Google Scholar] [CrossRef]
  21. Molinari, R.; Lavorato, C.; Argurio, P. Visible-Light Photocatalysts and Their Perspectives for Building Photocatalytic Membrane Reactors for Various Liquid Phase Chemical Conversions. Catalysts 2020, 10, 1334. [Google Scholar] [CrossRef]
  22. Zhang, F.; Wang, X.; Liu, H.; Liu, C.; Wan, Y.; Long, Y.; Cai, Z. Recent Advances and Applications of Semiconductor Photocatalytic Technology. App. Sci. 2019, 9, 2489. [Google Scholar] [CrossRef] [Green Version]
  23. Li, H.; Li, Z.; Yu, Y.; Ma, Y.; Yang, W.; Wang, F.; Yin, X.; Wang, X. Surface-Plasmon-Resonance-Enhanced Photoelectrochemical Water Splitting from Au-Nanoparticle-Decorated 3D TiO2 Nanorod Architectures. J. Phys. Chem. C 2017, 121, 12071–12079. [Google Scholar] [CrossRef]
  24. Kholikov, B.; Hussain, J.; Hayat, S.; Zeng, H. Surface Plasmon Resonance Improved Photocatalytic Activity of Au/TiO2 Nanocomposite under Visible Light for Degradation of Pollutants. J. Chin. Chem. Soc. 2021, 68, 1908–1915. [Google Scholar] [CrossRef]
  25. Ahmadi, M.; Mistry, H.; Roldan Cuenya, B. Tailoring the Catalytic Properties of Metal Nanoparticles via Support Interactions. J. Phys. Chem. Lett. 2016, 7, 3519–3533. [Google Scholar] [CrossRef]
  26. Smith, A.T.; LaChance, A.M.; Zeng, S.; Liu, B.; Sun, L. Synthesis, Properties, and Applications of Graphene Oxide/Reduced Graphene Oxide and Their Nanocomposites. Nano Mater. Sci. 2019, 1, 31–47. [Google Scholar] [CrossRef]
  27. Siklitskaya, A.; Gacka, E.; Larowska, D.; Mazurkiewicz-Pawlicka, M.; Malolepszy, A.; Stobiński, L.; Marciniak, B.; Lewandowska-Andrałojć, A.; Kubas, A. Lerf–Klinowski-Type Models of Graphene Oxide and Reduced Graphene Oxide Are Robust in Analyzing Non-Covalent Functionalization with Porphyrins. Sci. Rep. 2021, 11, 7977. [Google Scholar] [CrossRef]
  28. Fatima, S.; Irfan Ali, S.; Younas, D.; Islam, A.; Akinwande, D.; Rizwan, S. Graphene Nanohybrids for Enhanced Catalytic Activity and Large Surface Area. MRS Commun. 2019, 9, 27–36. [Google Scholar] [CrossRef] [Green Version]
  29. Yaqoob, A.A.; Mohd Noor, N.H.b.; Serrà, A.; Mohamad Ibrahim, M.N. Advances and Challenges in Developing Efficient Graphene Oxide-Based ZnO Photocatalysts for Dye Photo-Oxidation. Nanomaterials 2020, 10, 932. [Google Scholar] [CrossRef]
  30. Lu, K.-Q.; Li, Y.-H.; Tang, Z.-R.; Xu, Y.-J. Roles of Graphene Oxide in Heterogeneous Photocatalysis. ACS Mater. Au 2021, 1, 37–54. [Google Scholar] [CrossRef]
  31. Inagaki, M.; Tsumura, T.; Kinumoto, T.; Toyoda, M. Graphitic Carbon Nitrides (g-C3N4) with Comparative Discussion to Carbon Materials. Carbon 2019, 141, 580–607. [Google Scholar] [CrossRef]
  32. Vu, M.H.; Nguyen, C.C.; Do, T. Graphitic Carbon Nitride (g-C3N4) Nanosheets as a Multipurpose Material for Detection of Amines and Solar-Driven Hydrogen Production. ChemPhotoChem 2021, 5, 466–475. [Google Scholar] [CrossRef]
  33. Darkwah, W.K.; Ao, Y. Mini Review on the Structure and Properties (Photocatalysis), and Preparation Techniques of Graphitic Carbon Nitride Nano-Based Particle, and Its Applications. Nanoscale Res. Lett. 2018, 13, 388. [Google Scholar] [CrossRef] [PubMed]
  34. Wang, J.; Wang, S. A Critical Review on Graphitic Carbon Nitride (g-C3N4)-Based Materials: Preparation, Modification and Environmental Application. Coord. Chem. Rev. 2022, 453, 214338. [Google Scholar] [CrossRef]
  35. Mezni, A.; Ben Saber, N.; Ibrahim, M.M.; Shaltout, A.A.; Mersal, G.A.M.; Mostafa, N.Y.; Alharthi, S.; Boukherroub, R.; Altalhi, T. Pt–ZnO/M (M = Fe, Co, Ni or Cu): A New Promising Hybrid-Doped Noble Metal/Semiconductor Photocatalysts. J. Inorg. Organomet. Polym. 2020, 30, 4627–4636. [Google Scholar] [CrossRef]
  36. Niu, J.; Albero, J.; Atienzar, P.; García, H. Porous Single-Crystal-Based Inorganic Semiconductor Photocatalysts for Energy Production and Environmental Remediation: Preparation, Modification, and Applications. Adv. Funct. Mater. 2020, 30, 1908984. [Google Scholar] [CrossRef]
  37. Prabavathi, S.L.; Saravanakumar, K.; Park, C.M.; Muthuraj, V. Photocatalytic Degradation of Levofloxacin by a Novel Sm6WO12/g-C3N4 Heterojunction: Performance, Mechanism and Degradation Pathways. Sep. Pur. Technol. 2021, 257, 117985. [Google Scholar] [CrossRef]
  38. Han, X.-G.; He, H.-Z.; Kuang, Q.; Zhou, X.; Zhang, X.-H.; Xu, T.; Xie, Z.-X.; Zheng, L.-S. Controlling Morphologies and Tuning the Related Properties of Nano/Microstructured ZnO Crystallites. J. Phys. Chem. C 2009, 113, 584–589. [Google Scholar] [CrossRef]
  39. Ou, H.; Lin, L.; Zheng, Y.; Yang, P.; Fang, Y.; Wang, X. Tri-s-Triazine-Based Crystalline Carbon Nitride Nanosheets for an Improved Hydrogen Evolution. Adv. Mater. 2017, 29, 1700008. [Google Scholar] [CrossRef]
  40. Xing, W.; Tu, W.; Han, Z.; Hu, Y.; Meng, Q.; Chen, G. Template-Induced High-Crystalline g-C3N4 Nanosheets for Enhanced Photocatalytic H2 Evolution. ACS Energy Lett. 2018, 3, 514–519. [Google Scholar] [CrossRef]
  41. The International Center for Diffraction Data (ICDD) No. 00-004-0784. Available online: https://www.icdd.com/pdfsearch/ (accessed on 20 December 2021).
  42. Xu, Y.; Sheng, K.; Li, C.; Shi, G. Self-Assembled Graphene Hydrogel via a One-Step Hydrothermal Process. ACS Nano 2010, 4, 4324–4330. [Google Scholar] [CrossRef] [PubMed]
  43. Stankovich, S.; Dikin, D.A.; Piner, R.D.; Kohlhaas, K.A.; Kleinhammes, A.; Jia, Y.; Wu, Y.; Nguyen, S.T.; Ruoff, R.S. Synthesis of Graphene-Based Nanosheets via Chemical Reduction of Exfoliated Graphite Oxide. Carbon 2007, 45, 1558–1565. [Google Scholar] [CrossRef]
  44. Sumathi, M.; Prakasam, A.; Anbarasan, P.M. High Capable Visible Light Driven Photocatalytic Activity of WO3/g-C3N4 Hetrostructure Catalysts Synthesized by a Novel One Step Microwave Irradiation Route. J. Mater. Sci. Mater. Electron. 2019, 30, 3294–3304. [Google Scholar] [CrossRef]
  45. Yan, X.; Li, W.; Aberle, A.G.; Venkataraj, S. Investigation of the Thickness Effect on Material and Surface Texturing Properties of Sputtered ZnO:Al Films for Thin-Film Si Solar Cell Applications. Vacuum 2016, 123, 151–159. [Google Scholar] [CrossRef]
  46. Murmu, P.P.; Kennedy, J.; Ruck, B.J.; Leveneur, J. Structural, Electronic and Magnetic Properties of Er Implanted ZnO Thin Films. Nucl. Instrum. Methods Phys. Res. Sect. B Beam Interact. Mater. At. 2015, 359, 1–4. [Google Scholar] [CrossRef]
  47. Naseri, A.; Samadi, M.; Mahmoodi, N.M.; Pourjavadi, A.; Mehdipour, H.; Moshfegh, A.Z. Tuning Composition of Electrospun ZnO/CuO Nanofibers: Toward Controllable and Efficient Solar Photocatalytic Degradation of Organic Pollutants. J. Phys. Chem. C 2017, 121, 3327–3338. [Google Scholar] [CrossRef]
  48. Qiao, Y.; Li, J.; Li, H.; Fang, H.; Fan, D.; Wang, W. A Label-Free Photoelectrochemical Aptasensor for Bisphenol A Based on Surface Plasmon Resonance of Gold Nanoparticle-Sensitized ZnO Nanopencils. Biosens. Bioelectron. 2016, 86, 315–320. [Google Scholar] [CrossRef]
  49. Machín, A.; Arango, J.C.; Fontánez, K.; Cotto, M.; Duconge, J.; Soto-Vázquez, L.; Resto, E.; Petrescu, F.I.T.; Morant, C.; Márquez, F. Biomimetic Catalysts Based on Au@ZnO–Graphene Composites for the Generation of Hydrogen by Water Splitting. Biomimetics 2020, 5, 39. [Google Scholar] [CrossRef]
  50. Briggs, D.; Seah, M. Practical Surface Analysis; Wiley: New York, NY, USA, 1994. [Google Scholar]
  51. Yue, B.; Li, Q.; Iwai, H.; Kako, T.; Ye, J. Hydrogen Production Using Zinc-Doped Carbon Nitride Catalyst Irradiated with Visible Light. Sci. Technol. Adv. Mater. 2011, 12, 034401. [Google Scholar] [CrossRef]
  52. Gu, Q.; Gao, Z.; Zhao, H.; Lou, Z.; Liao, Y.; Xue, C. Temperature-Controlled Morphology Evolution of Graphitic Carbon Nitride Nanostructures and Their Photocatalytic Activities under Visible Light. RSC Adv. 2015, 5, 49317–49325. [Google Scholar] [CrossRef]
  53. Zhu, Y.-P.; Li, M.; Liu, Y.-L.; Ren, T.-Z.; Yuan, Z.-Y. Carbon-Doped ZnO Hybridized Homogeneously with Graphitic Carbon Nitride Nanocomposites for Photocatalysis. J. Phys. Chem. C 2014, 118, 10963–10971. [Google Scholar] [CrossRef]
  54. Li, N.; Tian, Y.; Zhao, J.; Zhang, J.; Zuo, W.; Kong, L.; Cui, H. Z-Scheme 2D/3D g-C3N4@ZnO with Enhanced Photocatalytic Activity for Cephalexin Oxidation under Solar Light. Chem. Eng. J. 2018, 352, 412–422. [Google Scholar] [CrossRef]
  55. Zhu, Y.; Xue, J.; Xu, T.; He, G.; Chen, H. Enhanced Photocatalytic Activity of Magnetic Core–Shell Fe3O4@Bi2O3–RGO Heterojunctions for Quinolone Antibiotics Degradation under Visible Light. J. Mater. Sci. Mater. Electron. 2017, 28, 8519–8528. [Google Scholar] [CrossRef]
  56. Ye, L.; Liu, J.; Gong, C.; Tian, L.; Peng, T.; Zan, L. Two Different Roles of Metallic Ag on Ag/AgX/BiOX (X = Cl, Br) Visible Light Photocatalysts: Surface Plasmon Resonance and Z-Scheme Bridge. ACS Catal. 2012, 2, 1677–1683. [Google Scholar] [CrossRef]
  57. Jourshabani, M.; Shariatinia, Z.; Badiei, A. Synthesis and Characterization of Novel Sm2O3/S-Doped g-C3N4 Nanocomposites with Enhanced Photocatalytic Activities under Visible Light Irradiation. Appl. Surf. Sci. 2018, 427, 375–387. [Google Scholar] [CrossRef]
  58. Prabavathi, S.L.; Saravanakumar, K.; Nkambule, T.T.I.; Muthuraj, V.; Mamba, G. Enhanced Photoactivity of Cerium Tungstate-Modified Graphitic Carbon Nitride Heterojunction Photocatalyst for the Photodegradation of Moxifloxacin. J. Mater. Sci. Mater. Electron. 2020, 31, 11434–11447. [Google Scholar] [CrossRef]
  59. Cao, J.; Li, X.; Lin, H.; Chen, S.; Fu, X. In Situ Preparation of Novel p–n Junction Photocatalyst BiOI/(BiO)2CO3 with Enhanced Visible Light Photocatalytic Activity. J. Hazard. Mater. 2012, 239–240, 316–324. [Google Scholar] [CrossRef]
  60. Nethercot, A.H. Prediction of Fermi Energies and Photoelectric Thresholds Based on Electronegativity Concepts. Phys. Rev. Lett. 1974, 33, 1088–1091. [Google Scholar] [CrossRef]
  61. Chen, C.; Bi, W.; Xia, Z.; Yuan, W.; Li, L. Hydrothermal Synthesis of the CuWO4/ZnO Composites with Enhanced Photocatalytic Performance. ACS Omega 2020, 5, 13185–13195. [Google Scholar] [CrossRef]
  62. Jiménez-Salcedo, M.; Monge, M.; Tena, M.T. The Photocatalytic Degradation of Sodium Diclofenac in Different Water Matrices Using g-C3N4 Nanosheets: A Study of the Intermediate by-Products and Mechanism. J. Environ. Chem. Eng. 2021, 9, 105827. [Google Scholar] [CrossRef]
  63. Raizada, P.; Sudhaik, A.; Singh, P. Photocatalytic Water Decontamination Using Graphene and ZnO Coupled Photocatalysts: A Review. Mater. Sci. Energy Technol. 2019, 2, 509–525. [Google Scholar] [CrossRef]
  64. Gomes Silva, C.; Juárez, R.; Marino, T.; Molinari, R.; García, H. Influence of Excitation Wavelength (UV or Visible Light) on the Photocatalytic Activity of Titania Containing Gold Nanoparticles for the Generation of Hydrogen or Oxygen from Water. J. Am. Chem. Soc. 2011, 133, 595–602. [Google Scholar] [CrossRef] [PubMed]
  65. Liu, H.; Cao, W.-R.; Su, Y.; Chen, Z.; Wang, Y. Bismuth Oxyiodide–Graphene Nanocomposites with High Visible Light Photocatalytic Activity. J. Col. Interf. Sci. 2013, 398, 161–167. [Google Scholar] [CrossRef] [PubMed]
  66. Mo, Z.; She, X.; Li, Y.; Liu, L.; Huang, L.; Chen, Z.; Zhang, Q.; Xu, H.; Li, H. Synthesis of g-C3N4 at Different Temperatures for Superior Visible/UV Photocatalytic Performance and Photoelectrochemical Sensing of MB Solution. RSC Adv. 2015, 5, 101552–101562. [Google Scholar] [CrossRef]
  67. Makuła, P.; Pacia, M.; Macyk, W. How To Correctly Determine the Band Gap Energy of Modified Semiconductor Photocatalysts Based on UV–Vis Spectra. J. Phys. Chem. Lett. 2018, 9, 6814–6817. [Google Scholar] [CrossRef] [Green Version]
  68. Şimşek, E.B. Doping of boron in TiO2 catalyst: Enhanced photocatalytic degradation of antibiotic under visible light irradiation. J. Boron 2017, 2, 18–27. [Google Scholar]
  69. Thiruppathi, M.; Kumar, J.V.; Vahini, M.; Ramalingan, C.; Nagarajan, E. A study on divergent functional properties of sphere-like CuWO4 anchored on 2D graphene oxide sheets towards the photocatalysis of ciprofloxacin and electrocatalysis of methanol. J. Mater. Sci. Mater. Electron. 2019, 30, 10172–10182. [Google Scholar] [CrossRef]
Figure 1. (a) SEM image of 10%Au@ZnONPs, (b) the corresponding elemental mapping of Zn and (c) Au. HV (20 keV), magnification 2500×, and WD (15 mm).
Catalysts 12 00166 g001
Figure 2. (a) TEM and (bf) HR-TEM images of 10%Au@ZnONPs-3%rGO-3%gC3N4. (a) Low magnification and SAED pattern of the heterostructure; (b) magnified image of a ZnO nanoparticle; (c) crystalline structure of gC3N4; and (df) images at different magnification of AuNPs.
Catalysts 12 00166 g002
Figure 3. (a) XRD patterns of rGO; (b) gC3N4; (c) ZnONPs; and (d) 10%Au@ZnONPs-3%rGO-3%gC3N4.
Catalysts 12 00166 g003
Figure 4. (a) Raman spectra of rGO; (b) gC3N4; (c) ZnONPs; and (d) 10%Au@ZnONPs-3%rGO-3%gC3N4.
Catalysts 12 00166 g004
Figure 5. (a) Tauc plots of (αhν)2 versus energy (eV), and determination of the bandgap energy of ZnONPs; (b) 10%Au@ZnONPs; (c) gC3N4; (d) 10%Au@ZnONPs-3%rGO; (e) 10%Au@ZnONPs-3%rGO-3%gC3N4 and (f) rGO.
Catalysts 12 00166 g005
Figure 6. (a) XPS core level spectra for 10%Au@ZnONPs-3%rGO-3%gC3N4: Zn2p; (b) O1s; (c) Au4f; (d) C1s; and (e) N1s.
Catalysts 12 00166 g006
Figure 7. Photodegradation rate of CFX as a function of time, using the different catalysts evaluated.
Catalysts 12 00166 g007
Figure 8. Photodegradation rate of LFX as a function of time, using the different catalysts evaluated.
Catalysts 12 00166 g008
Figure 9. Schematic diagram of the proposed photodegradation mechanism of CFX and LFX under visible radiation.
Catalysts 12 00166 g009
Table 1. BET surface area of the different as-synthesized materials.
MaterialBET Area (m2/g)
ZnONPs24
1%Au@ZnONPs33
5%Au@ZnONPs49
10%Au@ZnONPs78
1%Au@ZnONPs-3%rGO126
5%Au@ZnONPs-3%rGO161
10%Au@ZnONPs-3%rGO196
1%Au@ZnONPs-3%rGO-3%gC3N4143
5%Au@ZnONPs-3%rGO-3%gC3N4177
10%Au@ZnONPs-3%rGO-3%gC3N4229
Publisher’s Note: MDPI stays neutral with regard to jurisdictional claims in published maps and institutional affiliations.

