Abstract
Al2O3 supports were synthesized by the hydrothermal method and PtSn/Al2O3 catalysts were prepared by incipient-wetness impregnation method. The influence of the ratio of urea to Al(NO3)3·9H2O on the structure and catalytic performance for propane dehydrogenation was investigated. The catalysts were characterized by XRD, N2 adsorption–desorption, SEM, H2-TPR, NH3-TPD and Raman. The results show that the ratios of urea to Al(NO3)3·9H2O influence the morphology and phy-chemical properties of Al2O3 support, which influence the dispersion of PtSn active sites and the interaction of Pt and Sn on PtSn/Al2O3 catalysts. The PtSn/Al2O3-9 catalyst possesses the highest interaction of Pt and Sn, which result in high dispersion of active sites. The PtSn/Al2O3-9 catalyst shows high propane conversion and low deactivation rate among these catalysts.
1. Introduction
Propene as an important platform chemical is widely used in organic and polymer synthesis. With the rising demand for propene, propane dehydrogenation (PDH) has been investigated widely due to the massive exploration of shale gas. Pt- and Cr-based catalysts are mostly widely used as commercial catalytic systems for the PDH process [1,2]. As an environmentally friendly material, the former attracted much attention because of its excellent activity. However, the deactivation of Pt-based catalysts caused by Pt sintering and coke deposition remains challenging [3,4]. It is significant to develop Pt-based catalysts with high propane conversion and catalytic stability.
Great efforts have been devoted to promoting the catalytic performance of Pt-based catalysts, including the addition of metal promoters and the modification of supports. Sn as an efficient promoter can enhance the dissociative adsorption of propane and weaken the adsorption of propene [5,6,7,8,9]. Moreover, promoters such as In, Ga, Zn, Cu, Mn and Ir are also effective in enhancing catalytic performance by the geometric effect or/and electronic effect [10,11,12,13,14,15,16,17]. In heterogeneous catalysis, support plays an important role in modulating the geometric and electronic structure of the active sites to optimize the catalytic performance. In the case of PDH, supports such as Al2O3 [18,19], SiO2 [20,21], zeolites [22,23,24,25], spinel (ZnAl2O4, MgAl2O4) [26,27,28] and carbon [29,30] are the mostly alternatives. However, the weak interaction between Pt species and SiO2 reduces the stability of these catalysts by easy sintering of Pt [31]. The strong acidity of zeolites induces coke deposition, which results in catalyst deactivation. High surface area Al2O3 as a classical support employed in PDH catalysts shows an exceptional ability to maintain the Pt dispersion, which is crucial to attaining excellent catalyst performance [32]. Morphological control of Al2O3 support has been proven to affect the physical and chemical properties [33], which may influence the dispersion of metal active sites so as to affect the catalytic performance [34]. The morphology can be controlled by manipulating the pH in the synthesis of Al2O3 [35]. Urea is usually used in the preparation of Al2O3 because of the slow formation of OH− by the hydrolysis reaction. Additionally, the pH can be changed in some extent by changing the amount of urea. In the present work, a series of Al2O3 supports were prepared by changing the ratios of urea to aluminum nitrate using the hydrothermal method, and then the PtSn catalysts were synthesized by the incipient wetness impregnation method. The influence of structure and phy-chemical properties of the Al2O3 support on the catalytic performance in PDH were investigated. The dispersion and nature of the PtSn active sites are affected by the Al2O3 support, which influences the catalytic performance for PDH reaction.
2. Results
In order to investigate the morphology of the Al2O3 support, SEM characterization was carried out and the images are shown in Figure 1. It can be seen that the PtSn/Al2O3-2 exhibits irregular morphology with some sheet-like structures. The size of sheet-like structure increases with the increase in urea to Al(NO3)3·9H2O ratios from two to six. Moreover, the morphology of the catalyst changed from a sheet-like to a rod-like structure with the increase in urea to Al(NO3)3·9H2O ratios. Additionally, it changed to rod completely with a larger size for the PtSn/Al2O3-12 catalyst. According to the observation of SEM images, the changing of urea to Al(NO3)3·9H2O ratios influences the nucleation and growth process of the Al2O3 support because the different concentration of urea results in different hydrolytic rates of urea. The precipitation rate of metal ions is much higher than the hydrolysis rate of urea. Therefore, the different morphologies are formed because of the differences in nucleation rate and growth rate, which is caused by the different hydrolytic rate of urea. It had been reported that the dispersion of the metallic sites can be controlled by controlling the morphology of the support [36]. In order to investigate the influence of support morphology on the dispersion of metal active sites, the dispersion degree of Pt is carried out by CO chemisorption and the results are shown in Table 1. It can be seen that the lowest and highest dispersions are obtained on PtSn/Al2O3-2 and PtSn/Al2O3-9, which corresponding to distinctly different morphology structures of Al2O3 support. Additionally, the dispersion of Pt shows little difference on the catalysts with a similar structure (PtSn/Al2O3-4, PtSn/Al2O3-6 and PtSn/Al2O3-9). It indicates that the dispersion of metal active sites are influenced by the morphology of Al2O3 support.
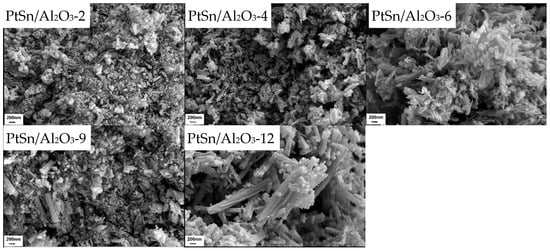
Figure 1.
SEM images of PtSn/Al2O3 catalysts.

Table 1.
Textural properties and Pt dispersions of PtSn/Al2O3 catalysts, ID/IG by Raman characterization of the spent catalysts.
The textural properties of the catalysts were investigated by nitrogen adsorption–desorption, and the corresponding isotherms and pore size distributions are shown in Figure 2. All the samples exhibit a typical type IV adsorption isotherm with H3 hysteresis, demonstrating the existence of disordered mesopores. By comparing these samples, the different relative pressures which are characteristic of capillary condensation of nitrogen can be. This may be caused by the different catalyst morphologies as shown in Figure 1. The intergranular mesopores, caused by the polycrystalline Al2O3 particle packing, show different size distributions because of the different Al2O3 morphologies, as shown in Figure 2B. Although the PtSn/Al2O3-2 catalyst shows the smallest particle size, as shown in Figure 1, the size of the intergranular mesopores is the largest as shown in Figure 2B, indicating a close packing of the small particles than the other samples. It can also be demonstrated by it having the lowest BET surface area and total pore volume of 127.5 m2/g and 0.38 cm3/g in Table 1. The BET surface area and total pore volume increased to 180.2 m2/g and 0.47 cm3/g with the urea to Al(NO3)3·9H2O ratio from two to four, and decreased to 162.3 m2/g and 0.43 cm3/g on the PtSn/Al2O3-6 catalyst. For the PtSn/Al2O3-9 catalyst, the BET surface area of 171.1 m2/g is not the highest, but the total pore volume is much higher than the other catalysts, which may be in favor of the dispersion of the metallic active sites.
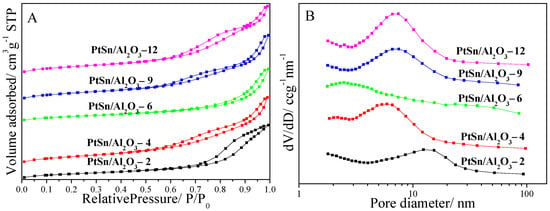
Figure 2.
Nitrogen adsorption–desorption isotherms (A) and pore distribution (B) of PtSn/Al2O3 catalysts.
Figure 3 shows the XRD patterns of Al2O3-9 support and PtSn/Al2O3 catalysts. As represented in Figure 3, all the samples exhibited diffraction peaks at 37.6°, 45.8°, 67.0° and 85.0°, which can be assigned to γ-Al2O3. Moreover, there is no new diffraction peak compared with Al2O3-9 support, which may be due to the high dispersion or the low loading amounts of metals.
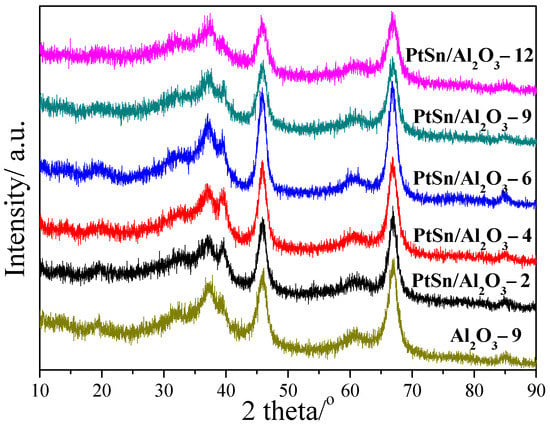
Figure 3.
XRD patterns of Al2O3-9 and PtSn/Al2O3 catalysts.
The H2-TPR characterization was carried out to investigate the state of metals and the interaction between metals and support. The TPR profiles of the different catalysts are shown in Figure 4. As shown in Figure 4, the peak at about 470 °C is ascribed to the reduction of PtOxCly on the 0.5Pt/Al2O3-9 sample. Additionally, the peak at the temperature below 400 °C on PtSn/Al2O3 catalysts is ascribed to the reduction in Pt-O-Sn clusters or combined reduction of SnOx and PtOx species in close contact, indicating the interaction of Pt and Sn species. [15] The peak at about 440 °C and 580 °C can be attributed to the reduction of Sn4+ to Sn2+ and Sn2+ to Sn0, respectively. [37,38] Moreover, the peak at about a 330 °C shift to high temperature with the increase in urea to Al(NO3)3·9H2O ratios, indicating the changing of Pt and Sn interaction. Moreover, the peak intensity increased compared with that of PtSn/Al2O3-2, indicating more Sn species interact with Pt species. It has been reported that the addition of Sn can modify the nature of Pt in electronic and geometric properties. The geometric effect of Sn can improve the dispersion of Pt by isolating the aggregated Pt clusters [39]. Therefore, the dispersion of Pt in the PtSn/Al2O3-2 catalyst is the worst due to the lower number of Sn species interactions with Pt. For other catalysts except PtSn/Al2O3-2, there are only two peaks with the peak ascribed to the reduction of Sn2+ species disappearing. It indicates that the reduction of Sn2+ is difficult, which may be caused by the strong interaction with Pt or/and the support.
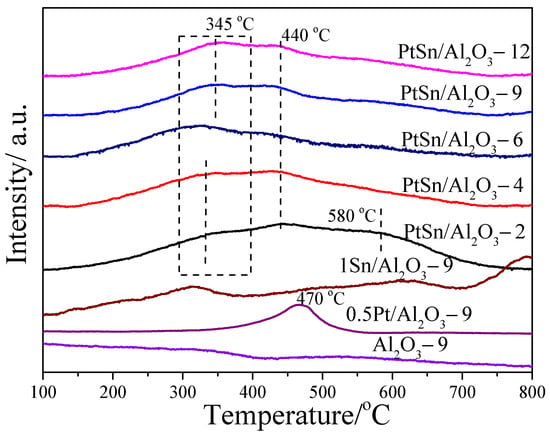
Figure 4.
H2-TPR curves of Al2O3-9, 0.5Pt/Al2O3-9, 1Sn/Al2O3-9 and PtSn/Al2O3 catalysts.
In order to determine the effects of urea to Al(NO3)3·9H2O ratios on the acidity of different catalysts, NH3-TPD patterns were carried out and the results are shown in Figure 5. As detected, two main NH3 desorption peaks can be observed in all samples, which can be assigned to weak (peak 1) and strong (peak 2) acid sites [40]. It can be seen that the temperature of the peak 1 decrease from that of PtSn/Al2O3-2 to PtSn/Al2O3-6 and then increase from that of PtSn/Al2O3-9 to PtSn/Al2O3-12, while the temperature of peak 2 shows the opposite trend. It indicates the difference of the acid strength. Additionally, the ratio of strong/weak acid content is apparently different on the different catalysts according to the intensity ratio of peak 2 to peak 1. The PtSn/Al2O3-9 catalyst shows the highest ratio of strong/weak acid content. These differences in both acid strength and acid content may be caused by the diversity during polycrystal growth (hydrothermal process) and dehydration (calcination process).
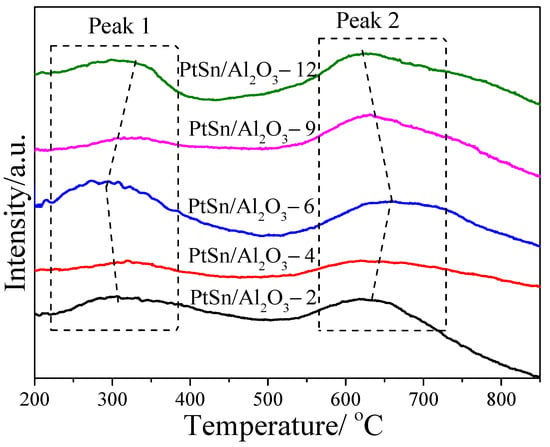
Figure 5.
NH3-TPD profiles of PtSn/Al2O3 catalysts.
The catalyst performance for PtSn/Al2O3 catalysts was tested for PDH and the results are shown in Figure 6. It can be seen the catalytic performances were influenced by the urea to Al(NO3)3·9H2O ratios. The highest initial propane conversion was obtained on PtSn/Al2O3-9 catalyst with 56.6%. Additionally, after 6 h reaction, it also shows the highest propane conversion of 34.7%. As shown in Table 2, all the catalysts show high initial propane conversion (>45%). The initial propane conversion on PtSn/Al2O3-2 catalyst is 52.9%. Additionally, with the increase in urea to Al(NO3)3·9H2O ratios, the initial propane conversion increased with 55.5% on PtSn/Al2O3-4 catalyst and 56.6% on PtSn/Al2O3-9 catalyst. With further increase in urea to Al(NO3)3·9H2O ratios, the initial propane conversion decreased to 45.9% on the PtSn/Al2O3-12 catalyst. It can be seen from Figure 6A that, despite the high initial propane conversions being obtained on all catalysts with a small gap (55.6% and 45.9% for the highest and lowest conversion), the final conversion (after 6 h reaction) shows a big gap (34.7% and 16.9%). Table 3 lists a comparison of the activity of the PtSn/Al2O3 catalysts. The catalytic performance of the PtSn/Al2O3-9 catalyst process high initial propane conversion and propene selectivity can be seen, although the reaction conditions are different. Compared with high initial propane conversions, high stabilities are more favorable for non-oxidative PDH and high selectivity are essential for high stability. Figure 6B shows the propene selectivity on the different catalysts. The high propene selectivities are obtained on all the catalysts. The selectivities are beyond 96% on all catalysts.
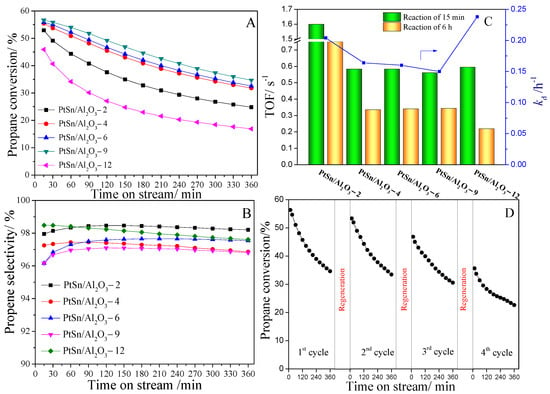
Figure 6.
Catalytic performance of PtSn/Al2O3 catalysts for PDH. (A) Propane conversion and (B) propene selectivity as a function of time during PDH; (C) TOF and deactivation rate constant (kd) of PtSn/Al2O3 catalysts; (D) Catalytic performance on PtSn/Al2O3-9 catalyst for four successive PDH cycles.

Table 2.
Catalytic performances of PDH over PtSn/Al2O3 catalysts.

Table 3.
Catalytic data of PtSn/Al2O3 catalysts used in PDH reaction.
In order to investigate the intrinsic activity of PtSn/Al2O3 catalysts, turnover frequency (TOF) was calculated and shown in Figure 6C. The TOF value of PtSn/Al2O3-2 is 1.6 s−1 at the beginning of the reaction can be seen, indicating a high intrinsic activity among these catalysts. After 6 h reaction, the TOF value decreased to 0.75 s−1, indicating a fast decrease in the catalytic activity. Moreover, the TOF value of PtSn/Al2O3-9 is 0.56 s−1 at the beginning of the reaction, and it decreased to 0.34 s−1. Moreover, the selectivity is the lowest among these catalysts. It indicates that the side reaction including cracking and coke formation occur easily. It may be caused by the large amount of strong acid centers, as shown in Figure 5. Although the TOF of PtSn/Al2O3-9 is lowest, the deactivation of this catalyst is lowest. In order to compare the stability of these catalysts, the deactivation rate constants were calculated and are shown in Figure 6C. The catalyst with low initial propane conversion shows fast deactivation with the kd of 0.24 h−1 on the PtSn/Al2O3-12 catalyst. Additionally, the PtSn/Al2O3-9 catalyst shows the lowest deactivation with the kd of 0.15 h−1, indicating the highest stability among these catalysts. Moreover, the PtSn/Al2O3-9 catalyst shows the lowest deactivation rate, as shown in Table 2. From the results of the PDH catalytic performances on different catalysts, the PtSn/Al2O3-9 catalyst shows the highest initial propane conversion and stability value. Therefore, this catalyst was chosen for the cycle experiment with regeneration and retesting, and the results are shown in Figure 6D. After the first test and regeneration, the catalyst maintains high catalytic performance, which is almost as good as the first test. It indicates the PtSn active sites maybe re-dispersed and the coke is eliminated. After the second test and regeneration, the propane conversion decreased for both the initial and final conversion, indicating the loss of activity caused mainly by the the loss or changing of PtSn active sites. After the third regeneration, the catalyst shows a large decrease in the catalytic performance. It indicates a deactivation of the catalyst after the forth PDH test.
3. Coke Analysis
In order to investigate the coke formation process on different catalysts, in situ Raman were carried out for PtSn/Al2O3-2, PtSn/Al2O3-9 and PtSn/Al2O3-12 catalysts. As shown in Figure 7A, there is no apparent Raman band ascribed to coke at the beginning of the PDH reaction on the PtSn/Al2O3-2 catalyst. After about 45 min of reaction, two Raman bands at 1330 and 1600 cm−1 were detected and the intensity of these two bands increased with the increase in reaction time. The band centered at 1600 cm−1 is ascribed to G band, which is the stretching vibration of the sp2 bond in C=C chains or in aromatic rings. The band at 1330 cm−1 is ascribed to D band, which is the breathing mode of sp2 bond only in rings, not in chains [51]. According to the in situ Raman characterization, not only the coke amount but also the nature of coke can be obtained. For PtSn/Al2O3-2, the coke formed after about 45 min of reaction, and the amount of coke is increasing with the increasing reaction time. It can be seen from Figure 7B that the coke formation process is faster on the PtSn/Al2O3-9 catalyst than that of the PtSn/Al2O3-2. Two bands ascribed to coke were detected only after 15 min of reaction, indicating a faster coke formation in the initial reaction period. For the PtSn/Al2O3-12 catalyst, the in situ Raman result is shown in Figure 7C. The similar coke formation rate is observed compared with the PtSn/Al2O3-9 catalyst, which is demonstrated by the appearance of the bands at 1330 and 1600 cm−1 only after 15 min of reaction. Moreover, the intensity of these two bands increased with increasing reaction time, indicating the increase in coke amounts. According to in situ Raman results, it can be seen that the catalysts with different urea to Al(NO3)3·9H2O ratios show different coke formation process. Catalysts with high urea to Al(NO3)3·9H2O ratios (9 and 12) show faster coke formation rates than that of PtSn/Al2O3-2 catalyst. Although the PtSn/Al2O3-9 catalyst shows the lowest deactivation rate among these catalysts as shown in Figure 6, the coke formation rate in the initial reaction period is not the lowest. It indicates coke formation is not the main reason for catalyst deactivation, which is also demonstrated by the decreased initial conversion after three regeneration cycles (Figure 6D).
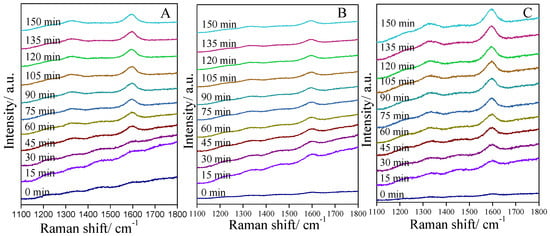
Figure 7.
In situ Raman spectra of PtSn/Al2O3 catalysts: (A) PtSn/Al2O3-2, (B) PtSn/Al2O3-9 and (C) PtSn/Al2O3-12.
Assessment of the normal Raman spectra of the different catalysts after 6 h reaction was also carried out and the results are shown in Figure 8. As the ratio of the D band to the G band (ID/IG) can demonstrate the nature of coke on the catalyst surface, ID/IG were calculated by the intensity of the D band to the G band, and the results are shown in Table 1. As calculated from the spent catalysts, the ID/IG is 0.97, 0.84 and 0.92 for PtSn/Al2O3-2, PtSn/Al2O3-9 and PtSn/Al2O3-12, respectively. The smaller the value of ID/IG, the more graphitic degree with a lower H/C ratio of the coke [52]. The PtSn/Al2O3-9 catalyst shows the smallest value of ID/IG, indicating that a deeply dehydrogenation process happened. It may be caused by the highest ratio of strong/weak acid content. The large amount of strong acid may favor the polymerization and aromatization of propene, which will result in deep dehydrogenation and become more graphitic [53]. Additionally, it results in the fast coke deposition rate in the initial reaction period.
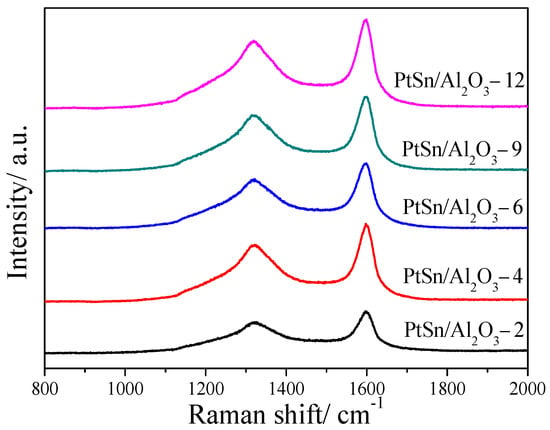
Figure 8.
Raman spectra of PtSn/Al2O3 catalysts after 6 h of reaction.
In order to investigate the amount of coke on the spent catalysts, the TG curves are shown in Figure 9. The loss weight process can be divided into two stages as shown in Figure 9. The first stage (from 100 to 350 °C) can be ascribed to the combustion of the coke deposited on active metal sites, while the second stage (from 350 to 600 °C) can be ascribed to the combustion of the deposited coke located on the surface of the support. It can be seen that PtSn/Al2O3-2 and PtSn/Al2O3-12 catalysts show a weight loss of 3.8% on the first stage, which indicated that a large amount coke deposited on the active metal, and these two catalysts show low activity and stability, as shown in Figure 6. Although PtSn/Al2O3-6 and PtSn/Al2O3-9 catalysts show a large total amount of coke, the coke located on the active metal is only a small part compared with the coke deposited on the support. As is shown in in situ Raman spectra, the intensity of the coke band increased with increasing reaction time on PtSn/Al2O3-2 and PtSn/Al2O3-12 catalysts, while the intensity shows little change on the PtSn/Al2O3-9 catalyst. It may be caused by the promoted coke migration from the active metal sites to the support on PtSn/Al2O3-9 compared with PtSn/Al2O3-2 and PtSn/Al2O3-12. According to the characterization on the coke formation for different catalysts, it can be found that the support plays an important role in the dehydrogenation reaction process, perhaps by affecting the PtSn active sites.
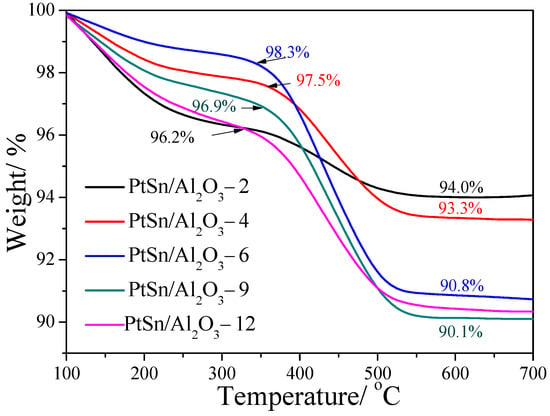
Figure 9.
TG curves of PtSn/Al2O3 catalysts after reaction for 6 h.
4. Materials and Methods
4.1. Catalyst Preparation
Al2O3 support was prepared by the hydrothermal method; typical synthesis procedures are as follows: the ratios of urea (CO(NH2)2) to aluminum nitrate (Al(NO3)3·9H2O) were 2, 4, 6, 9 and 12. Taking the ratio of 9 as an example, 3.0 g of Al(NO3)3·9H2O was dissolved in 50 mL deionized water. Additionally, then 4.3 g of urea was added to the solution and stirred for 25 min. Then, it was placed in a 100mL Teflon-lined stainless autoclave and maintained at 100 °C for 48 h. Then, the white precipitate was filtered and washed with deionized water and dried at 80 °C for 12 h. Finally, the Al2O3 support was obtained by calcination in air at 600 °C for 6 h. The Al2O3 support were denoted as Al2O3-S, where S represents the ratio of urea to Al(NO3)3·9H2O.
PtSn/Al2O3 catalysts were prepared by the incipient wetness impregnation method using H2PtCl6·6H2O and SnCl2·2H2O as the precursors, in which the theoretical amounts of Pt and Sn were 1 wt.% and 2 wt.%, respectively. Typical procedures are as follows: a certain amount of SnCl2·2H2O were dissolved in a certain amount of H2PtCl6·6H2O ethanol solution. Subsequently, the solution was incipiently impregnated into 1.0 g of the Al2O3 support followed by sonication for 30 min. Then, PtSn/Al2O3-S catalysts were obtained by calcination at 500 °C for 4 h. Pt/Al2O3 and Sn/Al2O3 catalysts were also prepared with the loadings of Pt and Sn of 0.5 wt.% and 1 wt.%, respectively.
4.2. Catalyst Characterization
X-ray powder diffraction (XRD) measurements were obtained by a powder X-ray diffractometer (RIGAKU Ultima IV) using Cu Ka radiation with a Nickel filter operating at 40 kV and 40 mA in the 2θ range of 10–90° at a scanning rate of 3°/min. N2 adsorption–desorption isotherms were recorded using a Micomeritics 3020 analyzer. Before testing, the catalysts were degased at 300 °C for 6 h. The redox ability of the catalysts was carried out by the temperature programmed reduction of H2 (H2-TPR) (Micromeritics AutoChem 2920). Approximately 100 mg (20–40 mesh) catalyst was loaded in a “U” shaped quartz located inside a furnace and heated to 300 °C under Ar flow (30 mL/min) for 60 min to eliminate adsorbed inclusion. After the degassing and cooling down to an ambient temperature, the gas flow was changed to 10 vol.% H2/Ar flow (30 mL/min). The catalysts were heated from the room temperature to 900 °C at a rate of 10 °C/min and recording the signal of TCD on-line. Raman spectra were performed on a HORIBA LabRAM HR Evolution Raman spectrometer with a 532 nm laser. The amount of coke deposited was determined by a thermogravimetric (TG) analyzer STA 449 F5 (NETZSCH). The sample was exposed to 20% O2/N2 flowing at 60 mL/min and oxidized from an ambient temperature to 800 °C at a rate of 10 °C/min. The acid character of the catalysts was studied by the temperature programmed desorption (NH3-TPD) on the dynamic adsorption instrument (xianquan Company TP-5076). An amount of 100 mg of the sample was placed in a quartz tube and pretreated at 500 °C for 1 h under the N2 flow (30 mL/min) and then cooled down to 40 °C. After the samples were saturated with NH3, the N2 gas was flowed over the catalyst (30 mL/min) for 30 min to remove the physisorbed NH3. Finally, the TPD operation was carried out from 100 to 900 °C at a heating rate of 10 °C/min. The amount of NH3 desorbed was monitored by a TCD. Scanning electron microscopy (SEM) analyses were carried out using a ZEISS geminisem 300. The powder samples were sprinkled sparsely over carbon tape mounted on an aluminum stub before sputter coating with gold for ca. 5 min prior to the SEM analysis. Pt dispersions were measured on a Micromeritics AutoChem II 2920 automated characterization system. A total of 100 mg of the sample was loaded in a U-shaped quartz tube and heated to 400 °C for 30 min in the flow of 10% H2/Ar, then switched to pure Ar and cooled to 40 °C. Then, CO was introduced by switching the six-way valve for pulse adsorption. The amount of CO was measured using a TCD.
4.3. Catalytic Activity Measurements
PDH reaction was performed in a conventional quartz tubular micro-reactor. The catalyst of 200 mg was placed in the quartz reactor with an inner diameter of 6 mm. Additionally, the height of catalyst bed is about 14 mm. The catalyst was reduced by 10% H2/Ar at 500 °C for 4 h before the reaction. Subsequently, the gas mixture of C3H8 and N2 (C3H8:N2 = 1:2) was fed to the reactor with the propane weight hourly space velocity (WHSV) of 2.35 h−1 and the reaction temperature of 590 °C. The reaction products were analyzed by using on-line Agilent-7890B gas chromatography equipped with a flame ionization detector (FID). A HP-Al2O3 capillary column was used for the separation of CH4, C2H4, C2H6, C3H6, and C3H8.
The conversion of propane and the selectivity for propene were defined as follows:
where FC3H8 represents the flow rate of propane; DPt represents the dispersion of Pt.
A first-order deactivation model was used to evaluate the catalyst stability:
where Xinitial and Xfinal represent the conversion of propane measured at the initial and final period of an experiment, respectively. Additionally, t represents the reaction time (h). kd is the deactivation rate constant (h−1).
5. Conclusions
In conclusion, the supports prepared with different urea to Al(NO3)3·9H2O ratios show different morphologies and phy-chemical properties, which influence the dispersion and nature of the PtSn active sites. Additionally, it can deeply modify the surface chemistry and the catalytic performance of the PtSn/Al2O3 catalysts. The dehydrogenation reaction and side reaction were promoted simultaneously on the PtSn/Al2O3-9 catalyst. Although it shows the lowest propene selectivity and highest coke deposition, the highest propane conversion and lowest deactivation rate were obtained on the PtSn/Al2O3-9 catalyst. It may be ascribed to the enhanced Pt and Sn interaction, which results in a high dispersion degree of active sites and the promoted coke migration effect.
Author Contributions
Conceptualization, X.F. and Z.Z.; methodology, X.W. and J.C.; software, N.Z. and J.S.; validation, X.W.; formal analysis, X.W. and X.F.; investigation, J.C.; data curation, X.F. and X.W.; writing—original draft preparation, X.F.; writing—review and editing, X.F.; visualization, L.K., X.X. and Z.X.; supervision, Z.Z.; project administration, Z.Z.; funding acquisition, X.F. and Z.Z. All authors have read and agreed to the published version of the manuscript.
Funding
This work was funded by the National Natural Science Foundation of China (22172101, 91845201), the Scientific Research Project of Education Office of Liaoning Province (LQN202009), the Program for Excellent Talents in Shenyang Normal University.
Institutional Review Board Statement
Not applicable.
Informed Consent Statement
Not applicable.
Data Availability Statement
The raw/processed data required to reproduce these findings cannot be shared at this time as the data also form part of an ongoing study.
Conflicts of Interest
The authors declare no conflict of interest.
References
- Chen, S.; Pei, C.; Sun, G.; Zhao, Z.-J.; Gong, J. Nanostructured catalysts toward efficient propane dehydrogenation. Acc. Mater. Res. 2020, 1, 30–40. [Google Scholar] [CrossRef]
- Otroshchenko, T.; Jiang, G.; Kondratenko, V.A.; Rodemerck, U.; Kondratenko, E.V. Current status and perspectives in oxidative, non-oxidative and CO2-mediated dehydrogenation of propane and isobutane over metal oxide catalysts. Chem. Soc. Rev. 2021, 50, 473–527. [Google Scholar] [CrossRef] [PubMed]
- Hu, Z.-P.; Yang, D.; Wang, Z.; Yuan, Z.Y. State-of-the-art catalysts for direct dehydrogenation of propane to propylene. Chin. J. Catal. 2019, 40, 1233–1254. [Google Scholar] [CrossRef]
- Li, C.; Wang, G. Dehydrogenation of light alkanes to mono-olefins. Chem. Soc. Rev. 2021, 50, 4359–4381. [Google Scholar] [CrossRef]
- Motagamwala, A.H.; Almallahi, R.; Wortman, J.; Igenegbai, V.O.; Linic, S. Stable and selective catalysts for propane dehydrogenation operating at thermodynamic limit. Science 2021, 373, 217–222. [Google Scholar] [CrossRef]
- Papoian, G.; Nørskov, J.K.; Hoffmann, R. A comparative theoretical study of the hydrogen, methyl, and ethyl chemisorption on the Pt (111) surface. J. Am. Chem. Soc. 2000, 122, 4129–4144. [Google Scholar] [CrossRef]
- Nawaz, Z.; Tang, X.; Wang, Y.; Wei, F. Parametric characterization and influence of tin on the performance of Pt−Sn/SAPO-34 catalyst for selective propane dehydrogenation to propylene. Chem. Res. 2010, 49, 1274–1280. [Google Scholar] [CrossRef]
- Watson, G.W.; Wells, R.P.; Willock, D.J.; Hutchings, G.J. Density functional theory calculations on the interaction of ethene with the {111} surface of platinum. J. Phys. Chem. B 2000, 104, 6439–6446. [Google Scholar] [CrossRef]
- Jiang, F.; Zeng, L.; Li, S.; Liu, G.; Wang, S.; Gong, J. Propane dehydrogenation over Pt/TiO2–Al2O3 catalysts. ACS Catal. 2015, 5, 438–447. [Google Scholar] [CrossRef]
- Xia, K.; Lang, W.-Z.; Li, P.-P.; Yan, X.; Guo, Y.-J. The properties and catalytic performance of PtIn/Mg(Al)O catalysts for the propane dehydrogenation reaction: Effects of pH value in preparing Mg(Al)O supports by the co-precipitation method. J. Catal. 2016, 338, 104–114. [Google Scholar] [CrossRef]
- Redekop, E.A.; Galvita, V.V.; Poelman, H.; Bliznuk, V.; Detavernier, C.; Marin, G.B. Delivering a Modifying Element to Metal Nanoparticles via Support: Pt–Ga Alloying during the Reduction of Pt/Mg(Al,Ga)Ox Catalysts and Its Effects on Propane Dehydrogenation. ACS Catal. 2014, 4, 1812–1824. [Google Scholar] [CrossRef]
- Wu, J.; Sharada, S.M.; Ho, C.; Hauser, A.W.; Head-Gordon, M.; Bell, A.T. Ethane and propane dehydrogenation over PtIr/Mg(Al)O. Appl. Catal. A Gen. 2015, 506, 25–32. [Google Scholar] [CrossRef] [Green Version]
- Han, Z.; Li, S.; Jiang, F.; Wang, T.; Ma, X.; Gong, J. Propane dehydrogenation over Pt–Cu bimetallic catalysts: The nature of coke deposition and the role of copper. Nanoscale 2014, 6, 10000–10008. [Google Scholar] [CrossRef] [PubMed]
- Yu, C.; Xu, H.; Ge, Q.; Li, W. Properties of the metallic phase of zinc-doped platinum catalysts for propane dehydrogenation. J. Mol. Catal. A Chem. 2007, 266, 80–87. [Google Scholar] [CrossRef]
- Fan, X.; Liu, D.; Sun, X.; Yu, X.; Li, D.; Yang, Y.; Liu, H.; Diao, J.; Xie, Z.; Kong, L.; et al. Mn-doping induced changes in Pt dispersion and PtxMny alloying extent on Pt/Mn-DMSN catalyst with enhanced propane dehydrogenation stability. J. Catal. 2020, 389, 450–460. [Google Scholar] [CrossRef]
- Wu, Z.; Bukowski, B.C.; Li, Z.; Milligan, C.; Zhou, L.; Ma, T.; Wu, Y.; Ren, Y.; Ribeiro, F.H.; Delgass, W.N.; et al. Changes in catalytic and adsorptive properties of 2 nm Pt3Mn nanoparticles by subsurface atoms. J. Am. Chem. Soc. 2018, 140, 14870–14877. [Google Scholar] [CrossRef] [Green Version]
- Rochlitz, L.; Searles, K.; Alfke, J.; Zemlyanov, D.; Safonova, O.V.; Copéret, C. Silica-supported, narrowly distributed, subnanometric Pt–Zn particles from single sites with high propane dehydrogenation performance. Chem. Sci. 2020, 11, 1549–1555. [Google Scholar] [CrossRef] [Green Version]
- Zhu, Y.; An, Z.; Song, H.; Xiang, X.; Yan, W.; He, J. Lattice-confined Sn (IV/II) stabilizing raft-like Pt clusters: High selectivity and durability in propane dehydrogenation. ACS Catal. 2017, 7, 6973–6978. [Google Scholar] [CrossRef]
- Sun, C.; Luo, J.; Cao, M.; Zheng, P.; Li, G.; Bu, J.; Cao, Z.; Chen, S.; Xie, X. A comparative study on different regeneration processes of Pt-Sn/γ-Al2O3 catalysts for propane dehydrogenation. J. Energy Chem. 2018, 27, 311–318. [Google Scholar] [CrossRef] [Green Version]
- Deng, L.; Shishido, T.; Teramura, K.; Tanaka, T. Effect of reduction method on the activity of Pt–Sn/SiO2 for dehydrogenation of propane. Catal. Today 2014, 232, 33–39. [Google Scholar] [CrossRef] [Green Version]
- Wang, G.; Zhang, H.; Zhu, Q.; Zhu, X.; Li, X.; Wang, H.; Li, C.; Shan, H. Sn-containing hexagonal mesoporous silica (HMS) for catalytic dehydrogenation of propane: An efficient strategy to enhance stability. J. Catal. 2017, 351, 90–94. [Google Scholar] [CrossRef]
- Zhou, H.; Gong, J.; Xu, B.; Yu, L.; Fan, Y. PtSnNa@SUZ-4-catalyzed propane dehydrogenation. Appl. Catal. A Gen. 2016, 527, 30–35. [Google Scholar] [CrossRef]
- Sun, Q.; Wang, N.; Fan, Q.; Zeng, L.; Mayoral, A.; Miao, S.; Yang, R.; Jiang, Z.; Zhou, W.; Zhang, J.; et al. Subnanometer bimetallic platinum–zinc clusters in zeolites for propane dehydrogenation. Angew. Chem. Int. Ed. 2020, 59, 19450–19459. [Google Scholar] [CrossRef] [PubMed]
- Gong, T.; Qin, L.; Lu, J.; Feng, H. ZnO modified ZSM-5 and Y zeolites fabricated by atomic layer deposition for propane conversion. Phys. Chem. Chem. Phys. 2016, 18, 601–614. [Google Scholar] [CrossRef]
- Li, J.; Li, J.; Zhao, Z.; Fan, X.; Liu, J.; Wei, Y.; Duan, A.; Xie, Z.; Liu, Q. Size effect of TS-1 supports on the catalytic performance of PtSn/TS-1 catalysts for propane dehydrogenation. J. Catal. 2017, 352, 361–370. [Google Scholar] [CrossRef]
- Vu, B.K.; Song, M.B.; Ahn, I.Y.; Suh, Y.-W.; Suh, D.J.; Kim, W.-I.; Koh, H.-L.; Choi, Y.G.; Shin, E.W. Pt–Sn alloy phases and coke mobility over Pt–Sn/Al2O3 and Pt–Sn/ZnAl2O4 catalysts for propane dehydrogenation. Appl. Catal. A Gen. 2011, 400, 25–33. [Google Scholar] [CrossRef]
- Bocanegra, S.A.; Ballarini, A.D.; Scelza, O.A.; de Miguel, S.R. The influence of the synthesis routes of MgAl2O4 on its properties and behavior as support of dehydrogenation catalysts. Mater. Chem. Phys. 2008, 111, 534–541. [Google Scholar] [CrossRef]
- Yang, Y.; Fan, G.; Li, F. Synthesis of novel marigold-like carbonate-type Mg–Al layered double hydroxide micro-nanostructures via a two-step intercalation route. Mater. Lett. 2014, 116, 203–205. [Google Scholar] [CrossRef]
- Hu, Z.-P.; Zhao, H.; Chen, C.; Yuan, Z.-Y. Castanea mollissima shell-derived porous carbons as metal-free catalysts for highly efficient dehydrogenation of propane to propylene. Catal. Today 2018, 316, 214–222. [Google Scholar] [CrossRef]
- Liu, J.; Yue, Y.; Liu, H.; Da, Z.; Liu, C.; Ma, A.; Rong, J.; Su, D.; Bao, X.; Zheng, H. Origin of the robust catalytic performance of nanodiamond–graphene-supported Pt nanoparticles used in the propane dehydrogenation reaction. ACS Catal. 2017, 7, 3349–3355. [Google Scholar] [CrossRef]
- Zhang, Y.; Zhou, Y.; Shi, J.; Zhou, S.; Sheng, X.; Zhang, Z.; Xiang, S. Comparative study of bimetallic Pt-Sn catalysts supported on different supports for propane dehydrogenation. J. Mol. Catal. A Chem. 2014, 381, 138–147. [Google Scholar] [CrossRef]
- Sattler, J.J.H.B.; Ruiz-Martinez, J.; Santillan-Jimenez, E.; Weckhuysen, B.M. Catalytic dehydrogenation of light alkanes on metals and metal oxides. Chem. Rev. 2014, 114, 10613–10653. [Google Scholar] [CrossRef]
- Bell, T.E.; Gonzalez-Carballo, J.M.; Tooze, R.P.; Torrente-Murciano, L. High yield manufacturing of γ-Al2O3 Nanorods. ACS Sustain. Chem. Eng. 2018, 6, 88–92. [Google Scholar] [CrossRef]
- Shi, Y.; Li, X.; Rong, X.; Gu, B.; Wei, H.; Sun, C. Influence of support on the catalytic properties of Pt–Sn–K/θ-Al2O3 for propane dehydrogenation. RSC Adv. 2017, 7, 19841–19848. [Google Scholar] [CrossRef] [Green Version]
- Chen, X.Y.; Huh, H.S.; Lee, S.W. Hydrothermal synthesis of boehmite (γ-AlOOH) nanoplatelets and nanowires: PH-controlled morphologies. Nanotechnology 2007, 18, 285608. [Google Scholar] [CrossRef]
- Zhang, H.; Zhang, Y.; Zhou, Y.; Sheng, X.; Zhang, C.; Fang, J.; Zhao, S.; Gao, Y. Morphology-controlled fabrication of biomorphic alumina-based hierarchical LDH compounds for propane dehydrogenation reaction. New J. Chem. 2018, 42, 103–110. [Google Scholar] [CrossRef]
- Li, Y.-X.; Klabunde, K.J. Studies of Pt-Sn/Al2O3 catalysts prepared by Pt and Sn coevaporation (solvated metal atom dispersion). J. Catal. 1990, 126, 173–186. [Google Scholar] [CrossRef]
- Zhang, S.; Zhou, Y.; Zhang, Y.; Huang, L. Effect of K addition on catalytic performance of PtSn/ZSM-5 catalyst for propane dehydrogenation. Catal. Let. 2010, 135, 76–82. [Google Scholar] [CrossRef]
- Wang, G.; Zhang, H.; Wang, H.; Zhu, Q.; Li, C.; Shan, H. The role of metallic Sn species in catalytic dehydrogenation of propane: Active component rather than only promoter. J. Catal. 2016, 344, 606–608. [Google Scholar] [CrossRef]
- Katada, N.; Igi, H.; Kim, J.H. Determination of the acidic properties of zeolite by theoretical analysis of temperature-programmed desorption of ammonia based on adsorption equilibrium. J. Phys. Chem. B 1997, 101, 5969–5977. [Google Scholar] [CrossRef]
- Pham, H.N.; Sattler, J.J.H.B.; Weckhuysen, B.M.; Datye, A.K. The role of Sn in the regeneration of Pt/γ-Al2O3 light alkane dehydrogenation catalysts. ACS Catal. 2016, 6, 2257–2264. [Google Scholar] [CrossRef] [PubMed] [Green Version]
- Gong, N.; Zhao, Z. Efficient supported Pt-Sn catalyst on carambola-like alumina for direct dehydrogenation of propane to propene. Mol. Catal. 2019, 477, 110543. [Google Scholar] [CrossRef]
- Jang, E.J.; Lee, J.; Jeong, H.Y.; Kwak, J.H. Controlling the acid-base properties of alumina for stable PtSn-based propane dehydrogenation catalysts. Appl. Catal. A Gen. 2019, 572, 1–8. [Google Scholar] [CrossRef]
- Wang, Z.; Chen, Y.; Mao, S.; Wu, K.; Zhang, K.; Li, Q.; Wang, Y. Chemical insight into the structure and formation of coke on PtSn alloy during propane dehydrogenation. Adv. Sustain. Syst. 2020, 4, 2000092. [Google Scholar] [CrossRef]
- Jung, J.-W.; Kim, W.-I.; Kim, J.-R.; Oh, K.; Koh, H.L. Effect of direct reduction treatment on Pt–Sn/Al2O3 catalyst for propane dehydrogenation. Catalysts 2019, 9, 446. [Google Scholar] [CrossRef] [Green Version]
- Kim, G.H.; Jung, K.-D.; Kim, W.-I.; Um, B.-H.; Shin, C.-H.; Oh, K.; Koh, H.L. Effect of oxychlorination treatment on the regeneration of Pt–Sn/Al2O3 catalyst for propane dehydrogenation. Res. Chem. Intermed. 2016, 42, 351–365. [Google Scholar] [CrossRef]
- Prakash, N.; Lee, M.-H.; Yoon, S.; Jung, K.-D. Role of acid solvent to prepare highly active PtSn/θ-Al2O3 catalysts in dehydrogenation of propane to propylene. Catal. Today 2017, 293, 33–41. [Google Scholar] [CrossRef]
- Zangeneh, F.T.; Taeb, A.; Gholivand, K.; Sahebdelfar, S. The effect of mixed HCl–KCl competitive adsorbate on Pt adsorption and catalytic properties of Pt–Sn/Al2O3 catalysts in propane dehydrogenation. Appl. Surf. Sci. 2015, 357, 172–178. [Google Scholar] [CrossRef]
- Zhao, S.Y.; Xu, B.L.; Yu, L.; Fan, Y.N. Honeycomb-shaped PtSnNa/g-Al2O3/cordierite monolithic catalyst with improved stability and selectivity for propane dehydrogenation. Chin. Chem. Lett. 2018, 29, 884–886. [Google Scholar] [CrossRef]
- Zhu, X.Y.; Wang, T.H.; Xu, Z.K.; Yue, Y.Y.; Lin, M.G.; Zhu, H.B. Pt-Sn clusters anchored at Al3+ penta sites as a sinter-resistant and regenerable catalyst for propane dehydrogenation. J. Energy Chem. 2022, 65, 293–301. [Google Scholar] [CrossRef]
- Fan, X.; Li, J.; Zhao, Z.; Wei, Y.; Liu, J.; Duan, A.; Jiang, G. Dehydrogenation of propane over PtSnAl/SBA-15 catalysts: Al addition effect and coke formation analysis. Catal. Sci. Technol. 2015, 5, 339–350. [Google Scholar] [CrossRef]
- Li, Q.; Sui, Z.; Zhou, X.; Zhu, Y.; Zhou, J.; Chen, D. Coke formation on Pt–Sn/Al2O3 catalyst in propane dehydrogenation: Coke characterization and kinetic study. Top. Catal. 2011, 54, 888–896. [Google Scholar] [CrossRef]
- Iglesias-Juez, A.; Beale, A.M.; Maaijen, K.; Weng, T.C.; Glatzel, P.; Weckhuysen, B.M. A combined in situ time-resolved UV–Vis, Raman and high-energy resolution X-ray absorption spectroscopy study on the deactivation behavior of Pt and PtSn propane dehydrogenation catalysts under industrial reaction conditions. J. Catal. 2010, 276, 268–279. [Google Scholar] [CrossRef]
Publisher’s Note: MDPI stays neutral with regard to jurisdictional claims in published maps and institutional affiliations. |
© 2022 by the authors. Licensee MDPI, Basel, Switzerland. This article is an open access article distributed under the terms and conditions of the Creative Commons Attribution (CC BY) license (https://creativecommons.org/licenses/by/4.0/).