Article

Role of the Potential Range during Stress Testing of Platinum-Containing Electrocatalysts at Elevated Temperature

1
Faculty of Chemistry, Southern Federal University, 7 Zorge St, 344090 Rostov-on-Don, Russia
2
Prometheus R&D LLC, 4g/36 Zhmaylova St, 344091 Rostov-on-Don, Russia
3
Faculty of Physics, Southern Federal University, 5 Zorge St, 344090 Rostov-on-Don, Russia
4
Research Institute of Physical Organic Chemistry, Southern Federal University, Stachki St. 194/2, Rostov-on-Don 344090, Russia
*
Author to whom correspondence should be addressed.
Catalysts 2022, 12(10), 1179; https://doi.org/10.3390/catal12101179
Submission received: 25 August 2022 / Revised: 30 September 2022 / Accepted: 4 October 2022 / Published: 6 October 2022
(This article belongs to the Special Issue Pt-M (M = Ni,Co,Cu, etc.)/C Electrocatalysts)

Abstract

:
The durability of low temperature proton exchange membrane fuel cell (PEMFC) catalysts crucially affects their lifetime. The choice of carbon support is important in terms of increasing the stability of catalysts. In this research, Pt/C samples were obtained using the polyol synthesis method on two types of carbon supports: the standard support, Vulcan XC-72, and carbon support with a high degree of graphitization, ECS-002402. One method for assessing structural characteristics is through transmission electron microscopy (TEM), according to which materials G1 and G2 showed an average nanoparticle size of 3.7 and 4.2 nm, respectively. On all catalysts, the oxygen reduction reaction proceeded according to the four electron mechanism. Durability was assessed by changes in ESA and activity in the ORR after 1000 cycles, with changes in the upper potential values: 0.7; 1.0; 1.2; and 1.4 V. After accelerated stress testing, the G1 material showed the greatest residual activity at a potential of 1.4 V (165 A/g (Pt). Based on the results of comparing various ADT protocols, the optimal mode of 0.4 and 1.4 V was chosen, and should be used for further studies comparing the durability of Pt/C catalysts.

Graphical Abstract

1. Introduction

In the world today, increasingly greater attention is paid to the search for alternative energy sources. One promising source of current is in fuel cells (FC). FCs are a highly efficient, reliable, durable, and environmentally friendly way to produce energy [1,2,3]. Low-temperature fuel cells with an operating temperature range of 25–100 °C acquire great importance. Compared with high-temperature fuel cells, they are characterized by their compactness, high power, environmentally friendly fuel, and autonomy [4,5,6,7]. To increase the rate of chemical reactions occurring in fuel cells, special platinum-containing catalysts are used. Therefore, one of the most important parts of the fuel cell is its nanostructured catalyst based on nanoparticles (NP) of platinum or its alloys deposited on carbon material with a developed surface [8,9,10]. The carbon support plays a major role in terms of increasing the stability of catalysts during operation. Highly dispersed carbon supports are characterized by indicators such as hydrophobic/hydrophilic properties of the surface; diameter, shape, and volume of pores; and degree of corrosion resistance [11,12,13,14,15]. When synthesizing Pt electrocatalysts, it is important to use a carbon support with an optimal surface area [15,16].
The main requirements for electrocatalysts are a high area of an electrochemically active surface (ESA), oxygen reduction reaction (ORR) activity, as well as durability during FC operation [17,18,19]. It is difficult to achieve a combination of high activity and stability, as these parameters depend differently on the structural and morphological characteristics of platinum-containing electrocatalysts [20,21]. The best way to evaluate the durability of a catalyst is long-term testing in membrane–electrode assembly (MEA) [18,22,23]. This method of investigating stability is expensive and time- and energy-consuming; therefore, at the initial stages of the research, studies are carried out in laboratory conditions [24,25,26]. Electrocatalysts are tested for stability by accelerated degradation testing (ADT) in the form of multiple repetitions of cyclic potential sweep in different potential ranges [27,28]. In the process of ADT, the changes in the ESA and specific activity values of the catalyst are recorded.
For laboratory stress tests, the potential range, sweep rate, electrolyte composition, and temperature all play an important role [29]. The degradation of electrocatalysts can be caused by the dissolution of platinum NPs; detachment of NPs from the carbon surface; agglomeration of particles; metal reprecipitation; and oxidation of the carbon support. There are two main types of degradation mechanisms for Pt-containing electrocatalysts, associated with the degradation of Pt nanoparticles or carbon support oxidation. The contribution of each of the degradation processes depends on the potential range of the ADT [30,31]. It is widely described in publications [23,32] that, at a potential of 0.4–1.0 V, degradation processes are predominantly associated with the transformation of metal NPs distributed over the support surface. At potentials above 1.1 V, the main contribution is from processes of material degradation due to oxidation of the carbon support. As a result, both the isolation of support parts with deposited NPs and the detachment of metal NPs, loss of electronic contact, and a decrease in the ESA can occur [33,34,35].
It is important to note that the durability of materials largely depends on the properties and type of carbon support. It was noted in [36] that supports with a high degree of graphitization exhibited a lower tendency for degradation and oxidation during the operation of electrocatalysts. Thus, the use of supports with a high degree of graphitization could make it possible to obtain electrocatalysts with high activity and stability [11].
The aim of this work was to obtain and comparatively study the stability of Pt/C electrocatalysts based on carbon supports with different degrees of graphitization in various stress testing protocols.
In this work, the degradation of Pt electrocatalysts for low-temperature fuel cells (LTFCs) at an elevated temperature (60 °C) in the “start-stop” stress testing mode was studied in detail. The conditions of this experiment were as close as possible to real conditions, as LTFCs work at temperatures up to 80 °C, and their switching on and off systems was simulated by the above described mode [37]. For the first time, the degradation of electrocatalysts was normalized per 1 C of electricity passed, taking into account the surface area of each catalyst. This approach is very innovative and important for evaluating the effectiveness of catalyst stability assessment under laboratory conditions.

2. Results and Discussion

The first phase of the research examined the structural characteristics of the chosen carbon supports. The XRD data showed that the ECS support had narrower and more pronounced reflections of graphite (002) and (100) at 25.8 and 42.8 2θ degrees, respectively, compared with the Vulcan support, which had 2θ degrees of the (002) 25.1 and (100) 43.5 facets, indicating a greater degree of graphitization of the pattern ECS support (Figure 1a). This result is consistent with the combined scattering spectroscopy results (Figure 1b), which show that the carbon support has two distinct peaks at around 1346 and 1600 cm−1 that correspond to the D and G band, respectively [38]. From the Raman curves, the intensity ratio of ECS was found to be ID/IG = 1.01, which was lower than for the Vulcan (ID/IG = 1.17). This parameter for the ECS support was consistent with the manufacturer’s data [39]. A lower ID/IG ratio according to Raman spectroscopy indicates a greater degree of support graphitization [40].
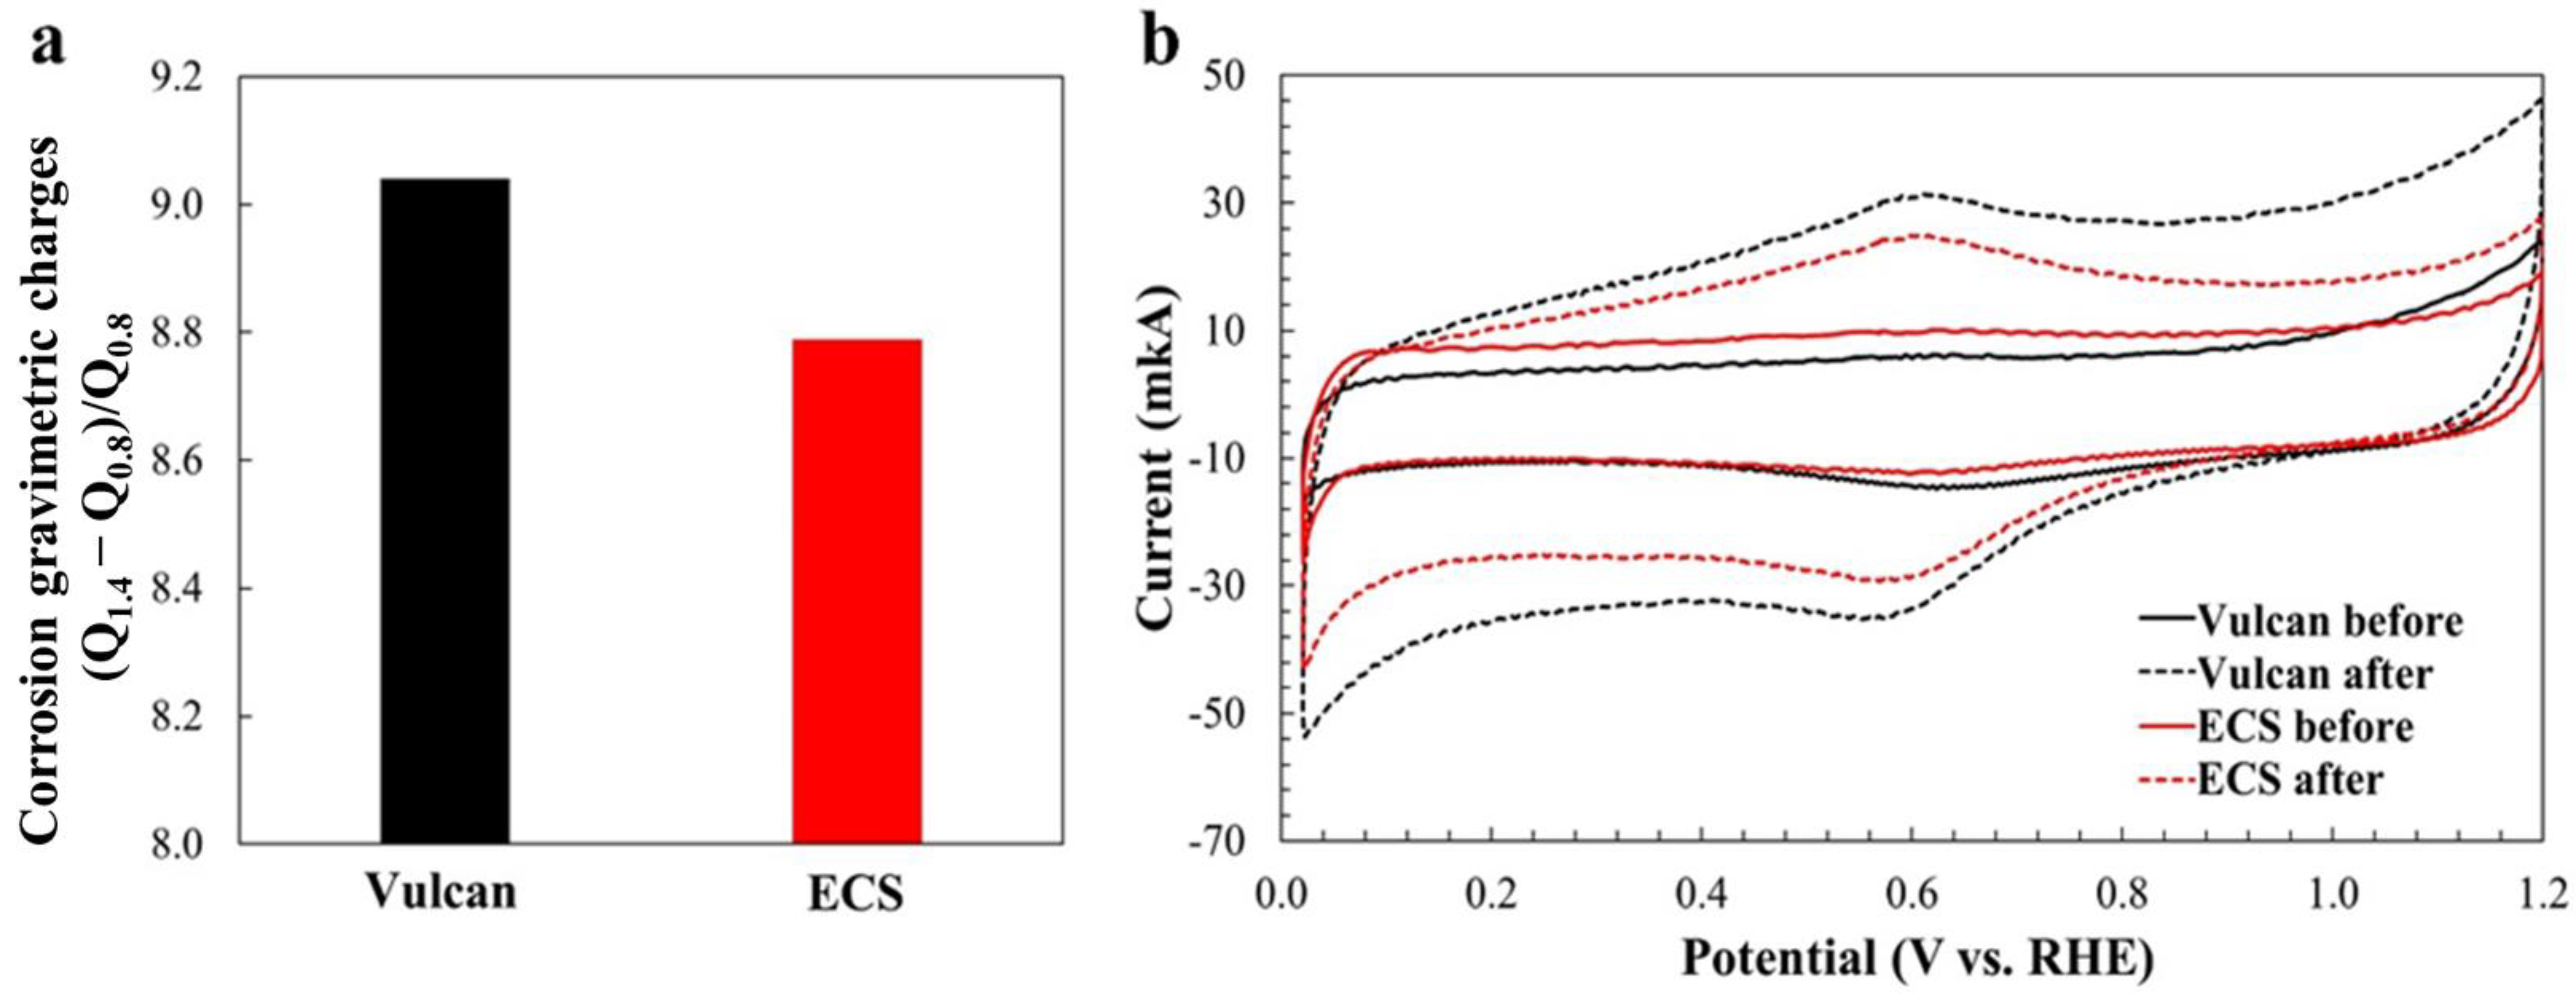
Then, we carried out a comparative evaluation of support durability. The corrosion of the support was calculated, taking into account the charge/discharge currents in the double layer region. Figure 2 shows that the Vulcan support is more corroded than the ECS. This can be judged both by the amount of electricity that passed through the system during exposure to high (1.4 V) and low (0.8 V) potential, and by the type of CVs before and after ADT (Figure S1).
After studying the structural characteristics of carbon supports, Pt/C catalysts were synthesized. The mass fraction of platinum in the obtained materials was 39% (Table 1).
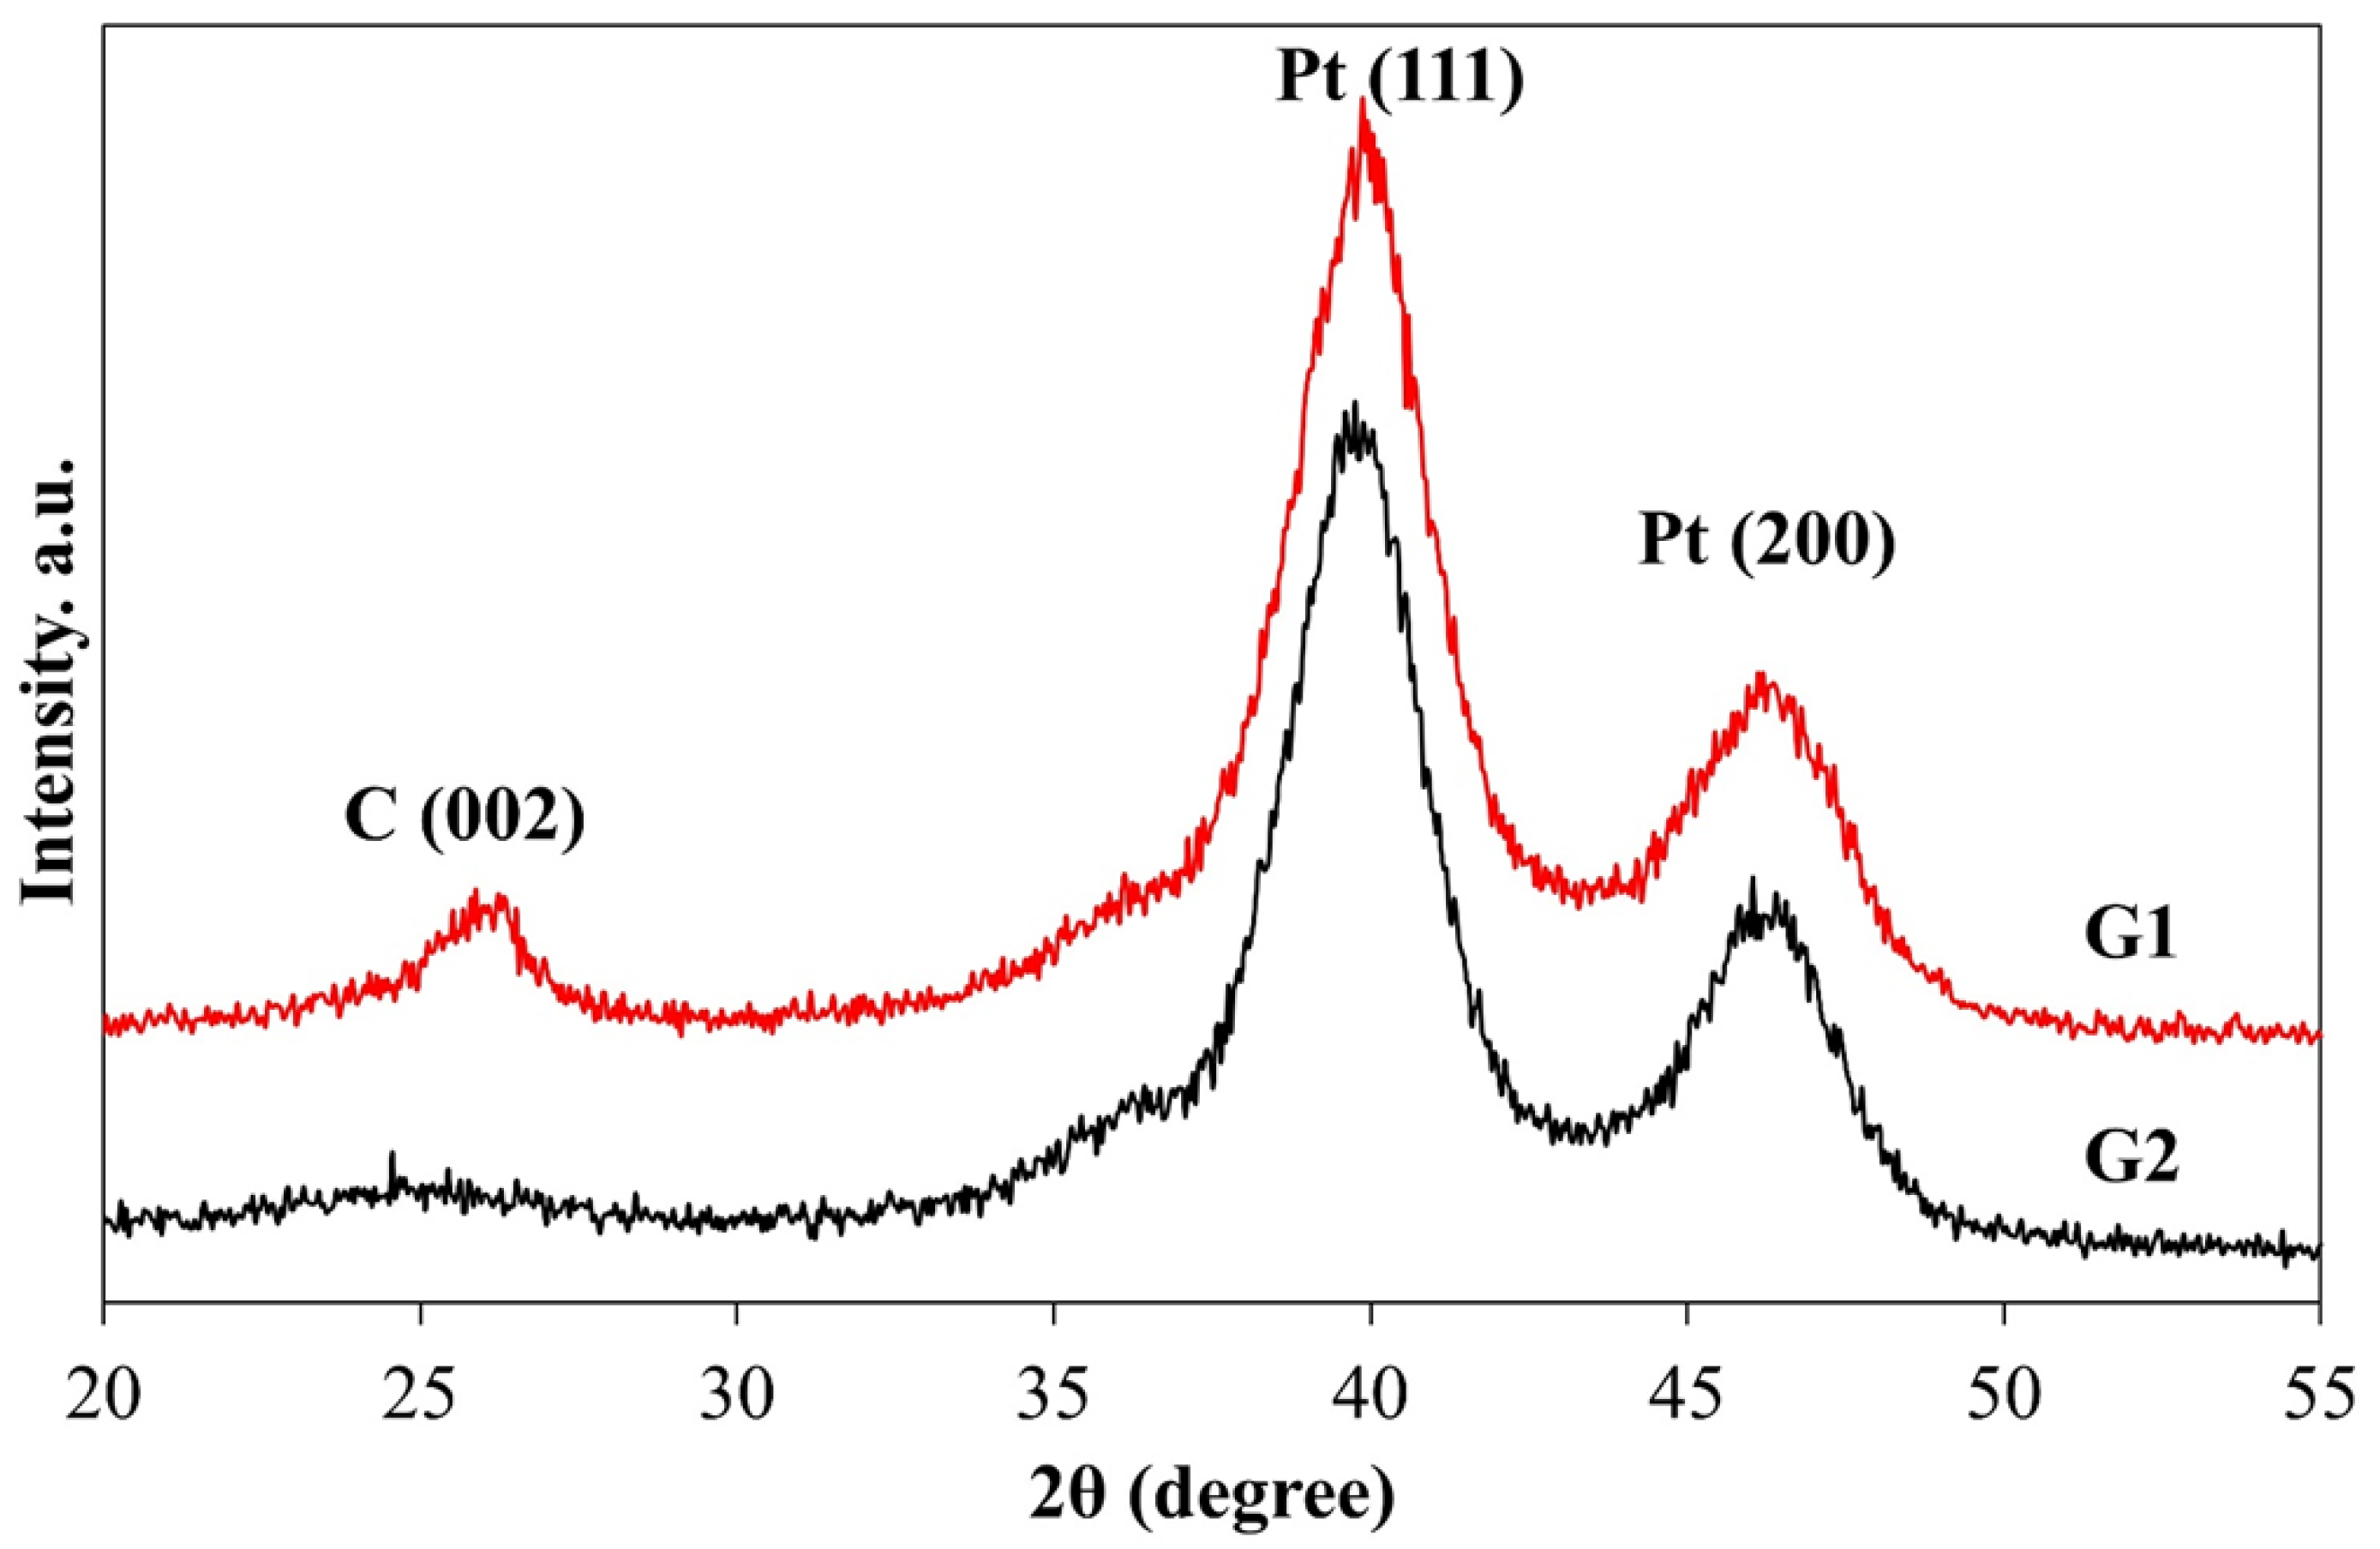
According to the XRD analysis of Pt/C materials on different carbon supports (Figure 3), a phase of nanodispersed platinum and carbon can be distinguished. The reflection in the 25° region corresponds to the carbon phase (PDF # 26-1076), and the reflections in the regions near 40 and 46° correspond to the (111) and (200) reflections of the platinum phase (PDF # 04-0802). The average diameter of the crystallites in the obtained Pt/C catalysts was calculated using the Sherrer formula and was 2.6 and 3.2 nm for the G2 and G1 samples, respectively (Table 1). The appearance of a more pronounced carbon peak near the values of the 2θ ≈ 25° on the G1 X-ray diffraction pattern indicates a high graphitization degree of the ECS carbon support.
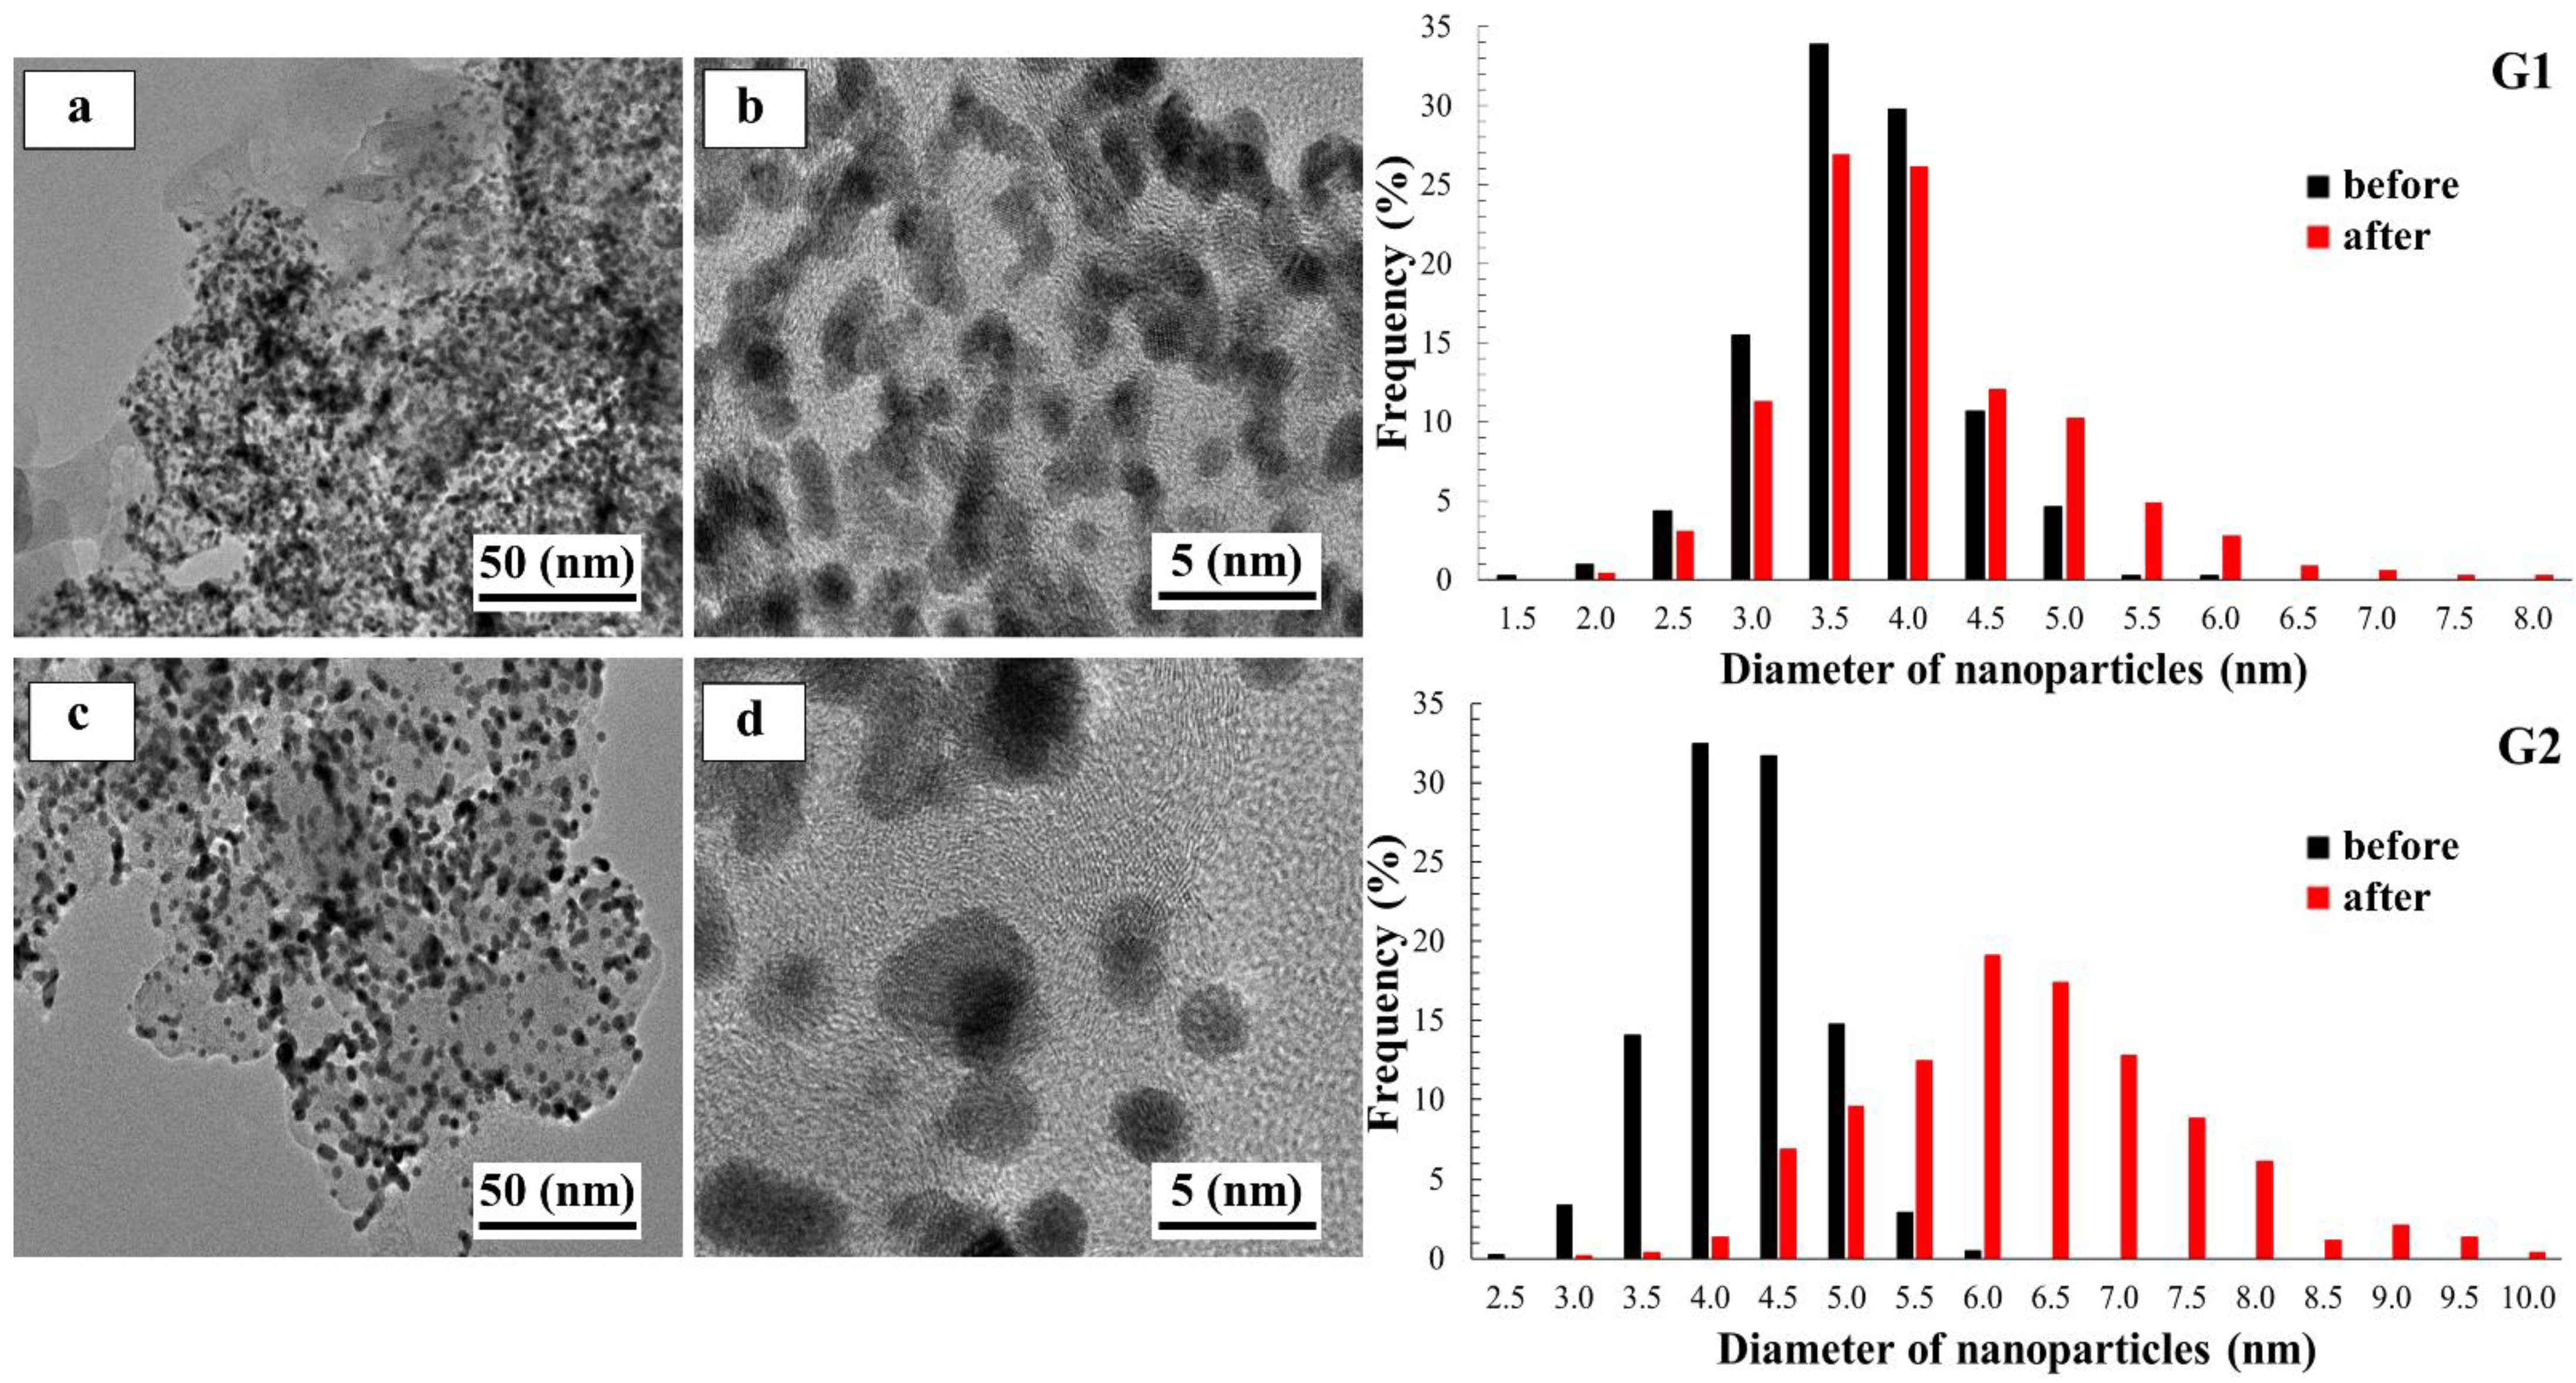
It was found that the average size of Pt NPs in the synthesized catalysts varied from 3.7 (G1) to 4.2 nm (G2), according to the TEM analysis (Figure 4). It should be noted that the difference between the crystallite sizes determined by XRD and the size of NPs from TEM data is a typical case for nanostructured Pt/C materials. These differences are related to the principle of calculation and data processing by the presented research methods, the possible contribution of NP structural defects to the broadening of XRD patterns, and the difficulties in recognizing ultra-small particles in TEM micrographs. In material G1, the average crystallite size was 3.2 nm, and the average NP size was 3.7 nm. In this catalyst, NPs were well crystallized and did not contain amorphous regions. When comparing the histograms of the NP size distribution, it is evident that the smaller size of NPs was combined with a narrower size distribution (Figure 4).
Intense oxidation of Pt/C materials G1 and G2 begins at a lower temperature and occurs in a narrower temperature range than the oxidation of carbon materials, according to the results of thermogravimetry (TGA) (Figure 5a). This is typical for Pt/C catalysts [41,42] and is associated with the acceleration of carbon support oxidation due to the catalytic effect of platinum. The combustion of pure supports occurs in one stage (single process), as the differential scanning calorimetry (DSC) curves have only one broad peak (Figure 5b, Vulcan and ECS curves). In turn, the pattern of Pt/C combustion is very complex, and there are several maxima on the DSC curve. A similar result was obtained in [43] and is explained by the uneven distribution of Pt on the particles of the carbon support. The nature of Pt/C material combustion on different carbon supports differs considerably: the G2 material burns in a narrower temperature range, and the G1 in a wider range (Figure 5b), which indicates the uneven distribution of Pt and greater resistance of the carbon support to oxidation. In addition, the maximum of DSC curve combustion of the G2 material is at a lower temperature (389 °C), compared with the G1 material (455 °C).
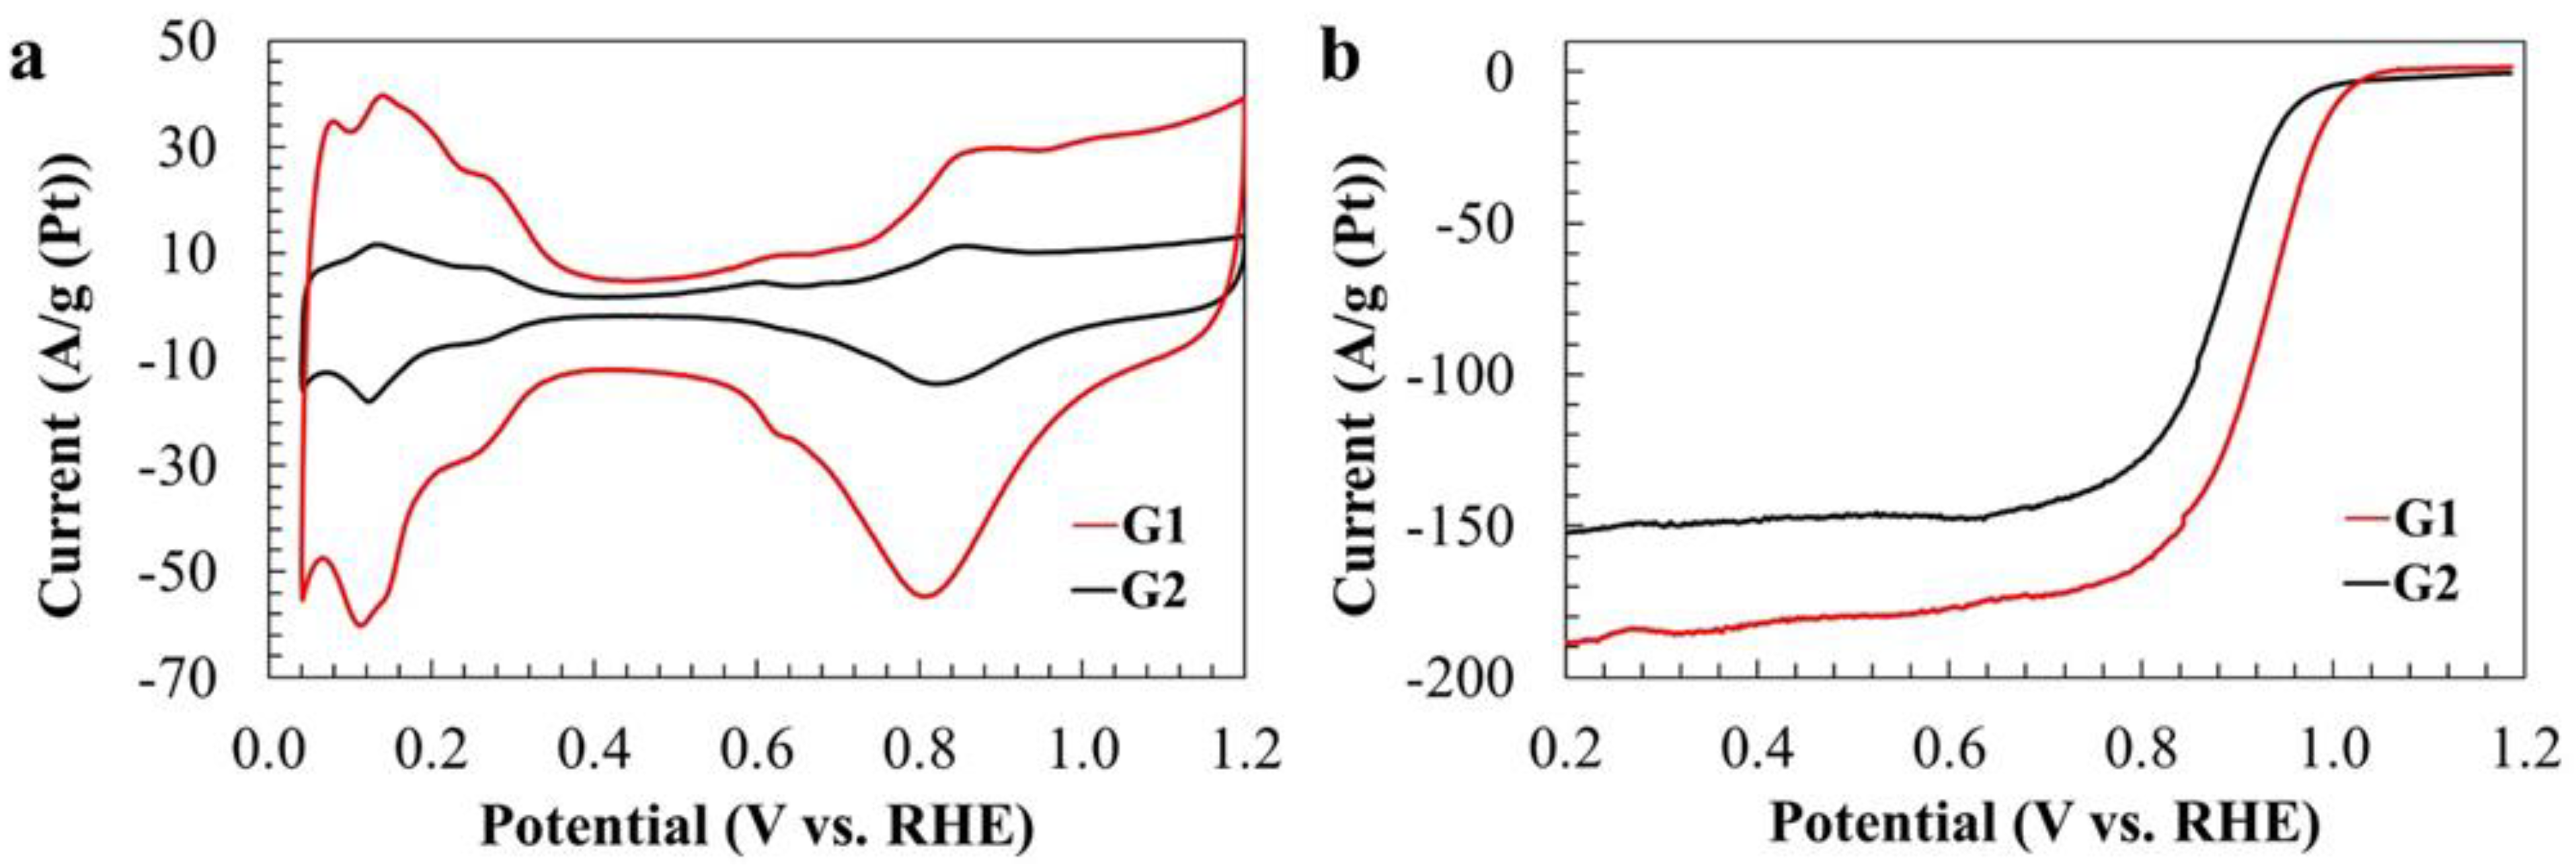
The cyclic voltammograms of the obtained Pt/C catalysts have a form typical of a platinum electrode (Figure 6a). Sample G1 is characterized by higher currents in all CV regions compared with G2, which is associated with both the high specific surface area of catalyst G1 and the high dispersity of the ECS support. Despite using the same synthesis method for Pt/C, G2 showed a 2.6 times lower ESA, which is consistent with the larger average NP size determined by TEM (Table 1, Figure 4).
The number of electrons involved in the oxygen reduction reaction was close to 4, according to Koutetsky–Levich plots, for both materials (Figure S2) (Table 1). Sample G1 was characterized by a higher half-wave potential (Figure 6b) and, as a consequence, a higher mass activity (Table 1). The experimental data were fitted to two Tafel slope regions (Figure S3) at low (E > 0.8 V) and high (E < 0.8 V) overpotential to enable a comparison with literature data (Table S1) [44,45,46,47,48,49,50]. The slope of the Tafel curve for the G1 material was slightly higher than for the G2 material (Table 1). Due to the smaller size of the NPs, the platinum in G1 is likely to participate more effectively in the ORR compared with G2. It is known from the literature [51] that the activity in ORR directly depends on the size of nanoparticles in the case of Pt electrocatalysts. As the average size of the NP catalyst G1 was smaller than G2 (Table 1), the fraction of active facets in it is larger; due to this, it showed greater activity in ORR.
Thus, by liquid-phase synthesis, it was possible to obtain Pt/C electrocatalysts with a narrow NP size distribution on different carbon supports: Vulcan XC-72 and ECS. The ECS support is characterized by a higher degree of graphitization, is less prone to corrosion, and makes it possible to produce a material with a higher ESA and catalytic activity.
The next stage of research was to study the durability of the obtained materials under conditions of multiple application of potentials: 0.4 and 0.7 V; 0.4 and 1.0 V; 0.4 and 1.2 V; and 0.4 and 1.4 V. The upper potential was varied in order to follow the trend in the degradation of Pt/C electrocatalysts depending on ADT conditions.
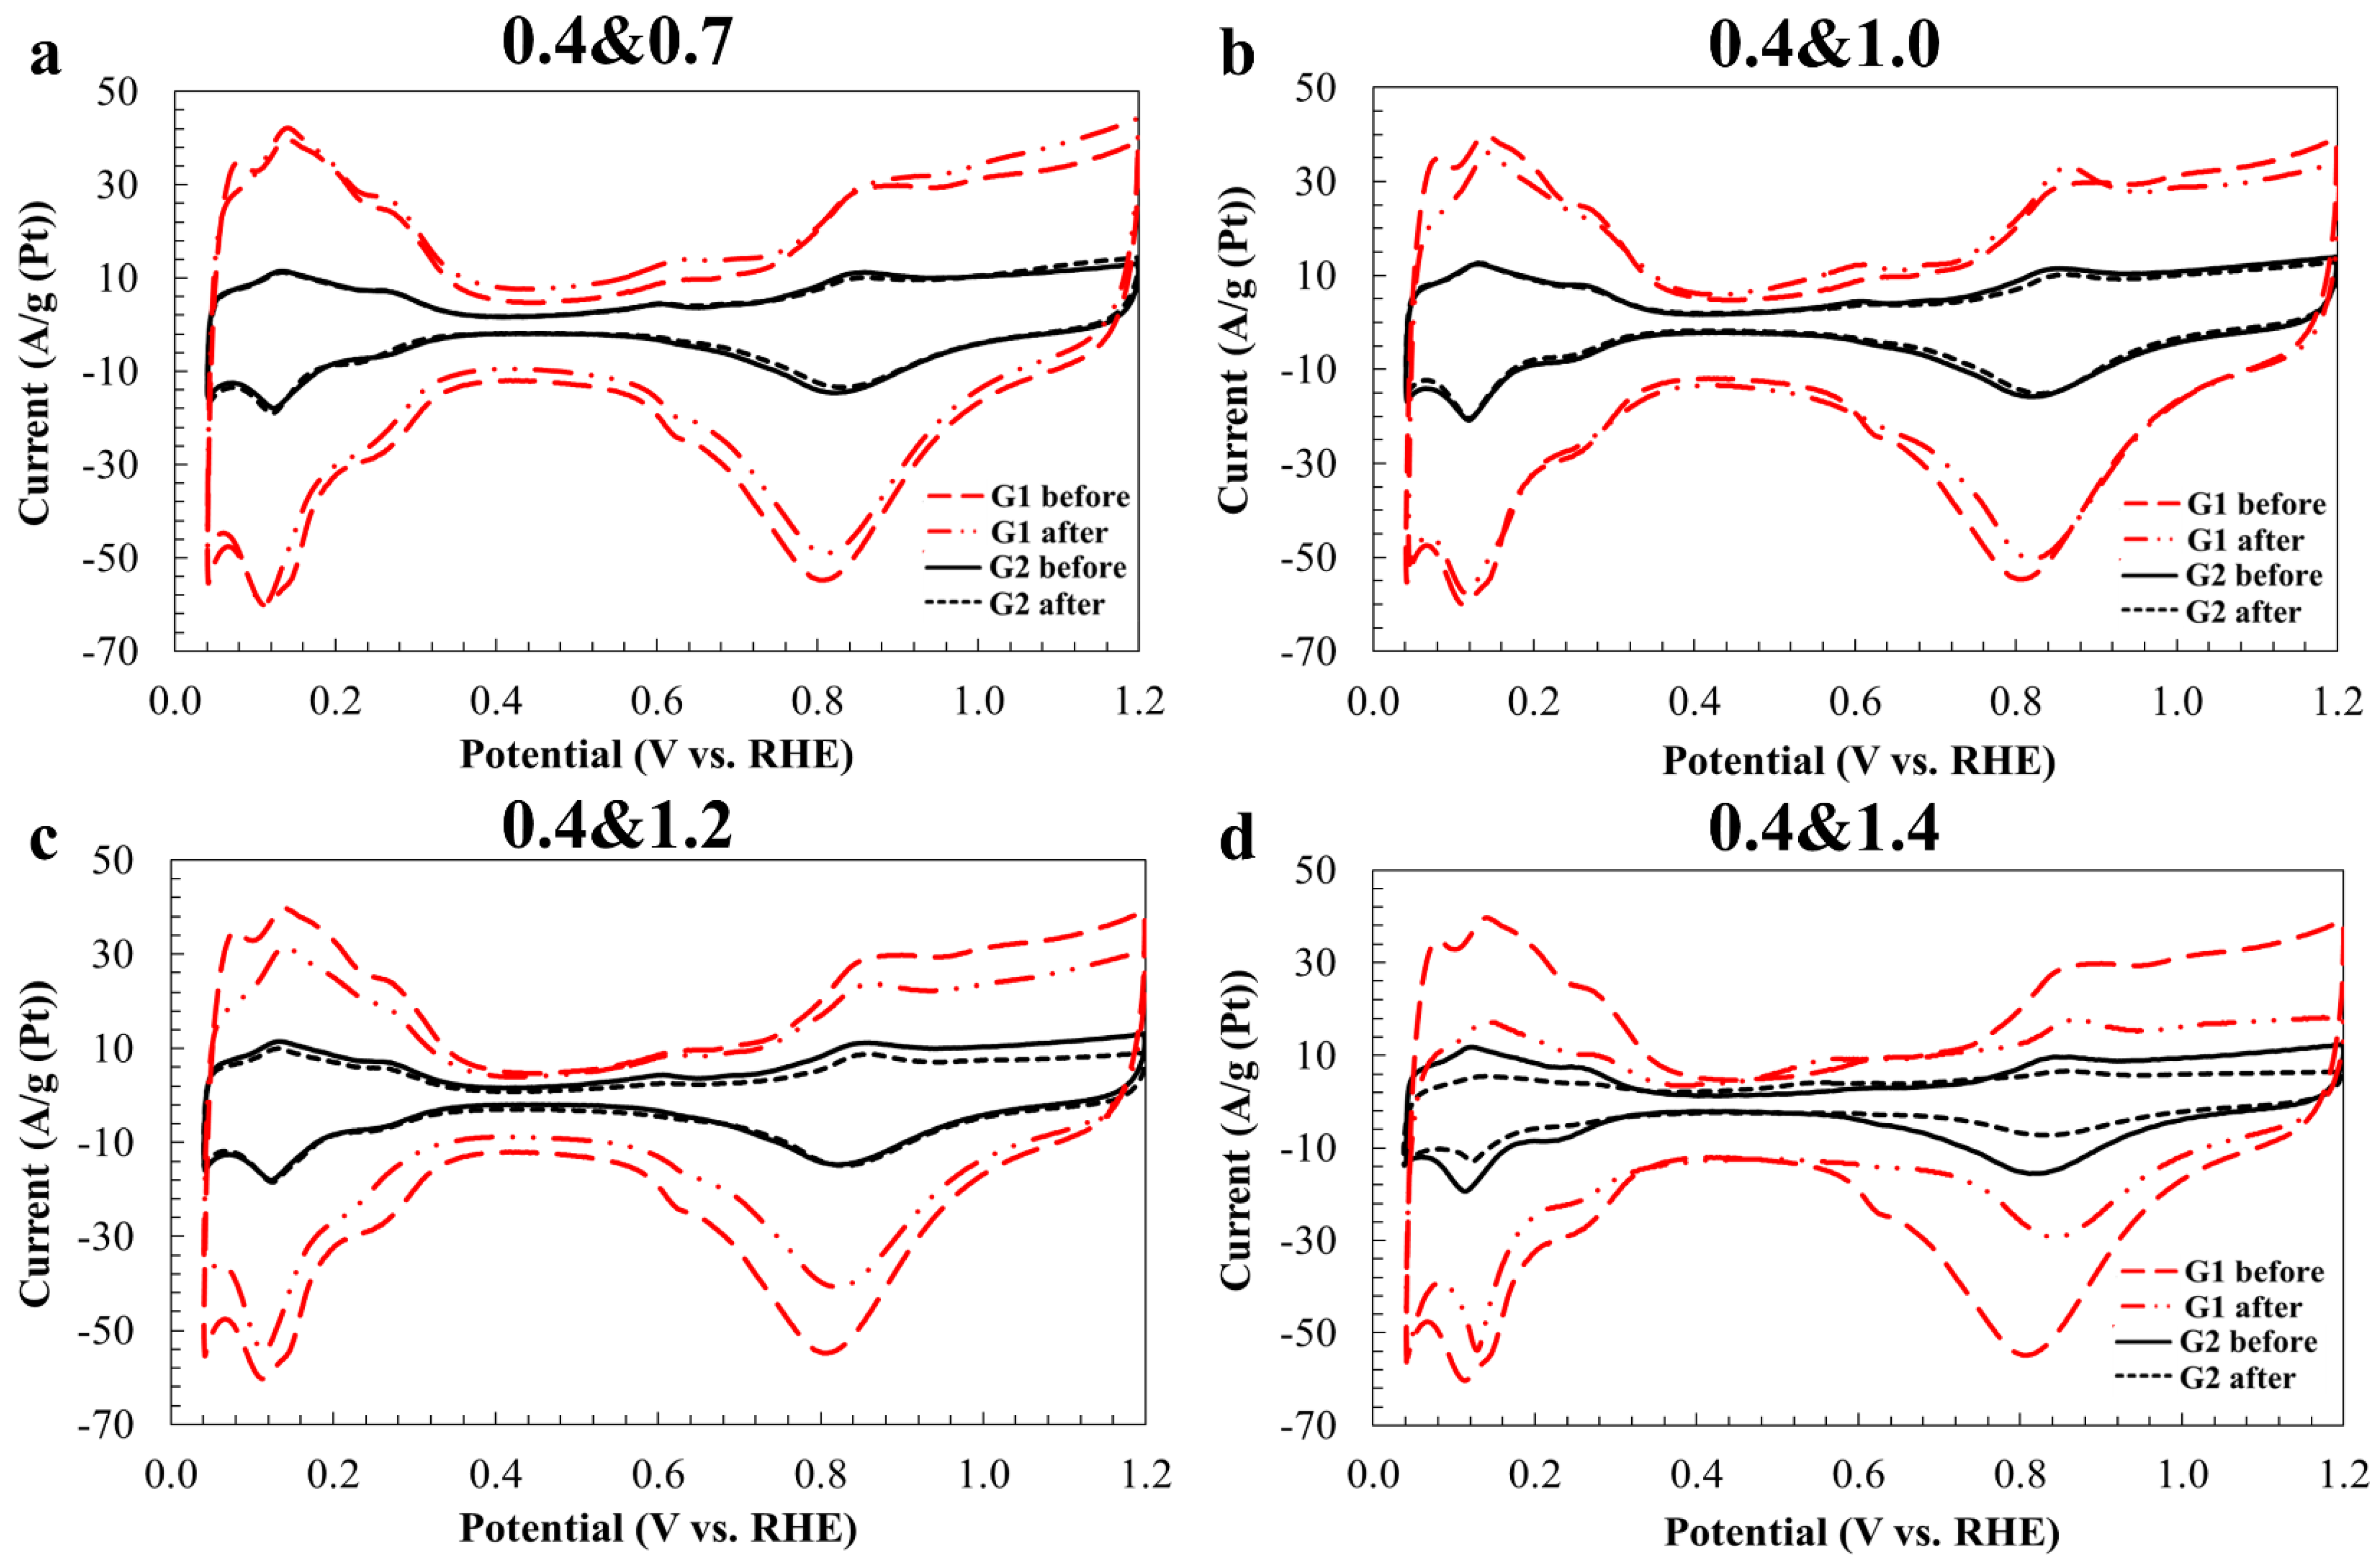
According to the CV results before and after accelerated stress testing under various conditions (Figure 7), it was clear that both materials degrade to a greater extent when ADT in the potentials 0.4 and 1.4 V is used, and to the least extent in the potentials 0.4 and 0.7 V. Despite a slightly greater degradation of the G1 material (Table 2) regardless of the ADT conditions, the ESA value of the material remained 2.2–2.6 times higher compared with the G2 material.
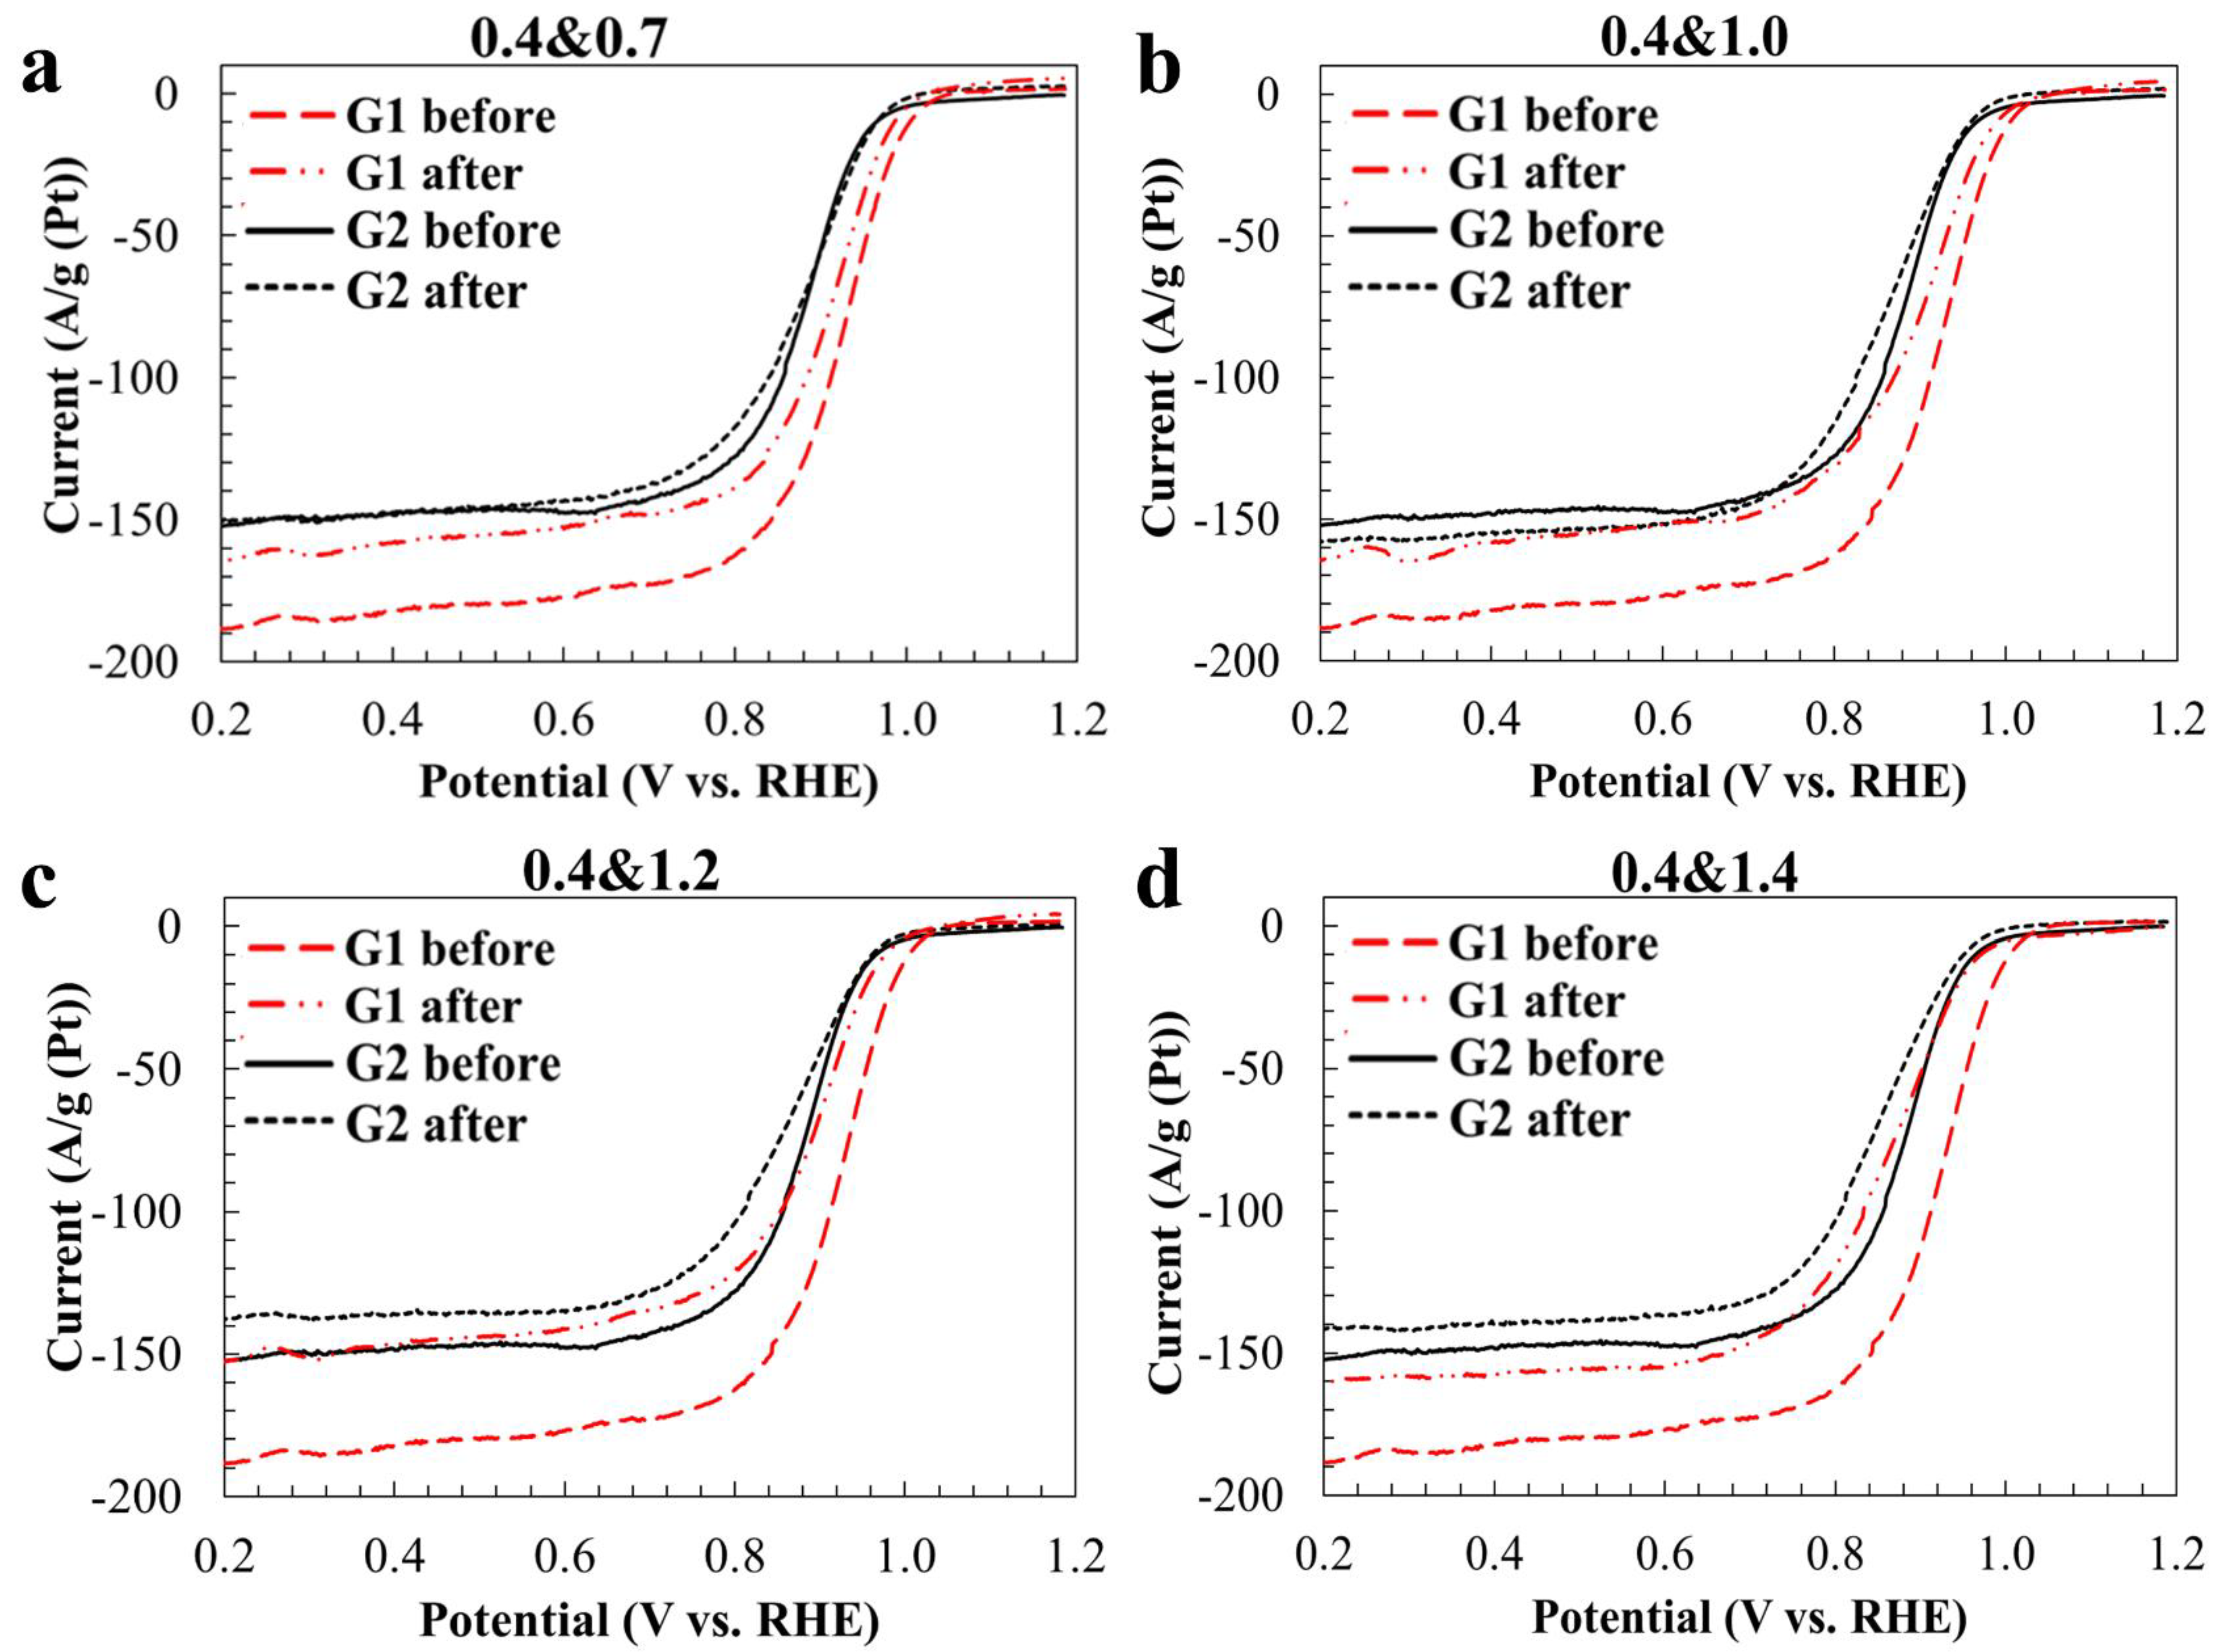
Additionally, stability was evaluated by the change in ORR activity before and after ADT (Figure 8). After the stress test, the voltammograms of oxygen electroreduction for both catalysts slightly shifted to the region of lower potentials, which indicated a decrease in catalyst activity. Based on the type of potentiodynamic curves, it can be concluded that Pt/C samples degrade most in potentials of 0.4 and 1.4 V (Table 2). When comparing the activity of materials in the ORR after ADT, it was noted that, regardless of the ADT conditions, the G1 material demonstrated a higher mass and specific activity and a higher half-wave potential compared with the G2 material. At the same time, with an increase in the upper potential, the difference between the activity of G1 and G2 following ADT decreases (Table 2).
The stability was evaluated not only by the change in ESA value and ORR activity, but also by the amount of electricity that passed through the catalyst during the entire experiment (Figure 9), as rectangular pulses were applied to the system during the ADT.
In Figure 9, there is a logical trend: the higher the upper potential, the more electricity passes through the surface of the catalyst. The dependence of the amount of electricity on the number of cycles during testing is also affected by the upper potential: for ADT up to 0.7 V, the dependence has a minimum slope angle (Figure 9a), and at up to 1.4 V (Figure 9d), we have the maximum slope angle, regardless of the samples under study. This indicates a greater degree of degradation in material with an increase in the upper potential. Despite a similar degradation trend, G1 is more prone to degradation compared with G2, as G1 is characterized by rather high absolute values of electricity, due to its high surface area. For the first time, the degradation of electrocatalysts at different potentials was normalized per 1 C of electricity passed, considering the surface area of each catalyst (Figure S4). The similarity in the degree of degradation that occurs based on the amount of electricity passed through a unit of the catalyst surface during the stress test suggests that the greater degree of degradation in the G1 material is most likely associated with a larger ESA value. As noted earlier, despite the greater degradation, the G1 material on the ECS support had greater activity after various types of ADT, compared with the material on the Vulcan XC-72.
Based on the results described above, we concluded that both materials showed the most degradation in wide potentials (0.4 and 1.4 V); therefore, following ADT, the materials under these conditions were studied by TEM. In G1, the average NP size by TEM after the stress test increased from 3.7 to 4.0 nm, and in G2, from 4.2 to 6.3 nm. The nature of the NP size distribution for G1 remained practically unchanged (Figure 10), whereas for G2 ,the width of the size distribution significantly increased. These results were consistent with the ESA, as G1 degrades to a lesser extent. Note that after the ADT, both catalysts contain large agglomerates consisting of two to four nanoparticles (Figure 10).

3. Materials and Methods

3.1. Chemicals and Materials

For our experimental carbon supports, Vulcan XC-72 (Cabot Corporation, Boston, MA, USA.), ECS-002402 (Pajarito Powder, Albuquerque, NM, USA), H2PtCl6 * 6H2O (mass fraction of Pt 37.6%, «Aurat», Moscow, Russia), ethylene glycol (top grade, not less than 99.8%, «Rehacor» LLC, Rostov-on-Don, Russia), sodium hydroxide («Rehacor» LLC, Rostov-on-Don, Russia), and sulfuric acid (JSC «Vekton», Saint Petersburg, Russia) were used.

3.2. Synthesis of Catalysts

Polyol synthesis was used to obtain Pt/C catalysts on carbon supports of different grades: Vulcan XC-72 with a surface area of 270–290 m2/g [2,52] and ECS-002402 with a surface area of 410–430 m2/g [39]. Carbon material ECS-002402, in contrast with Vulcan XC-72, was characterized by a high degree of graphitization, which positively affects its corrosion-morphological stability [39]. In this synthesis, ethylene glycol simultaneously acts as both a solvent and reducing agent [53].
A carbon support weighing 0.15 g was added to 80 mL of ethylene glycol. Then 10 mL of 10 wt.% isopropanol and 3.3 mL of 1 M NaOH were added with stirring until a pH of 7 was reached. The resulting suspension was homogenized by ultrasound for 5 min. After that, with constant stirring, the calculated amount of the H2PtCl6·6H2O solution was added. The mixture was heated to 80 °C and kept under stirring for 3 h. After spontaneous cooling, 6.6 mL of 1 M H2SO4 was added dropwise (in order to precipitate the Pt nanoparticles on the carbon support) and the suspension was stirred for 1 h. The Pt/C catalyst was separated by filtration and washed repeatedly with bidistilled water and isopropanol. The sample was dried at 60 °C until a constant weight was reached.
The catalysts obtained on the ECS and Vulcan carbon supports were labeled as G1 and G2, respectively.

3.3. Attestation of Catalysts’ Structural and Morphological Characteristics

The mass fraction of platinum in the studied samples was determined by thermogravimetry from the mass of the unburned residue (Pt). X-ray phase analysis (XRD) was used to determine the phase composition of the samples and size of the nanoparticles (crystallites). XRD patterns were recorded on an ARL X’TRA diffractometer with Bragg–Brentano geometry. Typical settings were: 40 kW, 35 mA, scanning step 0.02 degrees in coordinates 2θ, and shooting speed 2 degrees per minute. Phase analysis was carried out on the basis of data obtained from open sources, with Crystallography Open Database (COD) also being used [54]. The fitting of the X-ray patterns was carried out using a SciDavIs processing packet; the position of the peaks, their full width at half maximum (FWHM), and area were determined by the Lorentz function approximation method. The average size of platinum crystallites was determined by diffractograms using reflection (111). The average crystallite diameter was determined by the Scherrer formula (1), as described in [55], in which the corresponding value of the full width at half maximum (FWHM) was substituted:
Dhkl = K × λ/[FWHM × cos(θ)]
where λ—is the wavelength of monochromatic radiation; FWHM—full width at half maximum (in radians); Dhkl is the average thickness of the “stack” of reflecting planes in the coherent scattering region, i.e., the average diameter of the crystallites; θ—the angle of reflection; and K = 0.89—the Scherrer constant. To take instrumental widening into account, the diffractometer was pre-calibrated using a plate of polycrystalline annealed α-quartz with a grain size of 2 to 4 microns as a standard sample.
Features of the spatial and dimensional distribution of platinum nanoparticles before and after the stress test were studied by transmission electron microscopy (TEM). TEM photographs were taken using the JEM-F200 and FEI Tecnai G2 F20 S-TWIN microscope equipped cold field emission electron gun with acceleration voltage at 200 kV and 12–15 μA current. For measurements, 0.5 mg of the catalyst was placed in 1 mL of isopropanol and dispersed by ultrasound. A drop of the resulting suspension was applied to a copper grid coated with an amorphous carbon layer, which was dried in air at room temperature for 20 min. The histograms of NP size distribution in the catalysts were plotted from the results of determining the sizes of at least 400 particles randomly selected from TEM images in different parts of the sample. The accuracy of determining the average NP size (Dav.NP) was ±5%.
Thermal analysis of obtained materials was performed using a combined TGA and DSC/DTA analyzer NETZSCH STA 449 C Jupiter in an atmosphere consisting of 80% N2 and 20% O2 in a temperature range from 40 to 800 °C at a heating rate of 10 °C/min and gas flow rate 20 mL min−1 using corundum crucibles. Weight of samples used for oxidation was 2–4 mg. All corundum crucibles were covered with lids that allowed gas flow during measurements. This was necessary to prevent the loss of Pt/C due to the rapid exothermic reaction of carbon. Thermograms and DSC curves show typical results of the individual tests. The kinetics study of thermal oxidation of each material was performed several times. Results (TGA and DSC/DTA curves) were well-reproduced. DSC and TGA curves for the oxidation of one of the studied Pt/C materials obtained in several experiments are shown in supplementary materials as evidence of high reproducibility.
Thermograms were represented in dimensionless units (the ordinate), where the weight fraction of reacted carbon ω was defined by the formula, ω = (mt − mt = 800)/(mt = 120 − mt = 800), where mt is the sample weight at a given temperature, mt = 800 is the sample weight at 800 °C, and mt = 120 is the sample weight at 120 °C. In search of a formula for calculating ω, we proceeded from the fact that at 800 °C, the weight of all the samples reached a constant value due to the complete combustion of carbon.
The Raman spectra were detected using a Renishaw inVia Reflex Raman spectrometer with spectral resolution better than 1 cm–1.

3.4. Attestation of the Electrochemical Characteristics of the Catalysts

Electrochemical measurements were carried out in a standard three-electrode electrochemical cell at an elevated temperature (60 °C) using a potentiostat-galvanostat P-45X (Elins). The silver chloride electrode was chosen as the reference electrode; the counter electrode was platinum wire. The potential values are given relative to the reversible hydrogen electrode (RHE). The electrolyte was 0.1 M HClO4.
To prepare the catalytic “ink”, 850 µL of isopropyl alcohol, 950 µL of deionized water, and 200 µL of 1% aqueous Nafion® polymer emulsion were added to 0.0040 g of sample. After that, the suspension was dispersed by ultrasound for 15 min. With constant stirring, an aliquot of “ink” with a volume of 8 μL was taken with a microdoser and applied to the end face of a polished and degreased glassy carbon disc electrode with an area of 0.196 cm2, recording the exact weight of the drop. The electrode was dried in air for 20 min at 700 rpm. The mass of the dispersed material deposited on the disk electrode was 8.5 × 10⁻⁵ mg/cm2 and 3.5 × 10⁻⁵ mg(Pt)/cm2, respectively.
Before making electrochemical measurements, the electrolyte was heated to 60 °C in saturated Ar atmosphere for 40 min. Then, to activate the catalyst, 100 cycles were performed in the potential range of 0.04 to 1.2 V vs. RHE. The potential sweep rate was 200 mV/s.
The electrochemically active surface area (ESA) was determined according to a cyclic voltammogram by calculating the amount of electricity spent on electrochemical adsorption/desorption of hydrogen [56]. The CV registration rate was 20 mV/s and the potential sweep range was from 0.04 to 1.2 V vs. RHE.
To determine the ORR activity of catalysts, the electrolyte was saturated with oxygen for 1 h. After that, a series of voltammograms was measured in the range from 0.05 to 1.2 V with a linear potential sweep at the rate of 20 mV/s. The electrode rotation speed was 400, 900, 1600, and 2500 rpm.
The ORR activity of catalysts (Ik—kinetic current) was determined from normalized voltammograms, taking into account the contribution of mass transfer under the RDE conditions for a potential of 0.85 V (RHE) [57,58]. For this, a graph was built in the Koutetsky–Levich coordinates—1/jk − 1/ω0.5, where jk is the kinetic current density (referred to the geometric area of RDE) and ω is the electrode rotation speed. Dividing the kinetic current by the platinum mass loaded onto the electrode and on the ESA, we obtained such activity parameters as mass (Imass) and specific (Isp) currents, respectively. The number of electrons involved in ORR was determined by the angle of the line in coordinates 1/j − 1/ω0.5.

3.5. Accelerated Degradation Tests

Before the start of stress tests, electrochemical activation of the catalyst was performed, and the ESA was measured as described above. To control the degradation of carbon materials in acidic solutions, they were subjected to repeated potential cycling in the range of 1.4–0.8 V, holding at each potential value for 50 and 10 s, respectively. The total duration of the stress test was 36 min. The amount of electricity (Q) passed at the upper (1.4 V) and lower (0.8 V) potentials was measured [59]. The support corrosion was calculated, considering the charge/discharge currents in the double layer region using formula (2).
(Q1.4 − Q0.8)/Q0.8 = Qcorr
As a method of stress testing to evaluate the degree of degradation of the electrocatalysts, we chose the protocol of multiple imposition of 3-s rectangular pulses (4 different modes) of the potential at the following values: (a) 0.4 and 0.7 V; (b) 0.4 and 1.0 V; (c) 0.4 and 1.2 V; and (d) 0.4 and 1.4 V. Cycling for 1000 cycles was carried out in a 0.1 M HClO4 solution in a saturated Ar atmosphere at 60 °C. After every 200 cycles, two CVs were recorded at the potential sweep rate of 20 mV/s in the potential range from 0.04 V to 1.2 V vs. RHE. At the end of the ADT, a series of voltammograms was recorded at electrode rotation speeds of 400, 900, 1600, and 2500 rpm.
Determination of the degree of degradation in combination with the measurement of the amount of electricity spent on the Faraday processes was carried out in the “start-stop” testing mode, in all 4 protocols. The stability of the catalysts was evaluated by the change in the ESA and ORR potentiodynamic curves (1600 rpm). In this case, the more electricity passed through the electrode during the stress test, the more active the catalyst of the corresponding Faraday processes was. At the same time, the cathode (at the lower potential) and anode (at the upper potential) amount of electricity were separately summarized for each ADT protocol.

4. Conclusions

In this study, the degradation of Pt electrocatalysts for low-temperature FC (LFC) at an elevated temperature (60 °C) in a “start-stop” stress-testing mode was studied in detail. For the first time, the degradation of electrocatalysts was normalized per 1 °C of electricity passed, considering the surface area of each catalyst. This approach is very important for evaluating the effectiveness of assessing catalyst stability under laboratory conditions. It was found that the degradation of platinum-containing electrocatalysts was affected by the ESA; hence, the greater the electrochemically active surface area, the greater the degradation.
Therefore, the Pt/C catalyst G1 on a highly graphitized ECS carbon support exhibited greater ORR activity and durability based on various tests compared with the Vulcan XC-72 carbon-supported G2 material. The TEM results of the samples after ADT at the potentials of 0.4 and 1.4 V showed an insignificant increase in the average NP size for the G1 sample, which confirmed its high durability. After stress testing, the G1 material showed the highest residual activity compared with the G2 material. At potentials of 0.4 and 1.4 V, the activity (A/g (Pt)) was 165 and 145 A/g, respectively. The Tafel slope at a high overpotential was 54.2 mV/dec for G1 and 48.9 mV/dec for G2, respectively. It was found that among the stress tests used under various conditions, ADT at the potentials of 0.4 and 1.4 led to the greatest degradation in the studied materials and is recommended for further comparative study of catalysts for PEMFC.
It should be noted that the use of various stress testing protocols showed that the material G1 had high values of mass activity and durability that significantly exceeded the corresponding characteristics for the material G2. Thus, we managed to obtain a very stable material on the ECS support with a high degree of graphitization, despite its high ESA.

Supplementary Materials

The following supporting information can be downloaded at: https://www.mdpi.com/article/10.3390/catal12101179/s1, Figure S1: Determination of the amount of electricity passed at the upper (1.4 V) and lower (0.8 V) potentials; Figure S2: A dependence of the current strength on the rotation speed of the RDE in the Koutetskiy—Levich coordinates; Figure S3: Comparison of Tafel plots (0.1 M HClO4, background corrected, IR compensated, O2 saturated); Figure S4: The degradation of electrocatalysts G1 and G2, normalized per 1 C of electricity passed; Table S1: The Tafel slope of Pt/C electrocatalysts during ORR.

Author Contributions

Conceptualization, I.G. and S.B.; methodology, I.G. and S.B.; validation, A.P., S.B. and N.L.; formal analysis, M.T. and I.P.; investigation, I.G.; data curation, S.B., M.T., N.L. and I.P.; writing—original draft preparation, I.G.; writing—review and editing, S.B.; visualization, I.G.; supervision, S.B.; project administration, I.G. All authors have read and agreed to the published version of the manuscript.

Funding

This research was financially supported by the Ministry of Science and Higher Education of the Russian Federation (State assignment in the field of scientific activity No. 0852-2020-0019).

Data Availability Statement

The data presented in this study are available on request from the corresponding author.

Acknowledgments

The authors are grateful to Guterman, V.E., Danilenko, M.V., and Nikulin, A.Y. The authors appreciate the support of LLC “PROMETHEUS R&D” (Rostov-on-Don), LLC “Systems for Microscopy and Analysis” (Skolkovo, Moscow), and Shared Use Center “High-Resolution Transmission Electron Microscopy” (SFedU) for conducting TEM studies.

Conflicts of Interest

The authors declare no conflict of interest.

Abbreviations

PEMFCProton exchange membrane fuel cells
ADTAccelerated degradation testing
NPsNanoparticles
MEAMembrane–electrode assembly
XRDX-ray diffraction
TEMTransmission electron microscopy
DSCDifferential scanning calorimetry
ESAElectrochemically active surface area
CVCyclic voltammetry
ORROxygen reduction reaction
TGAThermogravimetric analysis
RHEReversible hydrogen electrode
XRFX-ray fluorescence analysis
LSVLinear sweep voltammetry

References

  1. Yaroslavtsev, A.B.; Dobrovolsckiy, Y.A.; Shaglaeve, N.S.; Frolova, L.A.; Gerasimova, E.V.; Sanginov, E.A. Nanostructured materials for low-temperature fuel cells. Russ. Chem. Rev. 2012, 81, 191–201. [Google Scholar] [CrossRef]
  2. Holton, O.T.; Stevenson, J.W. The Role of Platinum in Proton Exchange Membrane Fuel Cells. Platinum Met. Rev. 2013, 57, 259–271. [Google Scholar] [CrossRef]
  3. Bagotsky, V.S.; Skundin, A.M.; Volfkovich, Y.M. Electrochemical Power Sources: Batteries, Fuel Cells, and Supercapacitors; John Wiley & Sons, Inc.: Hoboken, NJ, USA, 2015; ISBN1 9781118942857. Available online: https://books.google.ru/books?hl=ru&lr=&id=ub3eBQAAQBAJ&oi=fnd&pg=PR15&ots=_H00vLANTe&sig=akODm2f5gWa8Ml1PQwI89orQwJ8&redir_esc=y#v=onepage&q&f=false (accessed on 1 May 2022)ISBN2 9781118942857.
  4. Lv, H.; Li, D.; Strmcnik, D.; Paulikas, A.P.; Markovic, N.M.; Stamenkovic, V.R. Recent advances in the design of tailored nanomaterials for efficient oxygen reduction reaction. Nano Energy 2016, 29, 149–165. [Google Scholar] [CrossRef]
  5. Yu, E.H.; Krewer, U.; Scott, K. Principles and Materials Aspects of Direct Alkaline Alcohol Fuel Cells. Energies 2010, 3, 1499–1528. [Google Scholar] [CrossRef]
  6. O’Hayre, R.; Cha, S.W.; Collela, W.; Prinz, F.B. Fuel Cell Fundamentals; John Wiley & Sons, Inc.: Hoboken, NJ, USA, 2009; p. 576. Available online: https://books.google.ru/books?hl=en&lr=&id=O2JYCwAAQBAJ&oi=fnd&pg=PR11&ots=RRDKUTO3lf&sig=wSEznU4TFJhk4YydjqA_wBUPC7A&redir_esc=y (accessed on 20 March 2022).
  7. Kongkanand, A.; Mathias, M.F. The Priority and Challenge of High-Power Performance of Low-Platinum Proton-Exchange Membrane Fuel Cells. J. Phys. Chem. Lett. 2016, 7, 1127–1137. [Google Scholar] [CrossRef] [PubMed]
  8. Sun, X.; Gao, K.; Pang, X.; Yang, H.; Volinsky, A.A. Electrochemical Oxidation of Methanol on Pt-SnOx/C Catalysts Characterized by Electrochemistry Methods. J. Electrochem. Soc. 2015, 162, 1540–1548. [Google Scholar] [CrossRef] [Green Version]
  9. Singh, R.N.; Awasthi, R.; Sharma, C.S. Review: An overview of recent development of platinum-based cathode materials for direct methanol fuel cells. Int. J. Electrochem. Sci. 2014, 9, 5607–5639. [Google Scholar]
  10. Chen, Y.; Yang, F.; Dai, Y.; Wang, W.; Chen, S. Ni@Pt Core-Shell Nanoparticles: Synthesis, Structural and Electrochemical Properties. J. Phys. Chem. C 2008, 112, 1645–1649. [Google Scholar] [CrossRef]
  11. Antolini, E. Carbon supports for low-temperature fuel cell catalysts. Appl. Catal. B Environ. 2009, 88, 1–24. [Google Scholar] [CrossRef]
  12. Dicks, A.L. The role of carbon in fuel cells. J. Power Sources 2006, 156, 128–141. [Google Scholar] [CrossRef]
  13. Kim, M.; Park, J.N.; Kim, H.; Song, S.; Lee, W.H. The Preparation of Pt/C Catalysts Using Various Carbon Materials for the Cathode of PEMFC. J. Power Sources 2006, 163, 93–97. [Google Scholar] [CrossRef]
  14. Gharibi, H.; Javaheri, M.; Mirzaie, R.A. The synergy between multi-wall carbon nanotubes and Vulcan XC-72R in microporous layers. Int. J. Hydrog. Energy 2010, 35, 9241–9251. [Google Scholar] [CrossRef]
  15. Coutanceau, C.; Baranton, S.; Nappor, T.W. Platinum Fuel Cell Nanoparticle Syntheses: Effect on Morphology, Structure and Electrocatalytic Behavior. In The Delivery of Nanoparticles; InTech Open: London, UK, 2012; pp. 403–431. [Google Scholar] [CrossRef] [Green Version]
  16. Meier, J.C.; Galeano, C.; Katsounaros, I.; Witte, J.; Bongard, H.J.; Topalov, A.A.; Baldizzone, C.; Mezzavilla, S.; Schüth, F.; Mayrhofer, K.J.J. Design criteria for stable Pt/C fuel cell catalysts. Beilstein J. Nanotechnol. 2014, 5, 44–67. [Google Scholar] [CrossRef] [Green Version]
  17. Yano, H.; Watanabea, M.; Iiyamaa, A.; Uchida, H. Particle-size effect of Pt cathode catalysts on durability in fuel cells. Nano Energy 2016, 29, 323–333. [Google Scholar] [CrossRef]
  18. Pavlov, V.I.; Gerasimova, E.V.; Zolotukhina, E.V.; Dobrovolsky, Y.A.; Don, G.M.; Yaroslavtsev, A.B. Degradation of Pt/C electrocatalysts having different morphology in low-temperature PEM fuel cells. Nanotechnol. Russ. 2016, 11, 743–750. [Google Scholar] [CrossRef]
  19. Katsounaros, I.; Cherevko, S.; Zeradjanin, A.R.; Mayrhofer, K.J.J.; Karl, J.J. Oxygen electrochemistry as a cornerstone for sustainable energy conversion. Angew. Chem. Int. Ed. Engl. 2014, 53, 102–121. [Google Scholar] [CrossRef]
  20. Alekseenko, A.A.; Guterman, V.E.; Volochaev, V.A.; Belenov, S.V. Effect of wet synthesis conditions on the microstructure and active surface area of Pt/C catalysts. Inorg. Mater. 2015, 51, 1258–1263. [Google Scholar] [CrossRef]
  21. Shao, M.H.; Chang, Q.W.; Dodelet, J.P.; Chenitz, R. Recent Advances in Electrocatalysts for Oxygen Reduction Reaction. Chem. Rev. 2016, 116, 3594–3657. [Google Scholar] [CrossRef] [Green Version]
  22. Antolini, E.; Salgado, J.R.C.; Gonzalez, E.R. The stability of Pt–M (M = first row transition metal) alloy catalysts and its effect on the activity in low temperature fuel cells: A literature review and tests on a Pt–Co catalyst. J. Power Sources 2006, 160, 957–968. [Google Scholar] [CrossRef]
  23. Alekseenko, A.A.; Guterman, V.E.; Belenov, S.V.; Menshikov, V.S.; Tabachkova, N.Y.; Safronenko, O.I.; Moguchikh, E.A. Pt/C electrocatalysts based on the nanoparticles with the gradient structure. Int. J. Hydrog. Energy 2018, 43, 3676–3687. [Google Scholar] [CrossRef]
  24. Guterman, V.E.; Belenov, S.V.; Alekseenko, A.A.; Tabachkova, N.Y.; Volochaev, V.A. The relationship between activity and stability of deposited platinum–carbon electrocatalysts. Russ. J. Electrochem. 2017, 53, 531–539. [Google Scholar] [CrossRef]
  25. Capelo, A.; Esteves, M.A.; Sa, A.I.; Silva, R.A.; Cangueiro, L.; Almeida, A.; Vilar, R.; Rangel, C.M. Stability and durability under r cycling of Pt/C catalyst with new surface-functionalized carbon support. Int. J. Hydrogen Energy 2016, 41, 12962–12975. [Google Scholar] [CrossRef]
  26. Zhang, Y.; Chen, S.; Wang, Y.; Ding, W.; Wu, R.; Li, L.; Qi, X.; Wei, Z. Study of the degradation mechanisms of carbon-supported platinum fuel cells catalyst via different accelerated stress test. J. Power Sources 2015, 273, 62–69. [Google Scholar] [CrossRef]
  27. Cui, C.; Gan, L.; Li, H.; Yu, S.; Heggen, M.; Strasser, P. Octahedral PtNi Nanoparticle Catalysts: Exceptional Oxygen Reduction Activity by Tuning the Alloy Particle Surface Composition. Nano Lett. 2012, 12, 5885–5889. [Google Scholar] [CrossRef]
  28. Paulus, U.A.; Wokaun, A.; Scherer, G.G.; Schmidt, T.J.; Stamenkovic, V.R.; Marković, N.M.; Ross, P.N. Oxygen reduction on high surface area Pt-based alloy catalysts in comparison to well defined smooth bulk alloy electrodes. Electrochim. Acta 2002, 47, 3787–3798. [Google Scholar] [CrossRef]
  29. Alekseenko, A.A.; Moguchikh, E.A.; Safronenko, O.I.; Guterman, V.E. Durability of de-alloyed PtCu/C electrocatalysts. Int. J. Hydrog. Energy 2018, 43, 22885–22895. [Google Scholar] [CrossRef]
  30. Leontyev, I.; Belenov, S.; Guterman, V.; Haghi-Ashtiani, P.; Shaganov, A.; Dkhil, B. Catalytic activity of carbon-supported Pt nanoelectrocatalysts. Why reducing the size of Pt nanoparticles is not always beneficial. J. Phys. Chem. C 2011, 115, 5429–5434. [Google Scholar] [CrossRef]
  31. Zhang, T.; Wang, P.; Chen, H.; Pei, P. A review of automotive proton exchange membrane fuel cell degradation under start-stop operating condition. Appl. Energy 2018, 223, 249–262. [Google Scholar] [CrossRef]
  32. Wang, D.; Xin, H.; Hovden, R.; Wang, H.; Yu, Y.; Muller, D.; DiSalvo, F.; Abruña, H. Structurally ordered intermetallic platinum-cobalt core-shell nanoparticles with enhanced activity and stability as oxygen reduction electrocatalysts. Nat. Mater. 2013, 12, 81–87. [Google Scholar] [CrossRef]
  33. Ge, X.; Chen, L.; Kang, J.; Fujita, T.; Hirata, A.; Zhang, W.; Chen, M. A Core-shell nanoporous Pt-Cu catalyst with tunable composition and high catalytic activity. Adv. Funct. Mater. 2013, 23, 4156–4162. [Google Scholar] [CrossRef]
  34. Luo, M.; Wei, L.; Wang, F.; Han, K.; Zhu, H. Gram-Level Synthesis of Core–Shell Structured Catalysts for the Oxygen Reduction Reaction in Proton Exchange Membrane Fuel Cells. J. Power Sources 2014, 270, 34–41. [Google Scholar] [CrossRef]
  35. Cherevko, S.; Kulyk, N.; Mayrhofer, K.J.J. Durability of Platinum-Based Fuel Cell Electrocatalysts: Dissolution of Bulk and Nanoscale Platinum. Nano Energy 2016, 29, 275–298. [Google Scholar] [CrossRef]
  36. Stevens, D.A.; Hicks, M.T.; Haugen, G.M.; Dahn, J.R. Ex Situ and In Situ Stability Studies of PEMFC Catalysts: Effect of Carbon Type and Humidification on Degradation of the Carbon. J. Electrochem. Soc. 2005, 152, 2309–2315. [Google Scholar] [CrossRef]
  37. Đukić, T.; Moriau, L.J.; Pavko, L.; Kostelec, M.; Prokop, M.; Ruiz-Zepeda, F.; Šala, M.; Dražić, G.; Gatalo, M.; Hodnik, N. Understanding the Crucial Significance of the Temperature and Potential Window on the Stability of Carbon Supported Pt-Alloy Nanoparticles as Oxygen Reduction Reaction Electrocatalysts. ACS Catal. 2022, 12, 101–115. [Google Scholar] [CrossRef]
  38. Sadezky, H.A.; Muckenhuber, H.; Grothe, R.; Niessner, U. Pöschl Raman microspectroscopy of soot and related carbonaceous materials: Spectral analysis and structural information. Carbon 2005, 43, 1731–1742. [Google Scholar] [CrossRef]
  39. Serov, A.; Lubers, A.; McCool, G.; McKinney, S.; Romero, H.; Zulevi, B. VariporeTM: A Powerful Manufacturing Platform for Fuel Cell and Electrolyzer Applications. ECS Meet. Abstr. 2019, MA2019-02, 1734. [Google Scholar] [CrossRef]
  40. Ferrari, A.C.; Meyer, J.C.; Scardaci, V.; Casiraghi, C.; Lazzeri, M.; Mauri, F.; Piscanec, S.; Jiang, D.; Novoselov, K.S.; Roth, S.; et al. Raman Spectrum of Graphene and Graphene Layers. Phys. Rev. Lett. 2006, 97, 187401. [Google Scholar] [CrossRef] [PubMed] [Green Version]
  41. Leontyev, I.N.; Leontyeva, D.V.; Kuriganova, A.B.; Popov, Y.V.; Maslova, O.A.; Glebova, N.V.; Nechitailov, A.A.; Zelenina, N.K.; Tomasov, A.A.; Hennet, L. Characterization of the Electrocatalytic Activity of Carbon-Supported Platinum-Based Catalysts by Thermal Gravimetric Analysis. Mendeleev Commun. 2015, 25, 468–469. [Google Scholar] [CrossRef]
  42. Baturina, O.A.; Aubuchon, S.R.; Wynne, K.J. Thermal Stability in Air of Pt/C Catalysts and PEM Fuel Cell Catalyst Layers. Chem. Mater. 2006, 18, 1498–1504. [Google Scholar] [CrossRef]
  43. Guterman, V.E.; Belenov, S.V.; Krikov, V.V.; Vysochina, L.L.; Yohannes, W.; Tabachkova, N.Y.; Balakshina, E.N. Reasons for the Differences in the Kinetics of Thermal Oxidation of the Support in Pt/C Electrocatalysts. J. Phys. Chem. C 2014, 118, 23835–23844. [Google Scholar] [CrossRef]
  44. Ortíz-Herrera, J.C.; Tellez-Cruz, M.M.; Solorza-Feria, O.; Medina, D.I. Effect of Different Carbon Supports on the Activity of PtNi Bimetallic Catalysts toward the Oxygen Reduction. Catalysts 2022, 12, 477. [Google Scholar] [CrossRef]
  45. Banham, D.; Feng, F.; Fürstenhaupt, T.; Pei, K.; Ye, S.; Birss, V. Novel Mesoporous Carbon Supports for PEMFC Catalysts. Catalysts 2015, 5, 1046–1067. [Google Scholar] [CrossRef] [Green Version]
  46. Ayyubov, I.; Tálas, E.; Salmanzade, K.; Kuncser, A.; Pászti, Z.; Neațu, Ș.; Mirea, A.G.; Florea, M.; Tompos, A.; Borbáth, I. Electrocatalytic Properties of Mixed-Oxide-Containing Composite-Supported Platinum for Polymer Electrolyte Membrane (PEM) Fuel Cells. Materials 2022, 15, 3671. [Google Scholar] [CrossRef] [PubMed]
  47. He, Q.; Mukerjee, S. Electrocatalysis of oxygen reduction on carbon-supported PtCo catalysts prepared by water-in-oil micro-emulsion. Electrochim. Acta 2010, 55, 1709–1719. [Google Scholar] [CrossRef]
  48. Huang, J.; Ding, C.; Yang, Y.; Liu, G.; Cai, W. bin An Alternate Aqueous Phase Synthesis of the Pt3Co/C Catalyst towards Efficient Oxygen Reduction Reaction. Chin. J. Catal. 2019, 12, 40. [Google Scholar] [CrossRef]
  49. Hernández-Fernández, P.; Rojas, S.; Ocón, P.; de la Fuente, J.L.G.; Terreros, P.; Peña, M.A.; García-Fierro, J.L. An Opening Route to the Design of Cathode Materials for Fuel Cells Based on PtCo Nanoparticles. Appl. Catal. B 2007, 77, 19–28. [Google Scholar] [CrossRef]
  50. Koffi, R.C.; Coutanceau, C.; Garnier, E.; Léger, J.M.; Lamy, C. Synthesis, Characterization and Electrocatalytic Behaviour of Non-Alloyed PtCr Methanol Tolerant Nanoelectrocatalysts for the Oxygen Reduction Reaction (ORR). Electrochim. Acta 2005, 50, 4117–4127. [Google Scholar] [CrossRef]
  51. Alekseenko, A.A.; Guterman, V.E.; Volochaev, V.A. Microstructure Optimization of Pt/C Catalysts for PEMFC. In Springer Proceedings in Physics; Springer: Berlin/Heidelberg, Germany, 2016; Volume 175, pp. 37–49. [Google Scholar] [CrossRef]
  52. Garsany, Y.; Atkinson, R.W.; Gould, B.D.; Martin, R.; Dubau, L.; Chatenet, M.; Swider-Lyons, K.E. Dual-Layer Catalyst Layers for Increased Proton Exchange Membrane Fuel Cell Performance. J. Power Sources 2021, 514, 230574. [Google Scholar] [CrossRef]
  53. Favilla, P.C.; Acosta, J.J.; Schvezov, C.E.; Sercovich, D.J.; Collet-Lacoste, J.R. Size Control of Carbon-Supported Platinum Nanoparticles Made Using Polyol Method for Low Temperature Fuel Cells. Chem. Eng. Sci. 2013, 101, 27–34. [Google Scholar] [CrossRef]
  54. Gražulis, S.; Daškevič, A.; Merkys, A.; Chateigner, D.; Lutterotti, L.; Quirós, M.; Serebryanaya, N.R.; Moeck, P.; Downs, R.T.; le Bail, A. Crystallography Open Database (COD): An Open-Access Collection of Crystal Structures and Platform for World-Wide Collaboration. Nucleic Acids Res. 2012, 40, 420–427. [Google Scholar] [CrossRef] [Green Version]
  55. Klug, H.P.; Alexander, L.E. X-ray Diffraction Procedures from 376 Polycrystalline and Amorphous Materials; John Wiley: New York, NY, USA, 1974; Available online: https://ui.adsabs.harvard.edu/abs/1974xdpf.book.....K/abstract (accessed on 25 August 2022).
  56. Gao, J.; Mao, M.; Li, P.; Liu, R.; Song, H.; Sun, K.; Zhang, S. Segmentation and Re-Encapsulation of Porous PtCu Nanoparticles by Generated Carbon Shell for Enhanced Ethylene Glycol Oxidation and Oxygen-Reduction Reaction. ACS Appl. Mater. Interfaces 2020, 12, 6298–6308. [Google Scholar] [CrossRef] [PubMed]
  57. Shinozaki, K.; Zack, J.W.; Pylypenko, S.; Pivovar, B.S.; Kocha, S.S. Oxygen reduction reaction measurements on platinum electrocatalysts utilizing rotating disk electrode technique: II.Influence of ink formulation, catalyst layer uniformity and thickness. J. Electrochem. Soc. 2015, 162, 1384–1396. [Google Scholar] [CrossRef]
  58. Hyun, K.; Lee, J.H.; Yoon, C.W.; Kwon, Y. The effect of platinum based bimetallic electrocatalysts on oxygen reduction reaction of proton exchange membrane fuel cells. Int. J. Electrochem. Sci. 2013, 8, 11752–11767. Available online: http://electrochemsci.org/papers/vol8/81011752.pdf (accessed on 25 August 2022).
  59. Forouzandeh, F.; Li, X.; Banham, D.W.; Feng, F.; Ye, S.; Birss, V. Understanding the Corrosion Resistance of Meso- and Micro-Porous Carbons for Application in PEM Fuel Cells. J. Electrochem. Soc. 2018, 165, 3230–3240. [Google Scholar] [CrossRef]
Figure 1. XRD patterns (a) and Raman spectroscopy (b) of carbon support.
Catalysts 12 01179 g001
Figure 2. (a) Average corrosion gravimetric charges adjusted for ESA and (b) CVs of activated carbon support before and after ADT. Electrolyte is 0.1 M HClO4, atmosphere of Ar, and T = 60 °C. The potential sweep rate is 20 mVs−1.
Catalysts 12 01179 g002
Figure 3. XRD patterns of Pt/C materials.
Catalysts 12 01179 g003
Figure 4. TEM micrographs of Pt/C catalysts: (a,b) G1 and (c,d) G2, and histograms of the NP size distribution in the corresponding materials.
Catalysts 12 01179 g004
Figure 5. (a) TGA and (b) DSC curves of Pt/C catalysts and Vulcan and ECS oxidations.
Catalysts 12 01179 g005
Figure 6. (a) CVs of Pt/C catalysts, two cycles, Ar − atmosphere; (b) LSV curves for ORR of Pt/C, 1600 rpm, O2 − atmosphere. The potential scan rate is 20 mVs−1, the electrolyte is 0.1 M HClO4, and T; = 60 °C.
Catalysts 12 01179 g006
Figure 7. 2 CVs of Pt/C catalysts before and after different ADT protocols: (a) 0.4 and 0.7 V; (b) 0.4 and 1.0 V; (c) 0.4 and 1.2 V; and (d) 0.4 and 1.4 V. The potential scan rate is 20 mVs−1, the electrolyte is 0.1 M HClO4, and T = 60 °C.
Catalysts 12 01179 g007
Figure 8. LSV curves for ORR of Pt/C before and after different ADT protocols: (a) 0.4 and 0.7 V; (b) 0.4 and 1.0 V; (c) 0.4 and 1.2 V; and (d) 0.4 and 1.4 V, 1600 rpm, O2 − atmosphere. The potential scan rate is 20 mVs−1, the electrolyte is 0.1 M HClO4, and T = 60 °C.
Catalysts 12 01179 g008
Figure 9. Diagrams of the amount of electricity passed for every 200 cycles during the entire stress test to different ADT protocols: (a) 0.4 and 0.7 V; (b) 0.4 and 1.0 V; (c) 0.4 and 1.2 V; and (d) 0.4 and 1.4 V.
Catalysts 12 01179 g009
Figure 10. TEM micrographs of Pt/C catalysts after ADT at the potentials of 0.4 and 1.4: (a,b) G1and (c,d) G2, and histograms of the NP size distribution before and after ADT in the corresponding materials.
Catalysts 12 01179 g010
Table 1. Composition, structure, and electrochemical characteristics of Pt/C catalysts.
SampleCarbon SupportPt-Loading,
wt. %
Average Crystallites Diameter, DAv, nm (XRD)Average NPs Size, DAv, nm (TEM)ESA, m2 g−1 (Pt)E1/2,
V
Number of ē
(E = 0.85 V)
Imass, Ag−1 (Pt)
(E = 0.85 V)
Isp, Am−2 (Pt)
(E = 0.85 V)
Tafel Slope, mV/dec
G1ECS393.23.71300.904.04793.763.6
G2Vulcan XC-72392.64.2500.883.82795.642.2
Table 2. Characteristics of Pt/C catalysts after ADT in different potential ranges.
SampleESA, m2g−1(Pt)Durability, %E1/2,VNumber of ē
(E = 0.85 V)
Imass, Ag−1 (Pt)
(E = 0.85 V)
Isp, A m−2 (Pt)
(E = 0.85 V)
Tafel Slope, mV/dec
ADT potentials 0.4 and 0.7 V
G1125950.904.04593.758.1
G249980.863.82384.854.6
ADT potentials 0.4 and 1.0 V
G1118910.903.93893.366.2
G245960.833.71884.252.0
ADT potentials 0.4 and 1.2 V
G198750.893.93803.959.4
G244880.853.71824.153.5
ADT potentials 0.4 and 1.4 V
G173560.873.71652.354.2
G230600.823.61454.848.9
Publisher’s Note: MDPI stays neutral with regard to jurisdictional claims in published maps and institutional affiliations.