Abstract
Different transition metals (Cr/Fe/Mn/Co) derived catalysts supported on γ-Al2O3 were prepared by the isovolumetric impregnation method for catalytic ozonation of acetone (C3H6O), and their catalytic activities under industrial complex conditions were investigated. Among them, CrOx/γ-Al2O3 catalyst with Cr loading of 1.5%, abbreviated as Cr1.5%, achieved the best activity, benefitting from its larger surface area, larger proportion of Cr6+/Cr, more chemically desorbed oxygen species Oβ, appropriate acidity, and superiority of low-temperature reducibility. Simulated industrial conditions were used to investigate the applicability of Cr1.5% catalysts for catalytic ozonation of acetone. Results illustrated that the optimum temperature range was 120–140 °C, with molar ratio O3/C3H6O > 6. Different C3H6O initial concentrations had less effect over the activity of Cr1.5% catalysts, with little residual ozone, confirming the applicability of Cr1.5% catalysts in industrial application. The effects of sulfur/water vapor on catalytic activity were also investigated, and satisfactory resistance to sulfur or water vapor individually was obtained. Finally, in-situ DRIFTS measurement was carried out, to explore and illustrate mechanisms of acetone catalytic ozonation pathways and sulfur/water poisoning.
1. Introduction
As a kind of air pollutants, volatile organic compounds (VOCs) are considered crucial precursors of fine particle matter (PM2.5) and ozone, which could form toxic photochemical smog through complex atmospheric photochemical reactions [1,2,3]. The increasing emission of VOCs causes serious environmental and ecological problems. Most VOCs are emitted from industrial processes like chemical engineering, petroleum refining, coal-fired power engineering, mainly containing acetone, benzene series, acetaldehyde, dichloromethane, ethyl acetate, etc. [4]. Acetone, C3H6O, one of the typical volatile organic pollutants, widely used in plastic, fibers, pharmaceuticals, semiconductors and photoelectric industries as a common organic solvent [5], has a pernicious impact on atmospheric quality and chronic toxicity to human beings [4,6].
VOC control technologies mainly include catalytic oxidation, condensation, absorption, adsorption and membrane separation technology [3]. Among those, cellulose-metal organic frameworks (CelloMOFs) and other new composite materials were proposed and applied as filters for VOCs adsorption removal [7], but their material preparation process was complex and expensive, and it also needed to regenerate the adsorption materials, which undoubtedly increased the difficulty of their application. Catalytic oxidation is one of the most effective treatment methods to degrade low-concentration VOCs into CO2 and water or nontoxic compounds [3]. Its working temperature is usually in the range of 370–480 °C [8]. Low temperature catalytic oxidation usually utilizes effective catalysts to reduce activation energy and improve chemical reaction rate [8]. Moreover, the introduction of ozone can further reduce the needed reaction temperature and greatly accelerate the reaction rate, leading to carbon products, e.g., CO2 [9,10]. The performance of acetone catalytic ozonation is closely related to activity of the catalyst, which is concurrently affected by active metal phases, supports, lattice defects, preparation methods and preparation conditions, resistance, etc. [3]. Different catalyst supports will affect structural characteristics, thus affecting the catalytic activity of the catalyst. Oyama et al. [10] investigated manganese oxide loaded with alumina/silica for acetone catalytic ozonation, and the results illustrated that catalysts supported by alumina had higher activity and turnover frequencies (TOFs) than silica. Different active components of catalysts also have significant effects on the adsorption performance and reaction activity. Transition metals gradually became a research hotspot as active components of catalysts because of their low cost, high catalytic activity and stability, among which, Cr2O3, MnO2 and Co3O4 were found to be relatively more active for VOCs oxidation [11]. Chromium oxides-based catalysts possess rich surface acidity, satisfactory oxygen adsorption ability, and especially strong oxidizing ability of Cr6+ [12]. Many studies have carried out acetone oxidation processes, and the efficiency can reach over 90% in the temperature range of 200–300 °C. In addition, many researchers explored the reaction mechanism and revealed the reaction path of acetone degradation with conditions of catalytic oxidation/ozonation. The complete oxidation pathway of acetone on 0.57 wt.% CeO2-0.05 wt.% Pt/TiO2 catalyst was summarized by Wang et al. [13] as follows: the adsorbed acetone molecules were firstly transformed into acetic acid and formic acid, then carbonate species was formed, and finally decomposed into H2O and CO2. Li et al. [14] characterized and quantified the organic by-products produced in oxidation of acetone, and analyzed the reaction mechanism in a dielectric barrier discharge (DBD) reactor in detail [14]: firstly, acetone molecules were broken to form methyl radicals, acetyl groups and H atoms, then the methyl radicals and acetyl radicals were oxidized by O or OH radicals to produce acetaldehydes, methanol and other compounds. Acetaldehydes were the main intermediates produced by acetone oxidation, and then decomposed into other compounds, such as acetic acid and formaldehyde [14].
However, there were relatively fewer studies focusing on acetone catalytic ozonation processes under complex industrial conditions [15,16,17]. Especially, no research was found on sulfur resistance, although SO2 was always present in flue gas. In this paper, an acetone removal process under low-temperature conditions with the assistance of catalytic ozonation was conducted, with its activity explored, as well as sulfur/water vapor resistance ability.
2. Results and Discussion
2.1. Activity Evaluation of Different Metal Oxides Catalysts
A range of catalysts supported on γ-Al2O3 with different active components of transition metal oxides were prepared, and their performances for acetone catalytic ozonation were investigated and compared. The trends of catalytic activities over four different catalysts at 120 °C for 180 min were tested, with results shown in Figure 1a. The conversion efficiency of C3H6O over Co1.5% catalyst was unsatisfactory, only achieving ~70% degradation. However, the other three catalysts showed good performance, with conversion efficiencies over 85% during the 180-min period. The performance sequence of the selected four catalysts was as follows: Cr1.5% > Fe1.5% > Mn1.5% > Co1.5%. However, the Cr1.5% and Fe1.5% showed slightly deactivated activity at the end of the 180 min testing, while the Mn1.5% and Co1.5% showed steady performances. As reported by M. Xiao et al. [18], chromia catalysts showed great activity for VOCs removal, but the active Cr of the catalysts would gradually lose effectiveness during the reaction, which would affect the stability of those catalysts, consistent with the finding of this study as shown in Figure 1a. However, activity over the best-performing catalyst of Cr1.5% was maintained above 90% over 180 min.
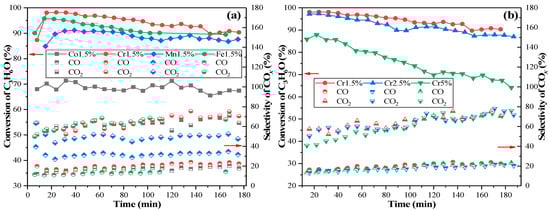
Figure 1.
The C3H6O ozonation conversion efficiencies with different catalysts. (a) four catalysts with different active components of transition metal oxides; (b) CrOx/γ-Al2O3 catalysts with different Cr loadings. (C3H6O initial concentration: 30 ppm, O3 initial concentration: 240 ppm, temperature: 120 °C).
Catalysts with different Cr loadings were prepared and tested to investigate the relationship between conversion efficiency of C3H6O and Cr metal loadings, as shown in Figure 1b. As can be seen, the CrOx/γ-Al2O3 with 1.5% Cr loading showed the best performance in catalytic ozonation of acetone, followed by Cr2.5% and Cr5%. It seemed catalysts with higher Cr loading in the range of 1.5~5% had lower activity for acetone decomposition, which can be ascribed to changing of surface area, dispersion degree of CrOx, oxidation valence states, and chemically adsorbed oxygen species amounts. Among the three Cr loading catalysts, the most active one, Cr1.5%, was chosen to be the target catalyst for the next experimental tests. A summary and comparison of catalysts prepared in this paper with previously published catalysts for acetone ozonation are shown in Table 1.

Table 1.
Summary and comparison of catalysts for acetone ozonation.
2.2. Catalyst Characterization Analysis
2.2.1. Crystalline Structures
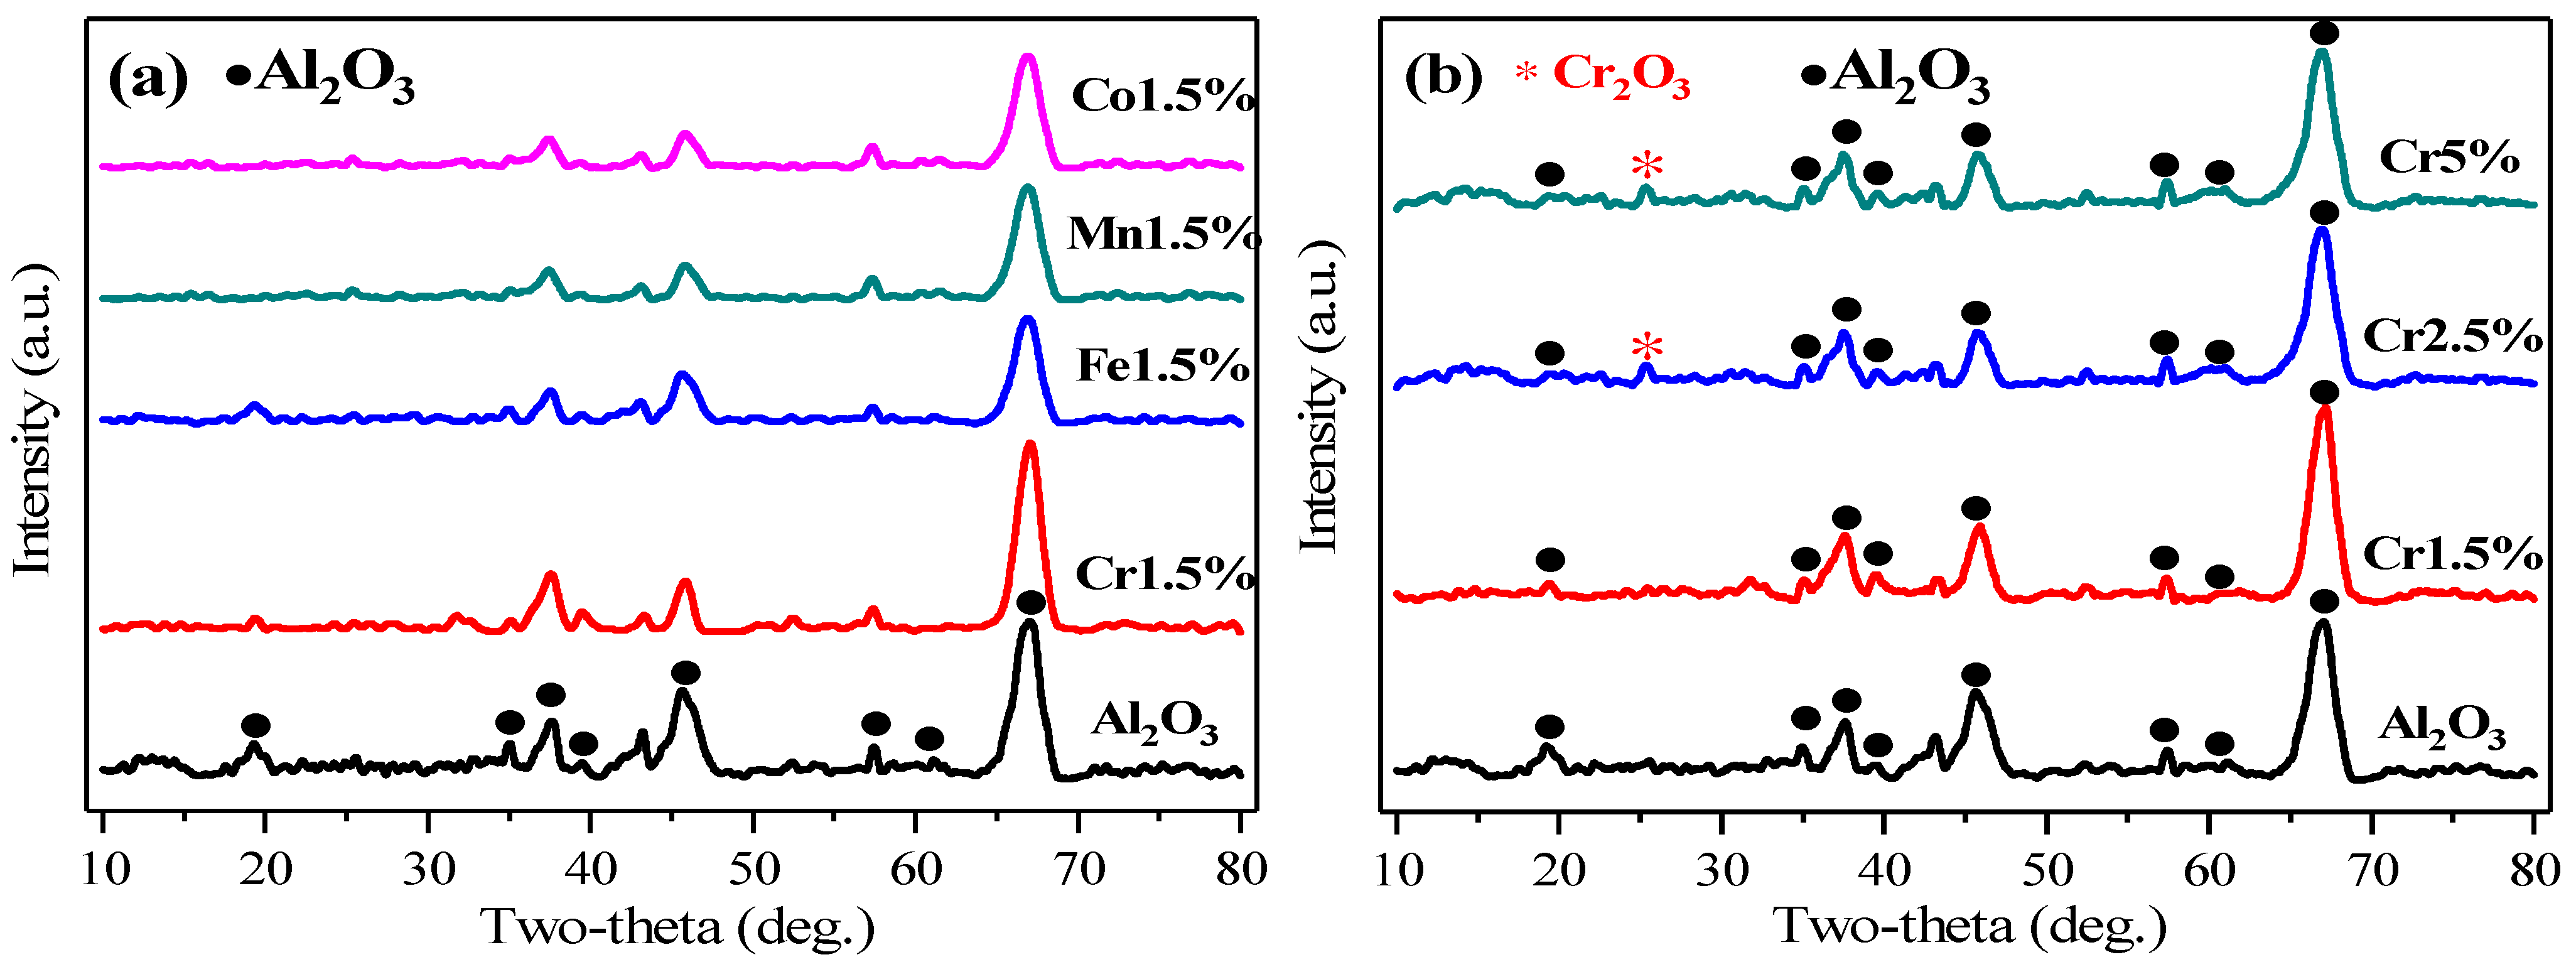
The crystalline structures of prepared catalysts were obtained by XRD characterization, as shown in Figure 2. From Figure 2a, Cr1.5%, Fe1.5%, Mn1.5%, Co1.5% catalysts exhibited similar crystalline structures to the γ-Al2O3 support, with peaks at 37.7°, 45.8°, 66.8° respectively referring to (3 1 1), (4 0 0), (4 4 0) three facets of γ-Al2O3, according to PDF#79-1558 from Jade 6 software. According to PDF#79-1558, the crystalline structure of Al2O3 belonged to the cubic crystal system, and the space group was Fd-3m (227), with lattice parameters of a = b = c = 0.7911 nm. The characterization results showed that the metallic oxides MOx (M = Cr/Fe/Mn/Co) dispersed quite evenly or were doped into γ-Al2O3 lattice, without any obvious crystallization. Through cell refinement processing by Jade 6 software, the lattice parameters of prepared support γ-Al2O3 were calculated as a = b = c = 0.7902 nm. For Cr1.5%, Fe1.5%, Mn1.5%, Co1.5%, the parameters declined to 0.7888 nm, 0.7895 nm, 0.7891 nm, and 0.7901 nm, respectively, because of slight weakening or distortion of original γ-Al2O3 structures by calcination or impregnation with metals [19]. The particle sizes of γ-Al2O3, Cr1.5%, Fe1.5%, Mn1.5%, Co1.5% were 5.8 nm, 5.4 nm, 5.2 nm, 5.2 nm, 5.4 nm, which were calculated by the Scherrer equation using the strongest peak at 67.8° (4 4 0). Based on the data above, listed in Table 2, it might be inferred that the growth of crystals of γ-Al2O3 was inhibited slightly after impregnation with metals [19]. With the active component metals doped into γ-Al2O3, the peaks at 19.4°, 45.8° and 66.8°, respectively, referring to the (1 1 1), (4 0 0) and (4 4 0) facets of γ-Al2O3, turned weaker, as shown in Figure 2a, which illustrated that the crystallinities became weakened or the structures of original support from the γ-Al2O3 were destroyed, indicating the interaction between metal oxides and supports. In the Fe1.5%, Mn1.5%, Co1.5% catalysts, all diffraction peaks showed as being weaker than γ-Al2O3 with Cr1.5%, which might indicate stronger metal-support interactions, but catalytic activities of those three catalysts were not as satisfactory as Cr1.5%. It could be inferred that the type of active component metal was more dominant than the metal interaction in the catalytic activity performances.

Figure 2.
XRD patterns of different catalysts. (a) γ-Al2O3, MOx/γ-Al2O3 (M = Cr/Fe/Mn/Co); (b) γ-Al2O3, Cr1.5~5%.
Table 2.
Crystallite phases and sizes of Al2O3 in catalysts.
In Figure 2b, there was one different peak that appeared, at 25.5°, which referred to the (0 1 2) facet of Cr2O3 (PDF#87-0711). As mentioned above, through cell refinement processing, the lattice parameters of Cr2.5% and Cr5% were confirmed as 0.7892 nm and 0.7896 nm, respectively, close to that of Cr1.5%, and slightly smaller than that of the γ-Al2O3 support. The particle sizes of these two catalysts were 4.8 nm and 5.4 nm, also calculated by the Scherrer equation using the strongest peak at 67.8° (4 4 0), as shown in Table 2. Furthermore, the Cr mass content of CrOx/γ-Al2O3 catalysts was more, and the intensity of the Cr2O3 peak was higher in three CrOx/γ-Al2O3 catalysts, with the peaks at 19.4° and 45.8° getting weaker, respectively, referring to the (1 1 1) and (4 0 0) facets of Al2O3, and implying the reduction of crystallinity, as shown in Figure 2b. In Cr5% catalysts, the peak at 25.5° showed the highest intensity, demonstrating the largest Cr2O3 crystallization and an uneven distribution on the catalyst surfaces, which may be ascribed to the larger particle size of Cr2O3 or Cr2O3 in reunion. For Cr1.5%, with a lower content of Cr element, there was no obvious diffraction peak of Cr2O3, which may result from the even distribution of a small am of CrOx on the catalyst surfaces, or the particle size being below the detector limit of XRD.
Among the three CrOx/γ-Al2O3 catalysts, the weaker peak in Cr1.5% meant the reduced crystallinity of Cr2O3, inferring the stronger metal interaction, which corresponded to its higher catalytic activity of Cr1.5% of Figure 1b. The particle sizes of Cr2O3 in three CrOx/γ-Al2O3 catalysts were also calculated, as follows: Cr5% (11.9 nm) > Cr2.5% (6.8 nm) > Cr1.5% (5.4 nm), as shown in Table 3. The particle size for the 25.5° peak, (0 1 2) facet of Cr2O3, increased with the increase of element mass fractions from 1.5~5%, which meant a lower degree of crystallization in Cr1.5%, corresponding to its higher catalytic activity [20].
Table 3.
Crystallite phases, sizes of Cr2O3 in CrOx/γ-Al2O3 catalysts.
2.2.2. Textural Properties
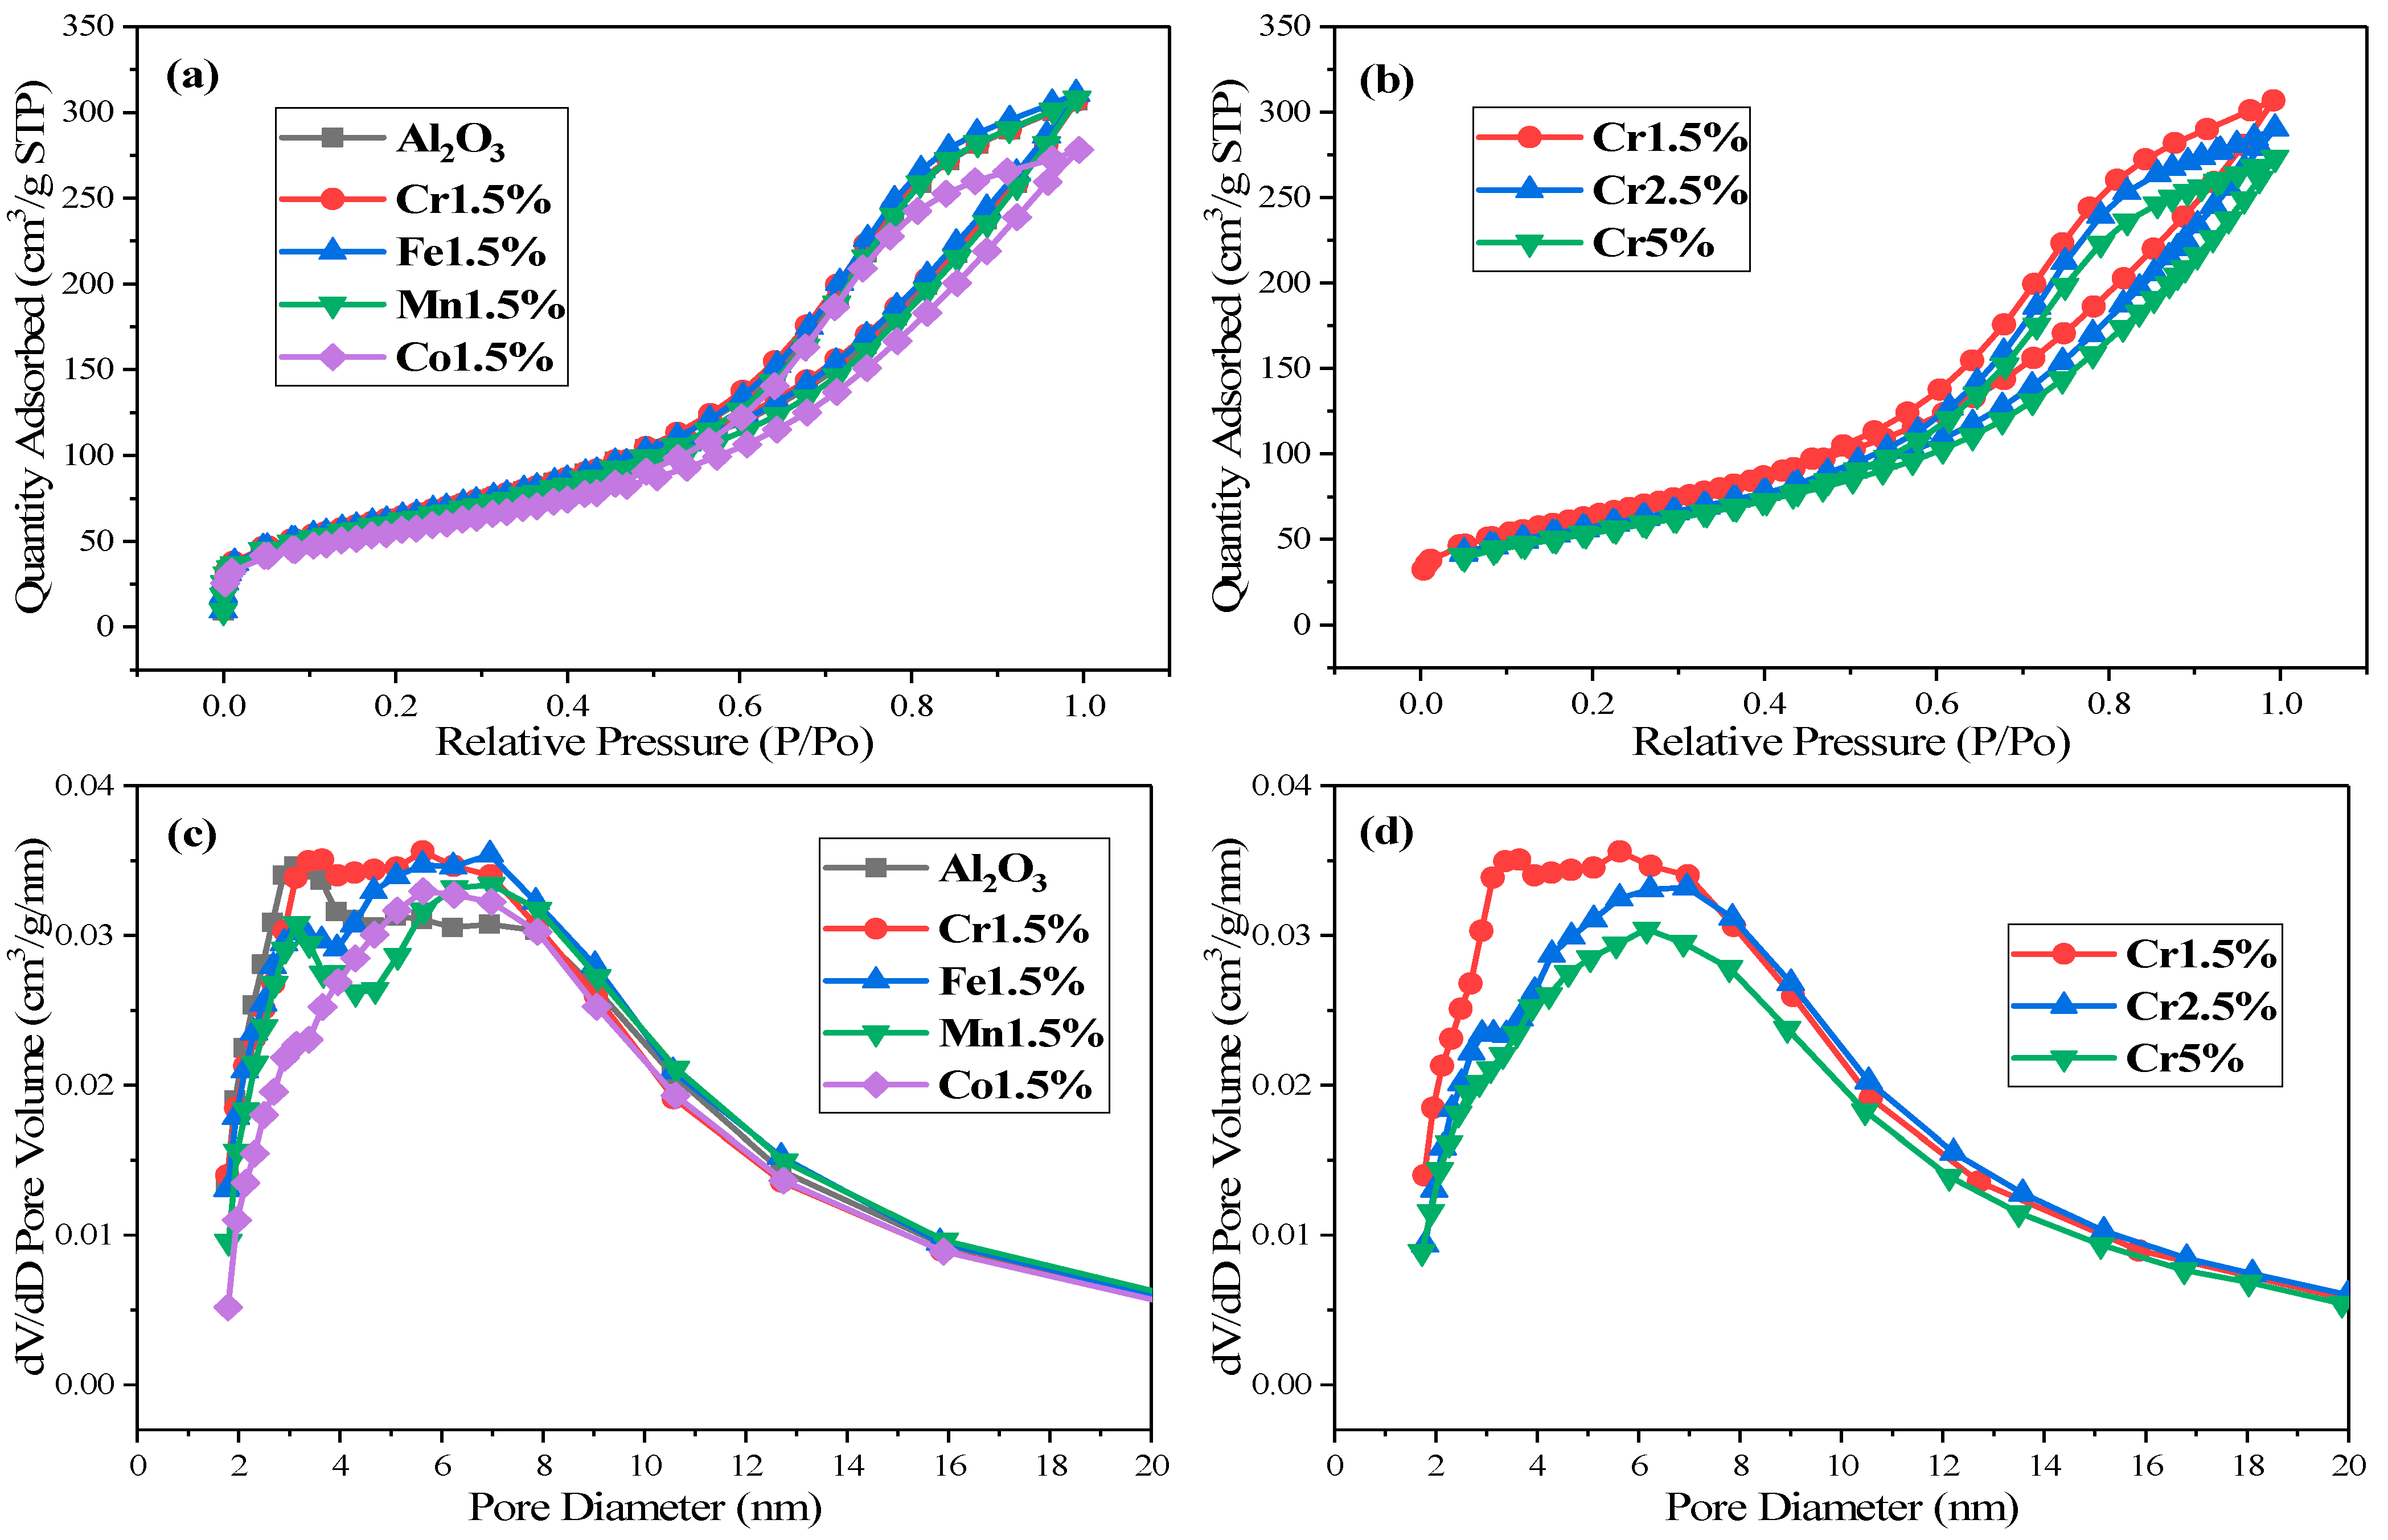
The N2 adsorption-desorption isotherms and pore size distribution curves were applied to describe the textural properties of the catalysts, as shown in Figure 3. It can be seen from Figure 3a,b that the isotherms of the catalysts all were typical type Ⅳ isotherms with type H3 hysteresis loops, according to IUPAC [19,21], indicating slit-shaped mesoporous structures. Specifically, the adsorption abilities of support Al2O3, Cr1.5%, Fe1.5%, Mn1.5% turned out to be similar, but stronger than Co1.5% separately, as shown in Figure 3a, which was consistent with the performance sequence of the four investigated catalysts. The Co1.5% showed unsatisfactory performance in catalytic acetone conversion compared to the other three catalysts, which might result from its lower adsorption ability.

Figure 3.
The N2 adsorption/desorption isotherms of different catalysts. (a) γ-Al2O3, MOx/γ-Al2O3 (M = Cr/Fe/Mn/Co); (b) Cr1.5~5%; and pore size distribution curves of (c) γ-Al2O3, MOx/γ-Al2O3 (M = Cr/Fe/Mn/Co); (d) Cr1.5~5%.
In a similar phenomenon exhibited in Figure 3b, the adsorption abilities of CrOx/γ-Al2O3 catalysts were decreased with the increase of the mass fraction of Cr element, which also showed a similar trend to that of catalytic activity. As listed in Table 4, the surface area and pore volume of support Al2O3, Cr1.5%, Fe1.5%, Mn1.5% were similar, larger than those two of Co1.5%, respectively. The surface area and pore volume of CrOx/γ-Al2O3 catalysts were decreased with the increase of Cr mass fraction, which may be ascribed to the blockage of the support pore channel [12]. It was reported that higher values of surface area and pore volume could provide more active sites to improve the adsorption ability and diffuse gaseous reactants better, making it easier to get access to catalytic active sites [19,22].
Table 4.
Textural properties of MOx/γ-Al2O3 (M = Cr/Fe/Mn/Co) catalysts.
As for average pore diameter, Mn1.5% and Co1.5% possessed larger pore diameter, as well as Cr2.5% and Cr5% (Figure 3c,d). It could be deduced that the catalysts with larger pores had worse catalytic activity, which might be influenced by the collapse of mesoporous active sites or aggregation in catalysts [22,23,24]. In summary, textural properties had an influence on catalytic activity, but not the major one. The major influence factors on catalytic activity superiority of Cr1.5% compared to others needed further investigation and analysis.
2.2.3. Surface Properties
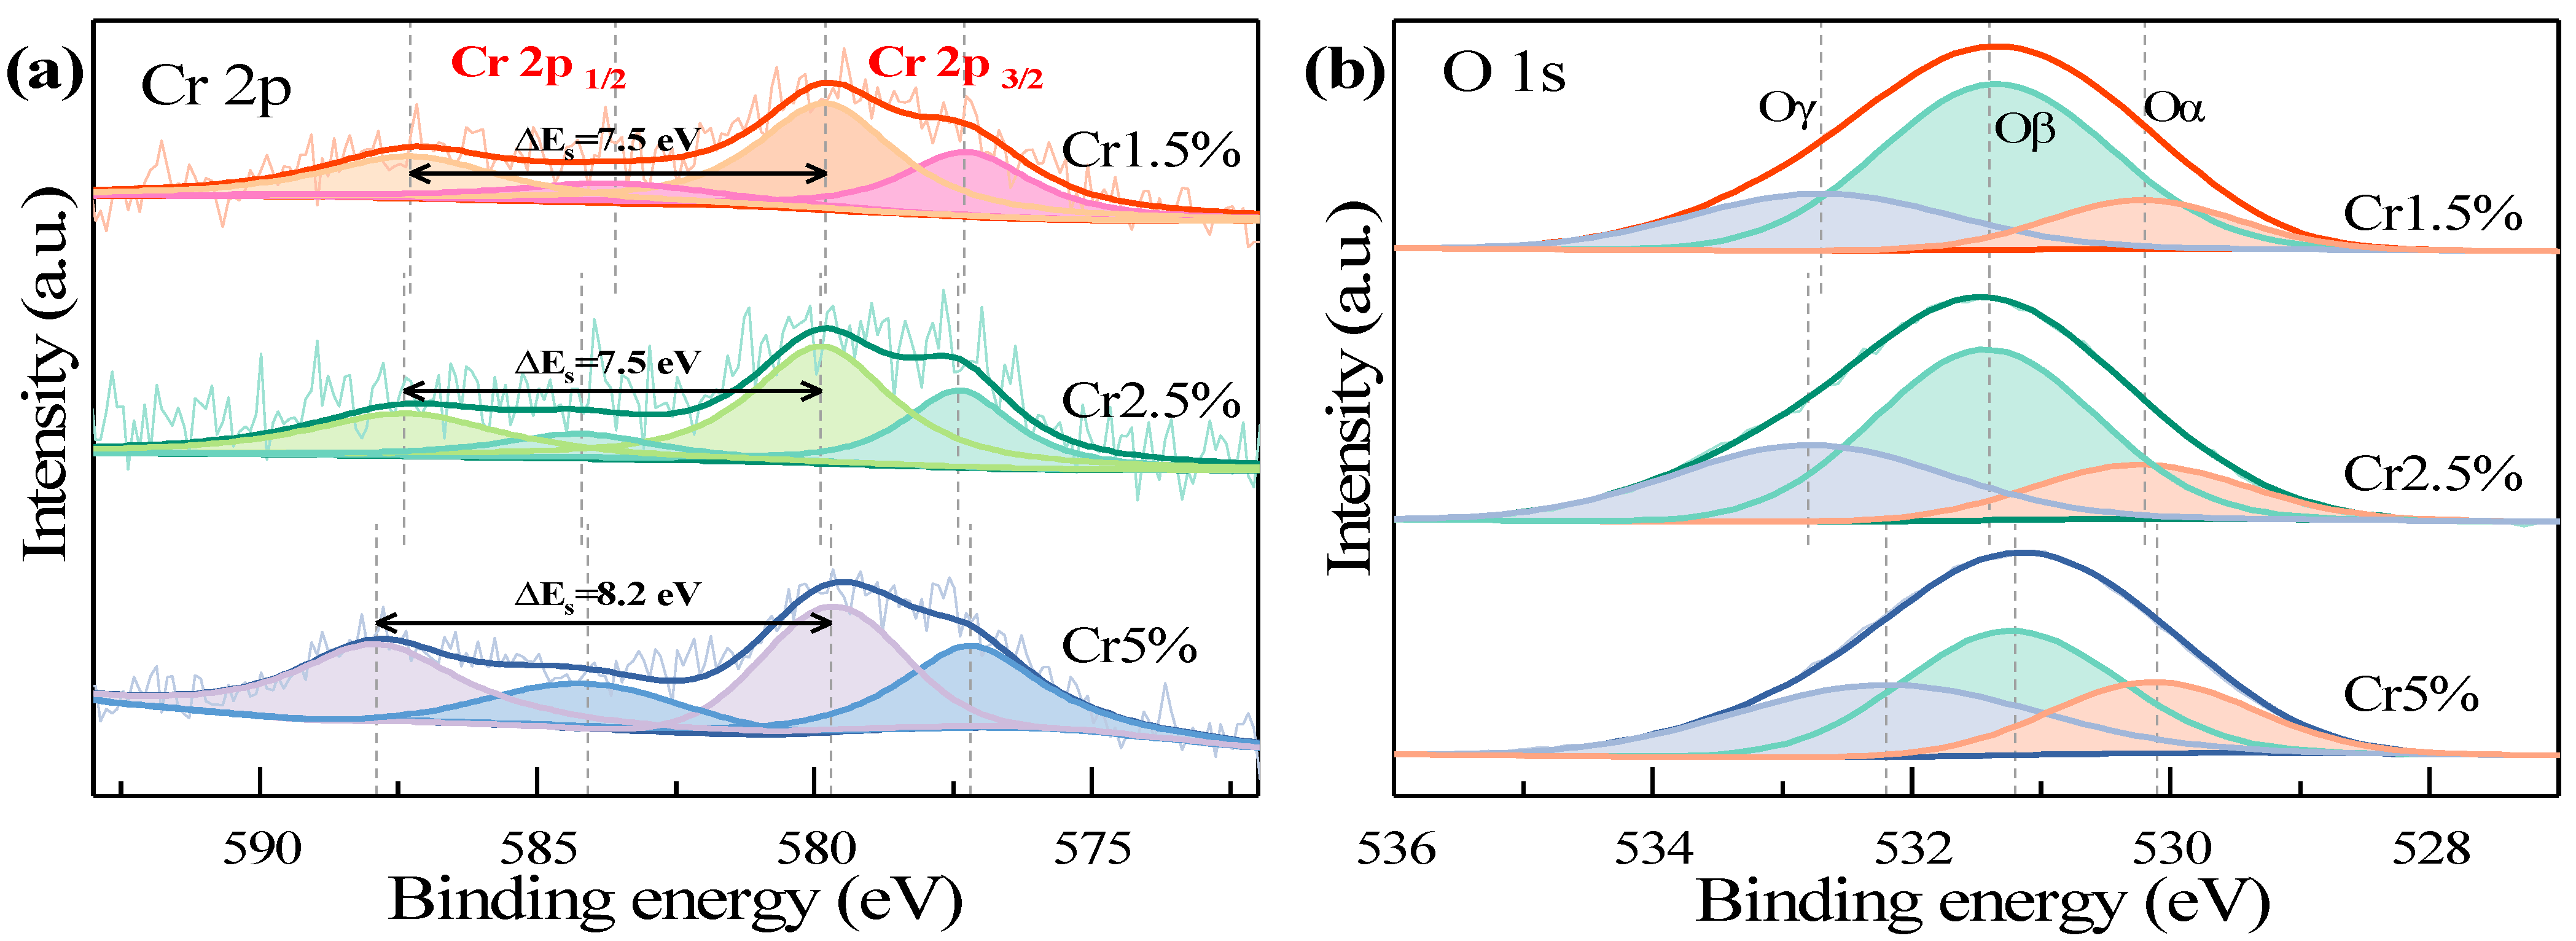
Surface properties of the three CrOx/Al2O3 catalysts were obtained by XPS characterization technology, with spectra exhibited in Figure 4. In Figure 4a, Cr 2p peaks included two parts, Cr 2p 3/2 and Cr 2p 1/2, at ~577.4 eV and ~587.2 eV [12,25]. The Cr 2p 3/2 peak was deconvoluted into two peaks by XPS PEAK 41 software, located at 576.9~577.1 eV and 579.4~579.6 eV, which respectively referred to Cr3+ and Cr6+ [11,12]. Correspondingly, the peak of Cr 2p 1/2 was deconvoluted into peaks at 583.3~584.0 eV (Cr3+) and 587.0~587.6 eV (Cr6+) [11,12]. It was reported that Cr6+ possessed better redox abilities than Cr3+, which was therefore more favorable to deep oxidation of VOCs [12,26,27,28]. Based on early findings [12,28,29], the loading of chromia catalysts was larger, the formation of crystallization Cr2O3 was easier, which may relate to the hydroxyl groups on the catalyst surfaces.

Figure 4.
The Cr 2p and O 1s spectra of the Cr1.5~5% catalysts. (a) Cr 2p; (b) O 1s.
The oxidation state distributions of those chromia catalysts are listed in Table 5, from which can be seen that the Cr6+/Cr of Cr5% was the least, and those of Cr1.5% and Cr2.5% were similar, which was consistent with sequence of the activity efficiencies above those three chromia catalysts. This finding was consistent with that described by Su et al. [12]. From another aspect in Figure 4a, ΔEs, the binding energy difference between two Cr6+ peaks, was calculated. It was found that the ΔEs of Cr5%, 8.2 eV, was larger than those of Cr1.5% and Cr2.5%, 7.5 eV. Thus, it could be deduced that the AOS (average oxidation state) of Cr1.5% and Cr2.5% was larger than that of Cr5%, and more beneficial to oxidation of VOCs, as a cross-reference of the proportions of Cr6+ in Table 5.
Table 5.
Distributions of chromium and oxygen species.
From the O 1s spectra in Figure 4b, three peaks were observed after deconvolution, which were located at 529.9, 531.2, 532.5 eV, referring to Oα, Oβ, Oγ, respectively. According to published literature [22,25,30], the deconvoluted peak Oα of O 1s scans at ~530 eV implies the existence of lattice oxygen, the sharper peak Oβ at ~531 eV the presence of chemically adsorbed oxygen species (O−, O2−, O2−, O22−), and the peak Oγ at ~532 eV the presence of adsorbed water species (H2O or OH-) or carbonates [20,31]. Further, the existence of Oβ implied the adsorption of gaseous O2 into oxygen vacancies as active sites, with higher mobility than Oα, which had a significant influence on catalytic activities [22,32,33,34]. Figure 4b showed that Cr1.5% possessed the largest peak area of Oβ peak at ~531 eV in three chromia catalysts, while Cr5% showed the smallest peak area, which meant the distributions of Oβ on the surfaces of the catalysts followed the sequence: Cr1.5% > Cr2.5% > Cr5%, as shown in Table 5, consistent with the sequence of catalytic activity efficiency.
It could be deduced that the surface chemically adsorbed oxygen species played a dominant role in catalytic ozonation activities of chromia catalysts, resulting from the formation of more active surface oxygen vacancies as active sites by oxygen mobility on Cr1.5% catalysts [22,32,33]. It was also observed that three peaks, Oα, Oβ and Oγ, of Cr1.5% and Cr2.5% were shifted towards higher binding energy, which indicated the lower electron density, the weaker bond strength and the stronger mobility of Cr1.5% and Cr2.5% compared to Cr5% catalysts, making it easier to attract electrons from acetone and eventually leading to higher catalytic activities of those two low-loading chromia catalysts [19,35].
2.2.4. Temperature Programmed Studies
Temperature programmed studies are shown in Supplementary Materials.
Based on the multiple characterization results analyzed above, a conclusion was drawn that the highest catalytic activity of Cr1.5% may be ascribed to the combination of factors, such as lower crystallization degree, higher surface area and pore volume, higher Cr6+ proportion, more chemically desorbed oxygen species, appropriate acidity, and superiority of low-temperature reducibility [12].
2.3. Effects of Temperature, C3H6O Concentration and O3/C3H6O Molar Ratio
From the previous experiment results, slight deactivation over CrOx/γ-Al2O3 catalysts existed even under a temperature of 120 °C, and was deduced to be more severe at room temperature. It was speculated that reaction temperature was a significant influential factor in conversion efficiency trend of acetone, which was measured and validated over Cr1.5% catalysts. As shown in Figure 5a, overall, the conversion efficiency of C3H6O increased evidently with the increase of reaction temperature from 40 °C to 140 °C. When the reaction temperature was above 100 °C, the conversion efficiency of C3H6O was maintained above 80% for 180 min, suggesting improvement under higher temperatures. Under the temperature range 120~140 °C, the Cr1.5% catalysts showed better activity and stability, maintaining above 90% activity during 180 min, with a slight trend of deactivation. However, the performance of catalysts under low temperatures became unsatisfactory, attributed to the accumulation of byproducts on the Cr1.5% surface that was generated from the incomplete oxidation reaction of acetone, which could be improved by increasing the reaction temperature. However, raising reaction temperatures too high might be counterproductive. It was reported [22,36] that higher temperatures would accelerate the decomposition rate of ozone, causing less surface oxygen species for catalytic ozonation of VOCs. Thus, it was crucial to investigate the best temperature range for catalytic ozonation of VOCs in industrial application, which was 120~140 °C of acetone catalytic ozonation over Cr1.5%, according to the conclusion in this chapter.

Figure 5.
The C3H6O conversion efficiencies over Cr1.5% catalysts. (a) different temperatures; (b) different C3H6O initial concentrations; (c) different O3/C3H6O molar ratios. (d) C3H6O and O3 conversion efficiencies and residual ozone under different O3/C3H6O molar ratios.
The effect of C3H6O initial concentrations on the conversion efficiency of C3H6O was also investigated by changing C3H6O initial concentrations at 120 °C with the O3/C3H6O molar ratio remaining constant, results shown in Figure 5b. As seen, when C3H6O initial concentration was relatively lower, the decreasing trend of C3H6O conversion efficiency was somewhat alleviated, compared to the conditions of higher C3H6O initial concentrations. The above phenomenon can be attributed to more byproducts accumulated on the surface of catalysts under conditions of higher C3H6O initial concentrations, which caused more severe deactivation of Cr1.5% catalysts in the experiments. Overall, under all conditions of different C3H6O initial concentrations from 10 ppm to 50 ppm, the conversion efficiencies of C3H6O were sustained above 90% for 150 min. This also demonstrated that catalytic ozonation of acetone by using Cr1.5% catalysts could adapt to the fluctuation of C3H6O initial concentrations in industrial waste gas and maintain quite high removal efficiencies of acetone, under conditions of temperature 120 °C, O3/C3H6O = 8.
The increase of O3 initial concentrations could contribute to the increase of active oxygen species on the surface of Cr1.5% catalysts, such as O atoms and OH radicals, which could further oxidize unreacted C3H6O to improve the conversion efficiency. Under temperature 120 °C, C3H6O initial concentration of 30 ppm, the effect of different O3/C3H6O molar ratios on catalytic activities over Cr1.5% was investigated by changing O3 initial concentrations from 120 ppm to 360 ppm, as shown in Figure 5c. The conversion efficiency of C3H6O accordingly increased with the increase of O3/C3H6O molar ratios; meanwhile, the deactivation of catalysts had been alleviated. When the O3/C3H6O molar ratio was above 6, the conversion efficiency of C3H6O reached 90% and was maintained for 180 min, and the deactivation phenomenon of catalysts almost disappeared as the molar ratio increased. This experimental phenomenon could be ascribed to the vital influence of highly active oxygen species during VOCs ozonation removal, which can be generated from O3 decomposition on the catalyst surface [37,38]. Under conditions of higher O3 concentration, more active oxygen atoms were generated from ozone decomposition, which would be conducive to improving the removal efficiency of acetone. It can be seen from the results in Figure 5c that the O3/C3H6O molar ratio should be above 6, to keep the conversion efficiency of acetone maintaining more than 90%.
The problems of residual ozone and escape of ozone in catalytic ozonation technology are always obstacles and worries for industrial applications. The residual ozone concentrations were measured through experiments under different O3/C3H6O molar ratios, by changing O3 initial concentrations, shown in Figure 5d. From the viewpoint of residual ozone concentrations in Figure 5d, when the O3/C3H6O molar ratio was 6, the decomposition efficiency of ozone was close to 100%, without ozone residue. When the O3/C3H6O molar ratio was 8~10, the decomposition efficiency of ozone declined to about 90%, and the residual ozone concentration was found to be around 5 ppm. This provided an experimental basis for the industrial application of catalytic ozonation to remove VOCs and alleviated worries of ozone residue, to some extent.
2.4. Catalyst Stability and Effects of SO2/H2O
The sulfur and water poisoning of catalysts at low temperatures is always a hot potato, and it is much necessary to investigate the SO2 and water vapor resistance performance of catalysts for industrial applications in the future. Based on the results of previous experiments, Cr1.5% catalysts possessed better performance on acetone catalytic ozonation, and for Cr1.5%, the optimum reaction temperature range was 120~140 °C, molar ratio O3/C3H6O above 6. Thus, the SO2 and water vapor resistance performance of Cr1.5% was tested at 120 °C, O3/C3H6O = 8, with the results shown in Figure 6.

Figure 6.
Long-time stability and effects of SO2 and water vapor on acetone conversion efficiency and selectivity of COx over Cr1.5% catalysts: (a) effect of SO2; (b) effect of different concentrations SO2; (c) effect of water vapor; (d) combined effect of SO2 and water vapor.
Firstly, the long-time stability of acetone conversion efficiency over Cr1.5% catalyst was measured. The results in Figure 6a indicated that by adding the usage of catalysts from 0.05 g to 0.15 g, the stability of Cr1.5% was improved. For a 450-min testing time, the conversion efficiency of C3H6O over Cr1.5% catalyst stayed stable, around 100%. However, after the introduction of 100 ppm SO2, Cr1.5% became partially deactivated, causing the decline of acetone conversion efficiency and COx selectivity. Interestingly, however, the decline trend of acetone conversion showed a certain lag relative to that of COx selectivity, which might result from the exacerbation of incomplete oxidation and byproducts accumulation. Further, after stopping the introduction of SO2, the conversion efficiency trend of acetone would not recover to its original level, but the trend of COx selectivity would. This experimental phenomenon might be attributed to some active sites for COx generation on surface of Cr1.5% catalyst being occupied by sulfates and/or sulfites generated after introduction of SO2 [13]. Once this happened, further oxidation of some intermediate products to CO and CO2 would be inhibited. With the increase of time, intermediate products accumulating on the surface of the Cr1.5% catalyst would gradually lead to the blockage of some active sites of acetone decomposition; thus, the decomposition efficiency of acetone would start to decline, resulting in the decline of C3H6O conversion efficiency being delayed relative to that of COx selectivity. After stopping the introduction of SO2, on some active sites, a portion of intermediates could further be oxidized to CO and CO2, resulting in a recovery of COx selectivity. Not all byproducts would desorb from the surface of Cr1.5% catalyst, however, preventing the rebound of the conversion efficiency of acetone. Further, the competitive relationship on OH radicals between SO2 and acetone molecules or intermediates was also a devastating problem that contributed to the deactivation of catalysts [39]. As shown in Figure 6a, after the introduction of 100 ppm SO2, the conversion efficiency of C3H6O over Cr1.5% gradually declined but was maintained above 80% once the SO2 was stopped. This indicated that Cr1.5% had the excellent performance of SO2 resistance, owing to higher oxygen species content, release ability and suitable surface acidity of catalysts, which were very effective factors on SO2-resistance ability [13].
Furthermore, different concentrations SO2 were introduced to investigate the effect of SO2 in detail, as exhibited in Figure 6b. It was hard to distinguish the trend of the acetone conversion with the change of SO2 concentration, but we could notice the unpredictable phenomenon that acetone conversion was relatively lower under 50 ppm SO2 than others, which was explained by the in-situ DRIFTS measurement results below. We deduced that the process of adsorbed acetone species turning into carboxylic species, was promoted under lower concentrations of SO2, with more carboxylic species accumulated on the surface of catalysts, further restraining the catalytic activity of Cr1.5% catalysts. Another result phenomenon that should not be neglected was that the acetone conversion efficiencies were above 80% under different conditions of SO2 introduction, which also confirmed the excellent SO2-resistance ability of prepared and employed Cr1.5% catalysts.
The performance of water vapor resistance over Cr1.5% catalyst is shown in Figure 6c. The changing trend of C3H6O conversion efficiency under experimental conditions of 45% RH was measured, which showed an excellent performance of Cr1.5%. After the introduction of water vapor, keeping the gas mixture at a relative humidity of 45%, the conversion efficiency of C3H6O decreased from ~100% and kept steady at around 90%; it could recover to ~100% after stopping the introduction of water vapor, but COx selectivity could not recover to its original level. Furthermore, COx concentrations measurement was seriously disturbed by the presence of water vapor. The phenomenon above illustrated the reversible detrimental effect of water vapor, which was attributed to the physically competitive adsorption of water vapor and acetone molecules on surface of the catalyst [6,13,14].
More detailed research on concurrent effect of SO2 and water vapor was conducted, with the results shown in Figure 6d. It could be observed that when the relative humidity was higher, the acetone conversion was inhibited more severely. Under 87% RH, the acetone conversion efficiency decreased below 60%, and could not reverse back when the water vapor withdrew. It seemed that inhibition effect of H2O changed from reversible to irreversible, as RH increased. It was deduced that occupation of active sites by chemisorption gradually gained the upper hand under higher RH, rather than the physical adsorption competition under lower RH. Interestingly, under 95% RH, we tried to raise the reaction temperature to 140 °C, and the higher conversion efficiency rose back up to around 70%, with the deactivation still irreversible. This phenomenon demonstrated that the degree of inactivation caused by the presence of water vapor could be alleviated by raising the reaction temperature, as reported in the literature [40,41]. Under 87% RH, we also introduced 100 ppm SO2 to the catalytic ozonation process, which led to more severe deactivation. With 87% RH and 100 ppm SO2, the acetone conversion efficiency declined to 30%, illustrating the more distinct catalyst deactivation, compared to that of 60% with 87% RH, and of 90% with 100 ppm SO2, separately, which was consistent with the experimental results reported in the literature [22]. We also found that increasing the temperature could not realize the reverse of acetone conversion efficiency, which was restrained by higher RH and simultaneous combination effects of SO2 and water vapor; efficiency was below 30% under 95% RH and 100 ppm SO2, 140 °C. The results were also analyzed in the in-situ DRIFTS measurement below, and it was deduced that introduction of H2O and SO2 would aggravate the mutual inhibition effect, then inhibit the whole catalytic ozonation process on Cr1.5% and degrade the sulfur and water vapor resistance abilities.
2.5. In-Situ DRIFTS Measurement
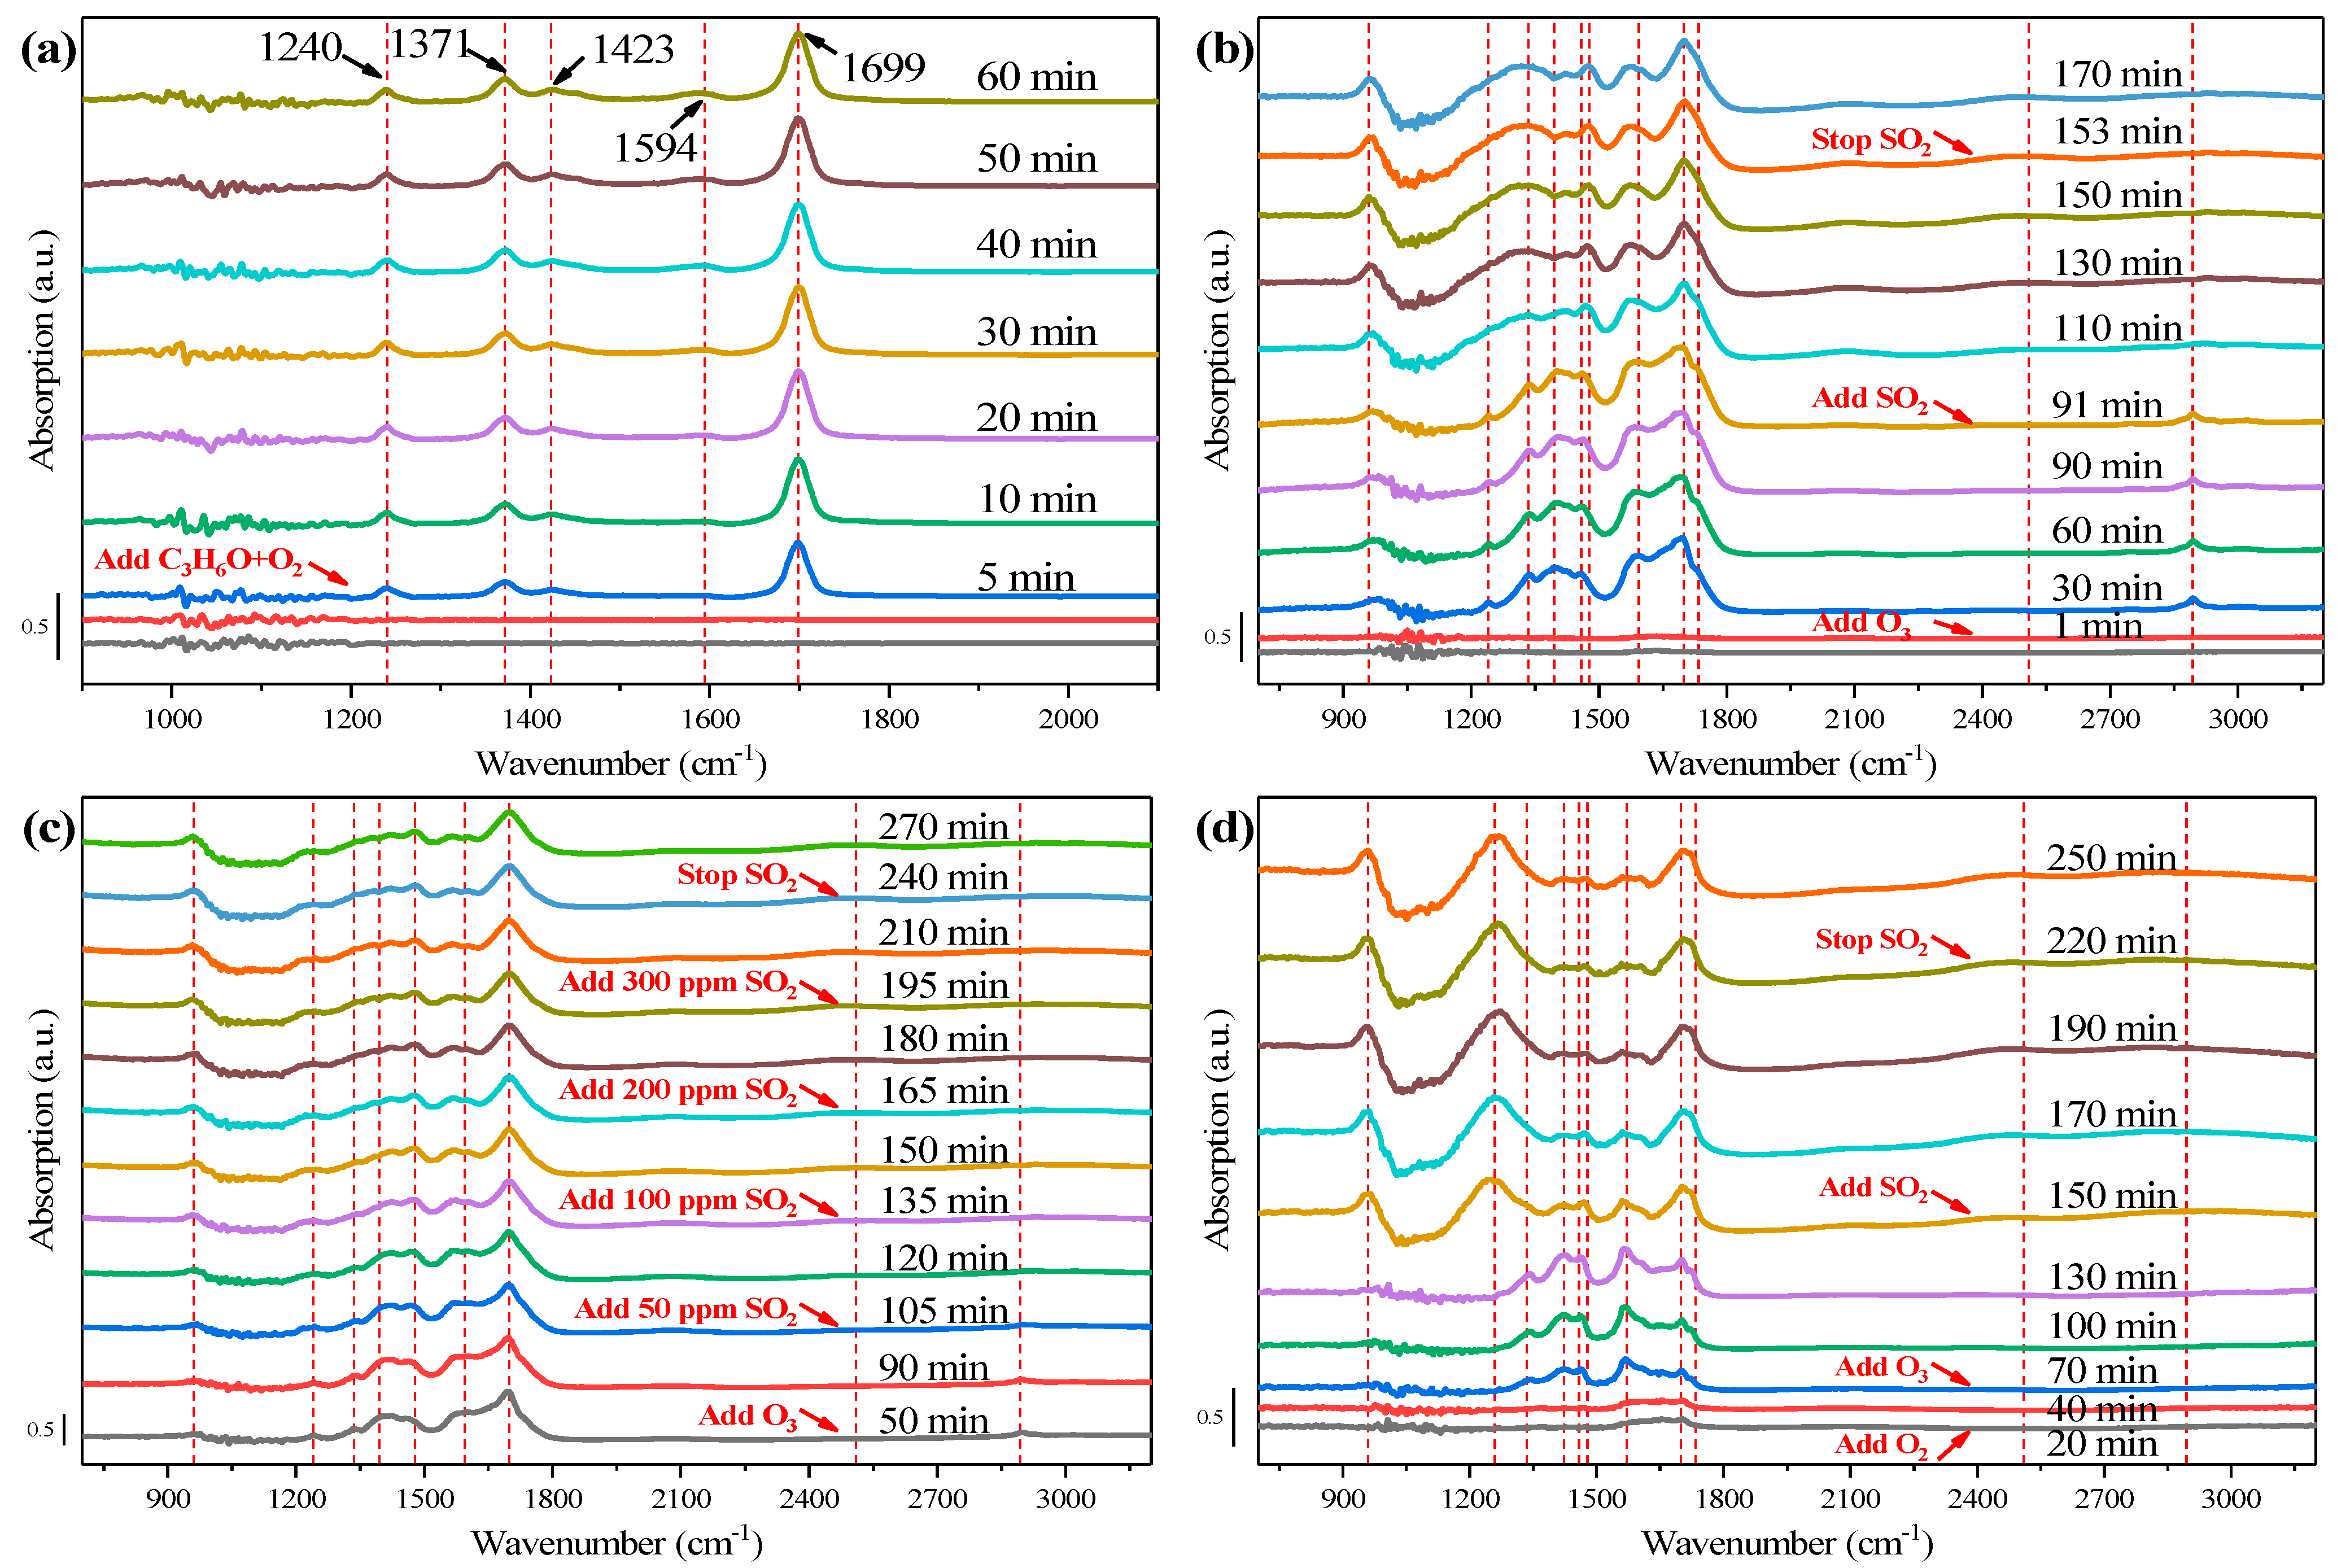
In-situ DRIFTS of acetone catalytic ozonation was conducted over Cr1.5%, with information on surface intermediates measured [20], to investigate the adsorption and catalytic ozonation process of acetone and SO2/H2O influence on catalytic activities. Acetone adsorption was shown, using in-situ DRIFTS, to have a main peak at 1699 cm−1, assigned to C=O stretching vibration of ketones species (Figure 7a) and this was strengthened with the increase of time, which illustrated the presence of (CH3)2CO (ads) species [42]. This bonding structure was considered the relatively electron-rich carbonyl oxygen, which donated a pair of lone electrons and could bond with the active sites on the catalysts [42]. After 10-min adsorption, a weak band at 1594 cm−1 appeared and increased with the adsorption time, referring to COO− stretching vibration, showing the presence of carboxylates and acid sites on the Cr1.5% catalyst surface, confirming the adsorption of acetone [12,15,22,43,44]. Two characteristic bands of acetone adsorption located at 1423 cm−1 and 1371 cm−1 were ascribed to methyl -CH3 vibration of acetone molecules [15,43,44], the latter strengthening with the increase of time. The band at 1240 cm−1 was assigned to carbon frame stretching vibration of adsorbed acetone [42]. All bands gradually increased within the initial 20 min, after 20 min adsorption, then stayed stable, demonstrating the adsorption saturation [20].

Figure 7.
In-situ DRIFTS measurement over Cr1.5% catalysts of: (a) C3H6O + O2; (b) C3H6O + O2/O3 + SO2; (c) C3H6O + O2/O3 + (50~300 ppm) SO2; (d) C3H6O + O2/O3 + SO2, with water adsorbed.
With the introduction of ozone onto the surface of catalysts after acetone adsorption-saturation, shown in Figure 7b, the spectra changed and new bands appeared. During the 90-min catalytic ozonation process, the adsorption peaks of acetone in Figure 7a weakened. Especially acetone adsorption characteristic bands of 1423 cm−1 and 1371 cm−1 almost vanished after ozone introduction. The (CH3)2CO (ads) species at 1699 cm−1 weakened with the increase of time, while it became steady after SO2 introduction. The band at 1594 cm−1, assigned to COO− stretching vibration, became weakened and broadened, with the increase of time, especially after SO2 introduction, demonstrating the weaker chemical adsorption of acetone [43]. The 1240 cm−1 band still existed once ozone was injected, but was weaker than that in Figure 7a. Once SO2 was introduced, the 1240 cm−1 band gradually widened and merged into the 1335 cm−1 broad band. Once ozone was injected, major bands appeared, including the 2894 cm−1 band, 1734 cm−1 band, 1458 cm−1 band, 1395 cm−1 band, and 1335 cm−1 band. Among those bands, 2894 cm−1 was ascribed to saturated methyl C-H stretching [12,15,22,44], while the 1458 cm−1 band was assigned to methyl and methylene C-H bending vibration [43,44]. A shoulder peak appearing at 1734 cm−1 corresponded to C=O stretching of ketones and carboxylic acids [15,22,43,44,45]. The bands at 1335 cm−1 and 1395 cm−1 corresponded to antisymmetric/symmetric COO− stretching of carboxylate species, and -CO2- symmetric stretching vibration [12,45]. After 20-min introduction of SO2, a different broad band showed up at 2509 cm−1, corresponding to sulfide species. The 1734 cm−1 shoulder peak together with the 1395 cm−1 band vanished after the SO2 introduction, and the 1458 cm−1 band assigned to methyl and methylene C-H bending vibration, shifted to a higher wavenumber 1478 cm−1 and became stronger. The band at 960 cm−1 also appeared after the SO2 introduction, ascribed to the generation of surface or bulk-like sulfate species [20]. The phenomenon in Figure 7b demonstrated that ozone injection could improve the decomposition of adsorbed acetone molecules and intermediates carboxylic species, and generate methyl, and methylene radicals. It was reported in [43] that during the ozonation process, acetone was oxidized first to surface carboxylate species, then further to alcohols, ketones, and carboxylic acids, and finally to CO and CO2. SO2 introduction could induce the generation of surface or bulk-like sulfate species and hinder the generation of methyl/methylene radicals and -CO2- groups, further inhibiting the decomposition process of acetone, and leading to sulfur poisoning of Cr1.5% catalysts, as shown in Figure 6a [22]. Fortunately, the bands at 1594 cm−1 and 1335 cm−1 were reserved, meaning that the partial ozonation process could continue, corresponding to partial inactivation poisoning in Figure 6a [20]. It could also be noticed that after stopping SO2 introduction, the spectra and bands did not change at all, echoing the irreversible sulfur poisoning phenomenon of Cr1.5%.
The influence of different initial concentrations of SO2 introduction was investigated through in-situ DRIFTS, as shown in Figure 7c. The overall trend was roughly consistent with that in Figure 7b, except for several bands under different initial SO2 concentrations. For example, the intensity of the band at 2509 cm−1 became larger with the increase of SO2 concentration, and the 1594 cm−1 band weakened. The band at 1699 cm−1, after SO2 was introduced, first weakened and then gradually increased, and the intensity of that was the lowest under 50 ppm SO2 introduction. As for the 1395 cm−1 and 1335 cm−1 bands, both weakened with the introduction of SO2, and disappeared when SO2 concentration was above 50 ppm. These conditions reflected a more detailed process of change in functional groups, which may be related to the slightly different SO2 poisoning phenomenon under differing concentrations of SO2 in Figure 6b. The catalytic efficiency over Cr1.5% under 50 ppm SO2 introduction was the most unsatisfactory. Under relatively low-concentration SO2, although sulfur species were less, there was an increased conversion of adsorbed acetone species into carboxylic species, with more carboxylic species accumulating on the surface of the catalysts, more catalytic active sites covered and finally the catalytic activity of Cr1.5% catalysts inhibited more severely.
In-situ DRIFT of SO2 influence on catalyst Cr1.5% that had adsorbed H2O in advance was also measured, compared with Figure 7d, to investigate the H2O and SO2 combined effect on Cr1.5% catalysts. From the view of whole spectra, it could be observed that after H2O adsorption in advance, the main bands on Cr1.5% had changed. Firstly, once ozone was injected, all bands became weaker than that without H2O adsorption, especially the 1699 cm−1 and 1734 cm−1 bands. It meant that after H2O adsorption, the whole catalytic process was inhibited, particularly the acetone adsorption process of Cr1.5% catalysts. When SO2 was introduced, the difference between Figure 7d,b mainly focused on the bands at 1699 cm−1, 1571cm−1, 1478 cm−1, 1240 cm−1 and 960 cm−1. The former three bands became weaker, implying that adsorption of acetone and generation of methyl or methylene groups were both restrained. However, the latter two bands became larger than those in Figure 7b, illustrating that more surface bulk-like sulfate species accumulated on the catalysts, after H2O was adsorbed. From the results above, it may be deduced that H2O introduction would inhibit the whole catalytic ozonation process on Cr1.5% and aggravate the accumulation of sulfur species on catalysts surface, and finally degrade the sulfur resistance of Cr1.5% catalysts.
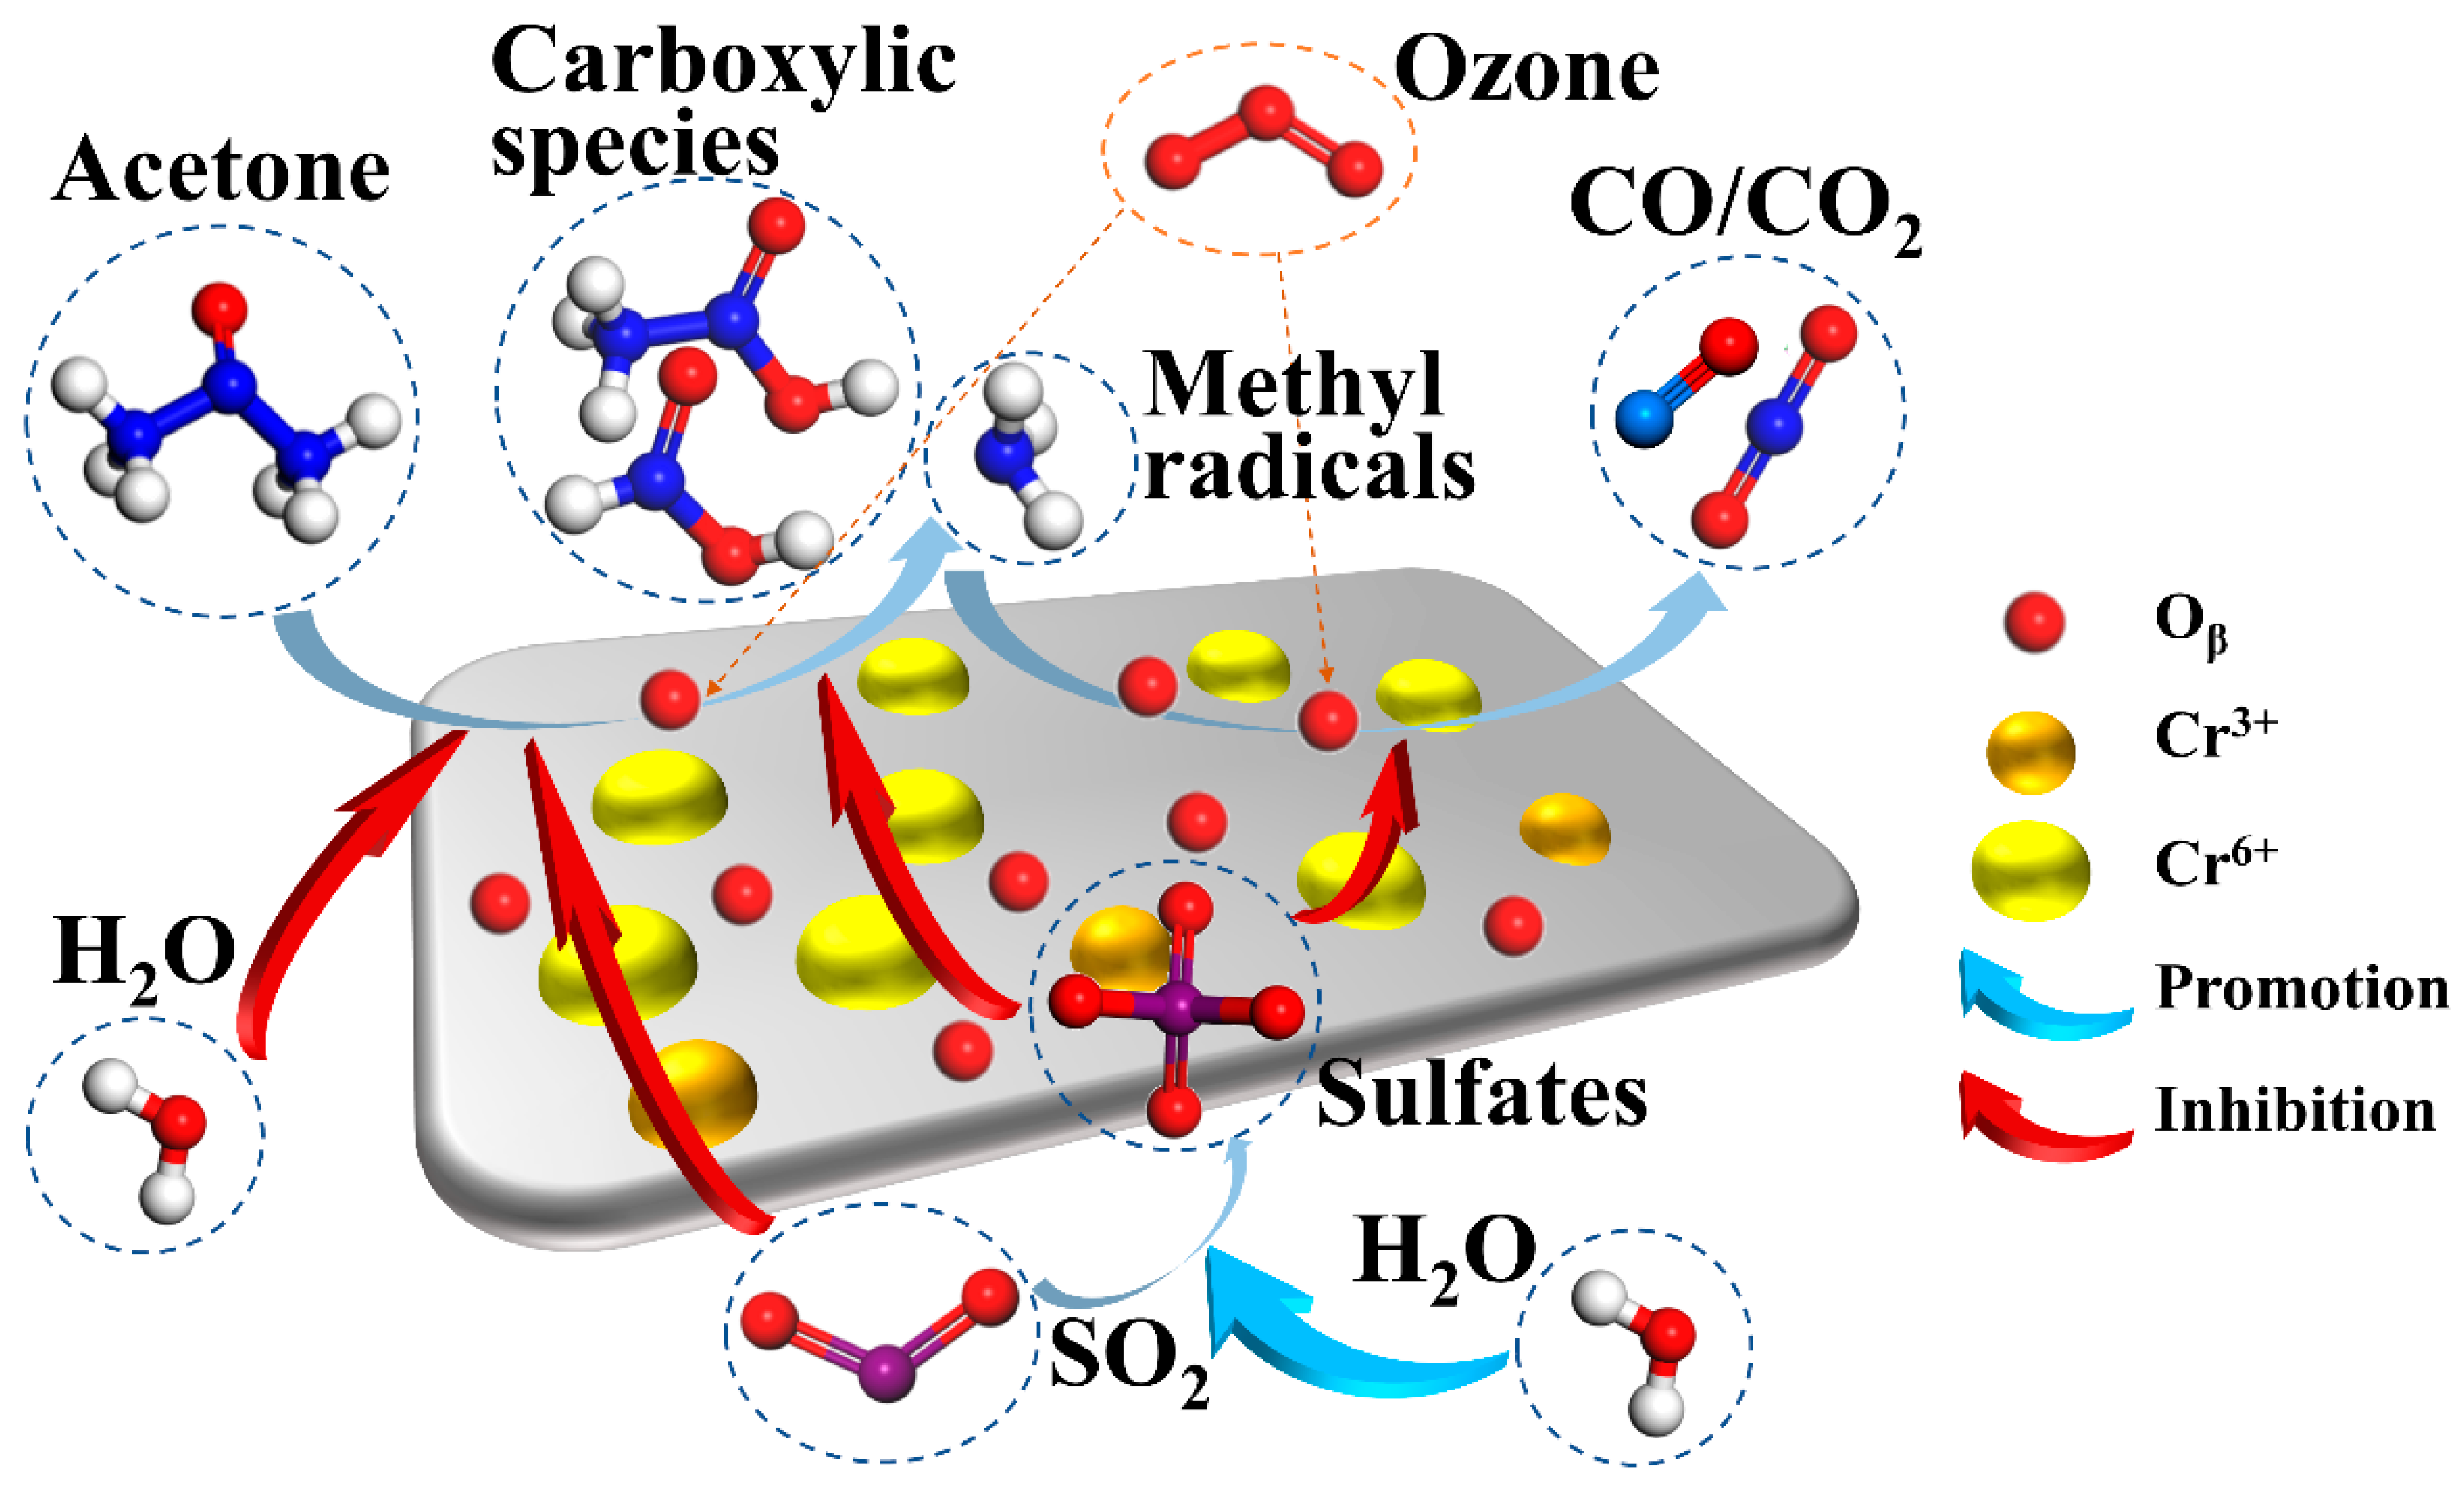
2.6. Mechanisms of Acetone Catalytic Ozonation
The proposed schema for acetone decomposition over catalyst Cr1.5% and the inhibition effect of SO2/H2O is shown in Figure 8. Firstly, acetone molecules are adsorbed over Cr1.5% catalysts, under the function of chemically adsorbed oxygen species, Oβ, then further decomposed to carboxylic species on Cr6+ active sites, with some methyl/methylene radicals generated. Then, carboxylic species are further oxidized by Oβ or radicals and decompose to generate CO/CO2. Injected ozone decomposes on the surface of catalysts Cr1.5% and generates rich oxygen species, to replenish the oxygen species lost during the catalytic ozonation process over time and even under lower temperatures. When SO2 is present, the SO2 molecules are adsorbed and oxidized to sulfates over Cr1.5%, which inhibits the decomposition of acetone and carboxylic species. In addition, SO2 directly influences the adsorption process of acetone by competition adsorption. In the presence of water vapor, H2O also inhibits acetone adsorption over Cr1.5% by competition, promoting the formation of sulfates and, furthermore, inhibiting the catalytic ozonation process of acetone and aggravating the deactivation of catalyst Cr1.5%.

Figure 8.
Mechanisms of acetone decomposition over Cr1.5% and inhibition effects of SO2/H2O.
3. Experiments and Methods
3.1. Catalyst Preparation
A batch of catalysts supported on γ-Al2O3 was prepared for degradation of acetone by catalytic ozonation. In advance, spherical γ-Al2O3 (Alfa Aesar) was roughly crushed, then pretreated under calcination temperature 600 °C for 2 h. Pretreated γ-Al2O3 was further crushed and sieved to 40–60 meshes for the next isovolumetric impregnation as catalyst support. The 1.1 mL Cr(NO3)3 solution containing 0.1154 g Cr(NO3)3·9H2O (Sinopharm Chemical Reagent Co., Ltd., Shanghai, China) was impregnated onto 1 g γ-Al2O3, followed by standing for 24 h. The mixture was then put into an oven and dried at 100 °C for 7 h. The dried solid was further calcinated in a tubular furnace under 1 L/min air atmosphere. The temperature rose to 500 °C at a heating rate of 2 °C/min, then maintained at 500 °C for 4 h. After calcination, the catalyst was taken out and sieved to 40~60 meshes, which was denoted as Cr1.5%, with 1.5% referring to the mass fraction of Cr element. Analogously, Fe1.5%, Mn1.5%, Co1.5%, Cr2.5%, Cr5% were also prepared, for further catalytic activity evaluation.
3.2. Catalyst Characterization
The catalysts prepared above were further characterized by multiple techniques, including X-ray powder diffraction (XRD), X-ray photoelectron spectroscopy (XPS), O2/NH3/CO2/C3H6O temperature-programmed desorption (O2-TPD/NH3-TPD/CO2-TPD/C3H6O-TPD), H2 temperature-programmed reduction (H2-TPR), Brunner–Emmet–Teller (BET) measurement, and in-situ diffuse reflectance infrared Fourier transform spectroscopy (in-situ DRIFTS) measurement.
XRD patterns were recorded by an X-ray diffractometer (X-pert Powder, PANalytical B.V., Almelo, The Netherlands) with Cu Kα (λ = 0.1540598 nm) radiation, from 10~80° (2θ, diffraction angle), at 40 kV and 40 mA. XPS spectra collected by an X-ray photoelectron spectrometer (ESCALAB 250Xi, Thermo Scientific, East Grinstead, UK) equipped with a standard Al Kα (1486.6 eV) source, and all binding energies were calibrated with C 1s peak (284.8 eV) as reference. Specific surface area and pore structure data were measured through BET and N2 adsorption methods by an automatic specific surface area and porosity analyzer (TriStar II, Micromeritics, Norcross, GA, USA) at −196 °C. The in-situ DRIFTS measurements were conducted on an in-situ diffuse reflectance infrared Fourier transform spectrometer (Nicolet iS50, Thermo Scientific, Waltham, MA, USA) equipped with an MCT/A detector and a reaction chamber (Harrick) with ZnSe windows, with the resolution of 4 cm−1. All spectra were recorded within 600~4000 cm−1. The O2/NH3/CO2/C3H6O TPD and H2-TPR measurements were collected from an automatic temperature-programmed chemisorption analyzer (AutoChem II 2920, Micromeritics).
3.3. Experimental Setup and Activity Test
The catalytic activities for acetone ozonation and SO2/H2O resistance abilities of catalysts were tested and evaluated over the experimental setup, shown in Figure 9, which consisted of a homemade self-designed catalytic activity evaluation platform (WFS-2017, Tianjin Xianquan Co., Ltd., Tianjin, China), a dielectric barrier discharge ozone generator (Model VMUS-1S, 1 g, AZCO, Vancouver, BC, Canada) and measuring instruments. All simulated flue gas components were supplied by cylinder gas (Jingong Gas Co., Ltd., Hangzhou, China), including N2 (99.999%), O2 (99.999%), C3H6O (60 ppm/balance N2), SO2 (10,000 ppm/balance N2). With the O2 stream flowing into the ozone generator, ozone-rich O3/O2 mixture was generated, then the O3/O2 mixture was divided into two streams, with one gas stream flowing into an ozone analyzer (BMT-964, OSTI Inc., Monterey, CA, USA, 0~20 g/Nm3, ±0.1 g/Nm3) to monitor the initial concentrations of ozone. The other stream flowed into the catalytic reaction platform, then mixed with simulated flue gas. Each gas stream was controlled by the individual mass flow controller (S500, HIRIBA METRON Co., Ltd., Beijing, China), and the total flow rate of the simulated flue gas was controlled at 200 mL/min.

Figure 9.
Experimental setup schematic.
During catalytic activities tests, 50 mg of catalysts, corresponding to gas hour space velocity (GHSV) 240,000 mL/(g·h), was mixed with 200 mg SiO2, both with 40~60 meshes, placed into the middle of a quartz tube with 6-mm internal diameter in the fixed-bed catalytic reaction platform, equipped with a thermocouple to monitor the reaction temperature. The exhaust gas after reaction firstly entered a ten-way valve, in which the exhaust gas was controlled to either enter a gas chromatography (GC9790II, Zhejiang Fuli Co., Ltd., Taizhou, China) for concentrations testing, or an ozone analyzer with a low range (BMT-932-1, OSTI Inc., Monterey, America, 0~100 ppm, ±0.1 ppm) to monitor the residual ozone concentrations. The concentrations of inlet and out C3H6O were tested by gas chromatography equipped with two individual FID detectors, as well as the concentrations of generated CO and CO2. In H2O resistance evaluation tests, water vapor was added to the simulated flue gas through the bubbling method, and the content of water vapor was adjusted by changing the heating temperature, which was measured by a humidity tester. In the tests of SO2/H2O resistance abilities, the catalysts usage was 150 mg, corresponding to gas hour space velocity (GHSV) of 80,000 mL/(g·h).
In this paper, the catalytic activity was evaluated by conversion efficiencies of acetone C3H6O/ozone O3, and selectivity of CO/CO2, which were defined as follows:
where , , meant the conversion efficiency, initial and outlet concentrations of acetone, respectively, with unit of % and ppm. Analogously, , , respectively, referred to the conversion efficiency, initial and outlet concentrations of ozone. In oxidation products analysis, and meant the selectivity and concentration of CO, while similarly, and meant the selectivity and concentration of CO2.
4. Conclusions
Based on γ-Al2O3 as support, the isovolumic impregnation method was implied to prepare MOx/γ-Al2O3 (M = Cr/Fe/Mn/Co) catalysts. Cr1.5% achieved the best performance; it was therefore chosen as the target catalyst to investigate optimum application conditions. Under conditions of 120 °C, O3/C3H6O = 8, acetone conversion efficiency over Cr1.5% was maintained above 90% for the 180-min reaction process. Taking various characterization results analyzed in this manuscript into consideration, important factors supporting catalysis included stronger metal interaction, lower crystallization, proper pore diameters, larger surface area and pore volume, larger proportion of Cr6+ and Oβ (chemically adsorbed oxygen species), excellent desorption ability of CO2 and adsorption ability of acetone, stronger redox ability and suitable acidity. These significant factors together governed the effectiveness of the Cr1.5% catalyst and its satisfactory performance in catalytic ozonation of acetone.
When the temperature and the molar ratio O3/C3H6O were higher, the catalytic activity of Cr1.5% was better. However, with energy and cost savings considered, as well as residual ozone, the temperature and the molar ratio O3/C3H6O parameters should not be set too high. A temperature around 120–140 °C, and a molar ratio O3/C3H6O of about 6 were suggested to be adopted in practical industrial applications, guaranteeing the decomposition efficiency of ozone at ~90% and little residual or escaping ozone. The fluctuation of C3H6O initial concentrations in industrial waste gas caused a negligible impact on the catalytic ozonation process of acetone over Cr1.5% catalysts, confirming the applicability of the CrOx/γ-Al2O3 catalysts in industrial application.
Cr1.5% catalysts showed excellent resistance to sulfur (catalysis down to 80%, reversibly, under 50–300 ppm SO2) or water vapor (down to 90%, irreversibly, under 45% RH), but were adversely affected by concurrent presence of both sulfur and water (down to 30%, irreversibly, under 100 ppm SO2 with 87% RH). Combined with in-situ DRIFTS results, possible mechanisms of catalytic ozonation process of acetone and SO2/H2O poisoning were proposed, as follows. During the ozonation process, acetone is firstly oxidized to surface carboxylic species, then further to alcohols, ketones and carboxylic acid, and finally to CO and CO2. The ozone injection could greatly improve the decomposition of adsorbed acetone molecules and intermediates carboxylic species, and generate methyl, methylene radicals. However, SO2 could induce the generation of surface or bulk-like sulfate species and hinder the generation of methyl/methylene radicals and -CO2- groups, further inhibiting the decomposition process of acetone, leading to sulfur poisoning of the catalyst. H2O introduction would further inhibit the whole catalytic ozonation process on Cr1.5% and aggravate the accumulation of sulfur species on the catalyst surface; this would degrade the sulfur resistance of Cr1.5% catalysts, leading to worse performance in concurrent sulfur and water resistance ability. Hopefully, to improve the concurrent sulfur and water resistance of CrOx/γ-Al2O3 catalysts, further detailed research and exploration can be undertaken.
Supplementary Materials
The following supporting information can be downloaded at: https://www.mdpi.com/article/10.3390/catal12101090/s1. Figure S1: The NH3-TPD profiles of different catalysts; Figure S2: The CO2-TPD profiles of different catalysts; Figure S3: The C3H6O-TPD profiles of different catalysts; Figure S4: The O2-TPD profiles of different catalysts; Figure S5: The H2-TPR profiles of different catalysts: Figure S6. SEM-EDS mappings of different catalysts; Figure S7: Decomposition efficiencies of ozone by different catalysts, without acetone; Table S1: Metals loadings in catalysts.
Author Contributions
P.L.: investigation, conceptualization, methodology, validation, visualization, writing original draft. L.C.: investigation, data curation, visualization. H.T.: conceptualization, visualization, writing—review and editing, supervision. J.S.: resources, methodology, formal analysis. F.L.: writing—review and editing, resources, supervision. Y.H.: resources, project administration. Y.Z.: conceptualization, supervision, project administration. Z.W.: conceptualization, methodology, supervision, funding acquisition. All authors have read and agreed to the published version of the manuscript.
Funding
This research was funded by [the National Natural Science Foundation of China] grant number [52125605] and [the Fundamental Research Funds for the Central Universities] grant number [2022ZFJH004]. And the APC was funded by [the Fundamental Research Funds for the Central Universities] grant number [2022ZFJH004].
Conflicts of Interest
The authors declare no conflict of interest.
References
- Ling, Z.H.; Guo, H.; Cheng, H.R.; Yu, Y.F. Sources of ambient volatile organic compounds and their contributions to photochemical ozone formation at a site in the Pearl River Delta, southern China. Environ. Pollut. 2011, 159, 2310–2319. [Google Scholar] [CrossRef]
- Atkinson, R. Atmospheric chemistry of VOCs and NOx. Atmos. Environ. 2000, 34, 2063–2101. [Google Scholar] [CrossRef]
- Wang, Y.; Ding, L.; Liu, S.; Qian, L.; Yu, Z.; Wang, H.; Lei, J.; Gao, Z.; Long, H.; Xu, C.C. Volatile organic compounds (VOC) emissions control in iron ore sintering process: Recent progress and future development. Chem. Eng. J. 2022, 448, 137601. [Google Scholar] [CrossRef]
- Pathak, A.K.; Viphavakit, C. A review on all-optical fiber-based VOC sensors: Heading towards the development of promising technology. Sens. Actuators A Phys. 2022, 338, 113455. [Google Scholar] [CrossRef]
- Wang, C.; Bai, H. Catalytic incineration of acetone on mesoporous silica supported metal oxides prepared by one-step aerosol method. Ind. Eng. Chem. Res. 2011, 50, 3842–3848. [Google Scholar] [CrossRef]
- Zhao, Q.; Liu, Q.; Han, J.; Lu, S.; Su, Y.; Song, C.; Ji, N.; Lu, X.; Ma, D.; Cheung, O. The effect of cerium incorporation on the catalytic performance of cobalt and manganese containing layer double oxides for acetone oxidation. J. Chem. Technol. Biotechnol. 2018, 94, 3753–3762. [Google Scholar] [CrossRef]
- Abdelhamid, H.N.; Mathew, A.P. Cellulose–metal organic frameworks (CelloMOFs) hybrid materials and their multifaceted applications: A review. Coord. Chem. Rev. 2022, 451, 214263. [Google Scholar] [CrossRef]
- Ge, Y.; Fu, K.; Zhao, Q.; Ji, N.; Song, C.; Ma, D.; Liu, Q. Performance study of modified Pt catalysts for the complete oxidation of acetone. Chem. Eng. Sci. 2019, 206, 499–506. [Google Scholar] [CrossRef]
- Corey, R. Structure and oxidation state of silica-supported manganese oxide catalysts and reactivity for acetone oxidation with ozone. J. Phys. Chem. B 2006, 110, 4207–4216. [Google Scholar]
- Xi, Y.; Reed, C.; Lee, Y.-K.; Oyama, S.T. Acetone oxidation using ozone on manganese oxide catalysts. J. Phys. Chem. B 2005, 109, 17587–17596. [Google Scholar] [CrossRef]
- Pradier, M.C.; Rodrigues, F.; Marcus, P.; Landau, M.V.; Kaliya, M.L.; Gutman, A.; Herskowitz, M. Supported chromia catalysts for oxidation of organic compounds: The state of chromia phase and catalytic performance. Appl. Catal. B Environ. 2000, 27, 73–85. [Google Scholar] [CrossRef]
- Su, J. Experimental Study on Catalytic Oxidation of DCM over HZSM-5 Supported Transition Metal Oxides; Zhejiang University: Hangzhou, China, 2016. [Google Scholar]
- Wang, Z.; Li, S.; Xie, S.; Liu, Y.; Dai, H.; Guo, G.; Deng, J. Supported ultralow loading Pt catalysts with high H2O-, CO2-, and SO2-resistance for acetone removal. Appl. Catal. A Gen. 2019, 579, 106–115. [Google Scholar] [CrossRef]
- Li, X.; Guo, T.; Peng, Z.; Xu, L.; Dong, J.; Cheng, P.; Zhou, Z. Real-time monitoring and quantification of organic by-products and mechanism study of acetone decomposition in a dielectric barrier discharge reactor. Environ. Sci. Pollut. Res. 2019, 26, 6773–6781. [Google Scholar] [CrossRef]
- Aghbolaghy, M.; Ghavami, M.; Soltan, J.; Chen, N. Effect of active metal loading on catalyst structure and performance in room temperature oxidation of acetone by ozone. J. Ind. Eng. Chem. 2019, 77, 118–127. [Google Scholar] [CrossRef]
- Aghbolaghy, M.; Soltan, J.; Sutarto, R. The role of surface carboxylates in catalytic ozonation of acetone on alumina-supported manganese oxide. Chem. Eng. Res. Des. 2017, 128, 73–84. [Google Scholar] [CrossRef]
- Ghavami, M.; Aghbolaghy, M.; Soltan, J.; Chen, N. Room temperature oxidation of acetone by ozone over alumina-supported manganese and cobalt mixed oxides. Front. Chem. Sci. Eng. 2020, 14, 937–947. [Google Scholar] [CrossRef]
- Xiao, M.; Liu, Y.; Song, X. Review on the catalytic oxidation of volatile organic compounds. Sichuan Chem. Ind. 2019, 22, 55–58. [Google Scholar]
- Shao, J.; Lin, F.; Wang, Z.; Liu, P.; Tang, H.; He, Y.; Cen, K. Low temperature catalytic ozonation of toluene in flue gas over Mn-based catalysts: Effect of support property and SO2/water vapor addition. Appl. Catal. B Environ. 2020, 266, 118662. [Google Scholar] [CrossRef]
- Rezaei, E.; Soltan, J.; Chen, N. Catalytic oxidation of toluene by ozone over alumina supported manganese oxides: Effect of catalyst loading. Appl. Catal. B Environ. 2013, 136–137, 239–247. [Google Scholar] [CrossRef]
- Reed, C.; Xi, Y.; Oyama, S. Distinguishing between reaction intermediates and spectators: A kinetic study of acetone oxidation using ozone on a silica-supported manganese oxide catalyst. J. Catal. 2005, 235, 378–392. [Google Scholar] [CrossRef]
- Konova, P.; Stoyanova, M.; Naydenov, A.; Christoskova, S.; Mehandjiev, D. Catalytic oxidation of VOCs and CO by ozone over alumina supported cobalt oxide. Appl. Catal. A Gen. 2006, 298, 109–114. [Google Scholar] [CrossRef]
- Meng, F.; Zhang, S.; Zeng, Y.; Zhang, M.; Zou, H.; Zhong, Q.; Li, Y. Promotional effect of surface fluorine on TiO2: Catalytic conversion of O3 and H2O2 into ·OH and ·O2− radicals for high-efficiency NO oxidation. Chem. Eng. J. 2021, 424, 130358. [Google Scholar] [CrossRef]
- Rochard, G.; Olivet, L.; Tannous, M.; Poupin, C.; Siffert, S.; Cousin, R. Recent advances in the catalytic treatment of volatile organic compounds: A review based on the mixture effect. Catalysts 2021, 11, 1218. [Google Scholar] [CrossRef]
- Salari, D.; Niaei, A.; Seyed, A.H.; Leshzadeh, R.; Afshary, H. Remediation of various naturally oxygenated volatile organic compounds (O-VOCs) by Mn- and Cr-supported g-Al2O3 nanocatalysts. Turk. J. Chem. 2011, 35, 793–802. [Google Scholar]
- Yang, H.H.; Du, J.; Wu, M.; Zhou, H.; Yi, X.; Zhan, J.; Liu, Y. Tin-modified α-MnO2 catalyst with high performance for benzene oxidation, ozone decomposition and particulate matter filtration. Chem. Eng. J. 2022, 427, 132075. [Google Scholar] [CrossRef]
- Shao, J.; Lin, F.; Li, Y.; Tang, H.; Wang, Z.; Liu, P.; Chen, G. Co-precipitation synthesized MnOx-CeO2 mixed oxides for NO oxidation and enhanced resistance to low concentration of SO2 by metal addition. Catalysts 2019, 9, 519. [Google Scholar] [CrossRef]
- KSing, S.W.; Everett, D.H.; Haul, R.A.W.; Moscou, L.; Pierotti, R.A.; Rouquerol, J.; Siemieniewska, T. Reporting physisorption data for gas/solid systems with special reference to the determination of surface area and porosity (Recommendations 1984). Pure Appl. Chem. 1985, 57, 603–619. [Google Scholar]
- Lin, F.; Jiang, X.; Boreriboon, N.; Wang, Z.; Song, C.; Cen, K. Effects of supports on bimetallic Pd-Cu catalysts for CO2 hydrogenation to methanol. Appl. Catal. A Gen. 2019, 585, 117210. [Google Scholar] [CrossRef]
- Tan, J.; He, Y.; Yuan, Y.; Wang, Z.; Liu, J.; Cen, K. Structure and combustion characteristics of semi-cokes from a pilot-scale entrained flow gasifier using oxygen-enriched air. J. Energy Inst. 2021, 97, 80–91. [Google Scholar] [CrossRef]
- Li, X.; Cao, J.; Zhang, W. Stoichiometry of Cr(VI) immobilization using nanoscale zerovalent iron (NZVI): A study with high-resolution X-ray photoelectron spectroscopy (HR-XPS). Ind. Eng. Chem. Res. 2008, 47, 2131–2139. [Google Scholar] [CrossRef]
- Yang, P.; Shi, Z.; Tao, F.; Yang, S.; Zhou, R. Synergistic performance between oxidizability and acidity/texture properties for 1,2-dichloroethane oxidation over (Ce,Cr)xO2/zeolite catalysts. Chem. Eng. Sci. 2015, 134, 340–347. [Google Scholar] [CrossRef]
- Lee, D.K.; Yoon, W.L. Ru-promoted CrOx/Al2O3 catalyst for the low-temperature oxidative decomposition of trichloroethylene in air. Catal. Lett. 2002, 81, 3–4. [Google Scholar] [CrossRef]
- Ma, R.; Hu, P.; Jin, L.; Wang, Y.; Lu, J.; Luo, M. Characterization of CrOx/Al2O3 catalysts for dichloromethane oxidation. Catal. Today 2011, 175, 598–602. [Google Scholar] [CrossRef]
- Hardcastle, F.D.; Wachs, I.E. Raman spectroscopy of chromium oxide supported on Al2O3, TiO2 and SiO2: A comparative study. J. Mol. Catal. 1988, 46, 173–186. [Google Scholar] [CrossRef]
- Asami, K.; Hashimoto, K. An XPS study of the surfaces on Fe-Cr, Fe-Co and Fe-Ni alloys after mechanical polishing. Corros. Sci. 1984, 24, 83–97. [Google Scholar] [CrossRef]
- Wang, Z.; Liu, Y.; Yang, T.; Deng, J.; Xie, S.; Dai, H. Catalytic performance of cobalt oxide-supported gold-palladium nanocatalysts for the removal of toluene and o-xylene. Chin. J. Catal. 2017, 38, 207–216. [Google Scholar] [CrossRef]
- Wang, X.; Liu, Y.; Zhang, T.; Luo, Y.; Lan, Z.; Zhang, K.; Zuo, J.; Jiang, L.; Wang, R. Geometrical-site-dependent catalytic activity of ordered mesoporous Co-based spinel for benzene oxidation: In situ DRIFTS study coupled with Raman and XAFS spectroscopy. ACS Catal. 2017, 7, 1626–1636. [Google Scholar] [CrossRef]
- Sun, M.; Li, W.; Zhang, B.; Cheng, G.; Lan, B.; Ye, F.; Zheng, Y.; Cheng, X.; Yu, L. Enhanced catalytic performance by oxygen vacancy and active interface originated from facile reduction of OMS-2. Chem. Eng. J. 2018, 331, 626–635. [Google Scholar] [CrossRef]
- Zhu, G.; Zhu, J.; Jiang, W.; Zhang, Z.; Wang, J.; Zhu, Y.; Zhang, Q. Surface oxygen vacancy induced α-MnO2 nanofiber for highly efficient ozone elimination. Appl. Catal. B Environ. 2017, 209, 729–737. [Google Scholar] [CrossRef]
- Lin, F.; Shao, J.; Tang, H.; Li, Y.; Wang, Z.; Chen, G.; Yuan, D.; Cen, K. Enhancement of NO oxidation activity and SO2 resistance over LaMnO3+δ perovskites catalysts with metal substitution and acid treatment. Appl. Surf. Sci. 2019, 479, 234–246. [Google Scholar] [CrossRef]
- Sun, Y.; Zhang, X.; Li, N.; Xing, X.; Yang, H.; Zhang, F.; Cheng, J.; Zhang, Z.; Hao, Z. Surface properties enhanced MnxAlO oxide catalysts derived from MnxAl layered double hydroxides for acetone catalytic oxidation at low temperature. Appl. Catal. B Environ. 2019, 251, 295–304. [Google Scholar] [CrossRef]
- Long, L.; Zhao, J.; Yang, L.; Fu, M.; Wu, J.; Huang, B.; Ye, D. Room temperature catalytic ozonation of toluene over MnO2/Al2O3. Chin. J. Catal. 2011, 32, 904–916. [Google Scholar] [CrossRef]
- Aghbolaghy, M.; Soltan, J.; Chen, N. Low temperature catalytic oxidation of binary mixture of toluene and acetone in the presence of ozone. Catal. Lett. 2018, 148, 3431–3444. [Google Scholar] [CrossRef]
- Zhang, Z.; Xiang, L.; Lin, F.; Wang, Z.; Yan, B.; Chen, G. Catalytic deep degradation of Cl-VOCs with the assistance of ozone at low temperature over MnO2 catalysts. Chem. Eng. J. 2021, 426, 130814. [Google Scholar] [CrossRef]


Publisher’s Note: MDPI stays neutral with regard to jurisdictional claims in published maps and institutional affiliations. |
© 2022 by the authors. Licensee MDPI, Basel, Switzerland. This article is an open access article distributed under the terms and conditions of the Creative Commons Attribution (CC BY) license (https://creativecommons.org/licenses/by/4.0/).