Article

Iron-Zinc Co-Doped Titania Nanocomposite: Photocatalytic and Photobiocidal Potential in Combination with Molecular Docking Studies

1
Chemical Engineering Department, Universiti Teknologi PETRONAS, Seri Iskander 32610, Malaysia
2
Department of Environmental Sciences, COMSATS University Islamabad, Abbottabad Campus, Abbottabad 22060, Pakistan
3
Tianjin Institute of Industrial Biotechnology, Chinese Academy of Sciences, Tianjin 300308, China
4
Department of Chemistry, COMSATS University Islamabad, Abbottabad Campus, Abbottabad 22060, Pakistan
5
Department of Pharmacology and Therapeutics, Faculty of Veterinary Medicine, Damanhour University, Damanhour 22511, AlBeheira, Egypt
6
Food Science & Nutrition Department, College of Science, Taif University, P.O. Box 11099, Taif 21944, Saudi Arabia
7
Department of Pharmaceutical Chemistry, College of Pharmacy, King Khalid University, Abha 62529, Saudi Arabia
8
Natural and Medical Sciences Research Center, University of Nizwa, P.O. Box 33, Birkat Al Mauz, Nizwa 616, Oman
*
Authors to whom correspondence should be addressed.
Catalysts 2021, 11(9), 1112; https://doi.org/10.3390/catal11091112
Submission received: 4 August 2021 / Revised: 13 September 2021 / Accepted: 14 September 2021 / Published: 16 September 2021
(This article belongs to the Special Issue Energy-Efficient Catalytic Oxidation)

Abstract

:
In the current research study, iron-zinc co-doped TiO2 was reported as an energy efficient material for the degradation of DIPA and inactivation of E. coli and S. aureus under visible light irradiation. In addition, molecular docking simulation was performed to provide further insight into possible targets for inhibiting bacterial development. The synthesized nanocomposites were screened and optimized for different synthesis and reaction parameters. The physicochemical properties of the synthesized nanocomposites were evaluated through different characterization techniques. The wet impregnation (WI) approach was among the most successful methods for the synthesis of Fe-Zn-TiO2 nanocomposite (NC) utilizing anatase titanium. Moreover, 66.5% (60 min reaction time) and 100% (190 min reaction time) chemical oxygen demand (COD) removal was obtained through optimized NC, i.e., 0.1Fe-0.4Zn metal composition and 300 °C calcination temperature. The energy consumption for the best NC was 457.40 KW h m−3. Moreover, 0.1Fe-0.4Zn-TiO2-300 was more efficient against S. aureus compared to E. coli with 100% reduction in 90 min of visible light irradiations. Furthermore, 0.1Fe-0.4Zn-TiO2-300 NC showed that the binding score for best docked conformation was −5.72 kcal mol−1 against β-lactamase from E. coli and −3.46 kcal mol−1 from S. aureus. The studies suggested the Fe-Zn in combination with TiO2 to be a possible inhibitor of β-lactamase that can be further tested in enzyme inhibition studies.

1. Introduction

Alkanolamines have a long history of usage in natural gas treatment or gas sweetening to remove CO2 and H2S. Diisopropanolamine (DIPA), monoethanolamine (MEA), diethanolamine (DEA), and methyl diethanolamine (MDEA) are a few alkanolamines being used for the removal of CO2 in the industry [1]. The application of different alkanolamines has been reported in previous literature; for example, the Shell early gas treatment technologies use DIPA (ADIP-D and ADIP-M), MDEA, and sulfinol-D to reduce CO2 [2]. However, a problem arises when these chemicals are discharged unchecked into water bodies, resulting in high COD. In terms of ecotoxicity and biodegradability, several spent amines showed toxicity, low biodegradability, and carcinogenic impacts [3,4,5]. A proper and efficient management technology is required to reduce amine release due its toxicity.
In addition, researchers are prompted to develop new energy efficient methods and synergistic materials in response to rising environmental contamination. Climate change and water contamination caused by organic and biological pollution are among the main environmental and public health threats, in addition to contamination caused by chemicals in urbanization and industrialization [6]. Biological contamination has previously been listed as one of the top ten causes of death (1.4 million diarrhea-related deaths), with a large proportion of children under the age of five (0.525 million) [7,8]. Water contaminated with E. coli is one of many biological and organic contaminants. E. coli is a serious public health threat that is spread to humans primarily through the ingestion of contaminated water or food [9].
The AOP is a synergistic process as it can degrade organic compounds while also killing microorganisms through the generation of nonselective OH radicals. TiO2, as a photocatalyst, follows the AOP, and has been studied extensively in recent decades due to its ability in eliminating toxic contaminants like alkanolamine and microorganisms in water [10,11,12,13]. Moreover, a higher sensitivity of Gram-positive bacteria towards the bactericidal effect of TiO2 nanoparticles has been reported as compared to Gram-negative bacteria in literature [14,15]. Textile wastewater is rich in organic entities, which can be used by the microorganisms. These microorganisms cause serious health issues in humans when they enter the food chain. TiO2 NPs are reported to bind with the bacterial cell and damage the cell wall, leading to cell release which eventually causes bacterial death [16,17]. Bacterial cell wall has complex multi-layer structure, namely inner layer, peptidoglycan layer, and outer membrane. TiO2 and doped-TiO2 nanoparticles involve either the formation of reactive oxygen species (ROS) and free radicals or direct interaction with the cell surface. These ROS effectively transmit minerals and ions through cell membranes and lead cell lysis [18]. Similarly, various proteins that are involved in biosynthetic cell wall pathways may be an attractive target that could lead to bacterial death. β-lactamase is one of those proteins whose inhibition by NPs might lead to cell wall damage and bacterial cell death. Binding NPs into active β-lactamase pockets inhibits cell-wall synthesis [19]. Recently, various in silico and experimental studies demonstrated inhibition of various protein targets by metal-doped transition metal NPs. Metal or nonmetal doping acts as phase stabilizers in TiO2; Hanaor et al. suggested that the anatase to rutile phase transformation is inhibited in a system with the dopants ranked F > Si > Fe > Al in order of anatase stabilization strength [20,21]. In addition, much focus is given on the bandgap narrowing and band engineering in recent years [22].
In this research work, Fe-Zn-TiO2 nanocomposites are reported for the degradation of DIPA and inactivation of biological contaminants. Moreover, energy efficiency was achieved by shifting the absorption edge from UV to visible region. This research work shall not only be significant for the degradation of organic pollutant (DIPA) from the wastewater but also for the inactivation of pathogens such as E. coli and S. aureus. In addition, the bacterial inactivation pathway was studied through molecular docking studies to gain more insights into potential targets corresponding to the inactivation of bacteria.

2. Results and Discussion

2.1. Synthesis Parameters Optimization

2.1.1. Effect NC Synthesis Methods

The effects of different synthesis methods, including WI, co-precipitation (Co-P), and sol gel (SG) method, were evaluated for degradation of DIPA (percent COD removal) under visible light irradiation. Moreover, metal loading was 5% with variable Fe-Zn ratio (0, 0.1, 0.2, 0.3, 0.4, and 0.5) in each photocatalyst. However, the calcination temperature (300 °C) and pollutant concentration (300 mg L−1) were kept constant for each synthesized photocatalyst. The effect of these two variables were evaluated for best performing NC in the preceding section. Effect NC synthesis methods are depicted in Table 1. The NC synthesized through the WI method showed better COD removal (66.5%) compared to Co–P (30.5%) and SG (21.8%) methods. In addition, 0.1Fe-0.4Zn-TiO2-300 synthesized through the WI method was selected best among other ratios of Fe-Zn. Previous studies reported that the higher zinc ratio in the NC leads to a large surface area which improves the photocatalytic activity [23].

2.1.2. Effect of Calcination Temperature

The best NC (0.1Fe-0.4Zn-TiO2) obtained through the WI method in the previous section was further optimized for different calcination temperatures (200, 300, 400, and 500 °C). Similar reaction conditions were followed for all reactions, i.e., NC dose (1 mg L−1), DIPA concentration (300 mg L−1), working pH, and ambient temperature. The results depicted in Figure 1a revealed that an increase in the calcination temperature increased the COD removal i.e., 38.9, 43.7, 66.5, 44.9, and 42.2% for uncalcined, 200, 300, 400, and 500 °C, respectively. According to the findings, higher calcination may change the physical behavior of the material, which results in the reduction of the photocatalytic activity. The changes in physical attributes might be related to the surface area, pore diameter, and/or metal decomposition; hence, all these properties affect the photocatalysts performance [24,25].

2.1.3. Effect of Metal Loading (wt%)

The effects of different metal loading (wt%), including, i.e., 0, 1, 3, 10, 15, and 20 wt%, were evaluated for percent COD removal. For all the weight percent preparations, the optimal metal ratio (0.1Fe-0.4Zn) was used, obtained during the synthesis method and calcination temperature optimization. Results depicted in Figure 1b show 17.45, 25.41, 38.18, 66.5, 31.45, 23.07, and 9.20% COD removal for 0, 1, 3, 5, 10, 15, and 20 wt%, respectively. These results reveal that the dopant (metal) concentration has a significant impact on the photocatalytic activity of TiO2. Excessive dopant coating may impede the operational sites of TiO2, resulting in limited light penetration to the photocatalyst’s surface [26,27], and as a result, the number of photogenerated e and h+ reduced which subsequently lowered the photocatalytic activity [28]. Furthermore, previous studies reported that the increase in metal loading results in agglomeration, leading to reduced photocatalytic efficiency [29,30].

2.1.4. Effect of Titania Phase

The effects of TiO2 phase i-e anatase (TA) and anatase-rutile mixture (TAR) were evaluated for DIPA degradation (%COD removal) with the optimized synthesis method (WI), metal loading (5%), metal ratio (0.1Fe-0.4Zn), and calcination temperature (300 °C). Reaction studies were conducted with the same experimental condition reactions. i.e., NC dose (1 mg L−1), DIPA concentration (300 mg L−1), working pH, and ambient temperature. Results on the effect of TiO2 phase composition (anatase (TA), anatase and rutile (TAR)) on % COD removal are presented in Figure 1c. Overall performance of TAR (mixture of phases) was better compared to TA (single phase anatase); however, NC synthesized using anatase phase (TA) and 5 wt% 0.1Fe-0.4Zn had significantly higher efficiency. Synthesis parameters optimization was concluded based on the best performing NC, i.e., 5 wt% metal loading for 0.1Fe-0.4Zn-TiO2-300 for the reaction optimization parameters. Our results are in agreement with previous studies, which showed that metals act as anatase stabilizers and cationic dopants like Fe and Cu are more stable in Ti substitutional lattice positions [20,21].

2.2. Reaction Parameters Optimization

The NC (0.1Fe-0.4Zn-TiO2-300) optimized during synthesis optimization was further evaluated for different reaction parameters such as NC dose, light intensity, initial DIPA concentration, and irradiation duration to achieve the maximum efficiency against DIPA degradation in terms of % COD removal.

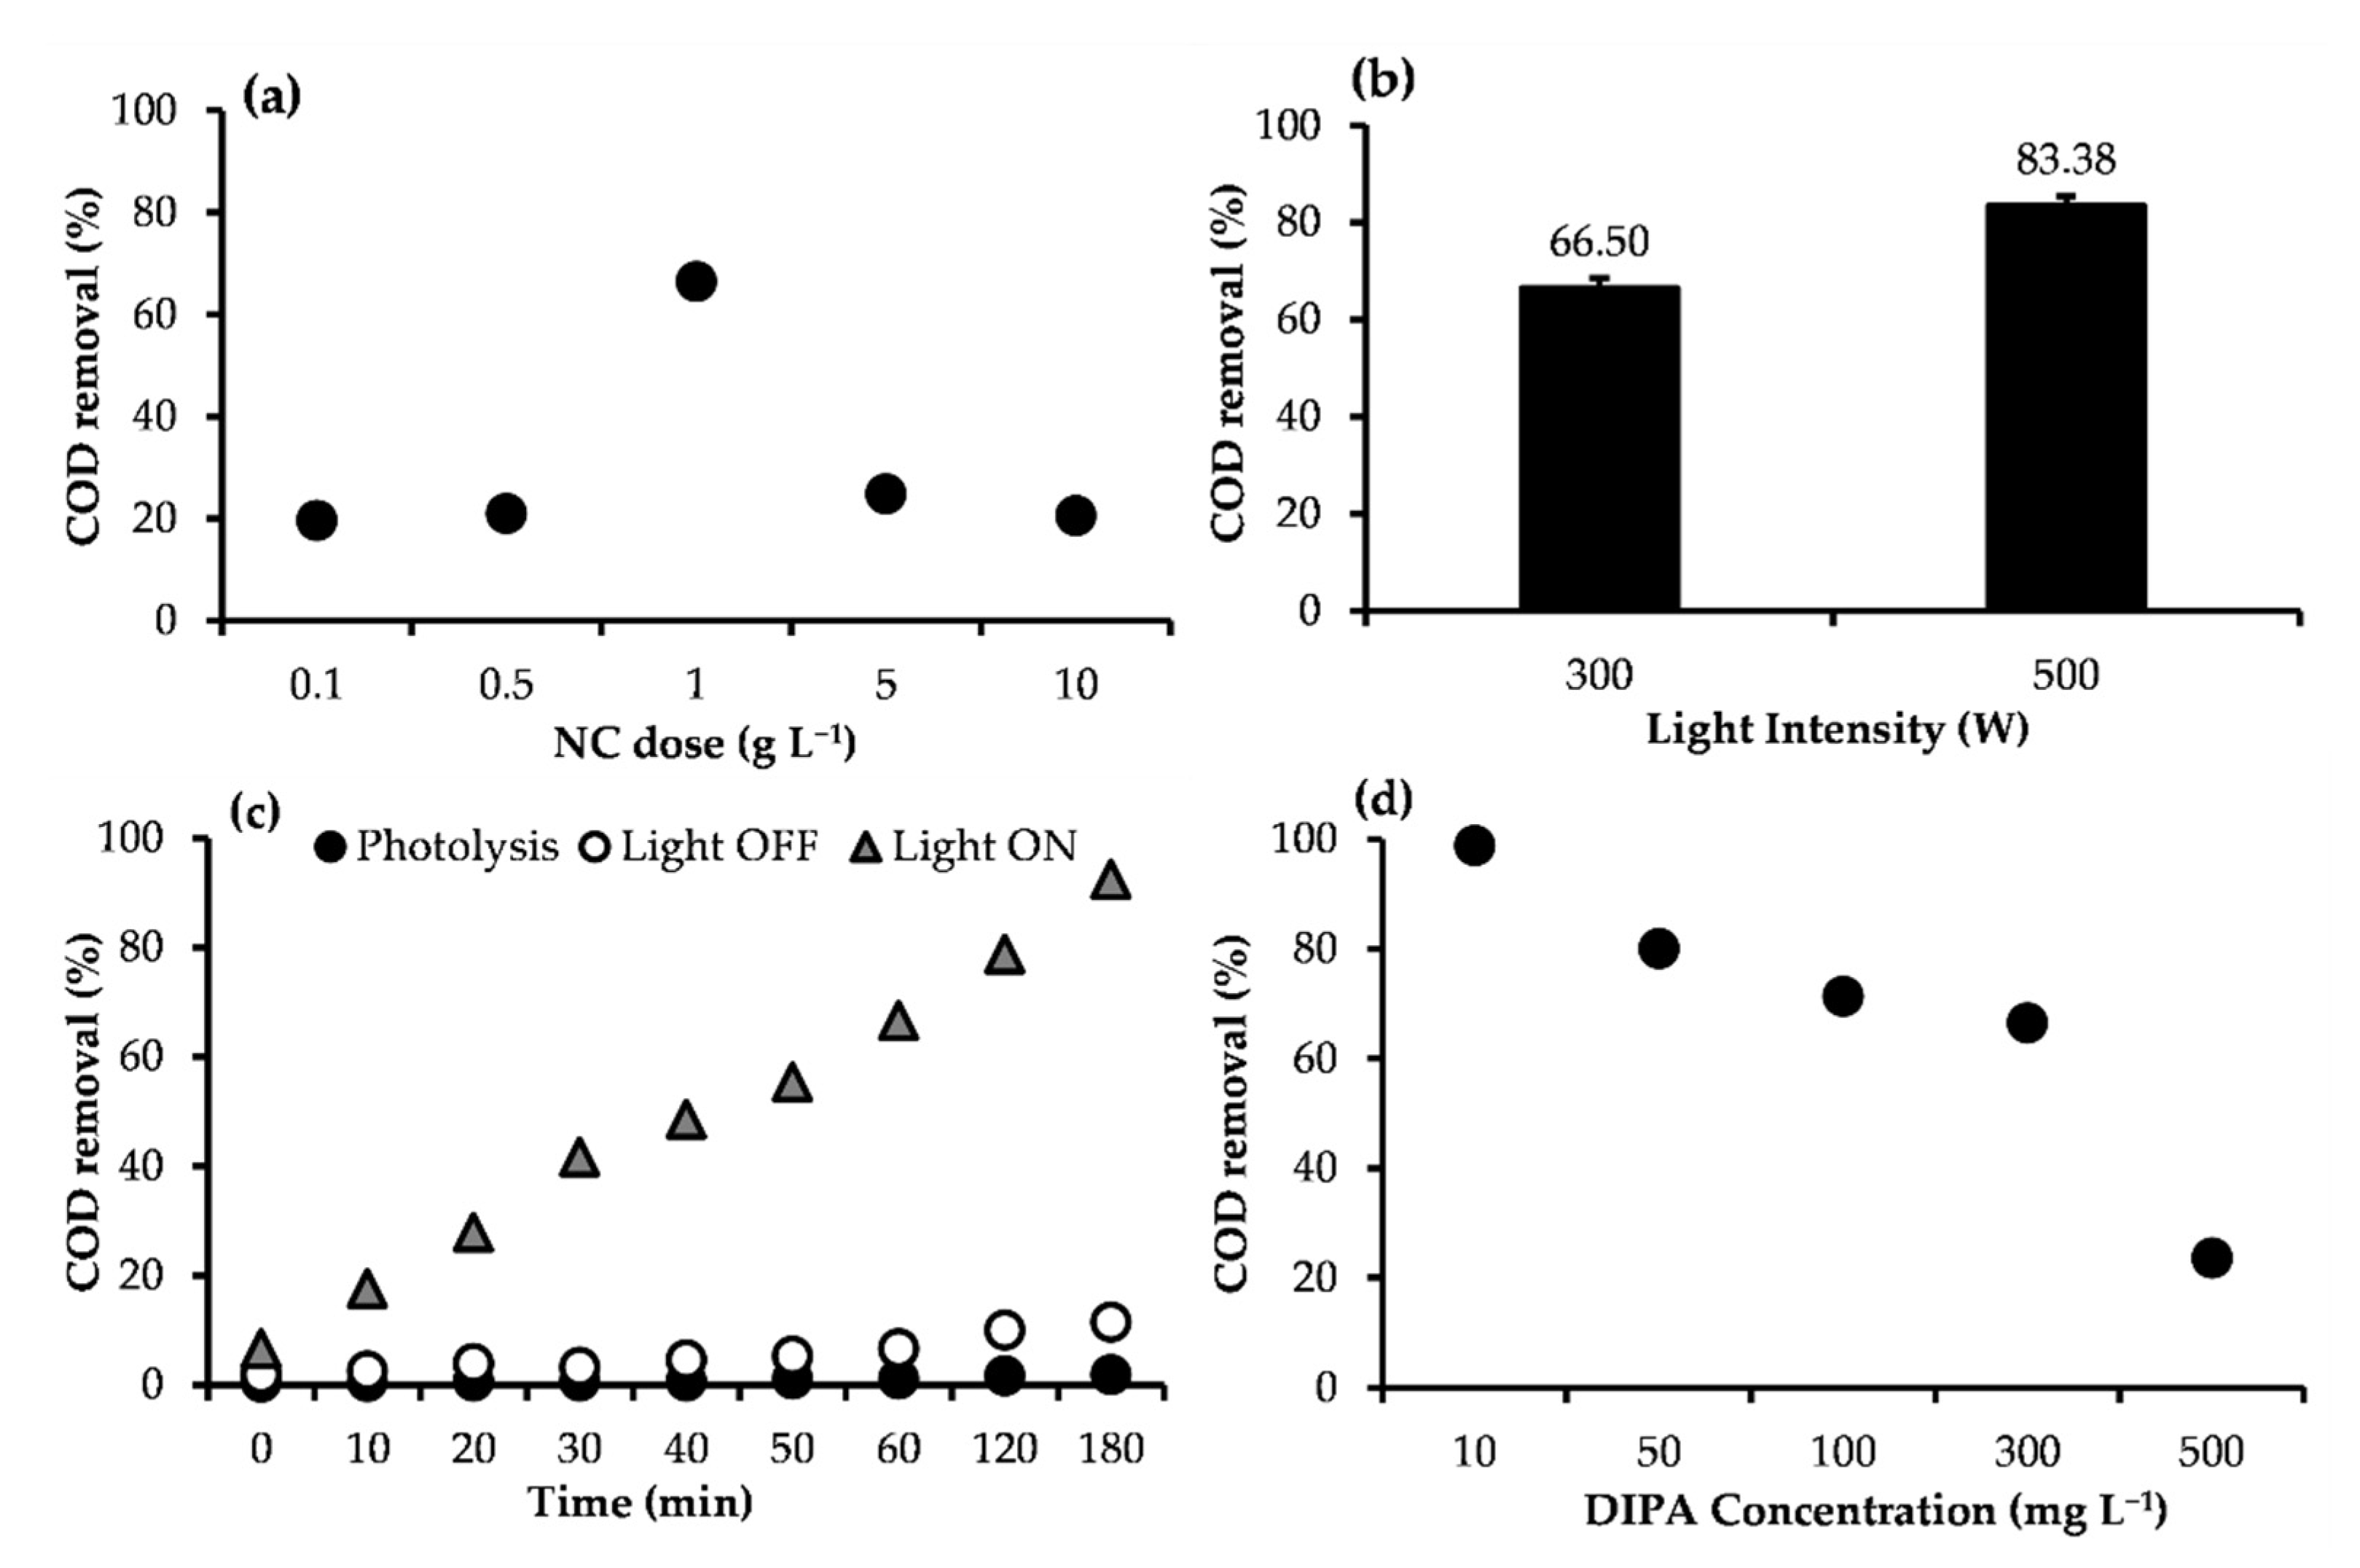
2.2.1. Effect of NC Dose

Figure 2a shows that the gradual increment in NC dose led to higher % COD removal of DIPA. The optimum NC dose was 1.0 g L−1 with 66.5% COD removal in 60 min; however, further increase from 1.0 g L−1 decreased the % COD removal (20.6%). The increased degradation ensued because of the higher number of available surface area that increased photon absorption, which in turn resulted good photocatalytic behavior of the photocatalyst. Nevertheless, increasing the NC amount (1.0 g L−1 to 5 g L−1 and above) might be related to the excessive coverage of the photocatalyst surface that in turn decreased the photon absorption [31].

2.2.2. Effect of Light Intensity

Significant improvement in the photodegradation of DIPA (83.4%) was achieved with an increase in light intensity (300 and 500 W) as depicted in Figure 2b. Light intensity is one of the important parameters in photocatalytic reactions as the light intensity influences the electron transfer rate from valance band (VB) to conduction band (CB) and the formation rate of e/h+ pair [32,33]. Previous studies with similar results reported that the reaction rate is directly associated with the light intensity; any increase or decrease in intensity directly influenced the reaction rate because of the generation of more photons, thereby generating the e/h+ pairs [33,34,35,36].

2.2.3. Effect of Irradiation Time

Other than light intensity, the exposure duration is among various significant parameters responsible for better NC efficiency. Figure 2c shows photocatalytic degradation increased with time; complete COD removal (100%) was achieved in 190 min. In addition, in control experiments, photolysis (without NC) and only NC (without light), marginal DIPA degradation was observed. It can be concluded that both the presence of an irradiation source and light intensity are crucial to better photocatalytic efficiency.

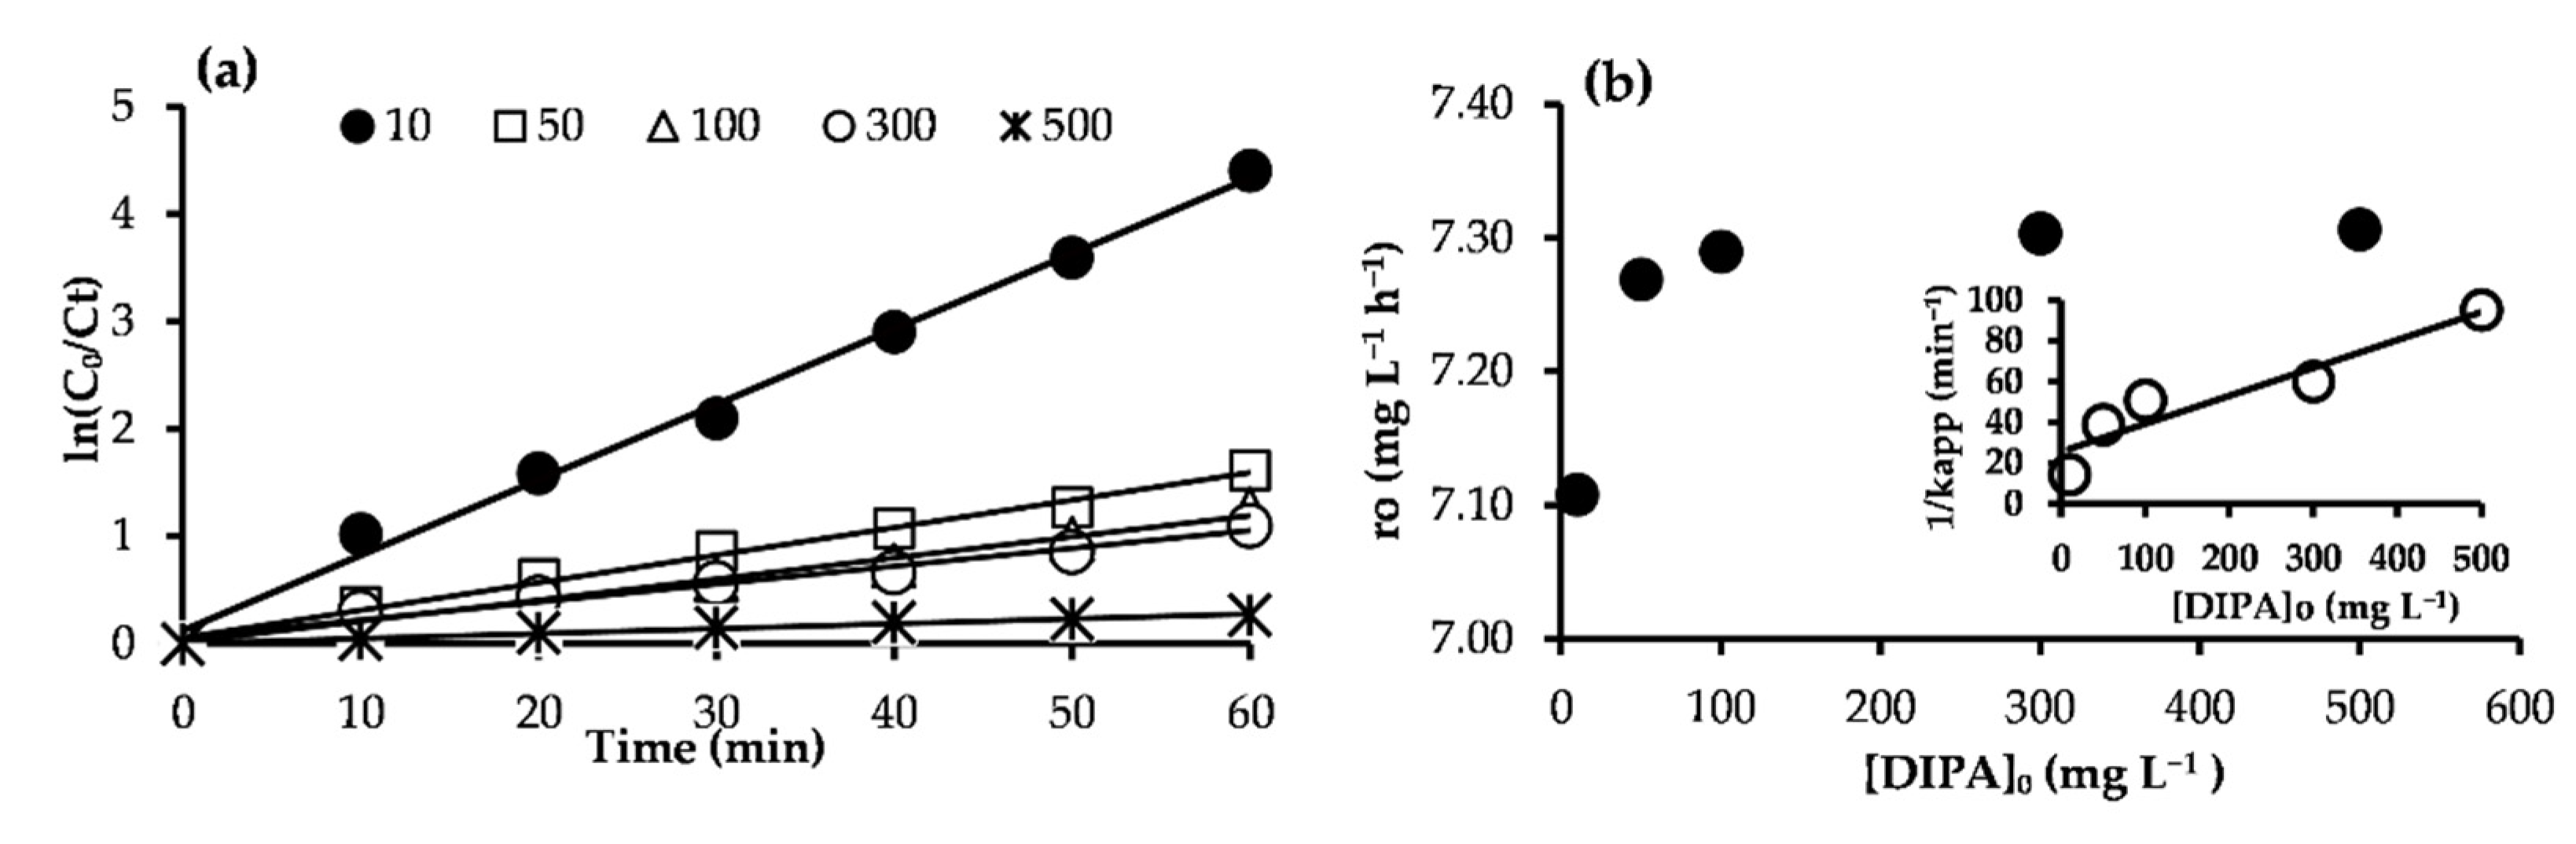
2.3. Photodegradation Kinetics

The kinetics for the photodegradation of DIPA were studied using the optimized NC (0.1Fe-0.4Zn-TiO2-300) against different initial DIPA concentrations (10–500 mg L−1). The reaction conditions were kept same for the experiments, including visible light irradiation (300 W), 1.0 g L−1 NC dose, working pH, and ambient temperature (24 ± 2 °C). According to the results depicted in Figure 2d and Figure S1 (supplementary materials) the COD removal improved with time, but there was a declining trend when DIPA concentrations were increased. In addition, a linear relationship was obtained by plotting ln (Co/Ct), therefore, photocatalytic degradation of DIPA followed the pseudo-first-order kinetics (Figure 3a). Kapp was obtained from the slope of linear regression.
Moreover, the Langmuir–Hinshelwood model [37] was used for quantitative evaluation of DIPA photodegradation using 0.1Fe-0.4Zn-TiO2-300 NC under visible light. The L–H plot is depicted in Figure 3b. The KC and Kads were estimated from the plot of 1/Kapp against [DIPA]o (inset Figure 3b), the value of KC and Kads were 7.3099 min−1 and 3.5100 L mg−1, respectively, showing strong adsorption capacity. A stronger adsorption capacity is always the major factor contributing to the performance of photocatalyst [38]. Figure 3b depicts the relationship between the photocatalytic degradation rate of DIPA and different initial concentrations of DIPA; the plot describes the fact that the photocatalytic degradation rates increased with an increment in [DIPA]o. However, it became constant with higher concentrations. Reports from previous studies have shown that the increasing quantity of adsorbed species (DIPA) on the photocatalyst surface could be a primary factor for lower photodegradation rates with increased pollutant concentrations as reduced number of photons would reach the NC surface [39,40].

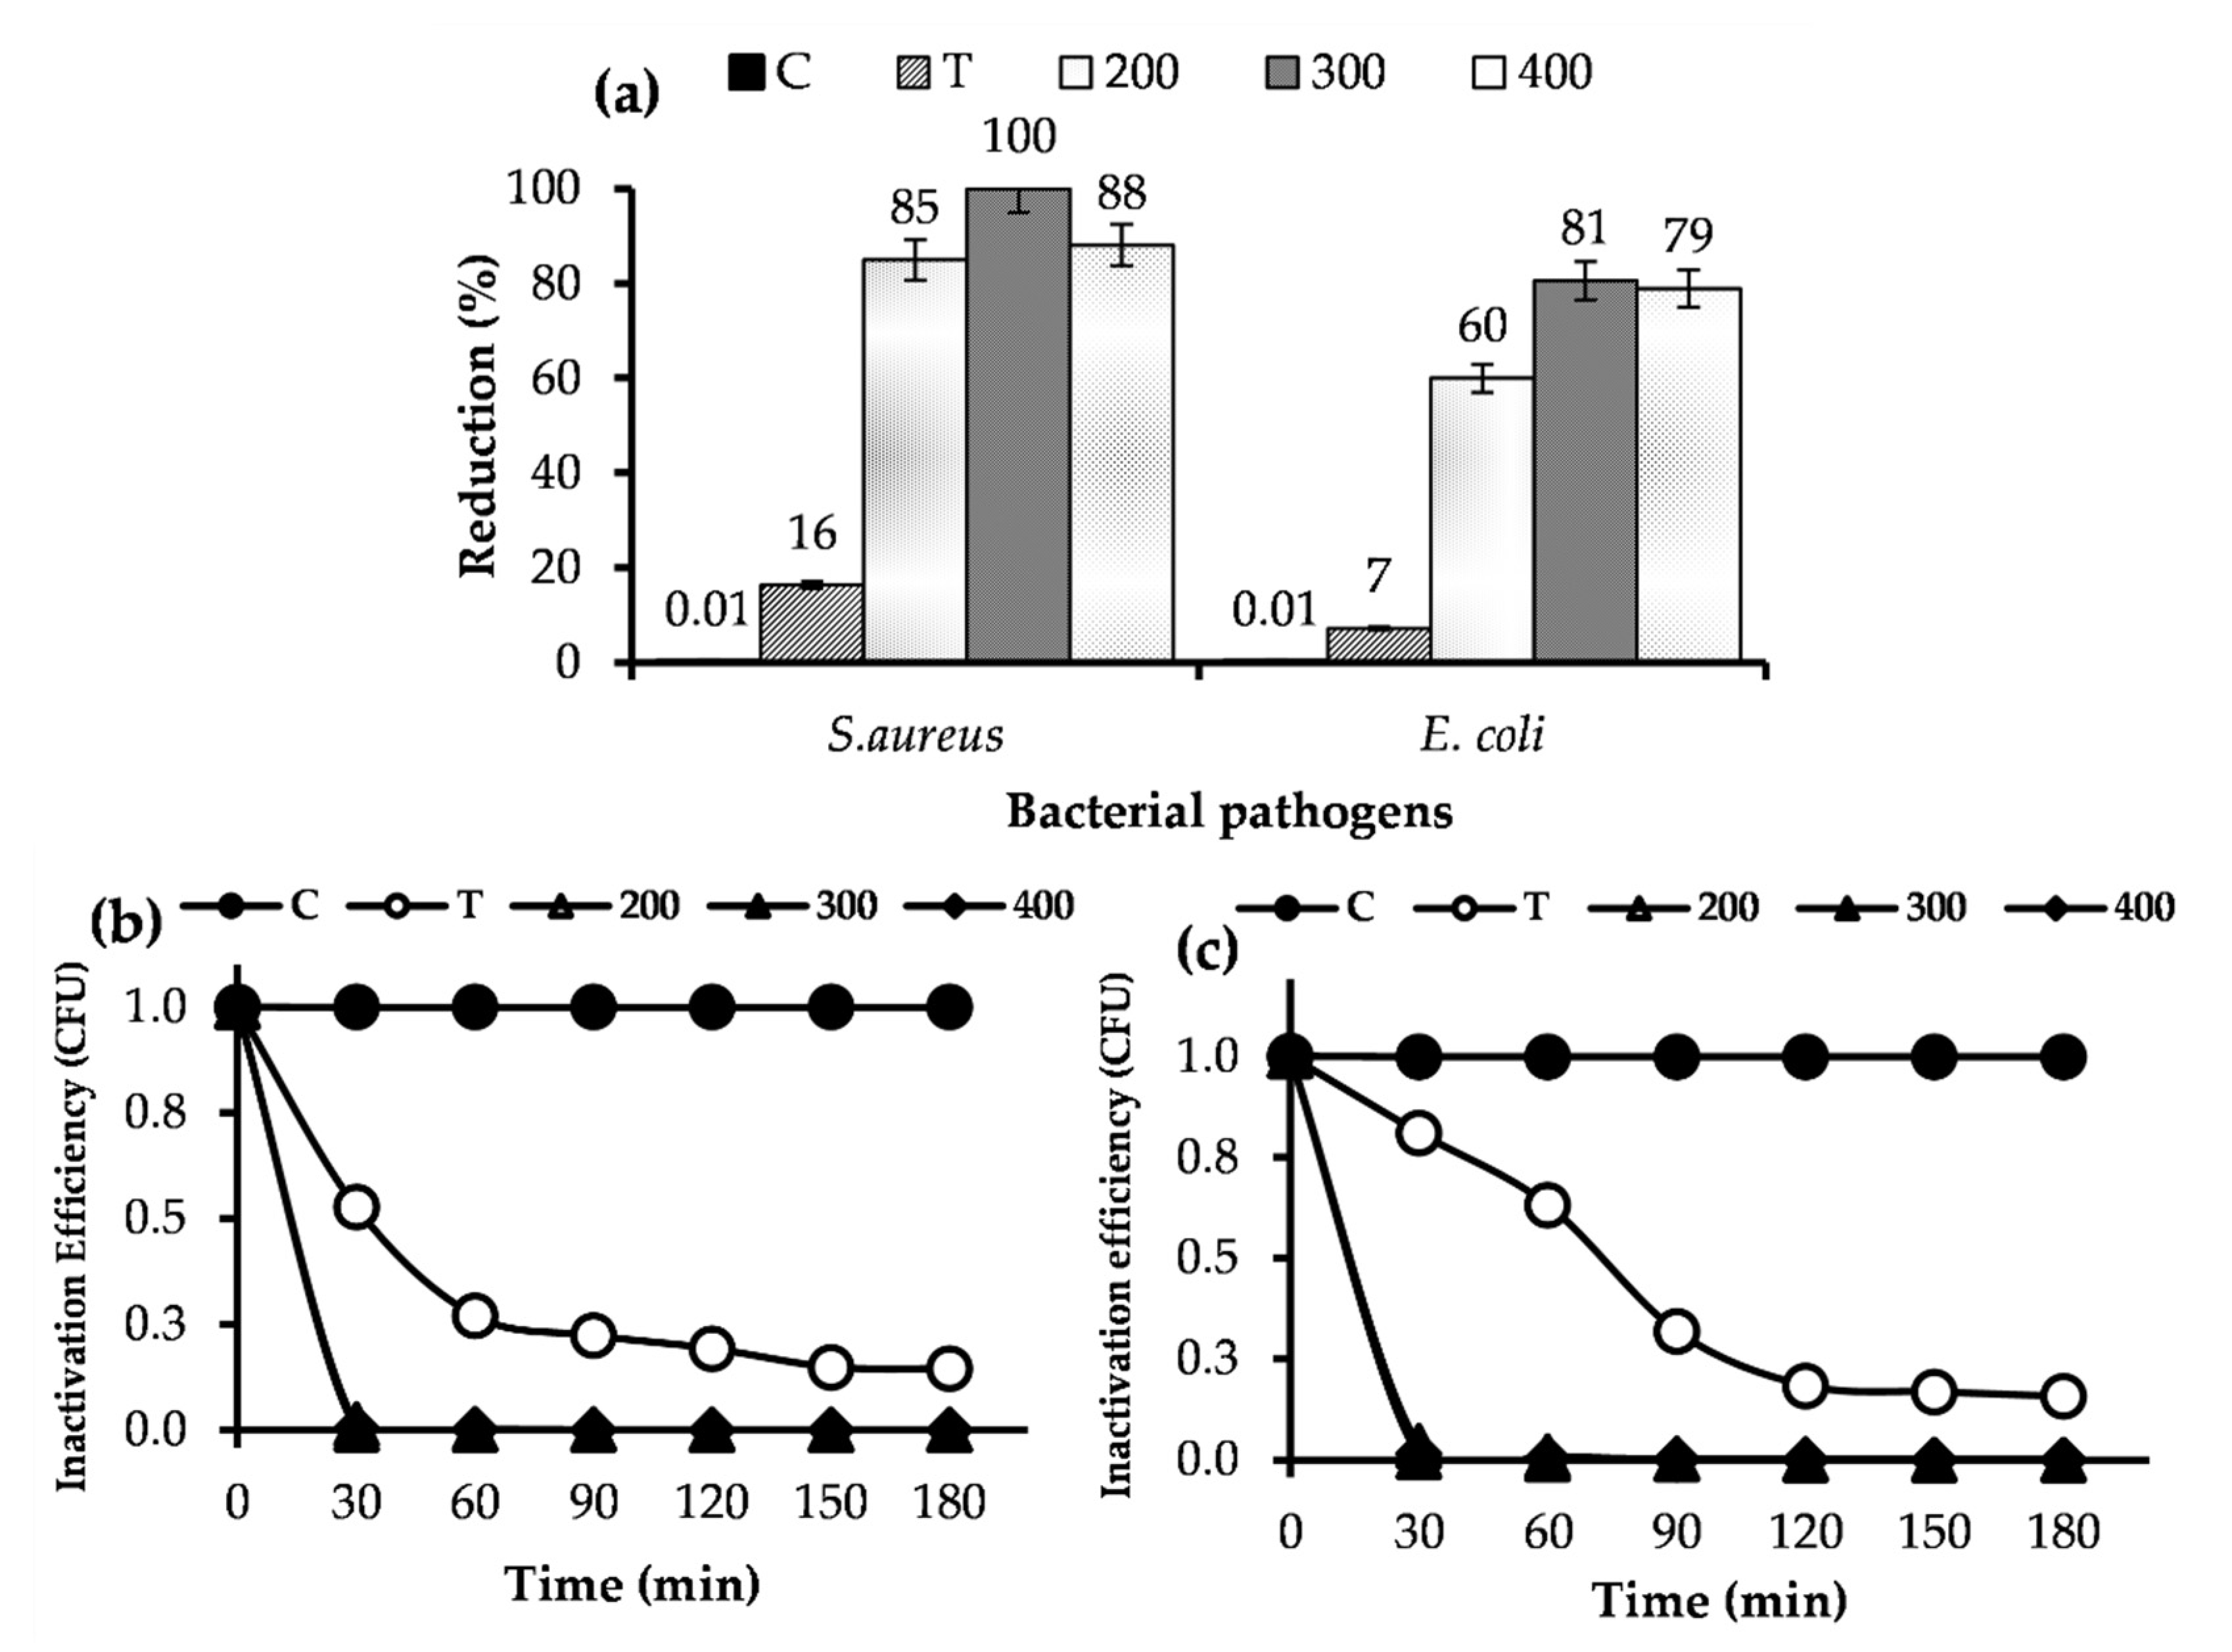
2.4. Photocatalytic Bactericidal Performance Evaluation

Figure 4a depicted the bactericidal performance of the control (without light), anatase TiO2 (TA), 0.1Fe-0.4Zn-TiO2-200, 0.1Fe-0.4Zn-TiO2-300, and 0.1Fe-0.4Zn-TiO2-400 against selected pathogenic bacterial strains (E. coli and S. aureus). NC 0.1Fe-0.4Zn-TiO2-300 showed 100% growth reduction against S. aureus compared to E. coli (81.0%) within 90 min of visible light irradiation. MRSA 252 responded more to the impact of 0.1Fe-0.4Zn-TiO2-200 (85%) and 0.1Fe-0.4Zn-TiO2-400 (88%). In addition, the kill time required to completely inactivate test bacterial strains was determined by measuring inactivation efficiency. Figure 4b represents the inactivation efficiency (kill time analysis) of 0.1Fe-0.4Zn-TiO2-300 against E. coli and S. aureus. After 180 min of kill time analysis, 100% growth inhibition was observed against S. aureus, and 90.2% against E. coli.

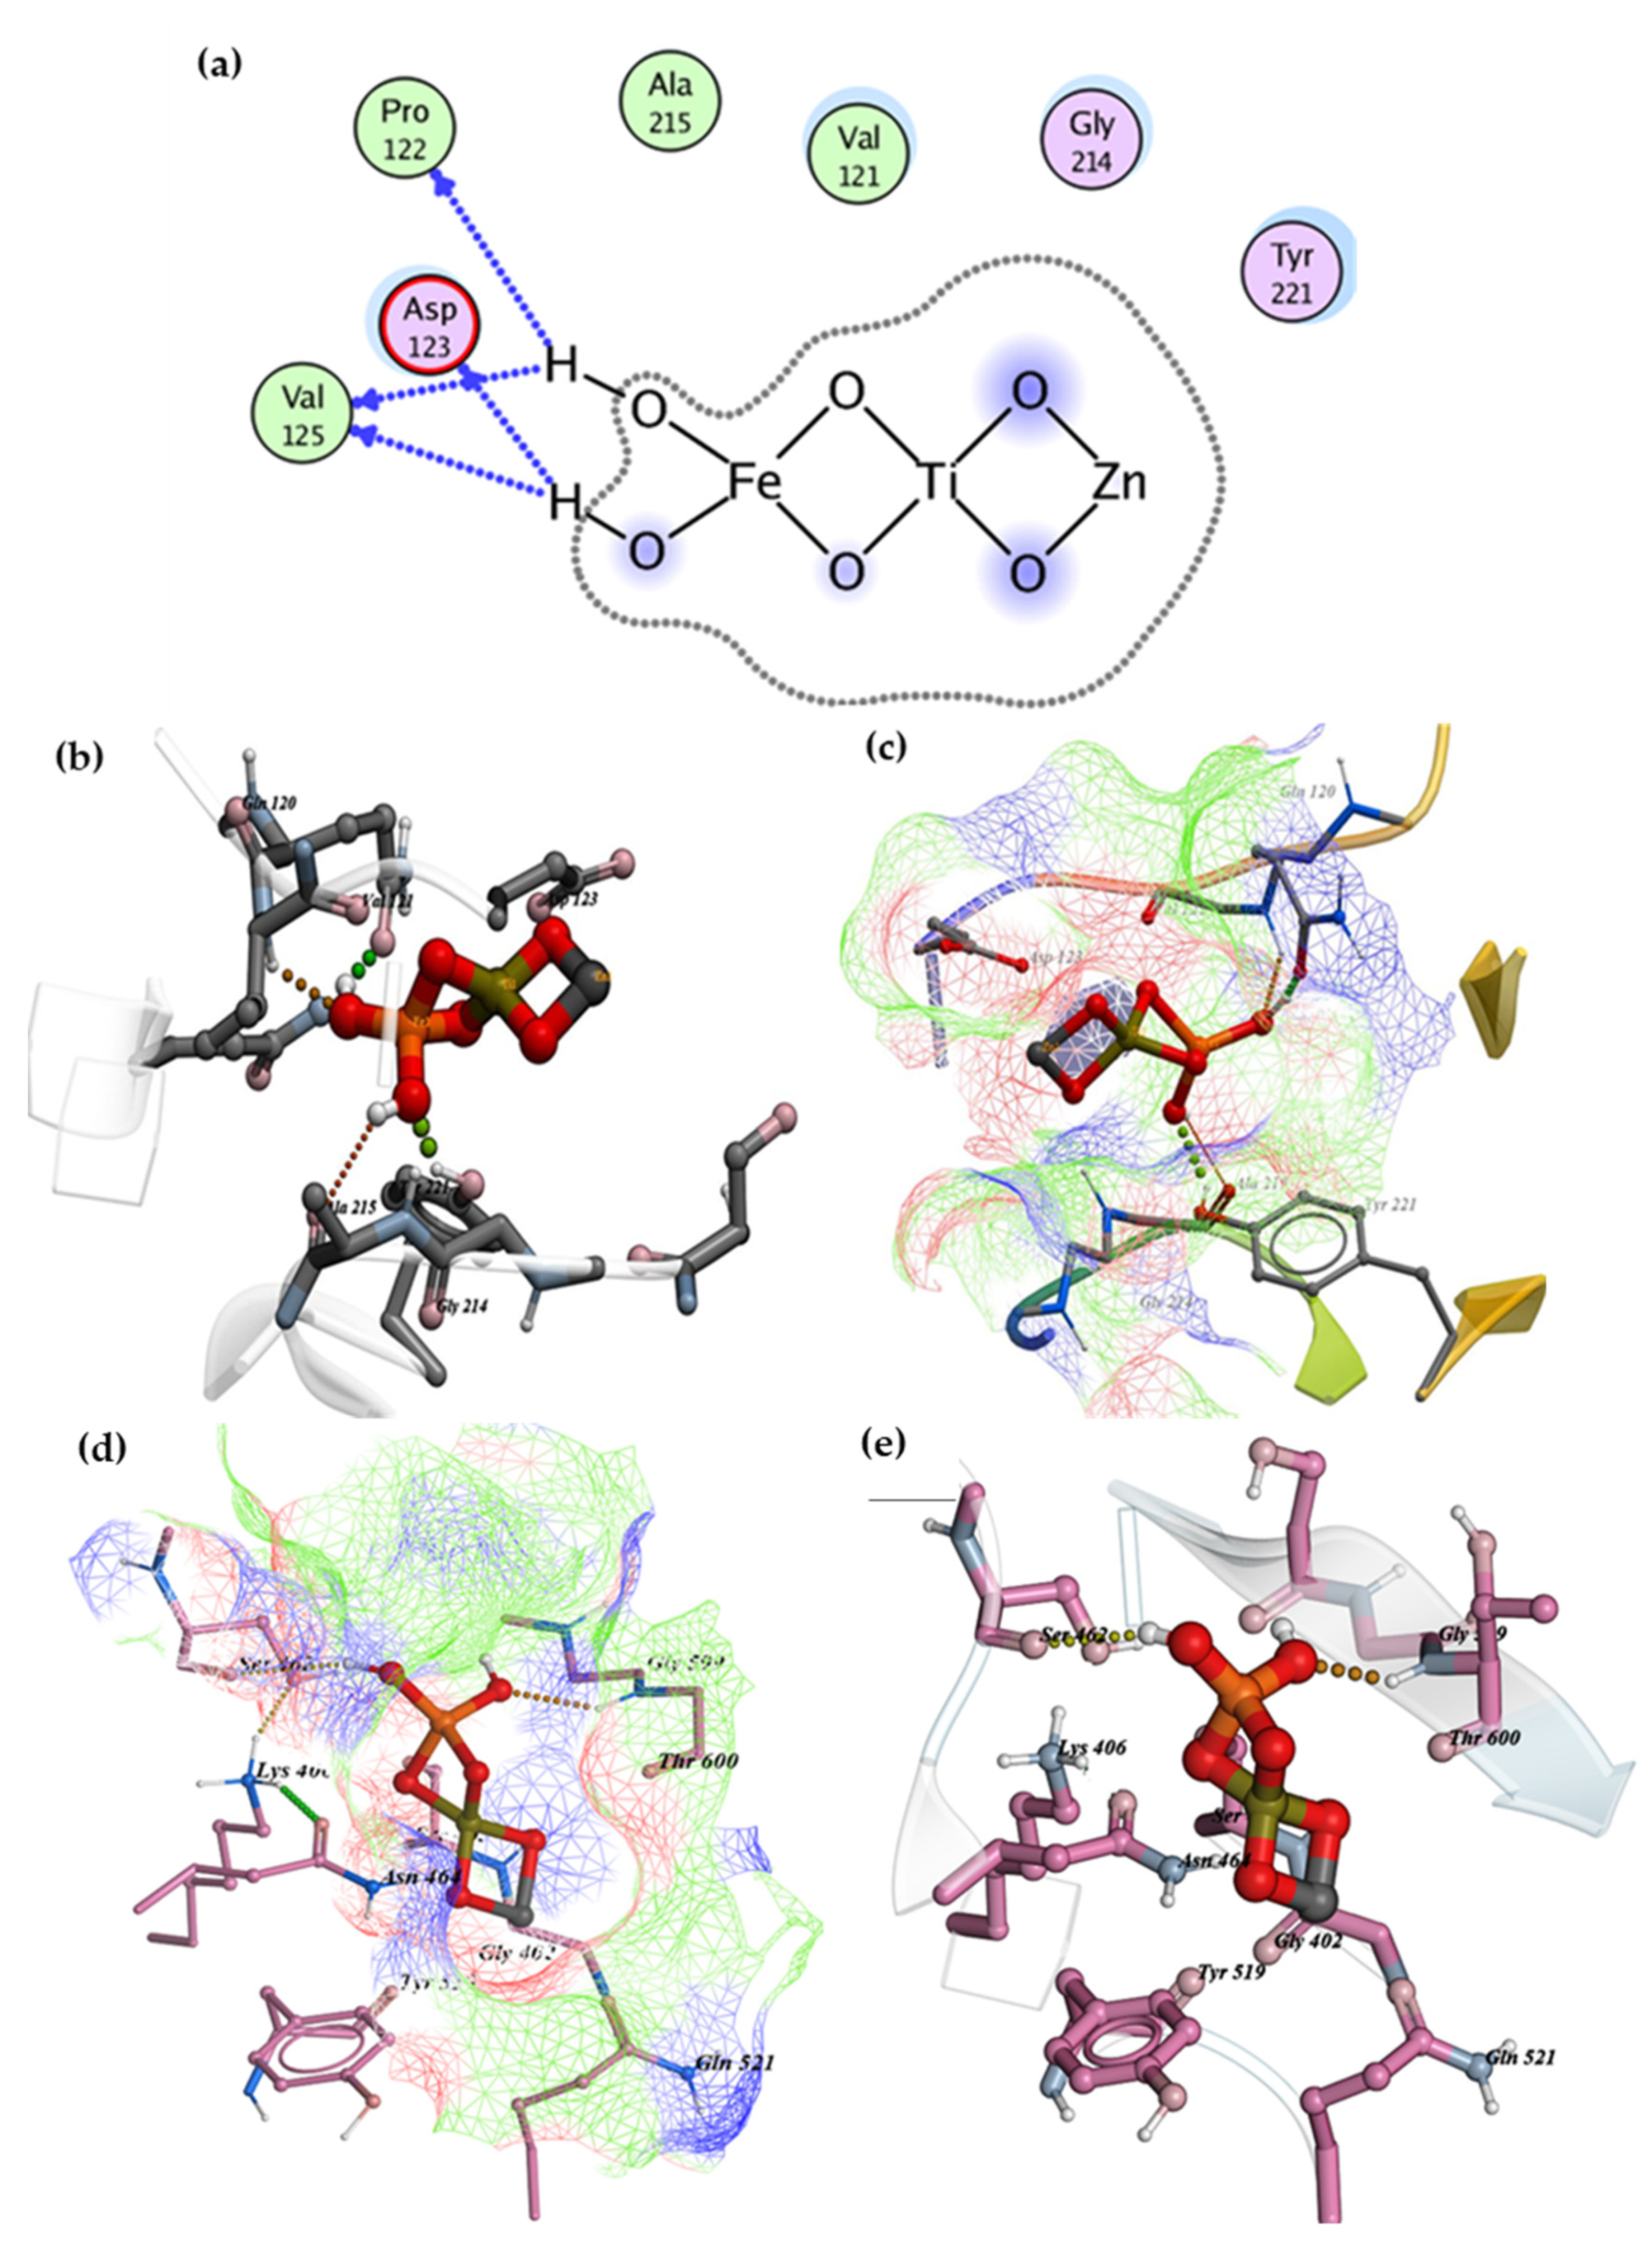
2.5. Molecular Docking Studies

Considering the bactericidal efficacy of 0.1Fe-0.4Zn-TiO2-300 NC against E. coli and S. aureus, molecular docking studies against the β-lactamase enzyme as a potential target were carried out. The docking score obtained for best docked conformation was −5.72 kcal mol−1. The key amino acid residues, i.e., Pro122, Asp123, and Val125 showed H-bonding interaction with functional groups of Fe-Zn-TiO2 NC as depicted in Figure 5a. In addition, Figure 5b,c represents a three-dimensional view of docked NC along with pocket surface. Similarly, 0.1Fe-0.4Zn-TiO2-300 NC showed a good binding score of −3.46 kcal mol−1 against β-lactamase from S. aureus and its binding interaction pattern (i.e., H-bonding with Ser462 and Thr600) is depicted in Figure 5d,e The good binding score and interaction of NC inside active pocket suggested that it could be a possible inhibitor of β-lactamase that should be investigated further for its enzyme inhibition studies.

2.6. Energy Efficiency Analysis

The energy efficiency of the synthesized NCs was estimated using Equation (7). The efficiency is reported in terms of electrical energy (KW h m−3) consumed for degradation of 1000 L of DIPA. The results are depicted in Table 2. The best performing NC synthesized through WI method (0.1Fe-0.4Zn-TiO2-300) only consumed 457.40 KW h m−3 of electrical energy, while energy consumption for 0.1Fe-0.4Zn-TiO2-300 NC synthesized through Co-P was 1374.52 KW h m−3 and 0.5Fe-0.0Zn-TiO2-300 synthesized through the SG method 1575.18 KW h m−3.

2.7. Physico-Chemical Characterization

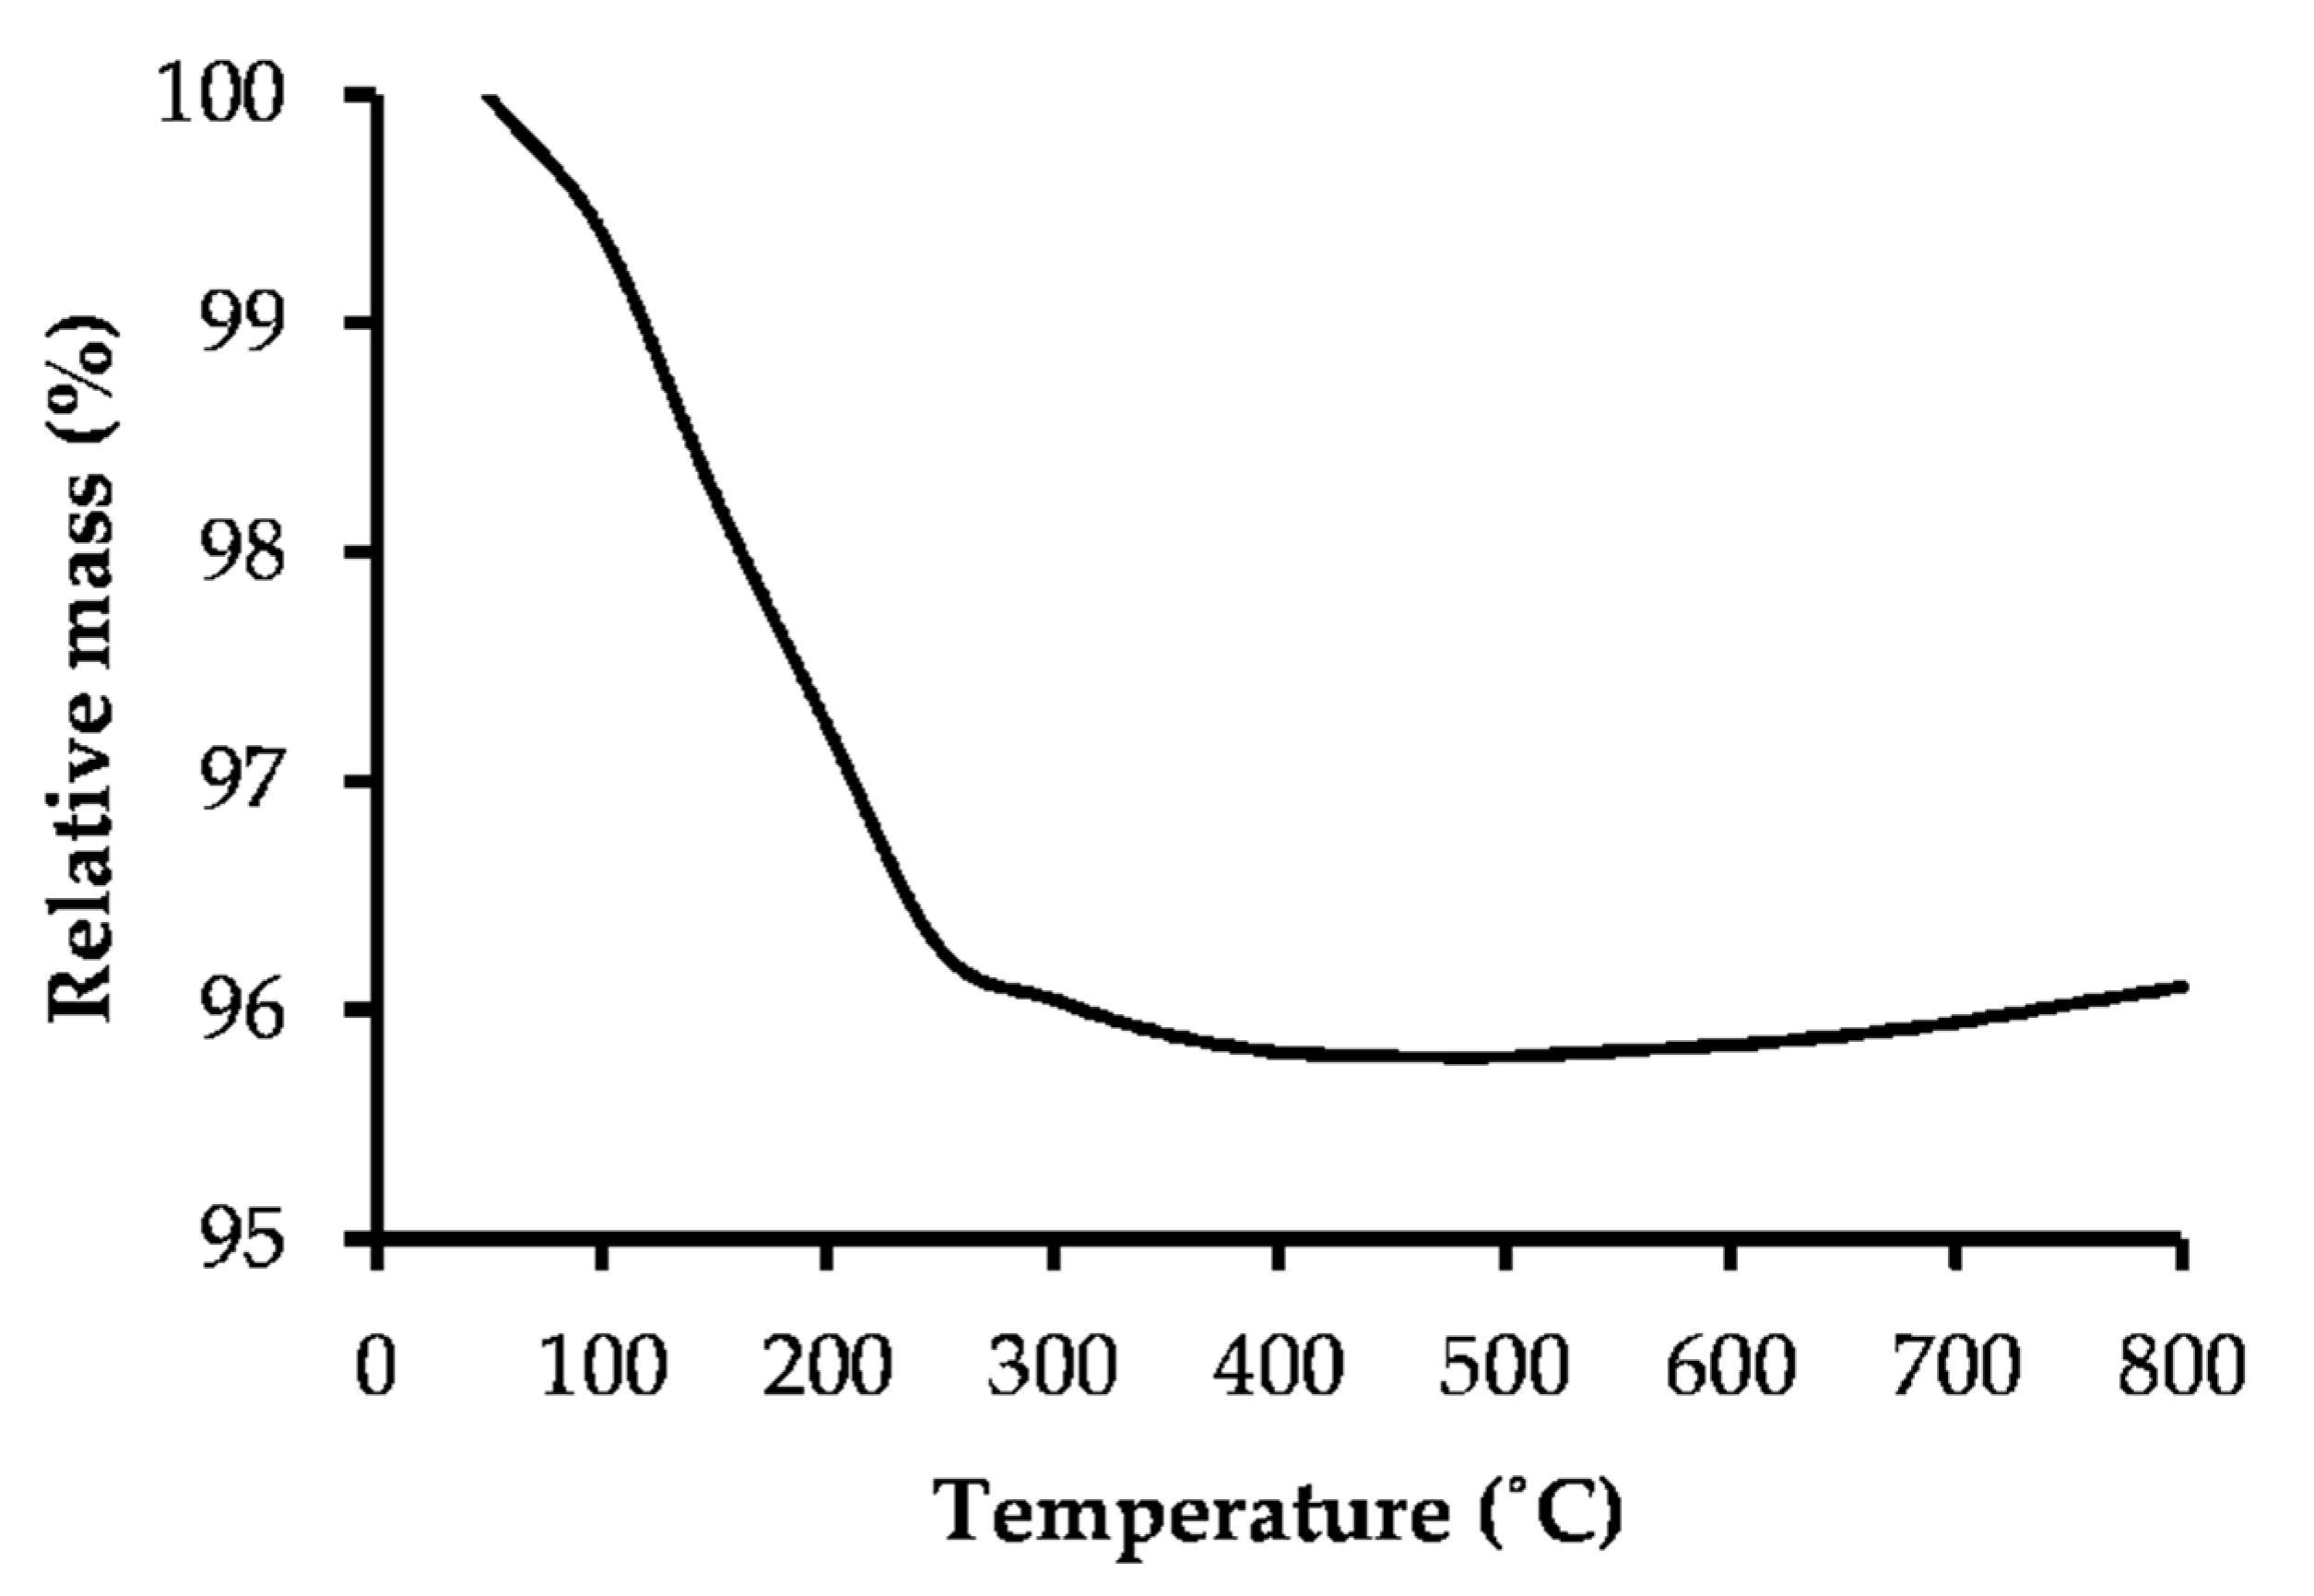
2.7.1. Thermal Stability

TGA was conducted to monitor the thermal stability and to estimate optimum calcination temperatures for the as-synthesized NC. The decomposition temperature of the as synthesized NC can be estimated using this TGA. Decomposition temperature is the temperature at which the raw photocatalyst begins to decompose and the photocatalyst achieves thermal stability. The weight loss profile of the doped titania sample prepared using WI method (5 wt%-0.1Fe:0.4Zn-TiO2) is presented in Figure 6. The evaporation of physically adsorbed moisture can be seen as an abrupt, steeply decomposition with a 3.898% weight loss step (50–250 °C), followed by a bit stable step from 250–800 °C represents the decomposition of the Fe(NO3)2 and Zn(NO3)2, to form iron oxide and zinc oxides, respectively [30,41,42]. Total weight loss was 3.898%. Main decomposition steps proposed for tested samples are as in Equations (1) and (2).
Fe ( NO 3 ) 2 FeO ( g ) + O 2 ( g )
Zn ( NO 3 ) 2 ZnO ( s ) + 2 NO 2 ( g ) + O 2 ( g )

2.7.2. Surface Functional Groups (FTIR)

Figure 7 shows the FTIR absorption spectra of TiO2 (TA), raw (uncalcined) and calcined 0.1Fe-0.4Zn-TiO2-300 NC. Some of the identified, prominent peaks observed from the spectrums are tabulated in Table S1 (Supplementary material). The broad band around 3400 cm−1 was attributed to O–H stretching, and the peak near 1623, 1626, and 1634 cm−1 to H–O–H bending and related to physically absorbed moisture [30,43]. The IR band observed from 400–900 cm−1 corresponds to the Ti–O stretching vibrations [44,45,46]. Almost similar peaks were observed in rest of the photocatalysts. The presence of the intense peak at 1384 cm−1 is associated with the nitrate (NO3) group usually identified when dopant metal nitrate salts are used as precursors [47,48].

2.7.3. BET Surface Area
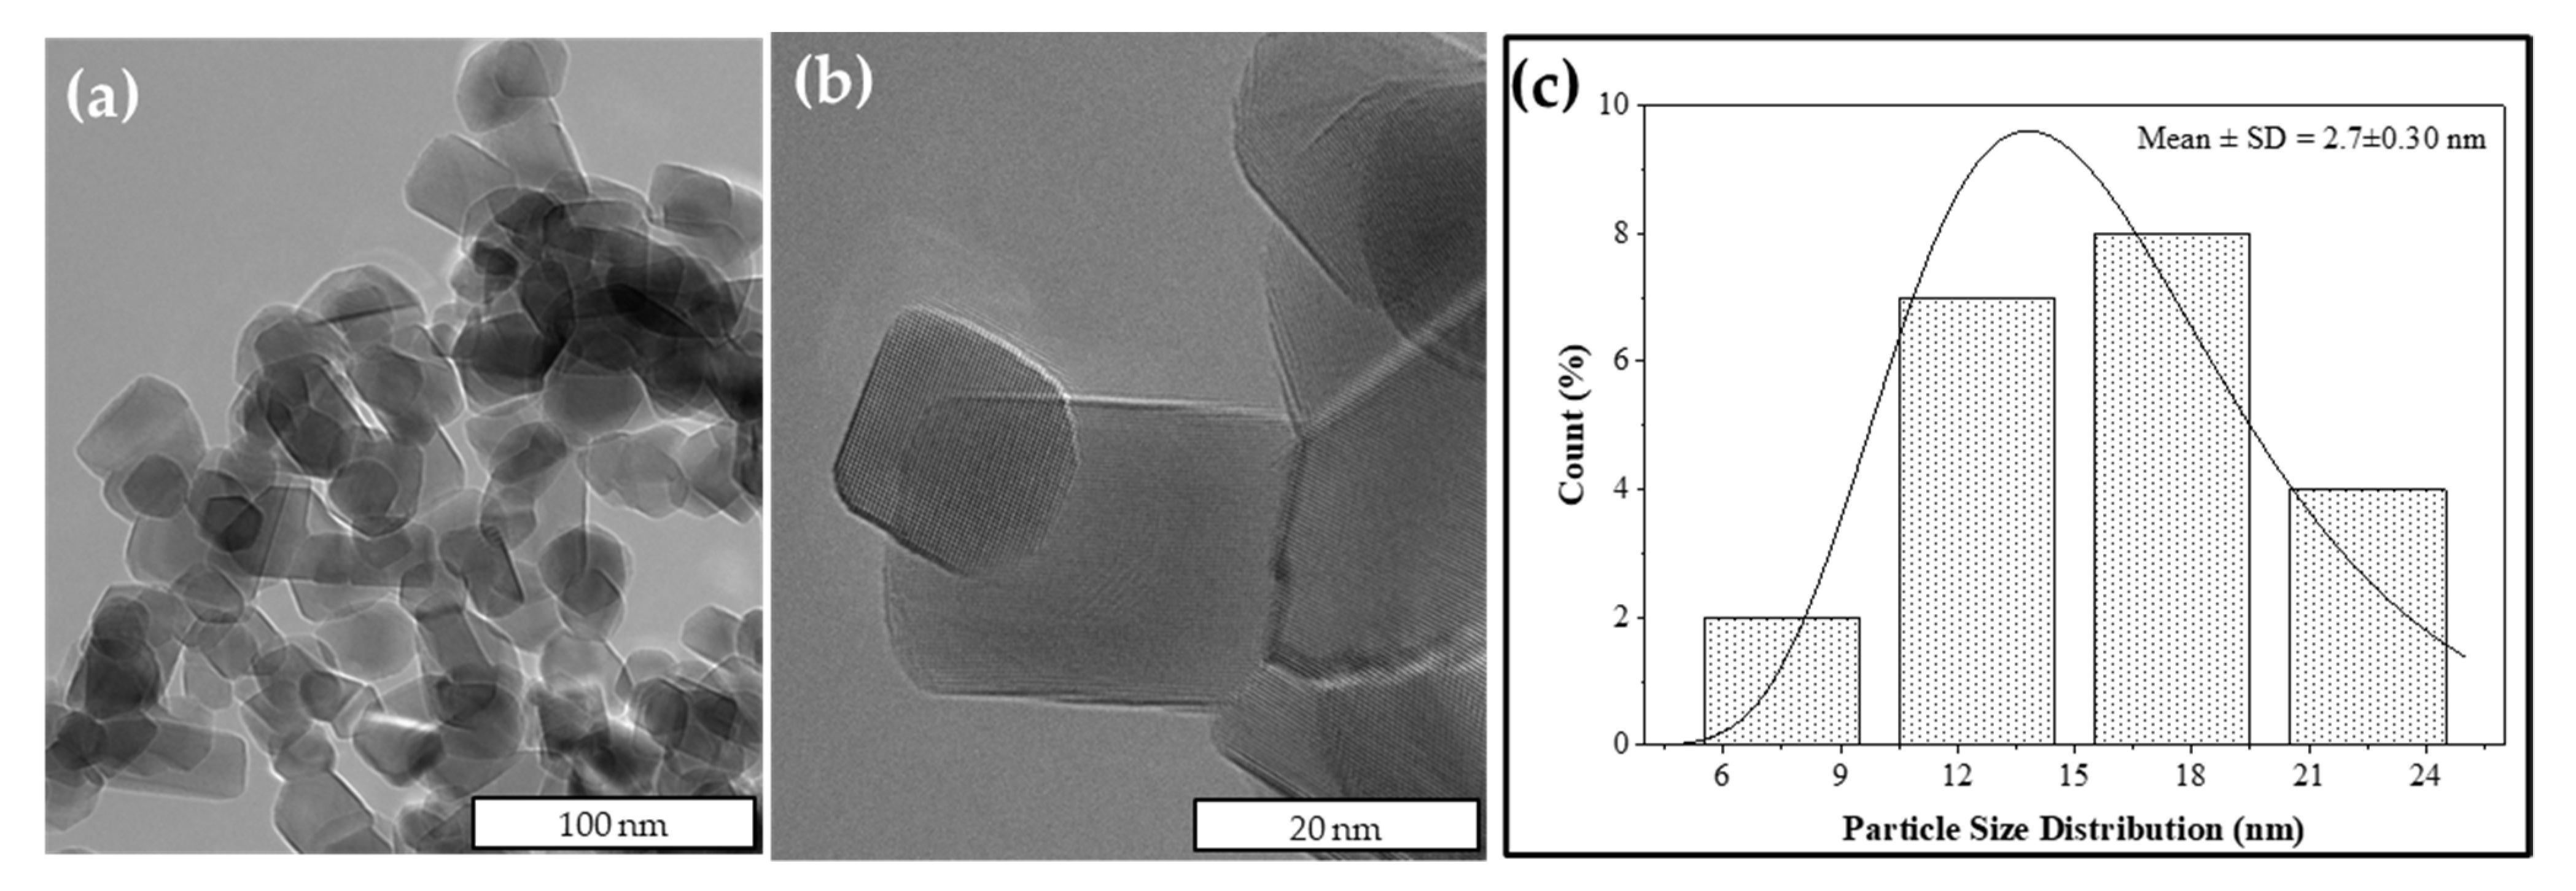
To relate the photocatalytic efficiency of the prepared NC, a material surface area is an important parameter among the physical properties. The BET surface area trend was reported to be directly associated with the primary particle size of the NC anatase phase [49]. In the present study, the effect of different photocatalyst calcination temperatures was monitored, as increasing calcination temperatures can result in clumping or agglomeration of solid particles, thus reducing surface area.
Figure 8 shows the N2 adsorption-desorption isotherm for the NC used in the present study. TA and 0.1Fe-0.4Zn-TiO2-200 displayed IUPAC of Type III isotherm characterized as non-porous products that shows weak interaction between the adsorbent and the adsorbate while 0.1Fe-0.4Zn-TiO2-300 and 0.1Fe-0.4Zn-TiO2-400 NC displayed Type IV isotherm, corresponding to mesoporous material, the solid material with pores size between 2–50 nm [50]. Detailed surface analysis of TA, 0.1Fe-0.4Zn-TiO2-200, 0.1Fe-0.4Zn-TiO2-300, and 0.1Fe-0.4Zn-TiO2-400 are shown in Table 3. The BET surface area was 17.743 m2 g−1 for TA. The slower crystallization at lower calcination temperatures (200 °C) led to smaller surface area (7.42 m2 g−1); however, at the optimal calcination temperature (300 °C), maximum surface area (55.99 m2 g−1) was attained. Nevertheless, increasing the calcination temperature (400 °C) further reduced the surface area (8.37 m2 g−1). Previous research has found that increasing the calcination temperature lowers the NC’s surface area [51,52]. Furthermore, NC calcined at 300 °C had the maximum porous volume, however, the average pore diameter was only 7.160 nm, which could be due to high metal dispersion on the TiO2 surface [29]. The enhanced efficiency of the best performing photocatalyst can be related to its high surface area and increased pore volume.

2.7.4. Morphology

Figure 9 shows FESEM and EDX spectrum of four samples including TA, 0.1Fe-0.4Zn-TiO2-200, 0.1Fe-0.4Zn-TiO2-300, and 0.1Fe-0.4Zn-TiO2-400 whereas Figure 10 represents the (a) TEM images of the 0.1Fe-0.4Zn-TiO2-300 NC along with (b) a histogram to show particle size distribution and (c) lattice fringe patterns. The images clearly demonstrate that the sample consists of tiny irregular shaped, crystalline particles varying in size (70–180 nm for TA and 100–180 nm for 0.1Fe-0.4Zn-TiO2-300 NC). The 0.1Fe-0.4Zn-TiO2-300 NC had minor agglomerations relative to TA whereas the EDX spectrum specifically indicates the presence of the main constituents (Ti and O) along with the doped metals (Fe and Zn), which are successfully integrated and distributed over the TiO2 support (as could be seen in the form of separate signals of doped metals).

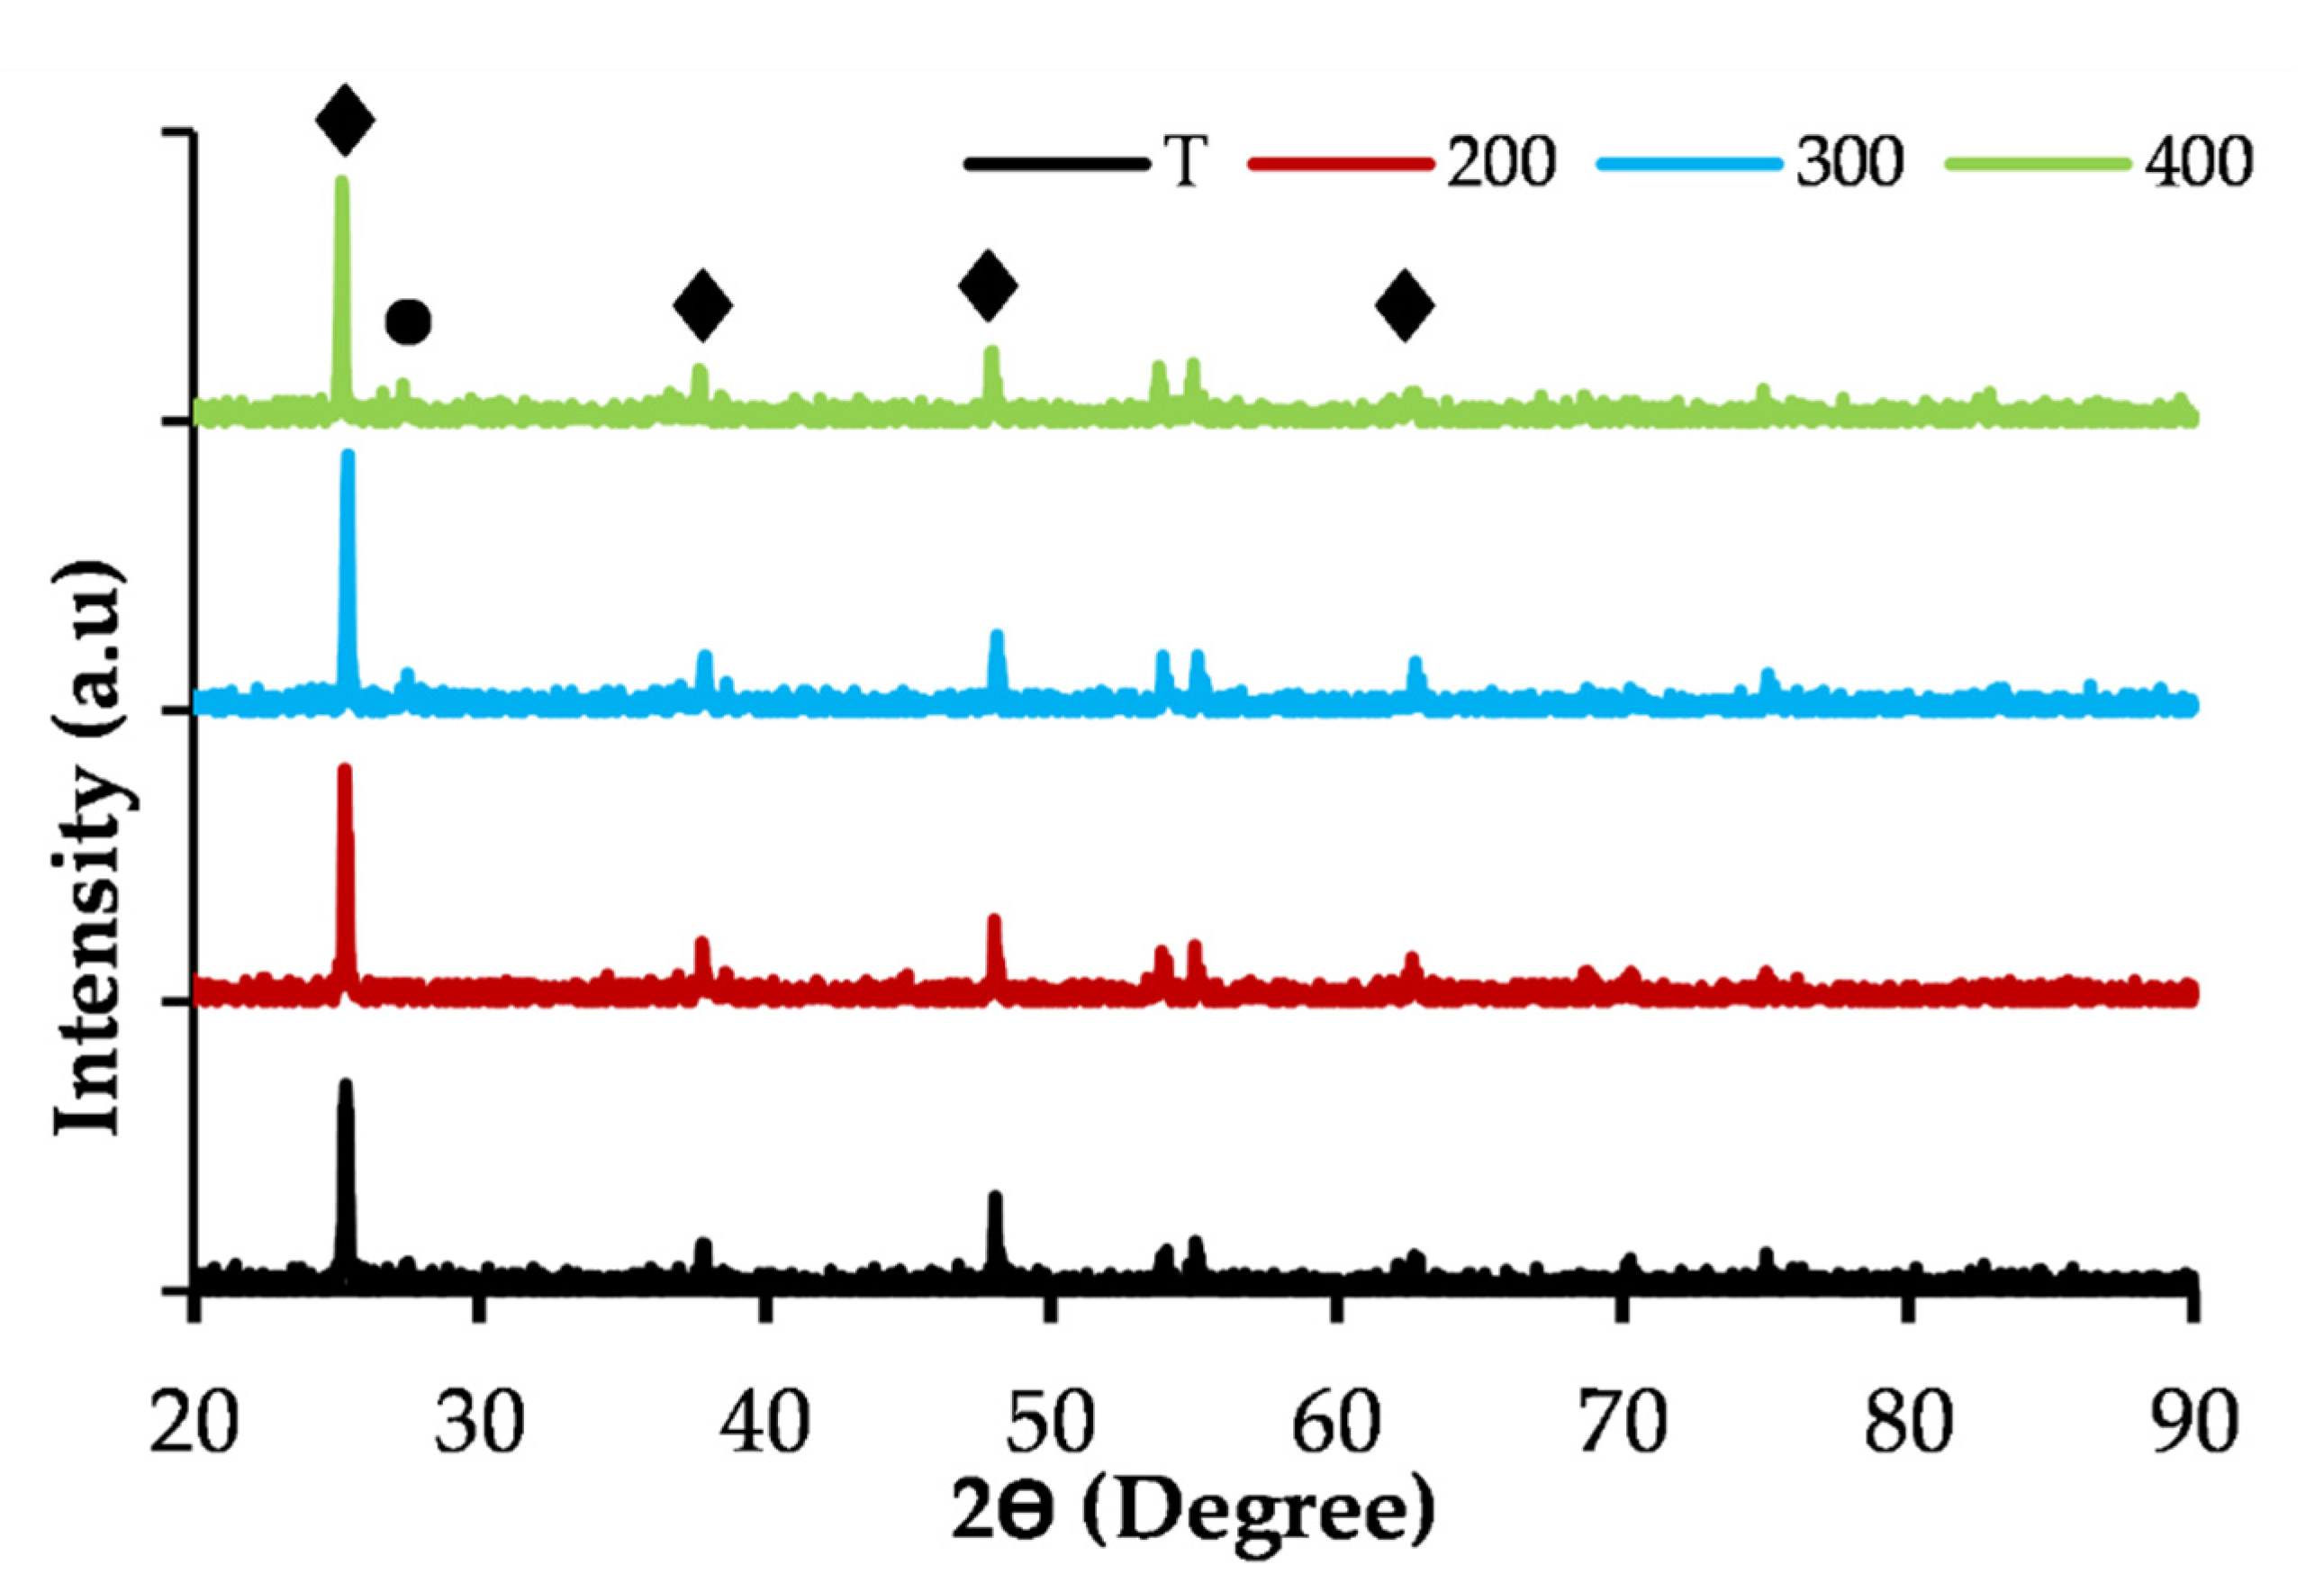
2.7.5. Phase and Crystal Structure

In Figure 11, the XRD patterns for the four samples (TA and 0.1Fe-0.4Zn-TiO2 of different calcination temperature; 200, 300 and 400 °C) displays phases corresponding to anatase phases, as expected, at 25.4°. All the samples calcined 300 °C and above showed two main clear phases corresponding to anatase and rutile. The peaks at 2θ = 25.34° and 2θ = 27.46° corresponded to the main peak of anatase and rutile, respectively [30,53,54,55]. With phase transition, none of the samples calcined at different temperatures were observed due to lower calcination temperatures. As shown in previous studies, phase transition behavior was observed in photocatalyst samples calcinated at temperatures above 600 °C and that phase change behavior in titanium samples (anatase to rutile phase transition) is well known, is typically above 600 °C, and is a well-established phenomenon [49,56]. As the TiO2 samples were doped using Fe and Zn transition metals as dopants, no diffraction lines of phases containing Fe or Zn were observed. This could be due to either very low dopant concentration or well scattered dopants on TiO2. This statement can be confirmed by studies carried out by Zhu et al. [57], who confirmed that TiO2 with above 5 wt% metal dopant concentration, in addition to TiO2’s main anatase peaks, small peaks can be observed owing to a separate oxide process. In our case, findings from FESEM-EDX images support the metal dispersion. Crystallite size and composition of phases of Bare TiO2 (TA) and doped photocatalysts are presented in Table 4.

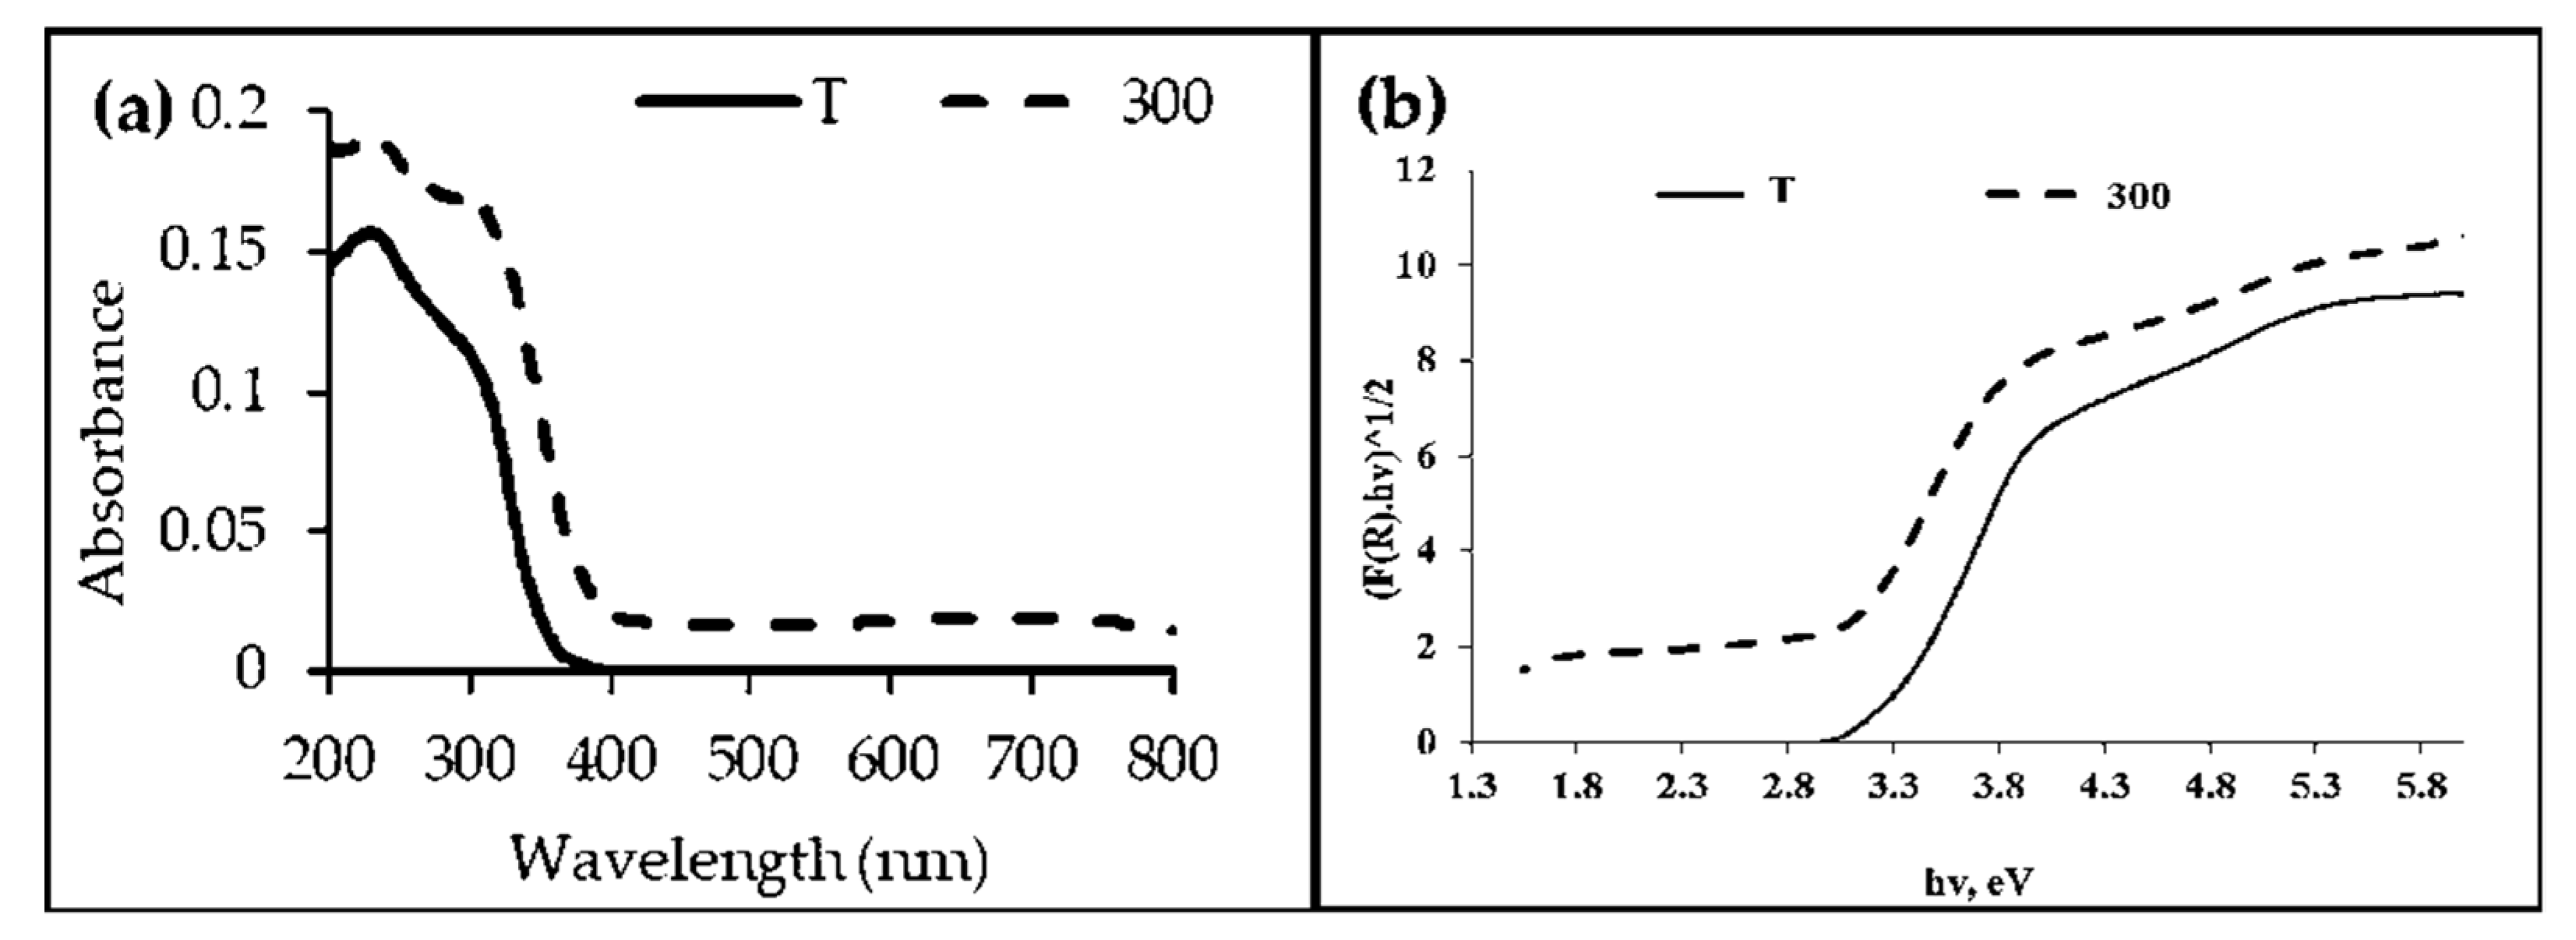
2.7.6. Diffuse Reflectance UV-Visible Spectrophotometry

The absorbance spectrum of the synthesized photocatalysts is presented in Figure 12 and related bandgap energies for TA and 0.1Fe-0.4Zn-TiO2-300 were 3.16 and 2.75 eV (Figure 12). The related good performance of the photocatalysts can be attributed to the reduced bandgap, the increase of the surface oxygen vacancies (SOVs) could result in red shift. In case of Zn as a dopant, as previously reported [58,59], ZnO could play the role of a dopant in the composites, and the interfacial coupling effect between TiO2 and ZnO might lead to the red shift. In our case, based on the photocatalytic performance, doping Fe or Zn might have contributed to the formation of impurity energy level between the CB and VB of the semiconductor TiO2 (used as substrate), that in turn contributed to initiation of the visible region-mediated photocatalytic reaction on the surface of the Fe-Zn/TiO2 photocatalyst by generating e/h+ pair. This statement is in agreement with the previously reported literature for the photodegradation of tetracycline using Zn/TiO2 [58] and Fe-doped SrTiO3 [59]. Not only the calcination temperature, but the Zn as a dopant may have led to inhibiting phase transformation (anatase to rutile) and bandgap narrowing with increased visible range absorption. Both factors contributed to better photocatalytic efficiency.

3. Materials and Methods

3.1. Materials

The chemicals in this research were used as obtained without further purification. Dopant metal salts used for NC synthesis were iron (III) nitrate nonahydrate, Fe(NO3)3•9H2O (Merck, Darmstadt, Germany), and Zn(NO3)2•6H2O, while titanium tetraisopropoxide or TTIP was used as a precursor of TiO2 (98%, Daejung, South Korea). Titanium (IV) oxide, a mixture of rutile and anatase and titania (Sigma Aldrich, Munich, Germany), and anatase (Sigma Aldrich, Munich, Germany) were used for comparative analysis. Nutrient agar and broth were purchased from Oxoid, UK, to culture test bacterial strains. The model organic pollutant used in this study was diisopropanolamine (1,1-Iminodi-2-propanol, Merck, Darmstadt, Germany) whereas sodium hydroxide, NaOH (Merck, Darmstadt, Germany, 95% purity), was used as a precipitating agent during the co-precipitation (Co-P) method for NC synthesis

3.2. Nanocomposite Synthesis

Photocatalytic NC was prepared employing different methods of synthesis including wet impregnation (WI), co-precipitation (Co-P), and sol-gel (SG) methods. Photocatalyst synthesis protocol is detailed in our previous publications for the WI method [12,60,61] and co-precipitation [61]. Another batch of Fe-Zn-TiO2 NC was synthesized following a modified sol-gel procedure described elsewhere [11,62]. A detailed methodology is reported in supplementary information as Section 1 (Nanocomposite Synthesis) while the schematic representation is depicted in supplementary information Figures S2 and S3. The dried (raw) photocatalysts synthesized by the above-mentioned procedures was ground into fine powder and stored in a desiccator. The raw photocatalysts were activated at various calcination temperatures (200, 300, 400 and 500 °C).

3.3. Performance Evaluation of Fe-Zn-TiO2 Nanocomposite

3.3.1. Screening and Optimization Studies

To screen the best-performing NC, the photocatalytic efficiency of all synthesized NC in terms of mineralization (COD removal) was evaluated using DIPA (300 mg L−1), as a model pollutant under visible light irradiation. In addition, the pH and temperature were maintained in the same conditions, i.e., working pH and room temperature (23 ± 2 °C) in all reaction studies. The photoreactor comprised of the stirring plate placed inside a compartment with a halogen lamp (300 Watt) mounted above the photo-chamber. Samples were collected (at various intervals), centrifuged, and filtered twice, with Whatman filter paper (GD/X 25 mm diameter, pore size 0.45-micron PTFE), to remove photocatalyst, followed by measuring chemical oxygen demand (COD, mg L−1) using Hach UV-Vis spectrophotometer (DR 3900, Hach, Loveland, CO, USA). Percent COD was measured through the following Equation (3),
COD   Removal   ( % ) = ( COD o COD t COD o )   ×   100  
Initial COD is represented as CODo and COD at time is CODt in mg L−1.

3.3.2. Kinetic Studies

The Langmuir–Hinshelwood (L–H) kinetic model was used to study the photocatalytic kinetics for the degradation of DIPA. The model is given below, Equation (4).
r = dC dt = k c K ads 1 + K ads
where r is the oxidation rate (mg L−1 min−1), C is the concentration of the reactant (mg L−1), t is the illumination time (min), Kc is the reaction rate constant (min−1), and Kads is the adsorption coefficient of the reactant (L mg−1).

3.3.3. Photocatalytic Bactericidal Studies

Antimicrobial activity was assessed to evaluate the efficacy of NC in terms of the minimum time and dosage needed to effectively inhibit bacterial growth. The best performing photocatalysts was further used for inactivation of biological contaminants. The pathogenic species used were Escherichia coli (ATCC 15224) and methicillin-resistant Staphylococcus aureus (MRSA 252) from Holy Family Hospital, Rawalpindi, Pakistan [63]. To ensure sterile conditions, glassware and growth media (nutrient broth and nutrient agar media) were autoclaved.
The modified protocol of Mathew et al. [64], described in our recent publication [10,65], was followed for the inactivation studies. In a typical method, the fresh broth cultures of test pathogens were prepared for photocatalytic activity and the mature test organism was transferred to glass vessels, supplemented with NC. The sample solution with known concentration of bacterium (104 CFU.mL−1) and NC dose (1 mg.mL−1) was irradiated in a photoreactor, explained earlier, placed within the laminar flow hood to ensure sterile conditions and to avoid contamination. During the reaction, known quantities of aliquots were collected and plated at regular intervals. Plates were incubated (at 37 °C) and findings were recorded as CFU using colony counter. Control experiments were conducted for reference purposes without NC and light source. Kill time assessment was also conducted to check the influence of time for complete inhibition, following the similar protocol stated above in nutrient broth culture (NB) proceeded by inoculation of known quantities of tested pathogens (S. aureus and E. coli). Inoculation was done on an agar plate by the plate count method. Plates were incubated and the findings were interpreted as the inactivation efficiency plots. Results were presented in terms of percent reduction before and after photocatalytic oxidation reaction (PCO) using the following Equation (5):
Percent   reduction = ( A o A t A o ) × 100
where Ao indicates the number of viable bacteria before PCO and At is the number of viable bacteria after PCO. The inactivation efficiency [66] of the nanomaterials was shown by log unit reduction of MRSA 252/E. coli (Lr), Equation (6)
logunitreduction   of   bacteria   ( Lr ) = A t A o
where At and Ao are initial concentration and concentration at a particular irradiation time during photocatalytic inactivation experiments, respectively.

3.4. Energy Efficiency Analysis of Synthesized NC

Energy efficiency plays an important role in the selection and cost of the NCs. Energy efficiency was estimated through electrical energy consumption (EE/O) to degrade 1000 L of wastewater using synthesized NC. The following Equation (7) was used for the determination of EE/O of the NC [11,67].
E E / O = pt ( 1000 ) ( V ) 60 In ( C o C f )

3.5. Molecular Docking Simulation Studies

Molecular docking studies were conducted to gain more insight into potential targets leading to the inhibition of bacterial growth [68]. Inhibitors of β-lactamase were identified as potent antibiotics [19]. Here, the interaction pattern of Fe-Zn-TiO2 NC with the amino acid residue of the active pocket of β-lactamase from E. coli and S. aureus was performed. The 3D structure of the enzyme β-lactamase presented in Figure 13 was recovered from the protein data bank (PDB ID: 4KZ3) and (PDB ID: 1MWU) resolution: 1.67 Å) [69,70]. MOE (Molecular Operating Environment) software was used for docking studies [71]. The MMFF94x forcefield and gradient 0.05 were used for energy minimization. The possible binding site was specified around co-crystallized ligand, i.e., 5-chloro-3-sulfamoylthiophene-2-carboxylic acid of β-lactamase from E. coli.
Polar hydrogens were added to prepare protein for docking while other default parameters were used. Finally, the ten best docked conformations were produced to get best binding pose and interaction of NC into active pocket. The 2-dimensional interaction pattern of photocatalyst inside protein pocket were obtained using the ligand binding interaction tool of MOE. The structure of Fe-Zn-TiO2 NC was built by modification of a previously reported anatase structure of Titania TiO2 retrieved from PubChem as shown in Figure 14a,b.

3.6. Physico-Chemical Characterization

Thermogravimetric analysis (TGA, TGA-STA 8000, Boston, MA, USA), FTIR (Perkin Elmer Spectrum one FTIR spectrophotometer, Waltham, MA, USA), FESEM (Supra55VP, Oberkochen, Germany), BET surface area analysis (BELSORP, Osaka, Japan), and diffuse reflectance UV visible spectroscopy (DR-UV−vis, Shimadzu spectrometer 3150, Kyoto, Japan) were used to study the thermal stability, surface functional groups, surface morphologies, surface area, and bandgap analysis, respectively. XRD analysis (XRD-Bruker, Billerica, MA, USA) were also conducted for phase identification and crystalline size estimation using Scherrer equation (Equation (8)) [72].
2 Φ = K λ β c o s θ

4. Conclusions

In the present study, we successfully achieved the main objective to shift the absorbance spectrum and enhanced photocatalytic performance by optimization of the synthesis and reaction parameters. From the results obtained, nanocomposites prepared using the WI method were observed to have a better performance compared to the other two reported synthesis methods. Based on the results from the screening studies, the nanocomposite synthesized via the WI method with 0.1Fe-0.4Zn metal ratio, calcined at 300 °C, was selected as the best one with 66.5% COD removal. It was correspondingly concluded that the anatase titania as substrate performed better compared to other TiO2 phases. Optimum dopant composition and calcination temperature were 0.1:0.4 Fe to Zn and 300 °C, respectively. The critical reason behind the good performance is that more energy is provided but the higher light intensity to the TiO2 substrate produces electron–hole pairs. From the results obtained in the present study, it is assumed that the effective destruction of the pollutant (DIPA) is only possible because of the successful metal doping onto the TiO2 substrate. Among the various parameters that affect the photocatalysis of the DIPA, the most important is the method used for photocatalyst synthesis. Other than reaction parameters, the most important are the photocatalysts synthesis parameters which directly influence the photocatalytic performance in terms of pollutant mineralization. All those employed synthesis parameters such as type of metal doped, type of TiO2 used, composition of different phases of TiO2, amount of the metals doped, metal composition (Fe:Zn), and calcination temperature of the photocatalyst together enhanced the effectiveness of photocatalytic materials while synthesizing the photocatalysts. The energy consumption for the best NC was 457.40 KW h m−3. Although the influence of some of the parameters could be controversial in some cases, understanding all these factors could give a clear idea of the progression of the photodegradation of the pollutants. From the antibacterial results, it is obvious that increasing time results in an increase in % reduction of the bacterial cell count (100% in 90 min of irradiation) due to the availability of maximum photons. The good binding score and interaction of nanocomposite inside active pocket suggested it to be a potential inhibitor of β-lactamase that can be further evaluated for its enzyme inhibition studies.

Supplementary Materials

The following are available online at https://www.mdpi.com/article/10.3390/catal11091112/s1, Figure S1. Effect of DIPA concentration versus corresponding irradiation time on % COD removal, Table S1. Possible assignments of the FTIR peaks, Figure S2. Schematic representation of the formation mechanism, and Figure S3. Instruments used for characterization of the photocatalysts.

Author Contributions

Conceptualization, N.R. and M.A.B.; methodology, D.A.C.S.F.; software, S.N., R.S., and M.S.K.; validation, G.E.-S.B.; I.H.E.A., and U.F.; formal analysis, D.A.C.S.F. and M.S.K.; investigation, D.A.C.S.F.; resources, J.U. and A.K.; data curation, I.H.E.A. and U.F.; writing—original draft preparation, D.A.C.S.F., N.R., and M.S.K.; writing—review and editing, M.S.K. and N.R.; supervision, M.A.B., N.R., and A.K.; project administration, M.A.B.; funding acquisition, I.H.E.A. and M.A.B. All authors have read and agreed to the published version of the manuscript.

Funding

This work is part of YUTP project (0153AA-A36) funded by Universiti Teknologi PETRONAS, 32610 Seri Iskander, Perak Darul Ridzuan, Malaysia. This work was funded by Taif University, Project number (TURSP-2020/27), Taif, Saudi Arabia.

Acknowledgments

The authors extend their appreciation to Deanship of Scientific Research at Taif University for funding this work through Researchers Supporting Project number (TURSP-2020/27), Taif University, Taif, Saudi Arabia.

Conflicts of Interest

The authors declare no conflict of interest.

References

  1. Aaron, D.; Tsouris, C. Separation of CO2 from Flue Gas: A Review. Sep. Sci. Technol. 2005, 40, 321–348. [Google Scholar] [CrossRef]
  2. Bradley, A.; Duan, H.; Elion, W.; van Soest-Vercammen, E.; Nagelvoort, R.K. Innovation in the LNG industry: Shell’s approach. In Proceedings of the 24th World Gas Conference, Buenos Aires, Argentina, 5–9 October 2009. [Google Scholar]
  3. Poste, A.E.; Grung, M.; Wright, R.F. Amines and amine-related compounds in surface waters: A review of sources, concentrations and aquatic toxicity. Sci. Total Environ. 2014, 481, 274–279. [Google Scholar] [CrossRef]
  4. Fakhru’l-Razi, A.; Pendashteh, A.; Abdullah, L.C.; Biak, D.R.A.; Madaeni, S.S.; Abidin, Z.Z. Review of technologies for oil and gas produced water treatment. J. Hazard. Mater. 2009, 170, 530–551. [Google Scholar] [CrossRef] [PubMed]
  5. Eide-Haugmo, I.; Brakstad, O.G.; Hoff, K.A.; Sørheim, K.R.; da Silva, E.F.; Svendsen, H.F. Environmental impact of amines. Energy Procedia 2009, 1, 1297–1304. [Google Scholar] [CrossRef] [Green Version]
  6. Haroon, H.; Shah, J.A.; Khan, M.S.; Alam, T.; Khan, R.; Asad, S.A.; Ali, M.A.; Farooq, G.; Iqbal, M.; Bilal, M. Activated carbon from a specific plant precursor biomass for hazardous Cr(VI) adsorption and recovery studies in batch and column reactors: Isotherm and kinetic modeling. J. Water Process Eng. 2020, 38, 101577. [Google Scholar] [CrossRef]
  7. World Health Organization. The Top 10 Causes of Death. 2018. Available online: https://www.who.int/news-room/fact-sheets/detail/the-top-10-causes-of-death (accessed on 3 September 2021).
  8. World Health Organization. Diarrhoeal Disease. Available online: https://www.who.int/news-room/fact-sheets/detail/diarrhoeal-disease (accessed on 15 July 2021).
  9. Troeger, C.; Forouzanfar, M.; Rao, P.C.; Khalil, I.; Brown, A.; Reiner Jr, R.C.; Fullman, N.; Thompson, R.L.; Abajobir, A.; Ahmed, M. Estimates of global, regional, and national morbidity, mortality, and aetiologies of diarrhoeal diseases: A systematic analysis for the Global Burden of Disease Study 2015. Lancet Infect. Dis. 2017, 17, 909–948. [Google Scholar] [CrossRef] [Green Version]
  10. Khan, M.S.; Shah, J.A.; Arshad, M.; Halim, S.A.; Khan, A.; Shaikh, A.J.; Riaz, N.; Khan, A.J.; Arfan, M.; Shahid, M. Photocatalytic Decolorization and Biocidal Applications of Nonmetal Doped TiO2: Isotherm, Kinetic Modeling and In Silico Molecular Docking Studies. Molecules 2020, 25, 4468. [Google Scholar] [CrossRef]
  11. Khan, M.S.; Shah, J.A.; Riaz, N.; Butt, T.A.; Khan, A.J.; Khalifa, W.; Gasmi, H.H.; Latifee, E.R.; Arshad, M.; Al-Naghi, A.A.A.; et al. Synthesis and Characterization of Fe-TiO2 Nanomaterial: Performance Evaluation for RB5 Decolorization and In Vitro Antibacterial Studies. Nanomaterials 2021, 11, 436. [Google Scholar] [CrossRef]
  12. Riaz, N.; Hassan, M.; Siddique, M.; Mahmood, Q.; Farooq, U.; Sarwar, R.; Khan, M.S. Photocatalytic degradation and kinetic modeling of azo dye using bimetallic photocatalysts: Effect of synthesis and operational parameters. Environ. Sci. Pollut. Res. 2020, 27, 2992–3006. [Google Scholar] [CrossRef]
  13. Riaz, N.; Kait, C.F.; Man, Z.; Dutta, B.K.; Ramli, R.M.; Khan, M.S. Visible Light Photodegradation of Azo Dye by Cu/TiO2. Adv. Mater. Res. 2014, 917, 151–159. [Google Scholar] [CrossRef]
  14. Yoon, K.-Y.; Hoon Byeon, J.; Park, J.-H.; Hwang, J. Susceptibility constants of Escherichia coli and Bacillus subtilis to silver and copper nanoparticles. Sci. Total Environ. 2007, 373, 572–575. [Google Scholar] [CrossRef]
  15. Erdem, A.; Metzler, D.; Cha, D.; Huang, C.P. Inhibition of bacteria by photocatalytic nano-TiO2 particles in the absence of light. Int. J. Environ. Sci. Technol. 2015, 12, 2987–2996. [Google Scholar] [CrossRef] [Green Version]
  16. Long, M.; Wang, J.; Zhuang, H.; Zhang, Y.; Wu, H.; Zhang, J. Performance and mechanism of standard nano-TiO2 (P-25) in photocatalytic disinfection of foodborne microorganisms—Salmonella typhimurium and Listeria monocytogenes. Food Control 2014, 39, 68–74. [Google Scholar] [CrossRef]
  17. Foster, H.A.; Ditta, I.B.; Varghese, S.; Steele, A. Photocatalytic disinfection using titanium dioxide: Spectrum and mechanism of antimicrobial activity. Appli. Microbiol. Biotechnol. 2011, 90, 1847–1868. [Google Scholar] [CrossRef] [PubMed]
  18. Harper, J.C.; Christensen, P.A.; Egerton, T.A.; Curtis, T.P.; Gunlazuardi, J. Effect of catalyst type on the kinetics of the photoelectrochemical disinfection of water inoculated with E. coli. J. Appl. Electrochem. 2001, 31, 623–628. [Google Scholar] [CrossRef]
  19. Drawz, S.M.; Bonomo, R.A. Three Decades of β-Lactamase Inhibitors. Clin. Microbiol. Rev. 2010, 23, 160–201. [Google Scholar] [CrossRef] [PubMed] [Green Version]
  20. Hanaor, D.A.; Assadi, M.H.; Li, S.; Yu, A.; Sorrell, C.C. Ab initio study of phase stability in doped TiO2. Comput. Mech. 2012, 50, 185–194. [Google Scholar] [CrossRef] [Green Version]
  21. Assadi, M.H.N.; Hanaor, D.A.H. The effects of copper doping on photocatalytic activity at (101) planes of anatase TiO2: A theoretical study. Appl. Surf. Sci. 2016, 387, 682–689. [Google Scholar] [CrossRef] [Green Version]
  22. Doustkhah, E.; Assadi, M.H.N.; Komaguchi, K.; Tsunoji, N.; Esmat, M.; Fukata, N.; Tomita, O.; Abe, R.; Ohtani, B.; Ide, Y. In situ Blue titania via band shape engineering for exceptional solar H2 production in rutile TiO2. Appl. Catal. B Environ. 2021, 297, 120380. [Google Scholar] [CrossRef]
  23. Yodsomnuk, P.; Junjeam, K.; Termtanun, M. Photoactivity of Fe and Zn-doped TiO2 in phenol degradation under visible light. MATEC Web Conf. 2018, 192, 03047. [Google Scholar] [CrossRef]
  24. Liu, W.-J.; Qian, T.-T.; Jiang, H. Bimetallic Fe nanoparticles: Recent advances in synthesis and application in catalytic elimination of environmental pollutants. Chem. Eng. J. 2014, 236, 448–463. [Google Scholar] [CrossRef]
  25. Saleh, R.; Djaja, N.F. UV light photocatalytic degradation of organic dyes with Fe-doped ZnO nanoparticles. Superlattices Microstruct. 2014, 74, 217–233. [Google Scholar] [CrossRef]
  26. Carp, O.; Huisman, C.L.; Reller, A. Photoinduced Reactivity of Titanium Dioxide. Prog. Solid State Chem. 2004, 32, 33–117. [Google Scholar] [CrossRef]
  27. Coleman, H.M.; Chiang, K.; Amal, R. Effects of Ag and Pt on photocatalytic degradation of endocrine disrupting chemicals in water. Chem. Eng. J. 2005, 113, 65–72. [Google Scholar] [CrossRef]
  28. Behnajady, M.A.; Modirshahla, N.; Shokri, M.; Rad, B. Enhancement of photocatalytic activity of TiO2 nanoparticles by silver doping: Photodeposition versus liquid impregnation methods. Glob. NEST J. 2008, 10, 1–7. [Google Scholar]
  29. Nurlaela, E. Development of Cu-Ni/TiO2 Bimetallic Catalyst For Photohydrogen Production under Visible Light Illumination. Master’s Thesis, Universiti Teknologi PETRONAS, Tronoh, Bandar Seri Iskandar, Malaysia, 2011. [Google Scholar]
  30. Yoong, L.S.; Chong, F.K.; Dutta, B.K. Development of copper-doped TiO2 photocatalyst for hydrogen production under visible light. Energy 2009, 34, 1652–1661. [Google Scholar] [CrossRef]
  31. Ramli, R.M.; Chong, F.K.; Omar, A.A.; Murugesan, T. Performance of Surfactant Assisted Synthesis of Fe/TiO2 on the Photodegradation of Diisopropanolamine. CLEAN—Soil Air Water 2015, 43, 690–697. [Google Scholar] [CrossRef]
  32. Blake, D.M.; Webb, J.; Turchi, C.; Magrini, K. Kinetic and mechanistic overview of TiO2-photocatalyzed oxidation reactions in aqueous solution. Solar Energy Mater. 1991, 24, 584–593. [Google Scholar] [CrossRef]
  33. Li, Y.; Sun, S.; Ma, M.; Ouyang, Y.; Yan, W. Kinetic study and model of the photocatalytic degradation of rhodamine B (RhB) by a TiO2-coated activated carbon catalyst: Effects of initial RhB content, light intensity and TiO2 content in the catalyst. Chem. Eng. J. 2008, 142, 147–155. [Google Scholar] [CrossRef]
  34. Dominguez, S.; Ribao, P.; Rivero, M.J.; Ortiz, I. Influence of radiation and TiO2 concentration on the hydroxyl radicals generation in a photocatalytic LED reactor. Application to dodecylbenzenesulfonate degradation. Appl. Catal. B Environ. 2015, 178, 165–169. [Google Scholar] [CrossRef] [Green Version]
  35. Giraldo-Aguirre, A.L.; Erazo-Erazo, E.D.; Flórez-Acosta, O.A.; Serna-Galvis, E.A.; Torres-Palma, R.A. TiO2 photocatalysis applied to the degradation and antimicrobial activity removal of oxacillin: Evaluation of matrix components, experimental parameters, degradation pathways and identification of organics by-products. J. Photochem. Photobiol. A Chem. 2015, 311, 95–103. [Google Scholar] [CrossRef]
  36. Lin, Y.-T.; Weng, C.-H.; Chen, F.-Y. Key operating parameters affecting photocatalytic activity of visible-light-induced C-doped TiO2 catalyst for ethylene oxidation. Chem. Eng. J. 2014, 248, 175–183. [Google Scholar] [CrossRef]
  37. Sun, Z.; Zheng, L.; Zheng, S.; Frost, R.L. Preparation and characterization of TiO2/acid leached serpentinite tailings composites and their photocatalytic reduction of Chromium (VI). J. Colloid Interface Sci. 2013, 404, 102–109. [Google Scholar] [CrossRef] [PubMed] [Green Version]
  38. Albrbar, A.J.; Bjelajac, A.; Đokić, V.; Miladinović, J.; Janaćković, Đ.; Petrović, R. Photocatalytic efficiency of titania photocatalysts in saline waters. J. Serb. Chem. Soc. 2014, 79, 1127–1140. [Google Scholar] [CrossRef]
  39. Hernández, R.; Olvera-Rodríguez, I.; Guzmán, C.; Medel, A.; Escobar-Alarcón, L.; Brillas, E.; Sirés, I.; Esquivel, K. Microwave-assisted sol-gel synthesis of an Au-TiO2 photoanode for the advanced oxidation of paracetamol as model pharmaceutical pollutant. Electrochem. Commun. 2018, 96, 42–46. [Google Scholar] [CrossRef]
  40. Kumar, K.V.; Porkodi, K.; Rocha, F. Langmuir–Hinshelwood kinetics—A theoretical study. Catal. Commun. 2008, 9, 82–84. [Google Scholar] [CrossRef]
  41. Tanaka, H.; Sadamoto, T. The simultaneous determination of the kinetics and thermodynamics of Cu(OH)2 decomposition by means of TG and DSC. Thermochim. Acta 1982, 54, 273–280. [Google Scholar] [CrossRef]
  42. Sun, J.; Jing, Y.; Jia, Y.; Tillard, M.; Belin, C. Mechanism of preparing ultrafine copper powder by polyol process. Mater. Lett. 2005, 59, 3933–3936. [Google Scholar] [CrossRef]
  43. Li, D.; Haneda, H.; Hishita, S.; Ohashi, N. Visible-light-driven nitrogen-doped TiO2 photocatalysts: Effect of nitrogen precursors on their photocatalysis for decomposition of gas-phase organic pollutants. Mater. Sci. Eng. B 2005, 117, 67–75. [Google Scholar] [CrossRef]
  44. Yan, X.; He, J.; Evans, D.G.; Zhu, Y.; Duan, X. Preparation, Characterization and Photocatalytic Activity of TiO2 Formed from a Mesoporous Precursor. J. Porous Mater. 2004, 11, 131–139. [Google Scholar] [CrossRef]
  45. Linacero, R.; Aguado-Serrano, J.; Rojas-Cervantes, M. Preparation of mesoporous TiO2 by the sol-gel method assisted by surfactants. J. Mater. Sci. 2006, 41, 2457–2464. [Google Scholar] [CrossRef]
  46. Porkodi, K.; Arokiamary, S.D. Synthesis and spectroscopic characterization of nanostructured anatase titania: A photocatalyst. Mater. Charact. 2007, 58, 495–503. [Google Scholar] [CrossRef]
  47. Mohan, J. Organic Spectroscopy Principles and Applications, 2nd ed.; Alpha Science International Ltd.: Harrow, UK, 2007. [Google Scholar]
  48. Li, J.L.; Inui, T. Characterization of precursors of methanol synthesis catalysts, copper/zinc/aluminum oxides, precipitated at different pHs and temperatures. Appl. Catal. A Gen. 1996, 137, 105–117. [Google Scholar] [CrossRef]
  49. Caudillo-Flores, U.; Muñoz-Batista, M.J.; Kubacka, A.; Zárate-Medina, J.; Cortés, J.A.; Fernández-García, M. Measuring and interpreting quantum efficiency of acid blue 9 photodegradation using TiO2-based catalysts. Appl. Catal. A Gen. 2018, 550, 38–47. [Google Scholar] [CrossRef]
  50. Brunauer, S.; Deming, L.S.; Deming, W.E.; Teller, E. On a theory of the van der Waals adsorption of gases. J. Am. Chem. Soc. 1940, 62, 1723–1732. [Google Scholar] [CrossRef]
  51. Chen, Y.-F.; Lee, C.-Y.; Yeng, M.-Y.; Chiu, H.-T. The effect of calcination temperature on the crystallinity of TiO2 nanopowders. J. Cryst. Growth 2003, 247, 363–370. [Google Scholar] [CrossRef]
  52. Jiang, F.; Zheng, S.; An, L.; Chen, H. Effect of calcination temperature on the adsorption and photocatalytic activity of hydrothermally synthesized TiO2 nanotubes. Appl. Surface Sci. 2012, 258, 7188–7194. [Google Scholar] [CrossRef]
  53. Bauer, A.; Lee, K.; Song, C.; Xie, Y.; Zhang, J.; Hui, R. Pt nanoparticles deposited on TiO2 based nanofibers: Electrochemical stability and oxygen reduction activity. J. Power Sour. 2010, 195, 3105–3110. [Google Scholar] [CrossRef] [Green Version]
  54. Xie, M.; Jing, L.; Zhou, J.; Lin, J.; Fu, H. Synthesis of nanocrystalline anatase TiO2 by one-pot two-phase separated hydrolysis-solvothermal processes and its high activity for photocatalytic degradation of rhodamine B. J. Hazard. Mater. 2010, 176, 139–145. [Google Scholar] [CrossRef]
  55. Sreethawong, T.; Suzuki, Y.; Yoshikawa, S. Photocatalytic evolution of hydrogen over mesoporous TiO2 supported NiO photocatalyst prepared by single-step sol-gel process with surfactant template. Int. J. Hydrogen Energy 2005, 30, 1053–1062. [Google Scholar] [CrossRef]
  56. Fernández-García, M.; Wang, X.; Belver, C.; Hanson, J.C.; Rodriguez, J.A. Anatase-TiO2 nanomaterials: Morphological/size dependence of the crystallization and phase behavior phenomena. J. Phys. Chem. C 2007, 111, 674–682. [Google Scholar] [CrossRef]
  57. Zhu, H.; Wu, Y.; Zhao, X.; Wan, H.; Yang, L.; Hong, J.; Yu, Q.; Dong, L.; Chen, Y.; Jian, C.; et al. Influence of impregnation times on the dispersion of CuO on anatase. J. Mol. Catal. A Chem. 2006, 243, 24–30. [Google Scholar] [CrossRef]
  58. Pang, S.; Huang, J.G.; Su, Y.; Geng, B.; Lei, S.Y.; Huang, Y.T.; Lyu, C.; Liu, X.J. Synthesis and Modification of Zn-doped TiO2 Nanoparticles for the Photocatalytic Degradation of Tetracycline. Photochem. Photobiol. 2016, 92, 651–657. [Google Scholar] [CrossRef]
  59. Li, P.; Liu, C.; Wu, G.; Heng, Y.; Lin, S.; Ren, A.; Lv, K.; Xiao, L.; Shi, W. Solvothermal synthesis and visible light-driven photocatalytic degradation for tetracycline of Fe-doped SrTiO3. RSC Adv. 2014, 4, 47615–47624. [Google Scholar] [CrossRef]
  60. Riaz, N.; Bustam, M.A.; Chong, F.K.; Man, Z.B.; Khan, M.S.; Shariff, A.M. Photocatalytic Degradation of DIPA Using Bimetallic Cu-Ni/TiO2 Photocatalyst under Visible Light Irradiation. Sci. World J. 2014, 2014, 8. [Google Scholar] [CrossRef]
  61. Riaz, N.; Chong, F.K.; Man, Z.B.; Khan, M.S.; Dutta, B.K. Photodegradation of Orange II under Visible Light Using Cu–Ni/TiO2: Influence of Cu:Ni Mass Composition, Preparation, and Calcination Temperature. Ind. Eng. Chem. Res. 2013, 52, 4491–4503. [Google Scholar] [CrossRef]
  62. Kobayakawa, K.; Sato, C.; Sato, Y.; Fujishima, A. Continuous-flow photoreactor packed with titanium dioxide immobilized on large silica gel beads to decompose oxalic acid in excess water. J. Photochem. Photobiol. A Chem. 1998, 118, 65–69. [Google Scholar] [CrossRef]
  63. Mushtaq, S.; Khan, J.A.; Rabbani, F.; Latif, U.; Arfan, M.; Yameen, M.A. Biocompatible biodegradable polymeric antibacterial nanoparticles for enhancing the effects of a third-generation cephalosporin against resistant bacteria. J. Med. Microbiol. 2017, 66, 318–327. [Google Scholar] [CrossRef]
  64. Mathew, S.; Ganguly, P.; Rhatigan, S.; Kumaravel, V.; Byrne, C.; Hinder, S.; Bartlett, J.; Nolan, M.; Pillai, S. Cu-doped TiO2: Visible light assisted photocatalytic antimicrobial activity. Appl. Sci. 2018, 8, 2067. [Google Scholar] [CrossRef] [Green Version]
  65. Iftikhar, A.; Khan, M.S.; Rashid, U.; Mahmood, Q.; Zafar, H.; Bilal, M.; Riaz, N. Influence of metallic species for efficient photocatalytic water disinfection: Bactericidal mechanism of in vitro results using docking simulation. Environ. Sci. Pollut. Res. 2020, 27, 39819–39831. [Google Scholar] [CrossRef]
  66. Thakur, I.; Örmeci, B.; verma, A. Inactivation of E. coli in water employing Fe-TiO2 composite incorporating in-situ dual process of photocatalysis and photo-Fenton in fixed-mode. J. Water Process Eng. 2020, 33, 101085. [Google Scholar] [CrossRef]
  67. Azbar, N.; Yonar, T.; Kestioglu, K. Comparison of various advanced oxidation processes and chemical treatment methods for COD and color removal from a polyester and acetate fiber dyeing effluent. Chemosphere 2004, 55, 35–43. [Google Scholar] [CrossRef]
  68. Gaber, A.; Refat, M.S.; Belal, A.A.M.; El-Deen, I.M.; Hassan, N.; Zakaria, R.; Alhomrani, M.; Alamri, A.S.; Alsanie, W.F.; Saied, M.E. New Mononuclear and Binuclear Cu(II), Co(II), Ni(II), and Zn(II) Thiosemicarbazone complexes with potential biological activity: Antimicrobial and molecular docking study. Molecules 2021, 26, 2288. [Google Scholar] [CrossRef] [PubMed]
  69. Barelier, S.; Eidam, O.; Fish, I.; Hollander, J.; Figaroa, F.; Nachane, R.; Irwin, J.J.; Shoichet, B.K.; Siegal, G. Increasing chemical space coverage by combining empirical and computational fragment screens. ACS Chem. Biol. 2014, 9, 1528–1535. [Google Scholar] [CrossRef] [PubMed] [Green Version]
  70. Lim, D.; Strynadka, N.C. Structural basis for the β lactam resistance of PBP2a from methicillin-resistant Staphylococcus aureus. Nat. Struct. Biol. 2002, 9, 870–876. [Google Scholar] [CrossRef] [PubMed]
  71. Chemical Computing Group, M. Molecular Operating Environment; Chemical Computing Group: Montreal, QC, Canada, 2008. [Google Scholar]
  72. Scherrer, P. Determination of the size and internal structure of colloid particles by X-rays. Nachr. Ges. Wiss. Gött. 1918, 2, 98–100. [Google Scholar]
Figure 1. Effect of different parameters on NC synthesis (a) calcination temperature, (b) metal loading (wt%), and (c) TiO2 phase composition on % COD removal.
Catalysts 11 01112 g001
Figure 2. Effect of reaction parameters on COD removal (%) using 0.1Fe-0.4Zn-TiO2-300, (a) NC dose, (b) light intensity, (c) irradiation time, and (d) DIPA concentration.
Catalysts 11 01112 g002
Figure 3. Photocatalytic degradation of DIPA: (a) Pseudo-first-order reaction kinetics for DIPA over Fe-Zn/TiO2 NC; (b) rates of the photocatalytic degradation of DIPA as a function of initial DIPA concentrations.
Catalysts 11 01112 g003
Figure 4. Photocatalytic bactericidal performance of control (C), TiO2 (T), 0.1Fe-0.4Zn-TiO2 NC calcined at 200, 300, and 400 °C against E. coli and S. aureus: (a) % reduction in 90 min, (b) inactivation efficiency (CFU) against S. aureus, and (c) inactivation efficiency (CFU) against E. coli.
Catalysts 11 01112 g004
Figure 5. (a) Binding interaction pattern of Fe-Zn-TiO2 nanocomposite with active site of β-lactamase (2D view). (b) 3D view of interaction with active site residues of β-lactamase (E. coli), (c). Fe-Zn-TiO2 NC inside the active pocket of β-lactamase (E. coli), (d) Fe-Zn-TiO2 NC inside the active pocket of β-lactamase (S. aureus) (e). 3D view of interaction with active site residues of β-lactamase (S. aureus).
Catalysts 11 01112 g005
Figure 6. Thermogram of the raw 0.1Fe-0.4Zn-TiO2.
Catalysts 11 01112 g006
Figure 7. FTIR spectra of bare TiO2, Fe-Zn-TiO2-300 (raw), and Fe-Zn-TiO2-300 photocatalyst.
Catalysts 11 01112 g007
Figure 8. Isotherm plot for Fe-Zn/TiO2 nanocomposite.
Catalysts 11 01112 g008
Figure 9. FESEM (Mag 100KX) and EDS elemental mapping of TiO2 (TA) and 0.1Fe-0.4Zn-TiO2 NC calcined at different temperatures.
Catalysts 11 01112 g009
Figure 10. (a) HRTEM images of the 0.1Fe-0.4Zn-TiO2-300 NC, (b) a histogram to show particle size distribution and (c) lattice fringe patterns.
Catalysts 11 01112 g010
Figure 11. XRD patterns of TiO2 (TA) and 0.1Fe-0.4Zn-TiO2 NC calcined at 200, 300, and 400 °C (♦ = anatase, ● = rutile).
Catalysts 11 01112 g011
Figure 12. (a) Absorbance spectrum and (b) plot of transformed K–Munk functions [F(R)hυ]1/2 vs. hυ of the bare TiO2 and synthesized NC.
Catalysts 11 01112 g012
Figure 13. (a). 3D structure of β-lactamase from E. coli (PDB ID: 4KZ3) and (b). S. aureus (PDB ID: 1MWU).
Catalysts 11 01112 g013
Figure 14. (a) 2D structure of anatase (TiO2), (b) 2D structure of Fe-Zn-TiO2 NC.
Catalysts 11 01112 g014
Table 1. Effect of NC preparation methods with different Fe-Zn mass compositions.
Metal CompositionCalcination (°C)% COD Removal
NC Preparation Methods
WICo–PSG
0Fe-0.1Zn30021.7020.6018.96
0.1Fe-0.4Zn30066.5030.4921.84
0.2Fe-0.3Zn30021.5718.5418.96
0.3Fe-0.2Zn30020.6021.7021.70
0.4Fe-0.1Zn30022.8022.6622.12
0.5Fe-0Zn30024.7328.4327.20
Table 2. Energy efficiency of the synthesized photocatalysts through different methods for DIPA degradation.
NCCalcination (°C)Energy Efficiency of NC with Respect to Synthesis Method (KW h m−3)
WICo-PSG
0.0Fe-0.1Zn-TiO23002043.612167.062378.93
0.1Fe-0.4Zn-TiO2300457.401374.522029.05
0.2Fe-0.3Zn-TiO23002058.362437.762378.93
0.3Fe-0.2Zn-TiO23002167.062043.612043.61
0.4Fe-0.1Zn-TiO23001932.001945.362000.47
0.5Fe-0.0Zn-TiO23001760.401494.541575.18
Table 3. BET surface area, pore volume, and pore diameter of Fe-Zn-TiO2 photocatalysts.
Parameters Calcination Temperature
TA200300400
SABET (m2·g−1)17.437.4255.998.37
Total pore volume (cm3·g−1)0.0540.0540.1000.051
Average pore diameter (nm)12.0629.197.16024.346
Table 4. Crystallite size and composition of phases of synthesized NC.
PhotocatalystsCrystallite Size (nm)Composition of Phases (%)
AnataseRutileAnatase (ωA)Rutile (ωR)
TiO2 (A)38.390.00100.000.00
TiO2 (A&R)14.7815.4780.0719.93
SG-018.750.00100.000.00
0.1Fe-0.4Zn-TiO2-20041.5341.2175.6624.34
0.1Fe-0.4Zn-TiO2-30041.1135.4974.0125.99
0.1Fe-0.4Zn-TiO2-40041.1037.6273.5926.41
Publisher’s Note: MDPI stays neutral with regard to jurisdictional claims in published maps and institutional affiliations.

