
Effect of Textural Properties and Presence of Co-Cation on NH3-SCR Activity of Cu-Exchanged ZSM-5

 , ,
, ,  , , ,
, , ,  and
and 
Abstract
:1. Introduction
2. Results and Discussion
2.1. Structural and Textural Properties
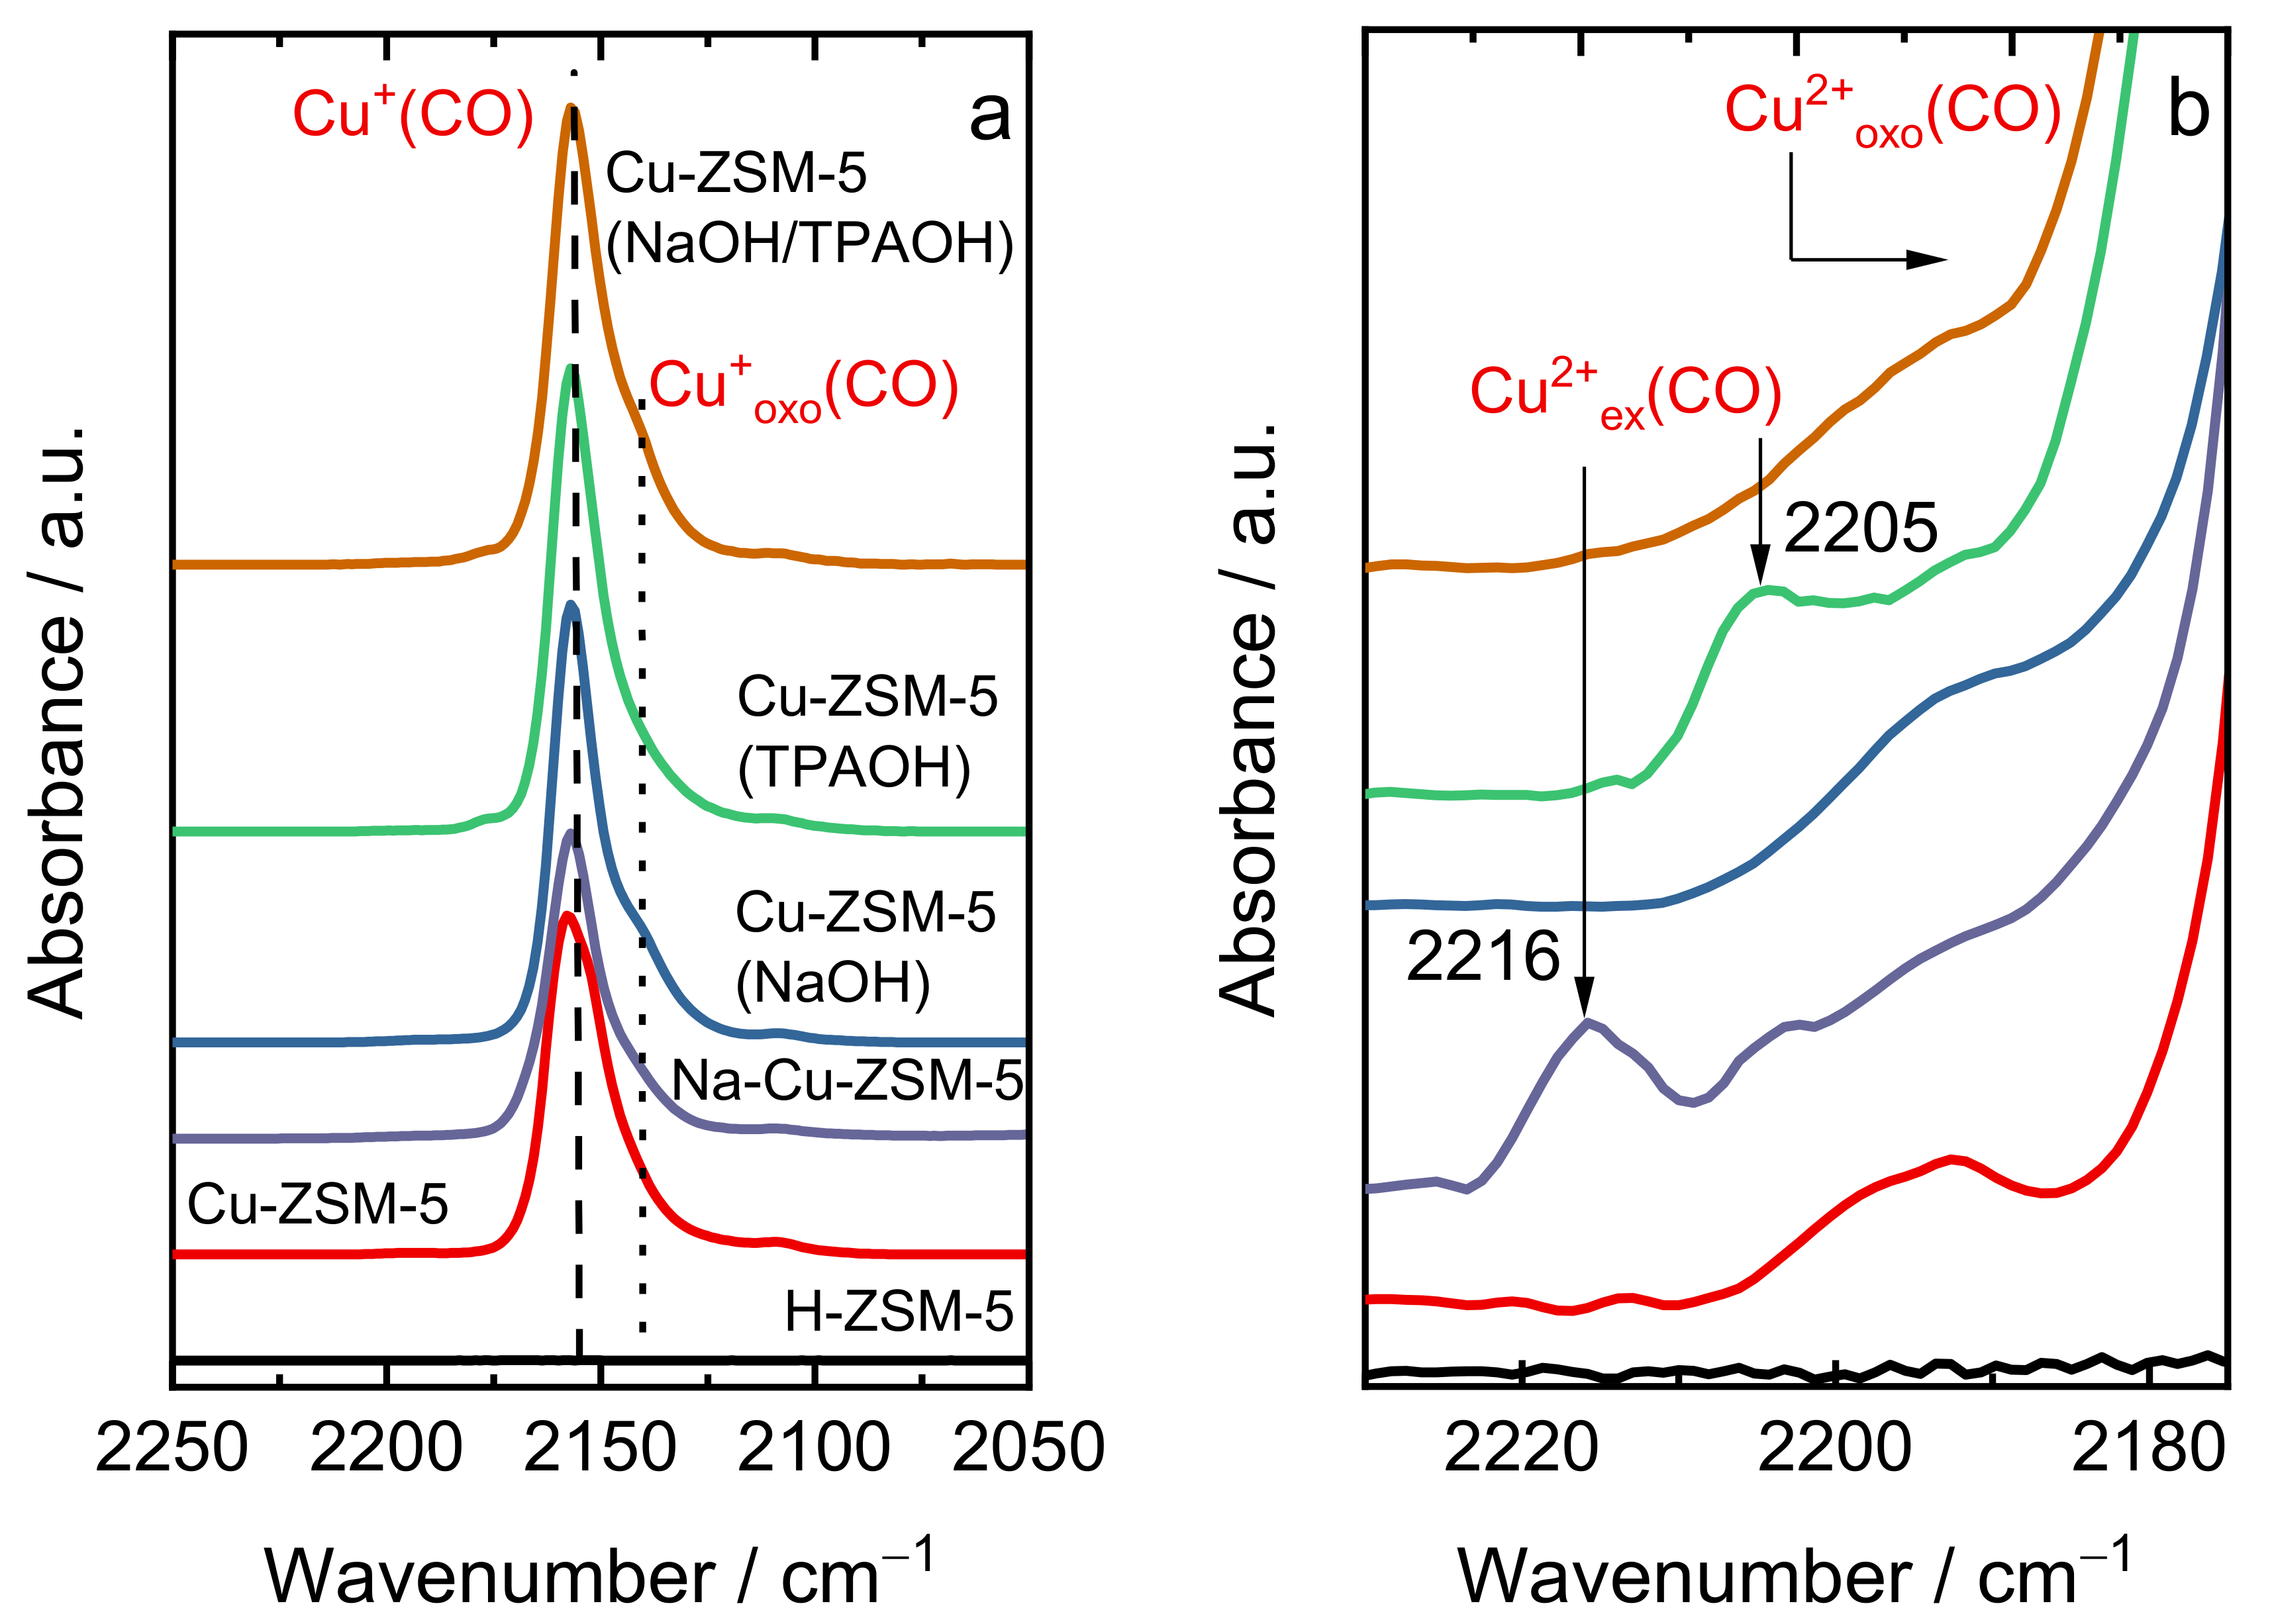
2.2. Status of Copper Species
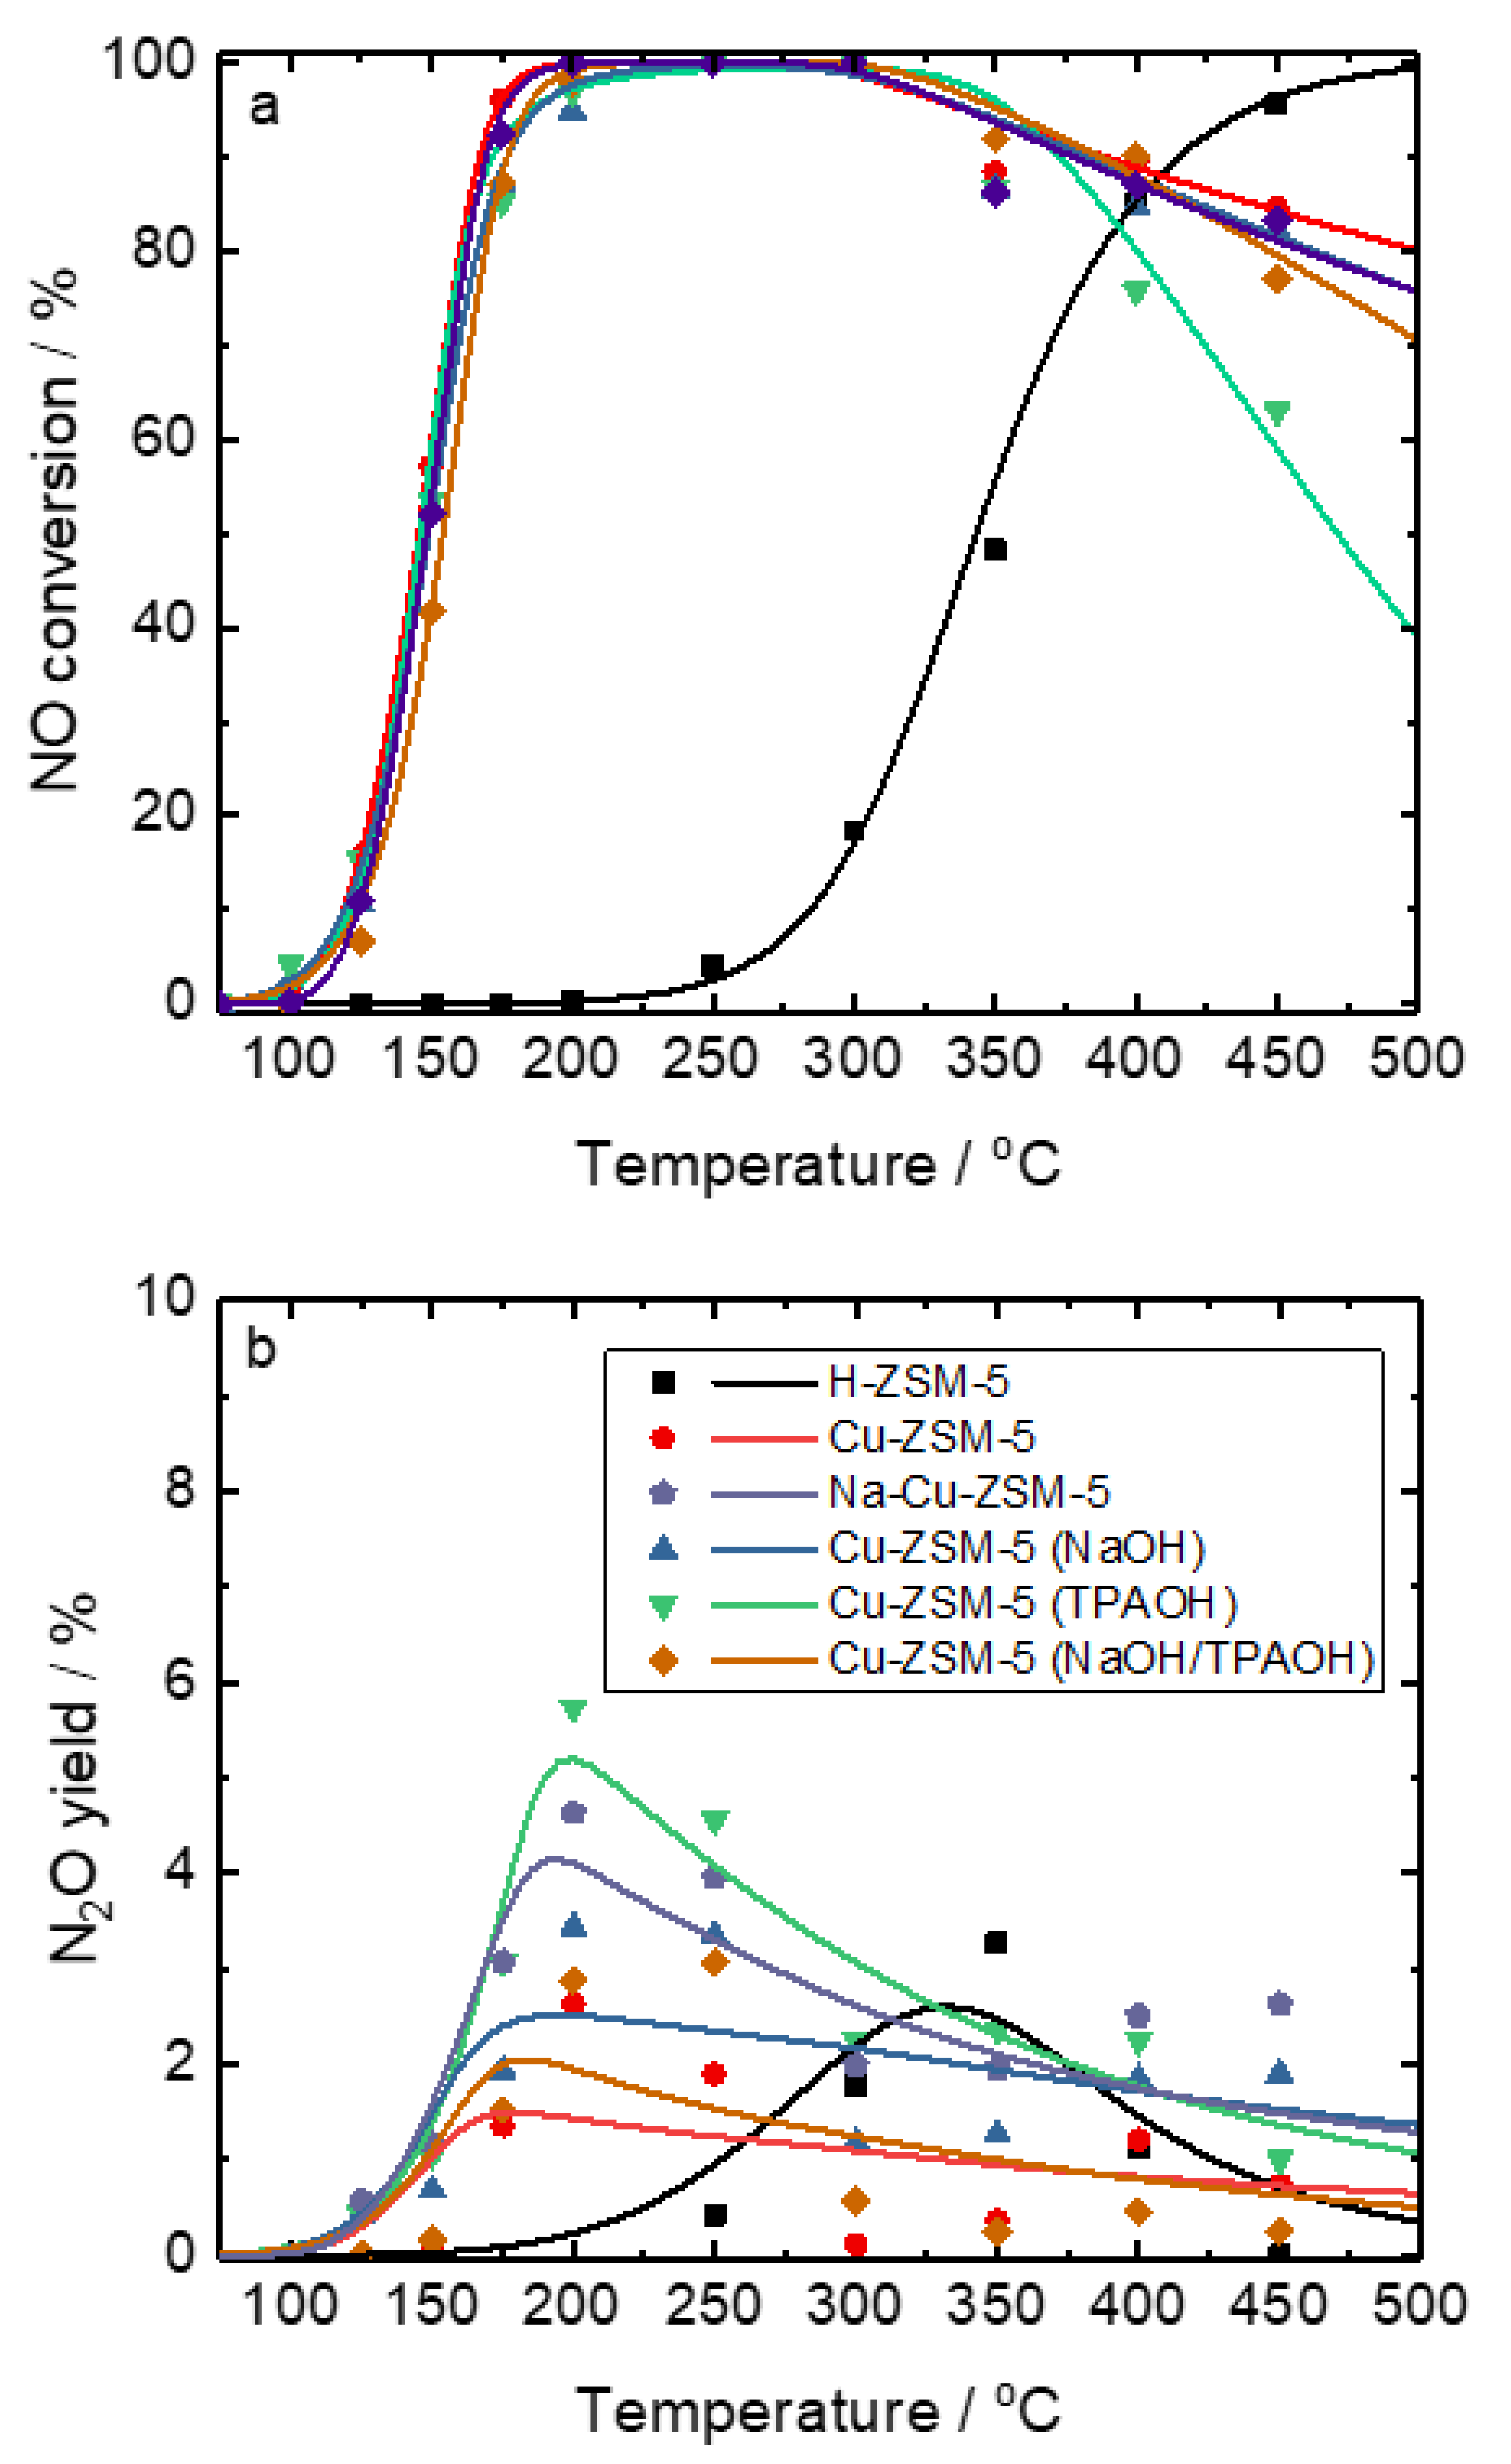
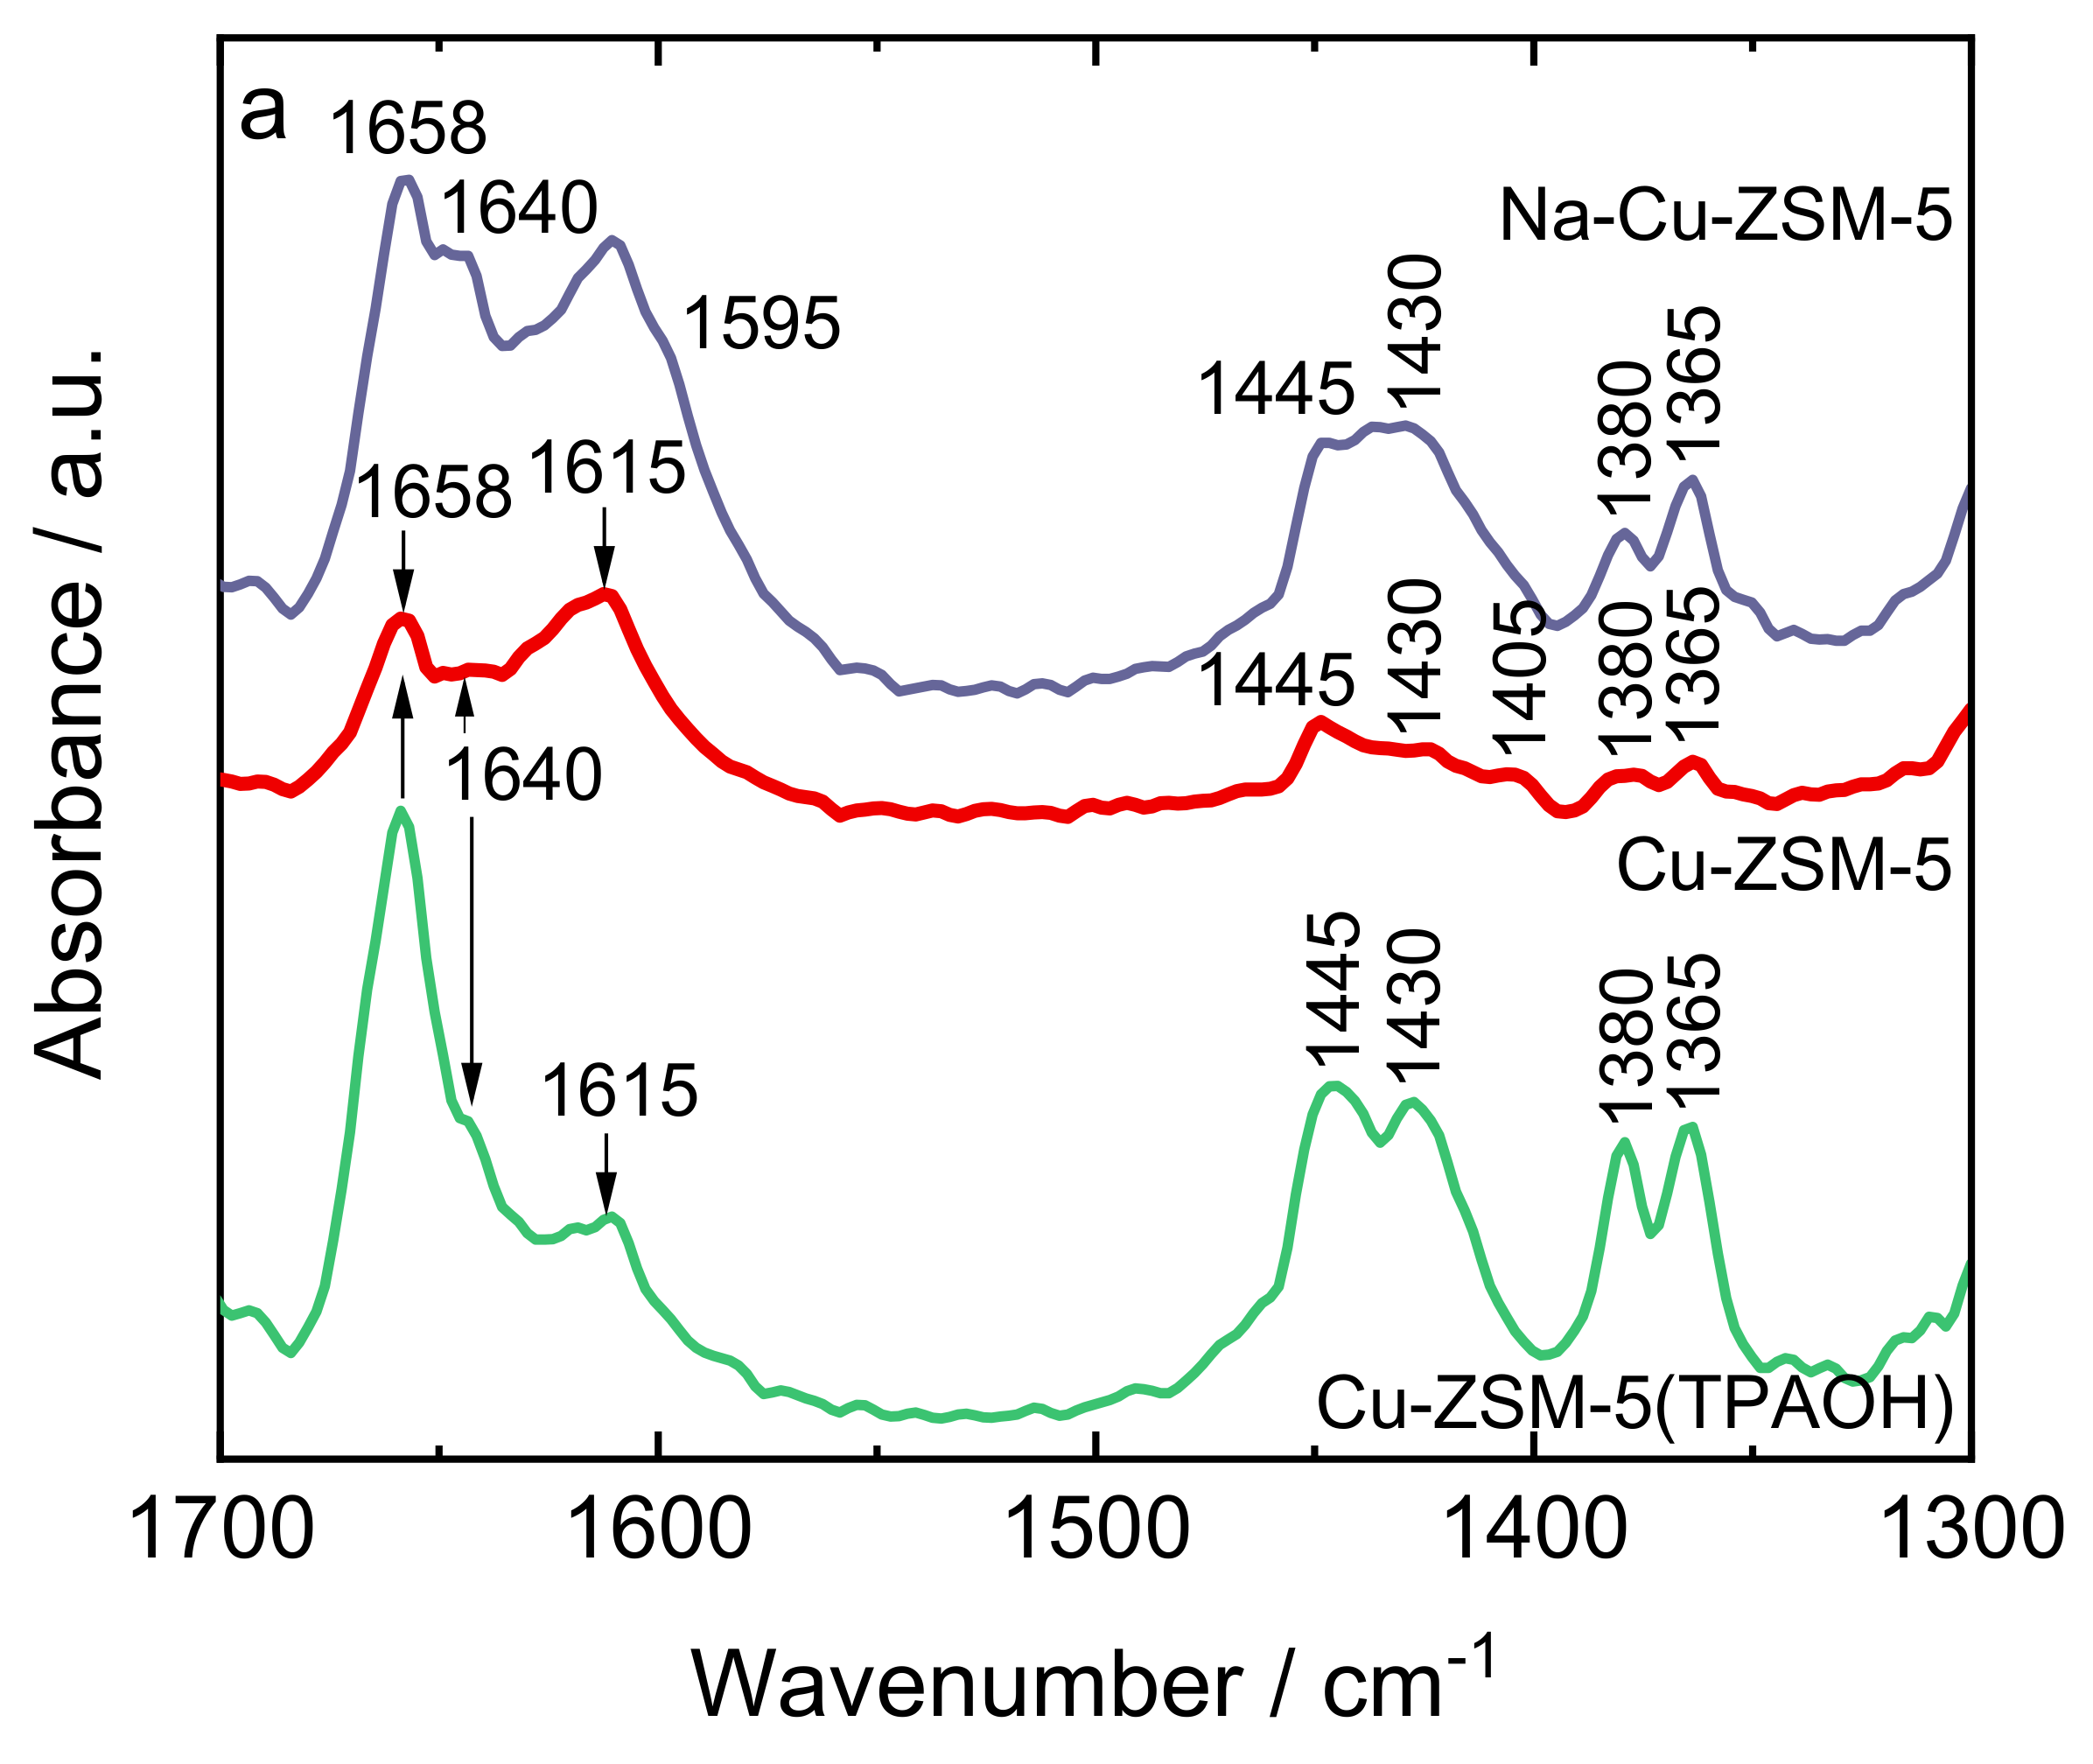
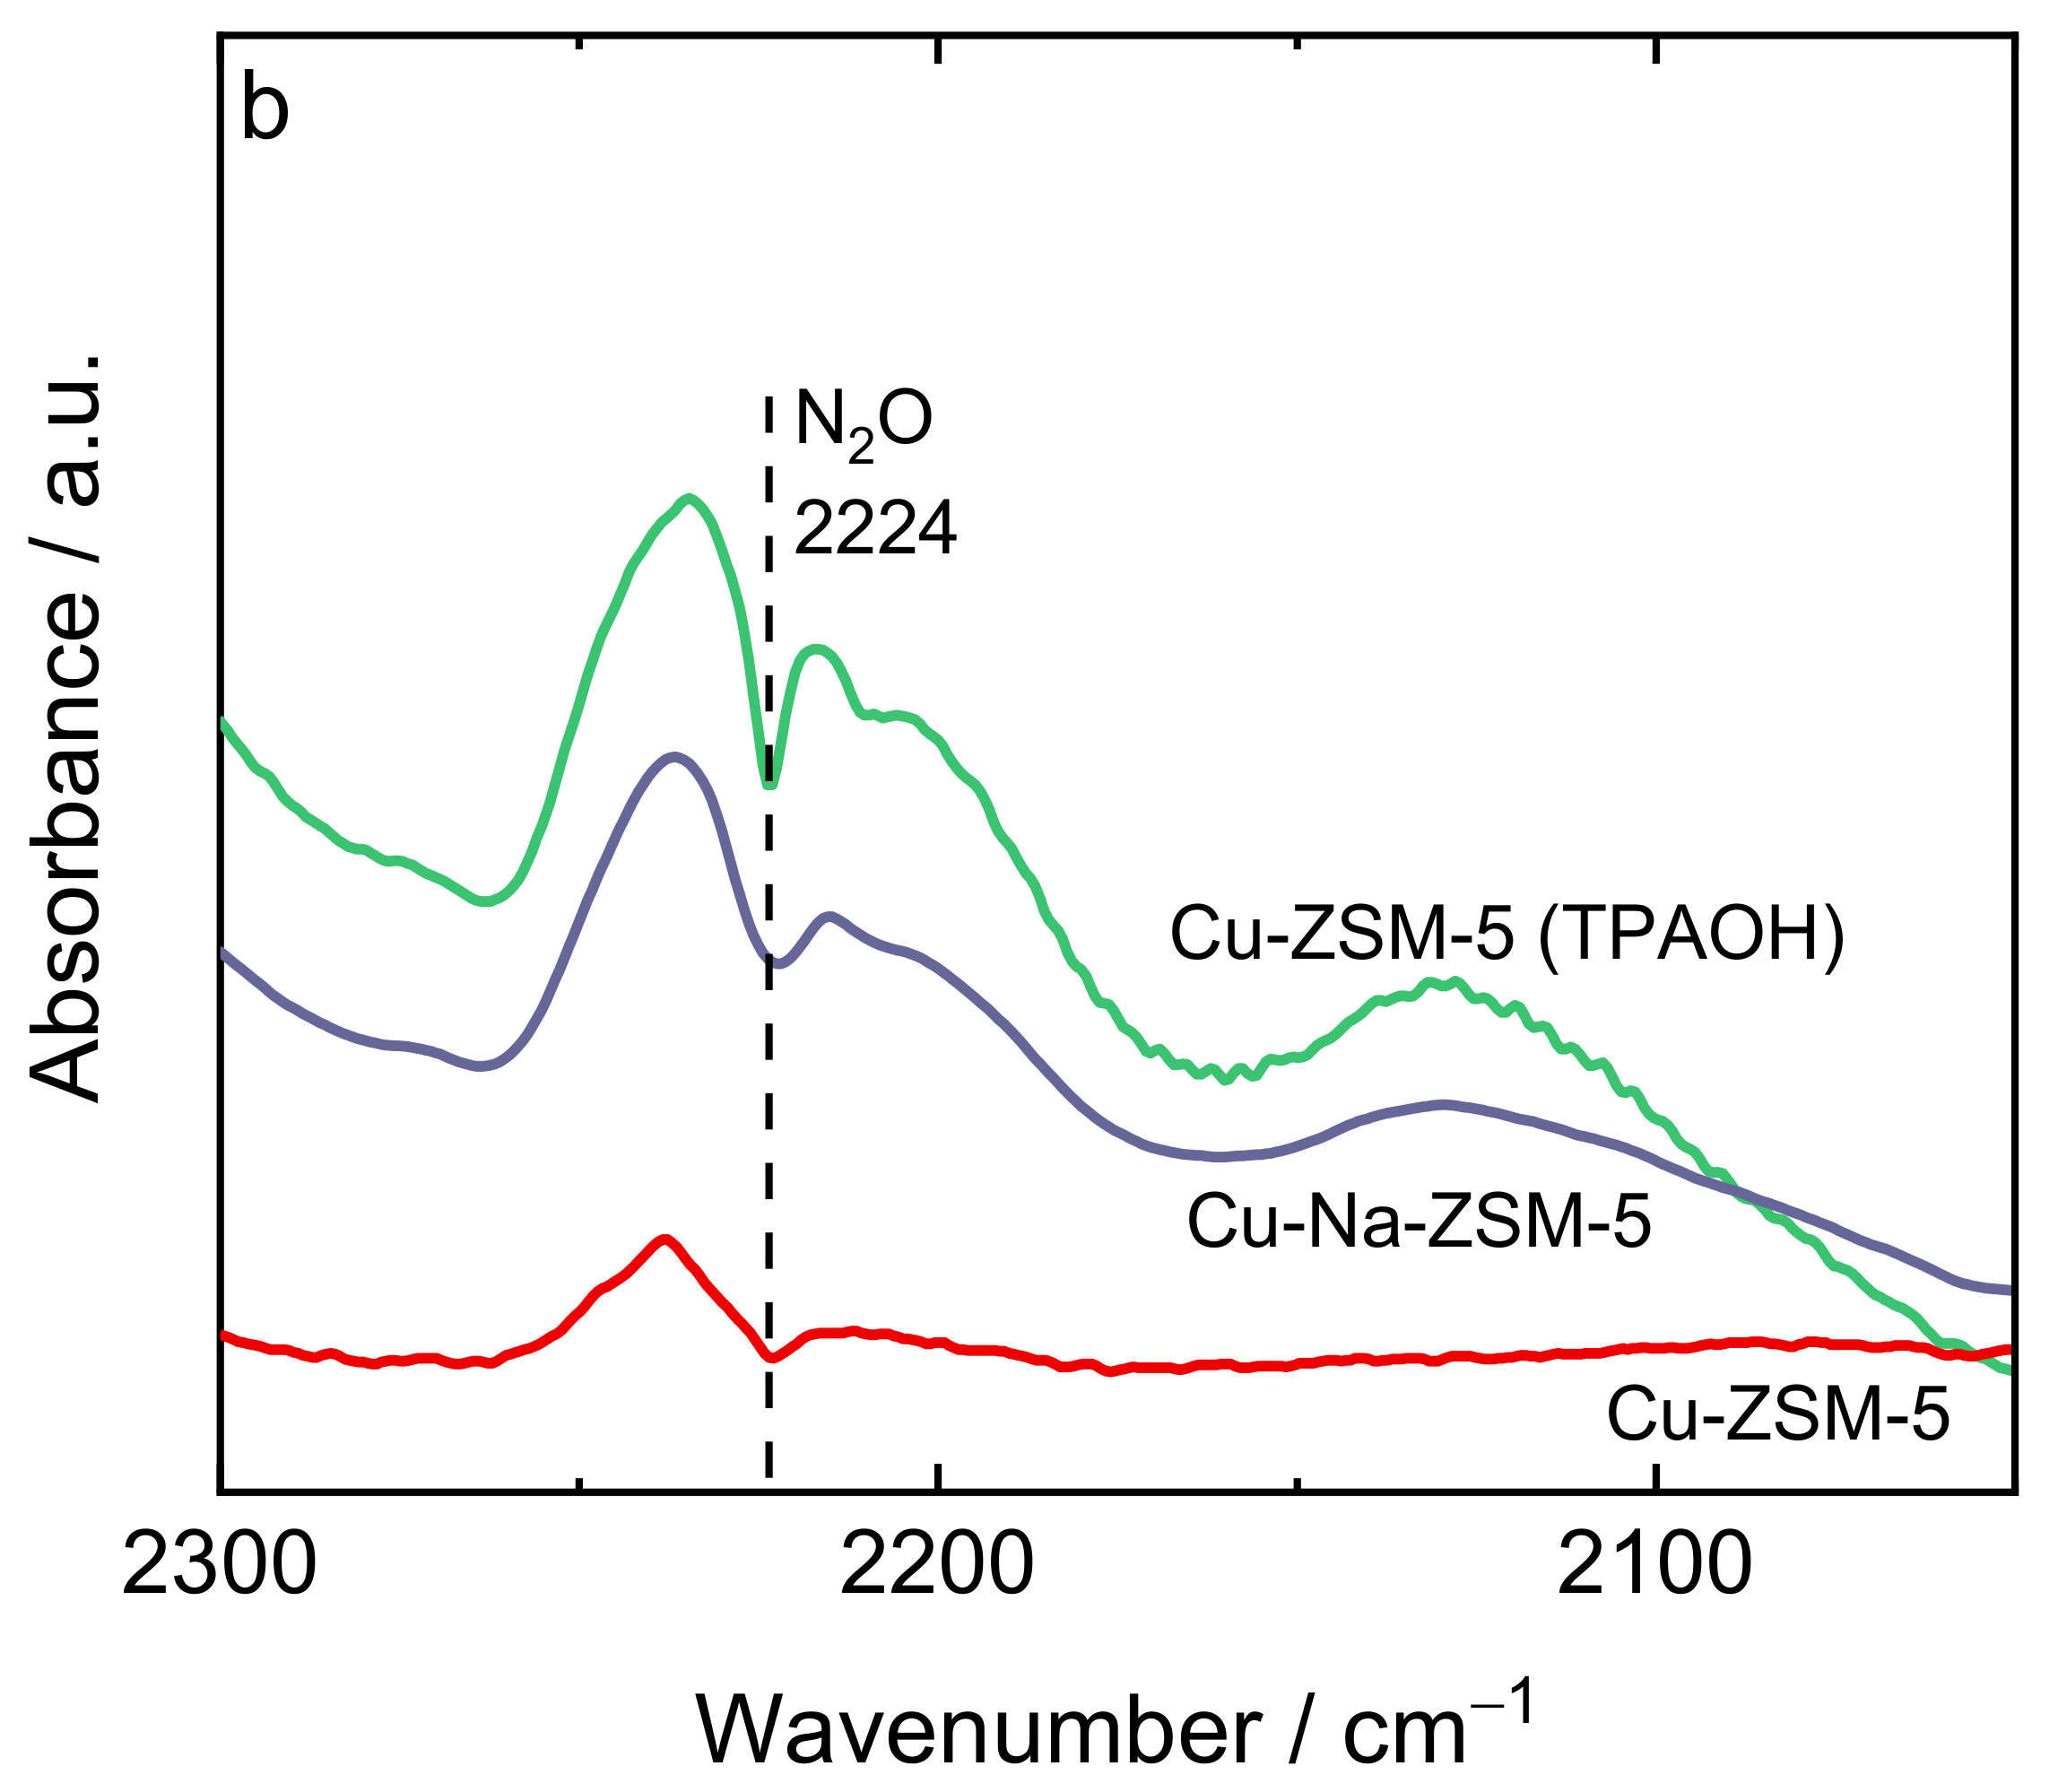
2.3. Catalytic and Spectroscopic Investigations–NH3-SCR
3. Materials and Methods
3.1. Catalyst Preparation
3.2. Catalyst Physico-Chemical Characterization
3.3. Catalytic Tests
3.4. Microkinetic Model
4. Conclusions
Supplementary Materials
Author Contributions
Funding
Institutional Review Board Statement
Informed Consent Statement
Data Availability Statement
Acknowledgments
Conflicts of Interest
References
- Deka, U.; Lezcano-Gonzalez, I.; Weckhuysen, B.M.; Beale, A.M. Local environment and nature of Cu active sites in zeolite-based catalysts for the selective catalytic reduction of NOx. ACS Catal. 2013, 3, 413–427. [Google Scholar] [CrossRef]
- Tarach, K.A.; Jabłońska, M.; Pyra, K.; Liebau, M.; Reiprich, B.; Gläser, R.; Góra-Marek, K. Effect of zeolite topology on NH3-SCR activity and stability of Cu-exchanged zeolites. Appl. Catal. B Environ. 2020, 284, 119752. [Google Scholar] [CrossRef]
- Rutkowska, M.; Pacia, I.; Baskag, S.; Kowalczyk, A.; Piwowarska, Z.; Duda Michałand Tarach, K.A.; Góra-Marek, K.; Michalik, M.; Diaz, U.; Chmielarz, L. Catalytic performance of commercial Cu-ZSM-5 zeolite modified by desilication in NH3-SCR and NH3-SCO processes. Microporous Mesoporous Mater. 2017, 246, 193–206. [Google Scholar] [CrossRef]
- Sultana, A.; Nanba, T.; Haneda, M.; Sasaki, M.; Hamada, H. Influence of co-cations on the formation of Cu+ species in Cu/ZSM-5 and its effect on selective catalytic reduction of NOx with NH3. Appl. Catal. B Environ. 2010, 101, 61–67. [Google Scholar] [CrossRef]
- Peng, C.; Yan, R.; Peng, H.; Mi, Y.; Liang, J.; Liu, W.; Wang, X.; Song, G.; Wu, P.; Liu, F. One-pot synthesis of layered mesoporous ZSM-5 plus Cu ion-exchange: Enhanced NH3-SCR performance on Cu-ZSM-5 with hierarchical pore structures. J. Hazard. Mater. 2020, 385, 121593. [Google Scholar] [CrossRef] [PubMed]
- Gao, F.; Wang, Y.; Washton, N.M.; Kollar, M.; Szanyi, J.; Peden, C.H.F. Effects of alkali and alkaline earth cocations on the activity and hydrothermal stability of Cu/SSZ-13 NH3—SCR catalysts. Acs. Catal. 2015, 5, 6780–6791. [Google Scholar] [CrossRef]
- Zhao, Z.; Yu, R.; Zhao, R.; Shi, C.; Gies, H.; Xiao, F.-S.; De Vos, D.; Yokoi, T.; Bao, X.; Kolb, U.; et al. Cu-exchanged Al-rich SSZ-13 zeolite from organotemplate-free synthesis as NH3-SCR catalyst: Effects of Na+ ions on the activity and hydrothermal stability. Appl. Catal. B Environ. 2017, 217, 421–428. [Google Scholar] [CrossRef]
- Delahay, G.; Ayala Villagomez, E.; Ducere, J.-M.; Berthomieu, D.; Goursot, A.; Coq, B. Selective catalytic reduction of NO by NH3 on Cu-faujasite catalysts: An experimental and quantum chemical approach. Chem. Phys. Chem. 2002, 3, 686–692. [Google Scholar] [CrossRef]
- Kieger, S.; Delahay, G.; Coq, B. Influence of co-cations in the selective catalytic reduction of NO by NH3 over copper exchanged faujasite zeolites. Appl. Catal. B Environ. 2000, 25, 1–9. [Google Scholar] [CrossRef]
- Coq, B.; Delahay, G.; Durand, R.; Berthomieu, D.; Ayala-Villagomez, E. The influence of cocations H, Na, and Ba on the properties of Cu-faujasite for the selective catalytic reduction of NO by NH3: An O perando DRIFT study. J. Phys. Chem. B 2004, 108, 11062–11068. [Google Scholar] [CrossRef]
- Kučera, J.; Nachtigall, P.; Kotrla, J.; Košová, G.; Čejka, J. Pyrrole as a probe molecule for characterization of basic sites in ZSM-5: A combined FTIR spectroscopy and computational study. J. Phys. Chem. B 2004, 108, 16012–16022. [Google Scholar] [CrossRef]
- Roth, W. Cation size effects in swelling of the layered zeolite precursor MCM-22-P. Pol. J. Chem. 2006, 80, 703–708. [Google Scholar]
- Ensor, D.D.; Anderson, H.L.; Conally, T.G. Heats of mixing and heats of dilution of tetrapropylammonium chloride. Temperature dependence. J. Phys. Chem. 1974, 78, 77–80. [Google Scholar] [CrossRef]
- Helmkamp, M.M.; Davis, M.E. Synthesis of porous silicates. Annu. Rev. Mater. Sci. 1995, 25, 161–192. [Google Scholar] [CrossRef]
- King, D.L.; Faz, C. Desulfurization of Tier 2 gasoline by divalent copper-exchanged zeolite Y. Appl. Catal. A Gen. 2006, 311, 58–65. [Google Scholar] [CrossRef]
- Sárkány, J.; d’Itri, J.L.; Sachtler, W.M.H. Redox chemistry in excessively ion-exchanged Cu/Na-ZSM-5. Catal. Lett. 1992, 16, 241–249. [Google Scholar] [CrossRef]
- Zhang, Y.; Leo, K.M.; Sarofim, A.F.; Hu, Z.; Flytzani-Stephanopoulos, M. Preparation effects on the activity of Cu-ZSM-5 catalysts for NO decomposition. Catal. Lett. 1995, 31, 75–89. [Google Scholar] [CrossRef]
- Thommes, M.; Kaneko, K.; Neimark, A.V.; Olivier, J.P.; Rodriguez-Reinoso, F.; Rouquerol, J.; Sing, K.S.W. Physisorption of gases, with special reference to the evaluation of surface area and pore size distribution (IUPAC Technical Report). Pure Appl. Chem. 2015, 87, 1051–1069. [Google Scholar] [CrossRef] [Green Version]
- Mei, C.; Wen, P.; Liu, Z.; Liu, H.; Wang, Y.; Yang, W.; Xie, Z.; Hua, W.; Gao, Z. Selective production of propylene from methanol: Mesoporosity development in high silica HZSM-5. J. Catal. 2008, 258, 243–249. [Google Scholar] [CrossRef]
- Groen, J.C.; Moulijn, J.A.; Pérez-Ramirez, J. Alkaline posttreatment of MFI zeolites. From accelerated screening to scale-up. Ind. Eng. Chem. Res. 2007, 46, 4193–4201. [Google Scholar] [CrossRef]
- Góra-Marek, K.; Brylewska, K.; Tarach, K.A.; Rutkowska, M.; Jabłońska, M.; Choi, M.; Chmielarz, L. IR studies of Fe modified ZSM-5 zeolites of diverse mesopore topologies in the terms of their catalytic performance in NH3-SCR and NH3-SCO processes. Appl. Catal. B Environ. 2015, 179, 589–598. [Google Scholar] [CrossRef]
- Abello, S.; Bonilla, A.; Perez-Ramirez, J. Mesoporous ZSM-5 zeolite catalysts prepared by desilication with organic hydroxides and comparison with NaOH leaching. Appl. Catal. A Gen. 2009, 364, 191–198. [Google Scholar] [CrossRef]
- Chen, B.-H.; Chao, Z.-S.; He, H.; Huang, C.; Liu, Y.-J.; Yi, W.-J.; Wei, X.-L.; An, J.-F. Towards a full understanding of the nature of Ni (II) species and hydroxyl groups over highly siliceous HZSM-5 zeolite supported nickel catalysts prepared by a deposition-precipitation method. Dalt. Trans. 2016, 45, 2720–2739. [Google Scholar] [CrossRef]
- Huo, Q.; Margolese, D.I.; Stucky, G.D. Surfactant control of phases in the synthesis of mesoporous silica-based materials. Chem. Mater. 1996, 8, 1147–1160. [Google Scholar] [CrossRef]
- Martins, L.; Peguin, R.P.S.; Wallau, M.; González, E.A.U. Cu-, Co-, Cu/Ca-and Co/Ca-exchanged ZSM-5 zeolites: Activity in the reduction of NO with methane or propane. In Studies in Surface Science and Catalysis; Elsevier: Amsterdam, The Netherlands, 2004; Volume 154, pp. 2475–2483. [Google Scholar]
- Palčić, A.; Bruzzese, P.C.; Pyra, K.; Bertmer, M.; Góra-Marek, K.; Poppitz, D.; Pöppl, A.; Gläser, R.; Jabłońska, M. Nanosized CU-SSZ-13 and its application in NH3-SCR. Catalysts 2020, 10, 506. [Google Scholar] [CrossRef]
- Olsson, L.; Sjövall, H.; Blint, R.J. Detailed kinetic modeling of NOx adsorption and NO oxidation over Cu-ZSM-5. Appl. Catal. B Environ. 2009, 87, 200–210. [Google Scholar] [CrossRef]
- Lee, D.K. Quantification and redox property of the oxygen-bridged Cu2+ dimers as the active sites for the NO decomposition over Cu-ZSM-5 catalysts. Korean J. Chem. Eng. 2004, 21, 611–620. [Google Scholar] [CrossRef]
- Torre-Abreu, C.; Ribeiro, M.F.; Henriques, C.; Delahay, G. Characterisation of CuMFI catalysts by temperature programmed desorption of NO and temperature programmed reduction. Effect of the zeolite Si/Al ratio and copper loading. Appl. Catal. B Environ. 1997, 12, 249–262. [Google Scholar] [CrossRef]
- Modén, B.; Da Costa, P.; Fonfé, B.; Lee, D.K.; Iglesia, E.; Lee, D.K. Kinetics and mechanism of steady-state catalytic NO decomposition reactions on Cu-ZSM5. J. Catal. 2002, 209, 75–86. [Google Scholar] [CrossRef]
- Zhang, W.X.; Yahiro, H.; Mizuno, N.; Iwamoto, M.; Izumi, J. Silver ion-exchanged zeolites as highly effective adsorbents for removal of NOx by pressure swing adsorption. J. Mater. Sci. Lett. 1993, 12, 1197–1198. [Google Scholar] [CrossRef]
- Torre-Abreu, C.; Ribeiro, M.F.; Henriques, C.; Delahay, G. NO TPD and H2-TPR studies for characterisation of CuMOR catalysts The role of Si/Al ratio, copper content and cocation. Appl. Catal. B Environ. 1997, 14, 261–272. [Google Scholar] [CrossRef]
- Landi, G.; Lisi, L.; Pirone, R.; Russo, G.; Tortorelli, M. Effect of water on NO adsorption over Cu-ZSM-5 based catalysts. Catal. Today 2012, 191, 138–141. [Google Scholar] [CrossRef]
- Schoonheydt, R.A. Transition metal ions in zeolites: Siting and energetics of Cu2+. Catal. Rev. Eng. 1993, 35, 129–168. [Google Scholar] [CrossRef]
- Smeets, P.J.; Groothaert, M.H.; Schoonheydt, R.A. Cu based zeolites: A UV—Vis study of the active site in the selective methane oxidation at low temperatures. Catal. Today 2005, 110, 303–309. [Google Scholar] [CrossRef]
- Dedecek, J.; Sobalik, Z.; Tvaruazkova, Z.; Kaucky, D.; Wichterlova, B. Coordination of Cu ions in high-silica zeolite matrixes. Cu+ photoluminescence, IR of NO adsorbed on Cu2+, and Cu2+ ESR study. J. Phys. Chem. 1995, 99, 16327–16337. [Google Scholar] [CrossRef]
- Fernández, E.; Moreno-González, M.; Moliner, M.; Blasco, T.; Boronat, M.; Corma, A. Modeling of EPR parameters for Cu (II): Application to the selective reduction of NO x catalyzed by Cu-zeolites. Top. Catal. 2018, 61, 810–832. [Google Scholar] [CrossRef]
- Anderson, M.W.; Kevan, L. Study of copper(2+)-doped zeolite NaH-ZSM-5 by electron spin resonance and electron spin echo modulation spectroscopies. J. Phys. Chem. 1987, 91, 4174–4179. [Google Scholar] [CrossRef]
- Conesa, J.C.; Soria, J. Electron spin resonance of copper-exchanged Y zeolites. Part 1—Behaviour of the cation during dehydration. J. Chem. Soc. Faraday Trans. 1 Phys. Chem. Condens. Phases 1979, 75, 406–422. [Google Scholar] [CrossRef]
- Oliva, C.; Selli, E.; Ponti, A.; Correale, L.; Solinas, V.; Rombi, E.; Monaci, R.; Forni, L. FTIR and EPR characterisation of copper-exchanged mordenites and beta zeolites. J. Chem. Soc. Faraday Trans. 1997, 93, 2603–2608. [Google Scholar] [CrossRef]
- Carl, P.J.; Larsen, S.C. Variable-temperature electron paramagnetic resonance studies of copper-exchanged zeolites. J. Catal. 1999, 182, 208–218. [Google Scholar] [CrossRef]
- Kucherov, A.V.; Karge, H.G.; Schlögl, R. Quantitative ESR study of the CuH-ZSM-5 system: Influence of preparation and pretreatment techniques on the valence state of copper. Microporous Mesoporous Mater. 1998, 25, 7–14. [Google Scholar] [CrossRef]
- Groothaert, M.H.; Pierloot, K.; Delabie, A.; Schoonheydt, R.A. Identification of Cu (ii) coordination structures in Cu-ZSM-5, based on a DFT/ab initio assignment of the EPR spectra. Phys. Chem. Chem. Phys. 2003, 5, 2135–2144. [Google Scholar] [CrossRef]
- Góra-Marek, K.; Palomares, A.E.; Glanowska, A.; Sadowska, K.; Datka, J. Copper sites in zeolites-quantitative IR studies. Microporous Mesoporous Mater. 2012, 162, 175–180. [Google Scholar] [CrossRef]
- Sjövall, H.; Olsson, L.; Fridell, E.; Blint, R.J. Selective catalytic reduction of NOx with NH3 over Cu-ZSM-5—The effect of changing the gas composition. Appl. Catal. B Environ. 2006, 64, 180–188. [Google Scholar] [CrossRef]
- Stoll, S.; Schweiger, A. EasySpin, a comprehensive software package for spectral simulation and analysis in EPR. J. Magn. Reson. 2006, 178, 42–55. [Google Scholar] [CrossRef] [PubMed]
- Fairbanks, D.F.; Wilke, C.R. Diffusion coefficients in multicomponent gas mixtures. Ind. Eng. Chem. 1950, 42, 471–475. [Google Scholar] [CrossRef]


| Samples | Si/wt % | Al/wt % | Cu/wt % | Co-Cation/wt % | n(Si)/n(Al) | Cu Exchange Level/% | Cryst. Level/% |
|---|---|---|---|---|---|---|---|
| H-ZSM-5 | 38.9 | 2.9 | - | - | 12.3 | - | 100 |
| Cu-ZSM-5 | 38.6 | 2.9 | 2.8 | - | 12.8 | 82 | 75 |
| Na-Cu-ZSM-5 | - | - | 4.2 | 0.05 (Na) | - | - | 131 |
| Cu-ZSM-5 (NaOH) | 36.0 | 3.1 | 2.7 | - | 11.2 | 74 | 83 |
| Cu-ZSM-5 (TPAOH) | 37.0 | 2.9 | 3.3 | - | 12.3 | 97 | 57 |
| Cu-ZSM-5 (NaOH/TPAOH) | 37.0 | 3.0 | 2.7 | - | 11.8 | 76 | 54 |
| Samples | CBrønsted/µmol g−1 | CLewis/µmol g−1 | CTotal/µmol g−1 |
|---|---|---|---|
| H-ZSM-5 | 635 | 0 | 635 |
| Cu-ZSM-5 | 200 | 600 | 800 |
| Na-Cu-ZSM-5 | 262 | 1280 | 1542 |
| Cu-ZSM-5 (NaOH) | 185 | 425 | 600 |
| Cu-ZSM-5 (TPAOH) | 60 | 1050 | 1100 |
| Cu-ZSM-5 (NaOH/TPAOH) | 255 | 735 | 990 |
| Samples | aS(BET)/m2 g−1 | VMIC/cm3 g−1 | VMES/cm3 g−1 | VTOT/cm3 g−1 |
|---|---|---|---|---|
| H-ZSM-5 | 318 | 0.14 | 0.05 | 0.19 |
| Cu-ZSM-5 | 296 | 0.13 | 0.06 | 0.19 |
| Na-Cu-ZSM-5 | 296 | 0.12 | 0.07 | 0.19 |
| Cu-ZSM-5 (NaOH) | 329 | 0.13 | 0.10 | 0.23 |
| Cu-ZSM-5 (TPAOH) | 290 | 0.13 | 0.06 | 0.19 |
| Cu-ZSM-5 (NaOH/TPAOH) | 337 | 0.13 | 0.10 | 0.23 |
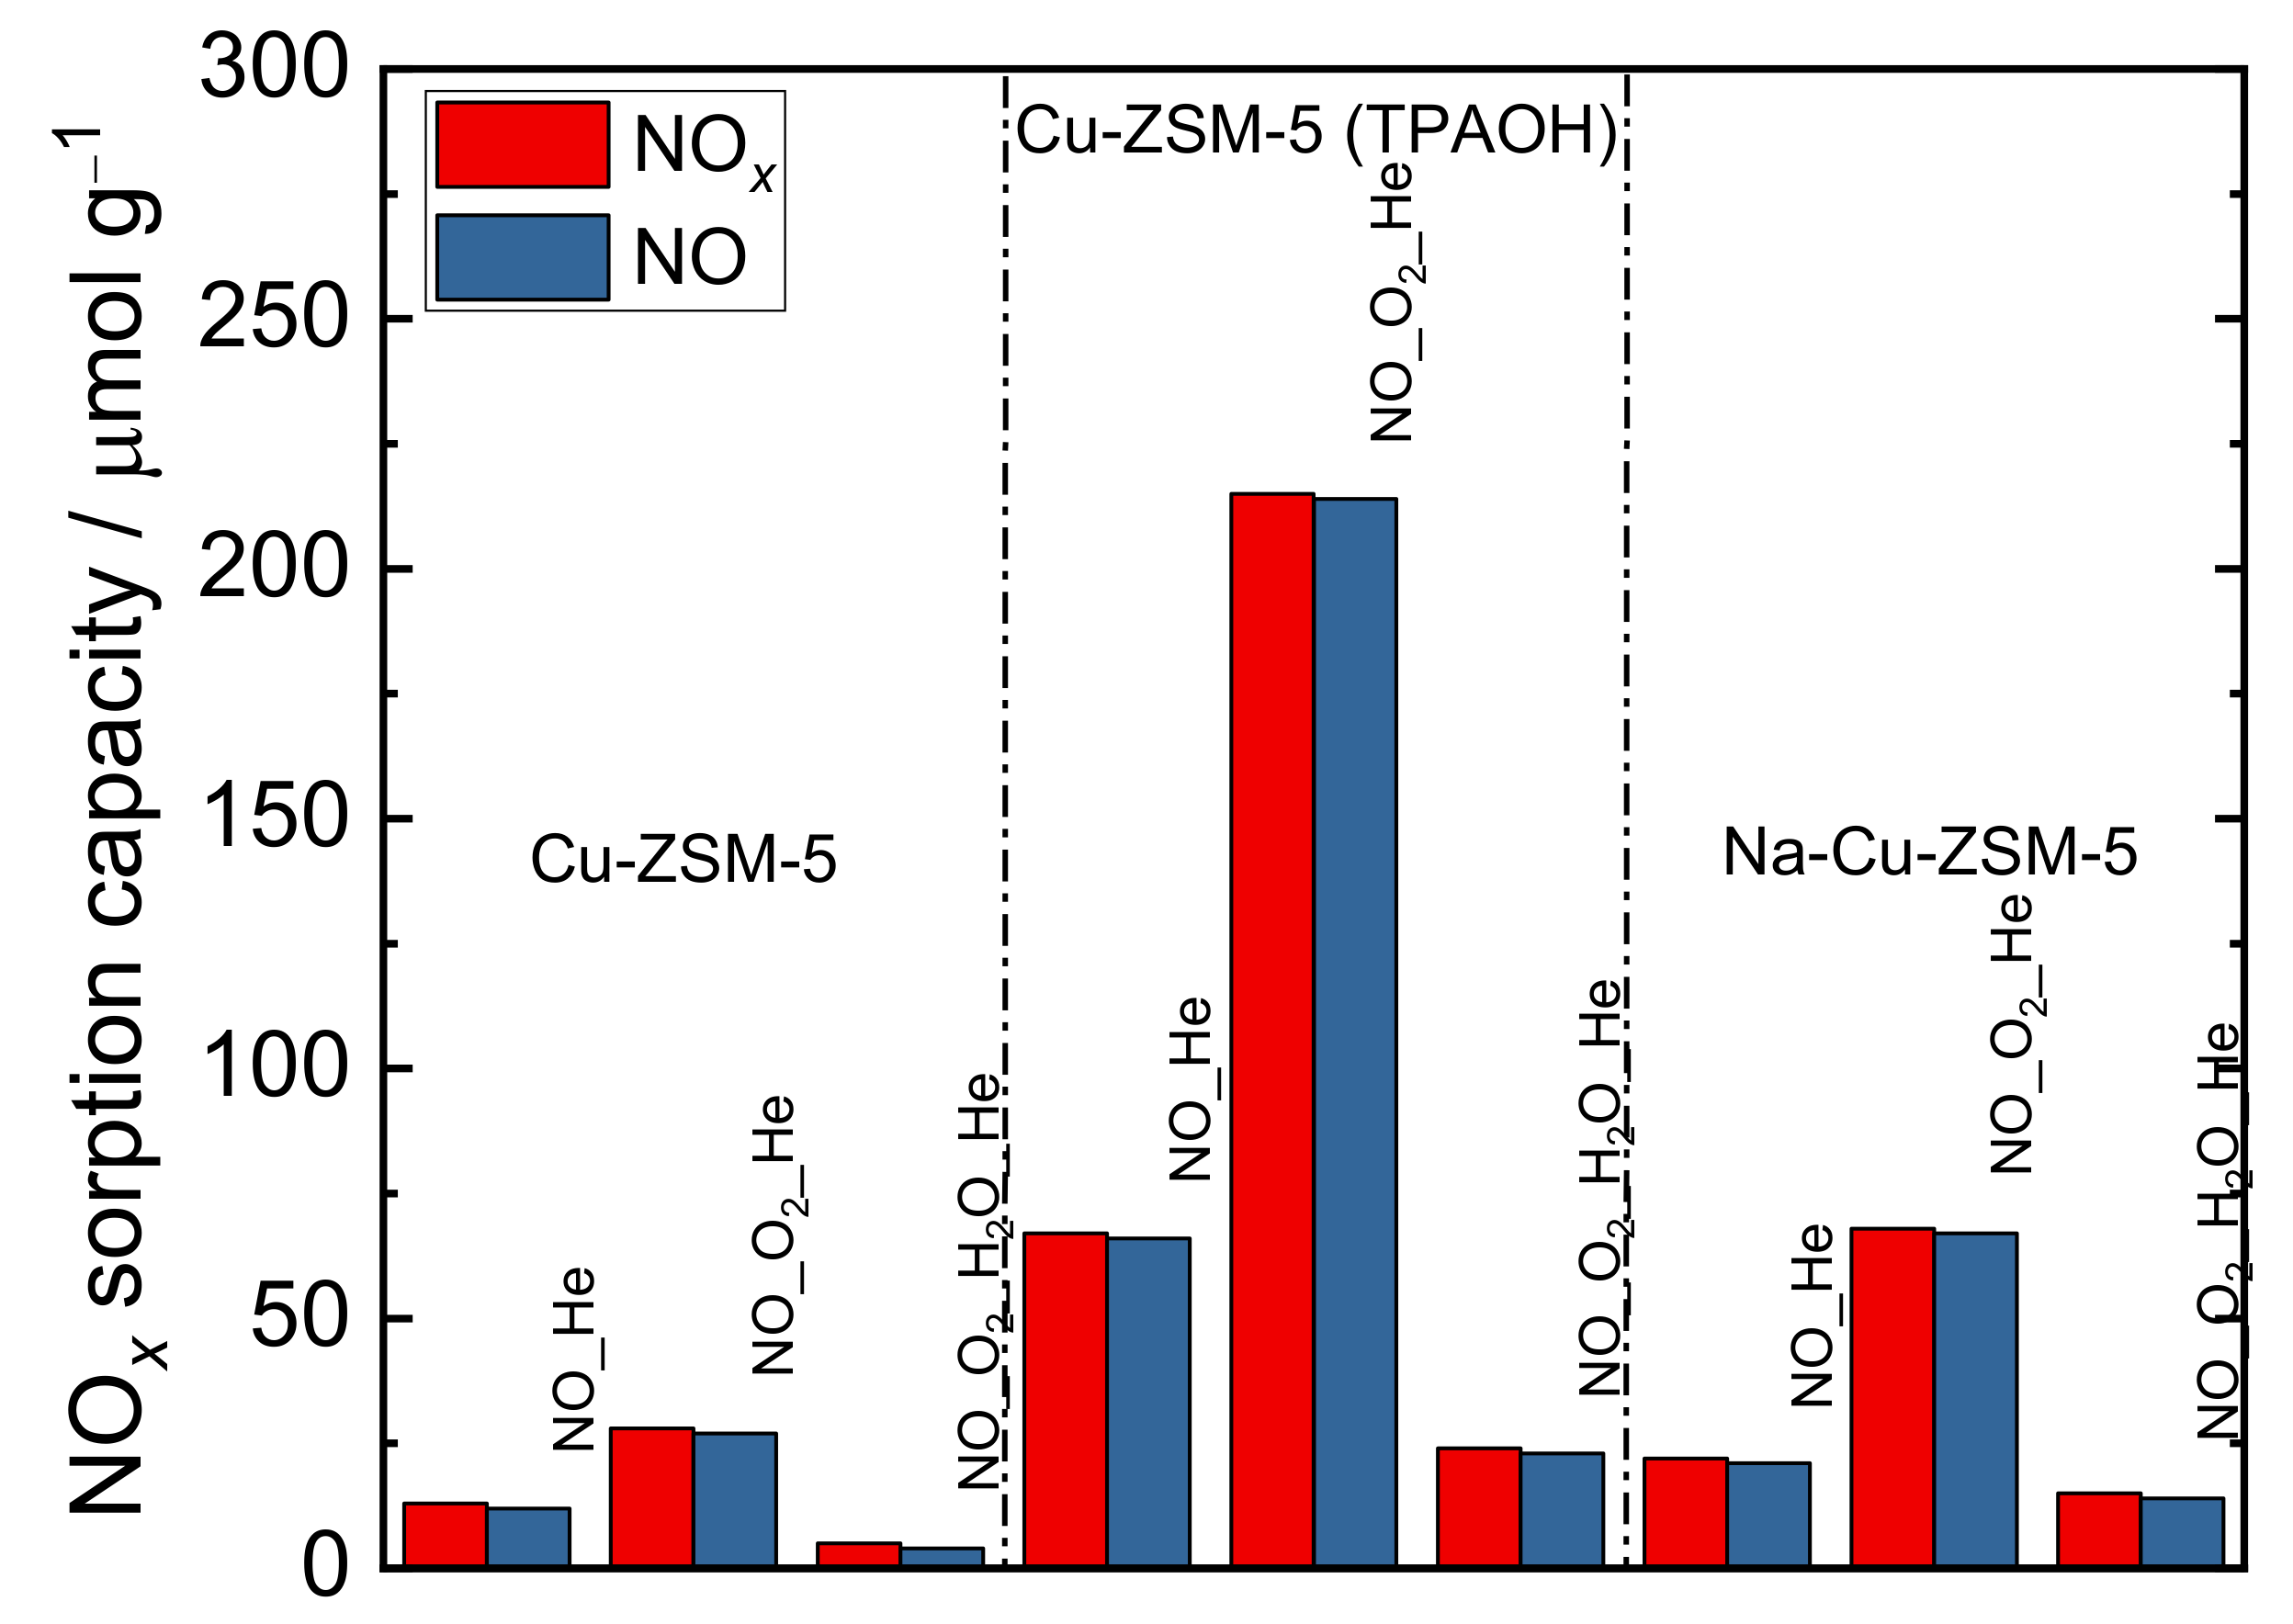
| Sample | CNO/µmol g−1 | CNOx/µmol g−1 |
|---|---|---|
| H-ZSM-5 | 4 | 10 |
| Cu-ZSM-5 | 19 | 68 |
| Na-Cu-ZSM-5 | 13 | 121 |
| Cu-ZSM-5 (NaOH) | 39 | 50 |
| Cu-ZSM-5 (TPAOH) | 46 | 89 |
| Cu-ZSM-5 (NAOH/TPAOH) | 26 | 69 |
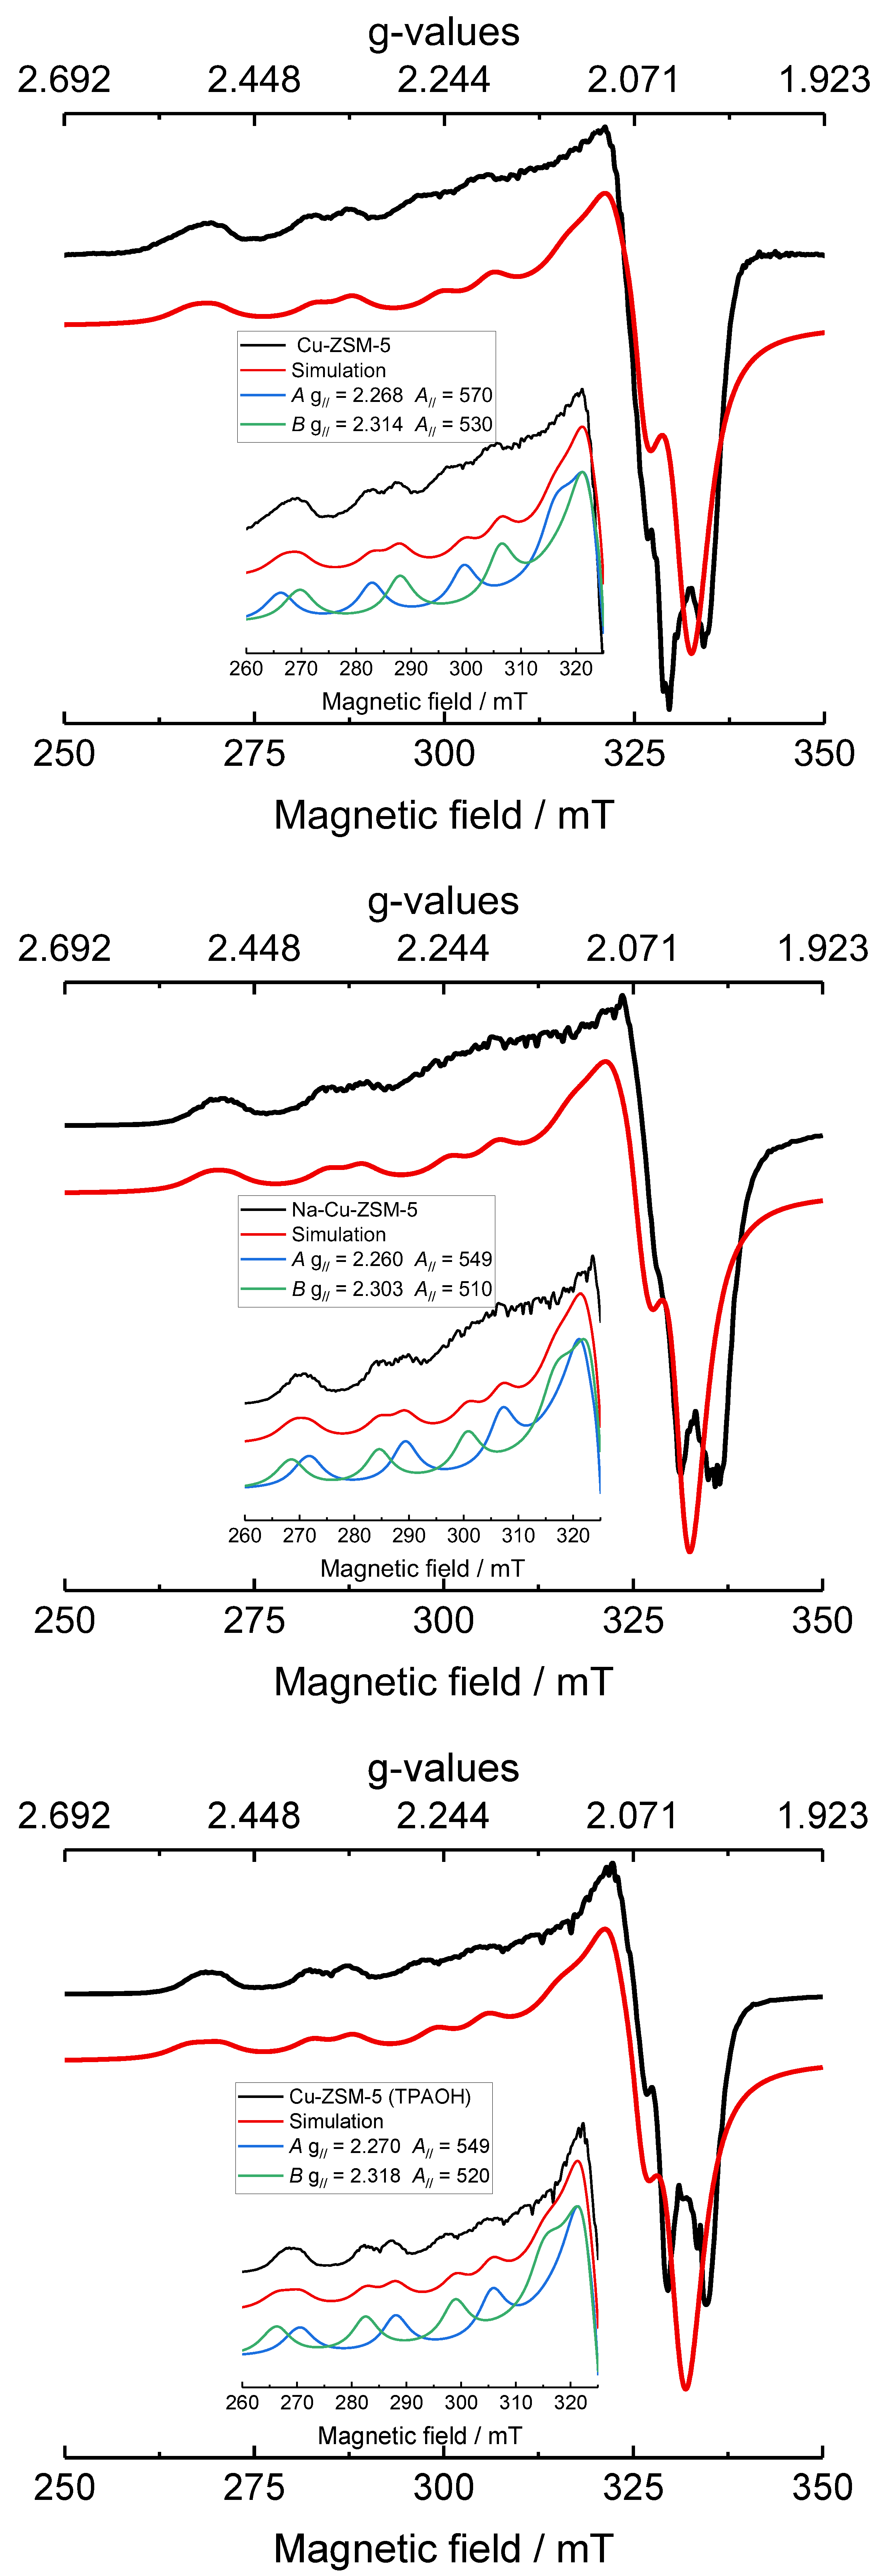
| Samples | Species | gꓕ | g// | Aꓕ/MHz | A///MHz | lwpp/mT |
|---|---|---|---|---|---|---|
| Cu-ZSM-5 | A | 2.073 ± 0.002 | 2.268 ± 0.001 | 40 ± 10 | 570 ± 5 | +3.3 ± 0.5 |
| B | 2.068 ± 0.002 | 2.314 ± 0.001 | 40 ± 10 | 530 ± 4 | +3.3 ± 0.5 | |
| Na-Cu-ZSM-5 | A | 2.073 ± 0.002 | 2.260 ± 0.001 | 40 ± 10 | 549 ± 5 | +3.3 ± 0.5 |
| B | 2.063 ± 0.002 | 2.303 ± 0.001 | 40 ± 10 | 510 ± 4 | +3.3 ± 0.5 | |
| Cu-ZSM-5 (TPAOH) | A | 2.073 ± 0.002 | 2.270 ± 0.001 | 40 ± 10 | 549 ± 5 | +3.3 ± 0.5 |
| B | 2.068 ± 0.002 | 2.318 ± 0.001 | 40 ± 10 | 520 ± 4 | +3.3 ± 0.5 |
| Samples | C(Cu+exch)/µmol g−1 | C(Cu+oxo)/µmol g−1 | C(Cu2+exch+oxo)/µmol g−1 | CTotal/µmol g−1 |
|---|---|---|---|---|
| Cu-ZSM-5 | 160 | 22 | 115 | 297 |
| Na-Cu-ZSM-5 | 152 | 25 | 265 | 442 |
| Cu-ZSM-5 (NaOH) | 170 | 35 | 145 | 350 |
| Cu-ZSM-5 (TPAOH) | 185 | 15 | 295 | 495 |
| Cu-ZSM-5 (NaOH/TPAOH) | 190 | 30 | 120 | 340 |
| O2→ | O2→ H2O | O2→N2O | |||||||
|---|---|---|---|---|---|---|---|---|---|
| * TOF1/s−1 | * TOF2/s−1 | * TOF3/s−1 | |||||||
| H-ZSM-5 | (3.9 ± 0.4) × 10−8 | 154 ± 1 | 3.06 × 10⁻⁹ | (1 ± 1) × 10−4 | 58 ± 58 | 1.59 × 10⁻⁵ | (1.0 ± 0.3) × 10−6 | 85 ± 4 | 7.99 × 10⁻⁸ |
| Cu-ZSM-5 | (1.7 ± 0.1) × 10−3 | 119 ± 3 | 1.50 × 10⁻⁴ | (5.2 ± 0.7) × 10−3 | 143 ± 4 | 1.90 × 10⁻³ | (3.2 ± 0.9) × 10−5 | 82 ± 5 | 2.73 × 10⁻⁶ |
| Na-Cu-ZSM-5 | (1.01 ± 0.05) × 10−3 | 156 ± 1 | 7.28 × 10⁻⁵ | (3.8 ± 0.4) × 10−3 | 79 ± 1 | 1.20 × 10⁻³ | (4.1 ± 0.6) × 10−5 | 152 ± 1 | 2.99 × 10⁻⁶ |
| Cu-ZSM-5 (NaOH) | (2.4 ± 0.2) × 10−3 | 106 ± 2 | 1.89 × 10⁻⁴ | (3.9 ± 0.3) × 10−3 | 87 ± 6 | 1.45 × 10⁻³ | (7.1 ± 1.9) × 10−5 | 102 ± 5 | 5.51 × 10⁻⁶ |
| Cu-ZSM-5 (TPAOH) | (6.0 ± 0.4) × 10−4 | 85 ± 2 | 1.01 × 10⁻⁴ | (5.5 ± 0.8) × 10−3 | 101 ± 5 | 1.07 × 10⁻³ | (3.0 ± 0.9) × 10−5 | 79 ± 3 | 5.07 × 10⁻⁶ |
| Cu-ZSM-5 (NaOH/TPAOH) | (1.1 ± 0.1) × 10−3 | 104 ± 2 | 8.27 × 10⁻⁵ | (2.7 ± 0.6) × 10−2 | 111 ± 20 | 8.41 × 10⁻⁴ | (3.1 ± 1.7) × 10−5 | 93 ± 11 | 2.45 × 10⁻⁶ |
| ** Cu-ZSM-5 | (2.19 ± 0.05) × 10−3 | 119 ± 3 | 1.86 × 10⁻⁴ | (5.4 ± 0.4) × 10−4 | 143 ± 4 | 2.53 × 10⁻⁴ | (1.2 ± 0.6) × 10−4 | 105 ± 1 | 1.05 × 10⁻⁵ |
| ** Na-Cu-ZSM-5 | (1.09 ± 0.07) × 10−3 | 149 ± 3 | 7.75 × 10⁻⁵ | (2.4 ± 0.9) × 10−4 | 131 ± 3 | 8.76 × 10⁻⁵ | (4.6 ± 1.3) × 10−5 | 136 ± 2 | 3.26 × 10⁻⁶ |
| ** Cu-ZSM-5 (TPAOH) | (4.3 ± 0.2) × 10−4 | 94 ± 3 | 7.04 × 10⁻⁵ | (3.1 ± 0.7) × 10−3 | 105 ± 10 | 3.93 × 10⁻⁴ | (3.5 ± 0.8) × 10−5 | 82 ± 5 | 5.59 × 10⁻⁶ |
Publisher’s Note: MDPI stays neutral with regard to jurisdictional claims in published maps and institutional affiliations. |
© 2021 by the authors. Licensee MDPI, Basel, Switzerland. This article is an open access article distributed under the terms and conditions of the Creative Commons Attribution (CC BY) license (https://creativecommons.org/licenses/by/4.0/).
Share and Cite
Jabłońska, M.; Góra-Marek, K.; Grilc, M.; Bruzzese, P.C.; Poppitz, D.; Pyra, K.; Liebau, M.; Pöppl, A.; Likozar, B.; Gläser, R. Effect of Textural Properties and Presence of Co-Cation on NH3-SCR Activity of Cu-Exchanged ZSM-5. Catalysts 2021, 11, 843. https://doi.org/10.3390/catal11070843
Jabłońska M, Góra-Marek K, Grilc M, Bruzzese PC, Poppitz D, Pyra K, Liebau M, Pöppl A, Likozar B, Gläser R. Effect of Textural Properties and Presence of Co-Cation on NH3-SCR Activity of Cu-Exchanged ZSM-5. Catalysts. 2021; 11(7):843. https://doi.org/10.3390/catal11070843
Chicago/Turabian StyleJabłońska, Magdalena, Kinga Góra-Marek, Miha Grilc, Paolo Cleto Bruzzese, David Poppitz, Kamila Pyra, Michael Liebau, Andreas Pöppl, Blaž Likozar, and Roger Gläser. 2021. "Effect of Textural Properties and Presence of Co-Cation on NH3-SCR Activity of Cu-Exchanged ZSM-5" Catalysts 11, no. 7: 843. https://doi.org/10.3390/catal11070843
APA StyleJabłońska, M., Góra-Marek, K., Grilc, M., Bruzzese, P. C., Poppitz, D., Pyra, K., Liebau, M., Pöppl, A., Likozar, B., & Gläser, R. (2021). Effect of Textural Properties and Presence of Co-Cation on NH3-SCR Activity of Cu-Exchanged ZSM-5. Catalysts, 11(7), 843. https://doi.org/10.3390/catal11070843