Article

In Vitro Digestibility and Antioxidant Activity of Plant Protein Isolate and Milk Protein Concentrate Blends

by
Mohammadreza Khalesi
and
Richard J. FitzGerald
*
Department of Biological Sciences, University of Limerick, V94 T9PX Limerick, Ireland
*
Author to whom correspondence should be addressed.
Catalysts 2021, 11(7), 787; https://doi.org/10.3390/catal11070787
Submission received: 5 June 2021 / Revised: 25 June 2021 / Accepted: 26 June 2021 / Published: 28 June 2021

Abstract

:
The replacement of animal with plant proteins in human diets has been increasing in recent years. The impact of blending milk protein concentrate (MPC) with protein isolates from soy (SPI), rice (RPI) and pea (PPI) on the in vitro digestibility and antioxidant activity of the resultant blends was investigated. Different plant protein–MPC blends (i.e., SPI–MPC (25:75), RPI–MPC (50:50) and PPI–MPC (25:75)) were analyzed. The lowest protein digestibility corrected amino acid score (PDCAAS) was associated with RPI (0.70), while the blends had PDCAAS values above 1.00 demonstrating the high digestibility of the proteins in the blends studied. An in vitro simulated gastrointestinal digestion was carried out on the samples. The degree of hydrolysis and gel permeation high performance liquid chromatography profiles showed that the SPI–MPC blend was more extensively digested in the gastric phase compared with the two other blends, while the PPI–MPC and RPI–MPC blends were mainly digested during the intestinal phase. The SPI–MPC digested blend had the highest 2,2′-azino-bis(3-ethylbenzothiazoline-6-sulfonic acid) (ABTS) radical scavenging activity having a half maximal effective concentration (EC50) of 0.10 ± 0.01 mg/mL. The findings show that blends of plant protein with MPC had higher in vitro digestibility and antioxidant activity compared to the individual plant protein isolates.

1. Introduction

Due to increasing consumer awareness about the benefits of a healthy dietary pattern along with increasing concerns about environmental sustainability, the demand for alternatives to animal origin protein is increasing [1]. A number of studies have focused on the replacement of animal-based proteins with plant proteins. The proteins from various plants, e.g., soybean, rice, pea, corn, wheat, rye, have been extracted, characterized and used in numerous food applications [2]. Using plant proteins in the form of concentrates and isolates, however, may sometimes be restricted by their poor technofunctional properties (e.g., solubility) and sometimes due to an imbalance in amino acid (AA) composition, a lack of some essential AAs (EAAs), low digestibility, and the presence of allergenic compounds and antinutritional factors (ANFs), e.g., protease inhibitors, lectins and phytate [3]. Several strategies have been conducted to overcome these potential restrictions including the application of thermal treatment, fermentation, enzyme hydrolysis and other processes which help improve the nutritional quality and digestibility of plant protein ingredients [4].
Furthermore, blending of plant with animal origin proteins is a promising strategy to overcome the technofunctional and nutritional limitations of plant proteins [5]. Augmentation of dairy proteins with plant proteins has been shown to provide novel products with modified technofunctional properties, e.g., altered viscosity, emulsification, gelation and solubility properties [6]. Moreover, protein blends can provide sufficient amounts of all EAAs at a lower protein dose. Therefore, a lower caloric requirement and less risk of intestinal discomfort are expected. As there is a large variability in AA composition among various plant protein sources, development of a balanced combination of different plant and dairy proteins requires a detailed investigation in order to provide a higher quality protein blend. For example, blending of plant and dairy proteins is expected to provide to a wider variety of AAs. Blending of whey protein (WP) having high Leu with soy protein isolate (SPI) having high Glu and Arg may result in a more balanced protein. It has been shown that a sport beverage protein blend using 50% caseinate, 25% WP and 25% SPI had unique properties derived from each of the individual proteins, providing an improved delivery of AAs during resistance exercise. Thus, this blend has been introduced as a suitable sport nutritional supplement [7]. Blending of SPI and dairy proteins has been shown to enhance the rate of AA transport into muscles [8]. It was previously shown that the blend containing WP:casein (CN):SPI (25:50:75) resulted in increased promotion of muscle growth compared to the individual proteins on their own [9]. The WP:CN blend was shown to have a slower digestion rate than WP while it had a higher digestion rate compared to CN. A blend of dairy and plant proteins (35% WP, 25% CN, 20% SPI, 20% pea protein isolate (PPI)) has been shown to have a more balanced AA profile with higher chemical score compared to its individual protein isolates [10]. This has been shown to result in a more balanced post-prandial AA availability compared to the individual protein isolates as tested in blood samples.
Milk protein concentrate (MPC) is a versatile dairy ingredient containing CN and WPs (at a ratio of 4:1) which is used in a range of food applications. MPC is manufactured from skim milk through thermal treatment, filtration and spray-drying and it is used in the formulation of a range of food and beverage products due to its high nutritional quality [11]. Protein quality may be estimated by determining protein digestibility corrected amino acid score (PDCAAS). High protein MPC is a high-quality source of protein having all the EAAs in sufficient amounts along with a low level of lactose. The PDCAAS value for MPC has been reported to be 1.21 [12], while the PDCAAS for plant proteins such as soya, rice and pea proteins has been reported to be 1.0, 0.42 and 0.89, respectively [13].
Our preliminary studies showed that a partial replacement of MPC with SPI, PPI and rice protein isolate (RPI) improved some technofunctional properties (e.g., emulsification, viscosity and solubility) of the resulting blend (unpublished data). On the basis of the data obtained for the technofunctional property assessments, SPI–MPC 25:75, PPI–MPC 25:75 and RPI–MPC 50:50 blends were shown to display promising technofunctional properties compared to other blends. Thus, these three blends were selected for assessment of their in vitro digestibility and antioxidant activity. The hypothesis is that by blending plant proteins with MPC, their nutritional properties would be improved. Therefore, the objective of this study was to investigate the in vitro digestibility and antioxidant activity of the SPI–MPC 25:75, PPI–MPC 25:75 and RPI–MPC 50:50 blends and to compare the results obtained with those of the individual plant protein isolates.

2. Results and Discussion

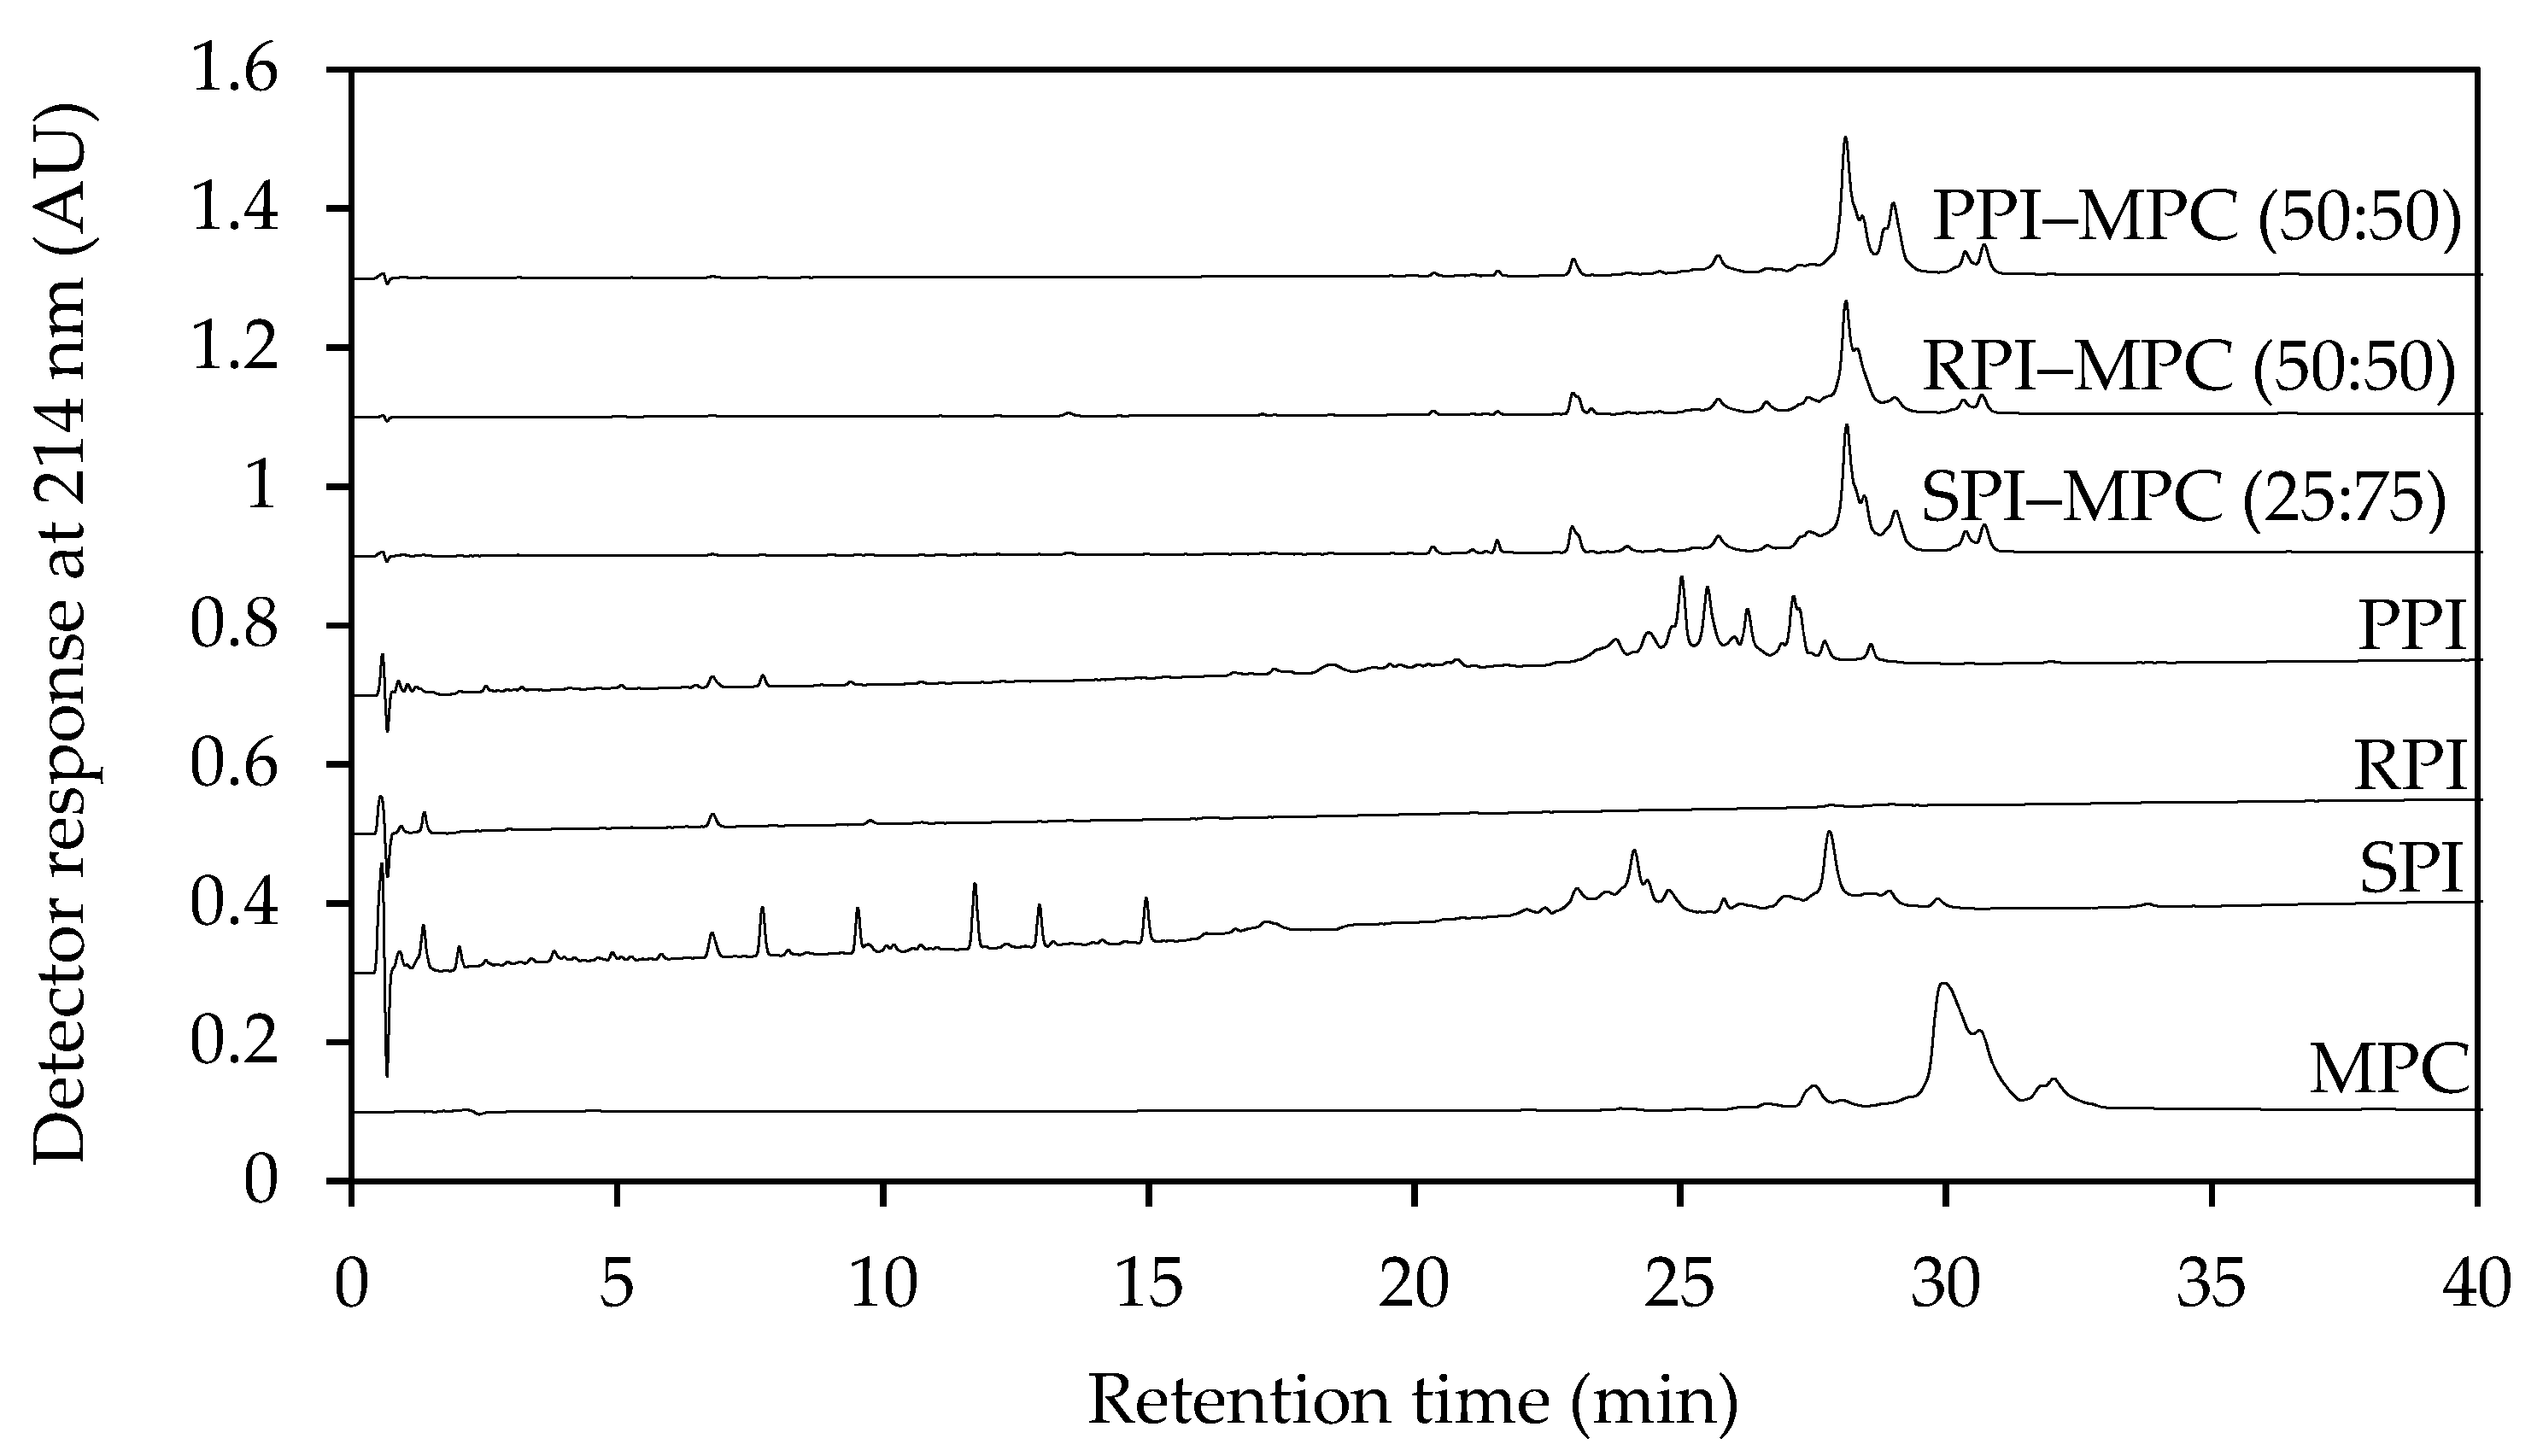
2.1. Reverse-Phase Ultra-Performance Liquid Chromatography (RP-UPLC)

The RP–UPLC chromatograms associated with the individual proteins and the blends when suspended in 0.1% (v/v) TFA are shown in Figure 1. The chromatograms herein represented the acid soluble proteins in the individual and blended proteins. The main protein fraction of MPC, i.e., micellar CN, did not dissolve in the mobile phase. Similarly, the acid precipitated fractions of the plant proteins and their blends were not detected on the UPLC chromatograms. Consequently, the main peak eluted from MPC (~30 min) is associated with WP. Comparison of the plant protein isolates revealed that SPI had a wide range of acid soluble proteins with different hydrophobicity. The peaks associated with PPI appeared mainly >20 min showed that these proteins are more hydrophobic than the SPI proteins. A limited number of peaks were detectable for RPI suggesting that the solubility of RPI in acidic solution (0.1% (v/v) TFA) was very low. Interestingly, the blends showed very similar chromatograms having a main peak eluting at ~27 min. This peak is presumably associated with the main acid soluble conjugated proteins of the plant protein–MPC blends. This appears to be the first report on the RP–UPLC of plant protein–MPC blends.

2.2. Estimation of PDCASS

The AA composition details of the MPC and plant protein isolates are given in Table 1. The level of non-EAAs (NEAA) including Asn + Asp, Gln + Glu, Ala, Gly, Ser and Tyr in all samples is also given with the lowest amount (43%) being associated with MPC and the highest (49%) being associated with SPI. The first limiting EAA varied among the plant protein samples. While the level of Trp in MPC and SPI was still higher than in RPI and PPI, the first limiting EAA for MPC and SPI was Trp. The ratio of branched chain AAs (BCAA) including Val, Ile and Leu to total AAs (%) was lower in SPI (16.20%) compared with the other protein samples. The highest amount of BCAA was associated with RPI (20.26%) and the RPI–MPC blend (20.15%). Improvement in the AA profile of blends containing dairy proteins and SPI has been previously reported, showing that the blend had high content of Lys and Met which exceeded the AA requirements suggested for the dietary proteins [14].
The in vitro digestibility and PDCAAS were determined, and the results are summarised in Table 1. The in vitro digestibility of all blends was high (>98%) with the minimum digestibility among the blends associated with the SPI–MPC blend. The quality of the proteins in the blends was also assessed using PDCAAS analysis where the first limiting EAA was taken into account. The PDCAAS of RPI (0.70) was the lowest among the individual protein isolates. SPI and PPI had high PDCAAS values (>1) demonstrating the high quality of these two proteins. MPC had the highest PDCAAS (1.09) among the individual samples tested. Rutherfurd et al. [13] reported PDCAAS values for MPC, SPI and pea protein concentrate (PPC) of 1.0, 1.0 and 0.89, respectively, while the PDCAAS for rice protein concentrate (RPC) was 0.42. Rutherfurd et al. [13] also calculated the digestible indispensable amino acid score (DIAS) which similarly to PDCAAS expresses the quality of a protein on the basis of digestibility and AA composition. They showed that the DIAS for MPC, SPI, PPC and RPC was 1.18, 0.91, 0.82, 0.37, respectively. It should be mentioned that for the calculation of the digestibility and PDCAAS, the presence of ANFs is not taken into account, thus the values reported may be an overestimation for products having ANFs [15]. This has been reported as a limitation for PDCAAS determinations. In addition, some plant proteins may have more than one limiting EAA, while for the calculation of PDCAAS only the first limiting EAA is considered to evaluate the quality of the proteins. The above may be the reasons why the value reported herein for the in vitro digestibility of plant proteins was higher than for MPC. Nevertheless, the final PDCAAS value for MPC was the highest among all other samples tested herein.
As expected, the blends of SPI– and PPI–MPC had high PDCAAS values (Table 1). Interestingly, incorporation of RPI and MPC at a ratio of 50:50 gave a high PDCAAS (1.03) presenting an advantage for formulation of plant protein with MPC blends. Thus, blending plant protein–MPC resulted in high quality protein products. To our knowledge, this is the first report on PDCAAS of plant protein–MPC blends. Herein, it was demonstrated that mutual supplementation of plant and animal proteins via blending is an effective strategy for overcoming the lower protein quality of some plant proteins in order to provide a complete spectrum of EAAs along with high digestibility.

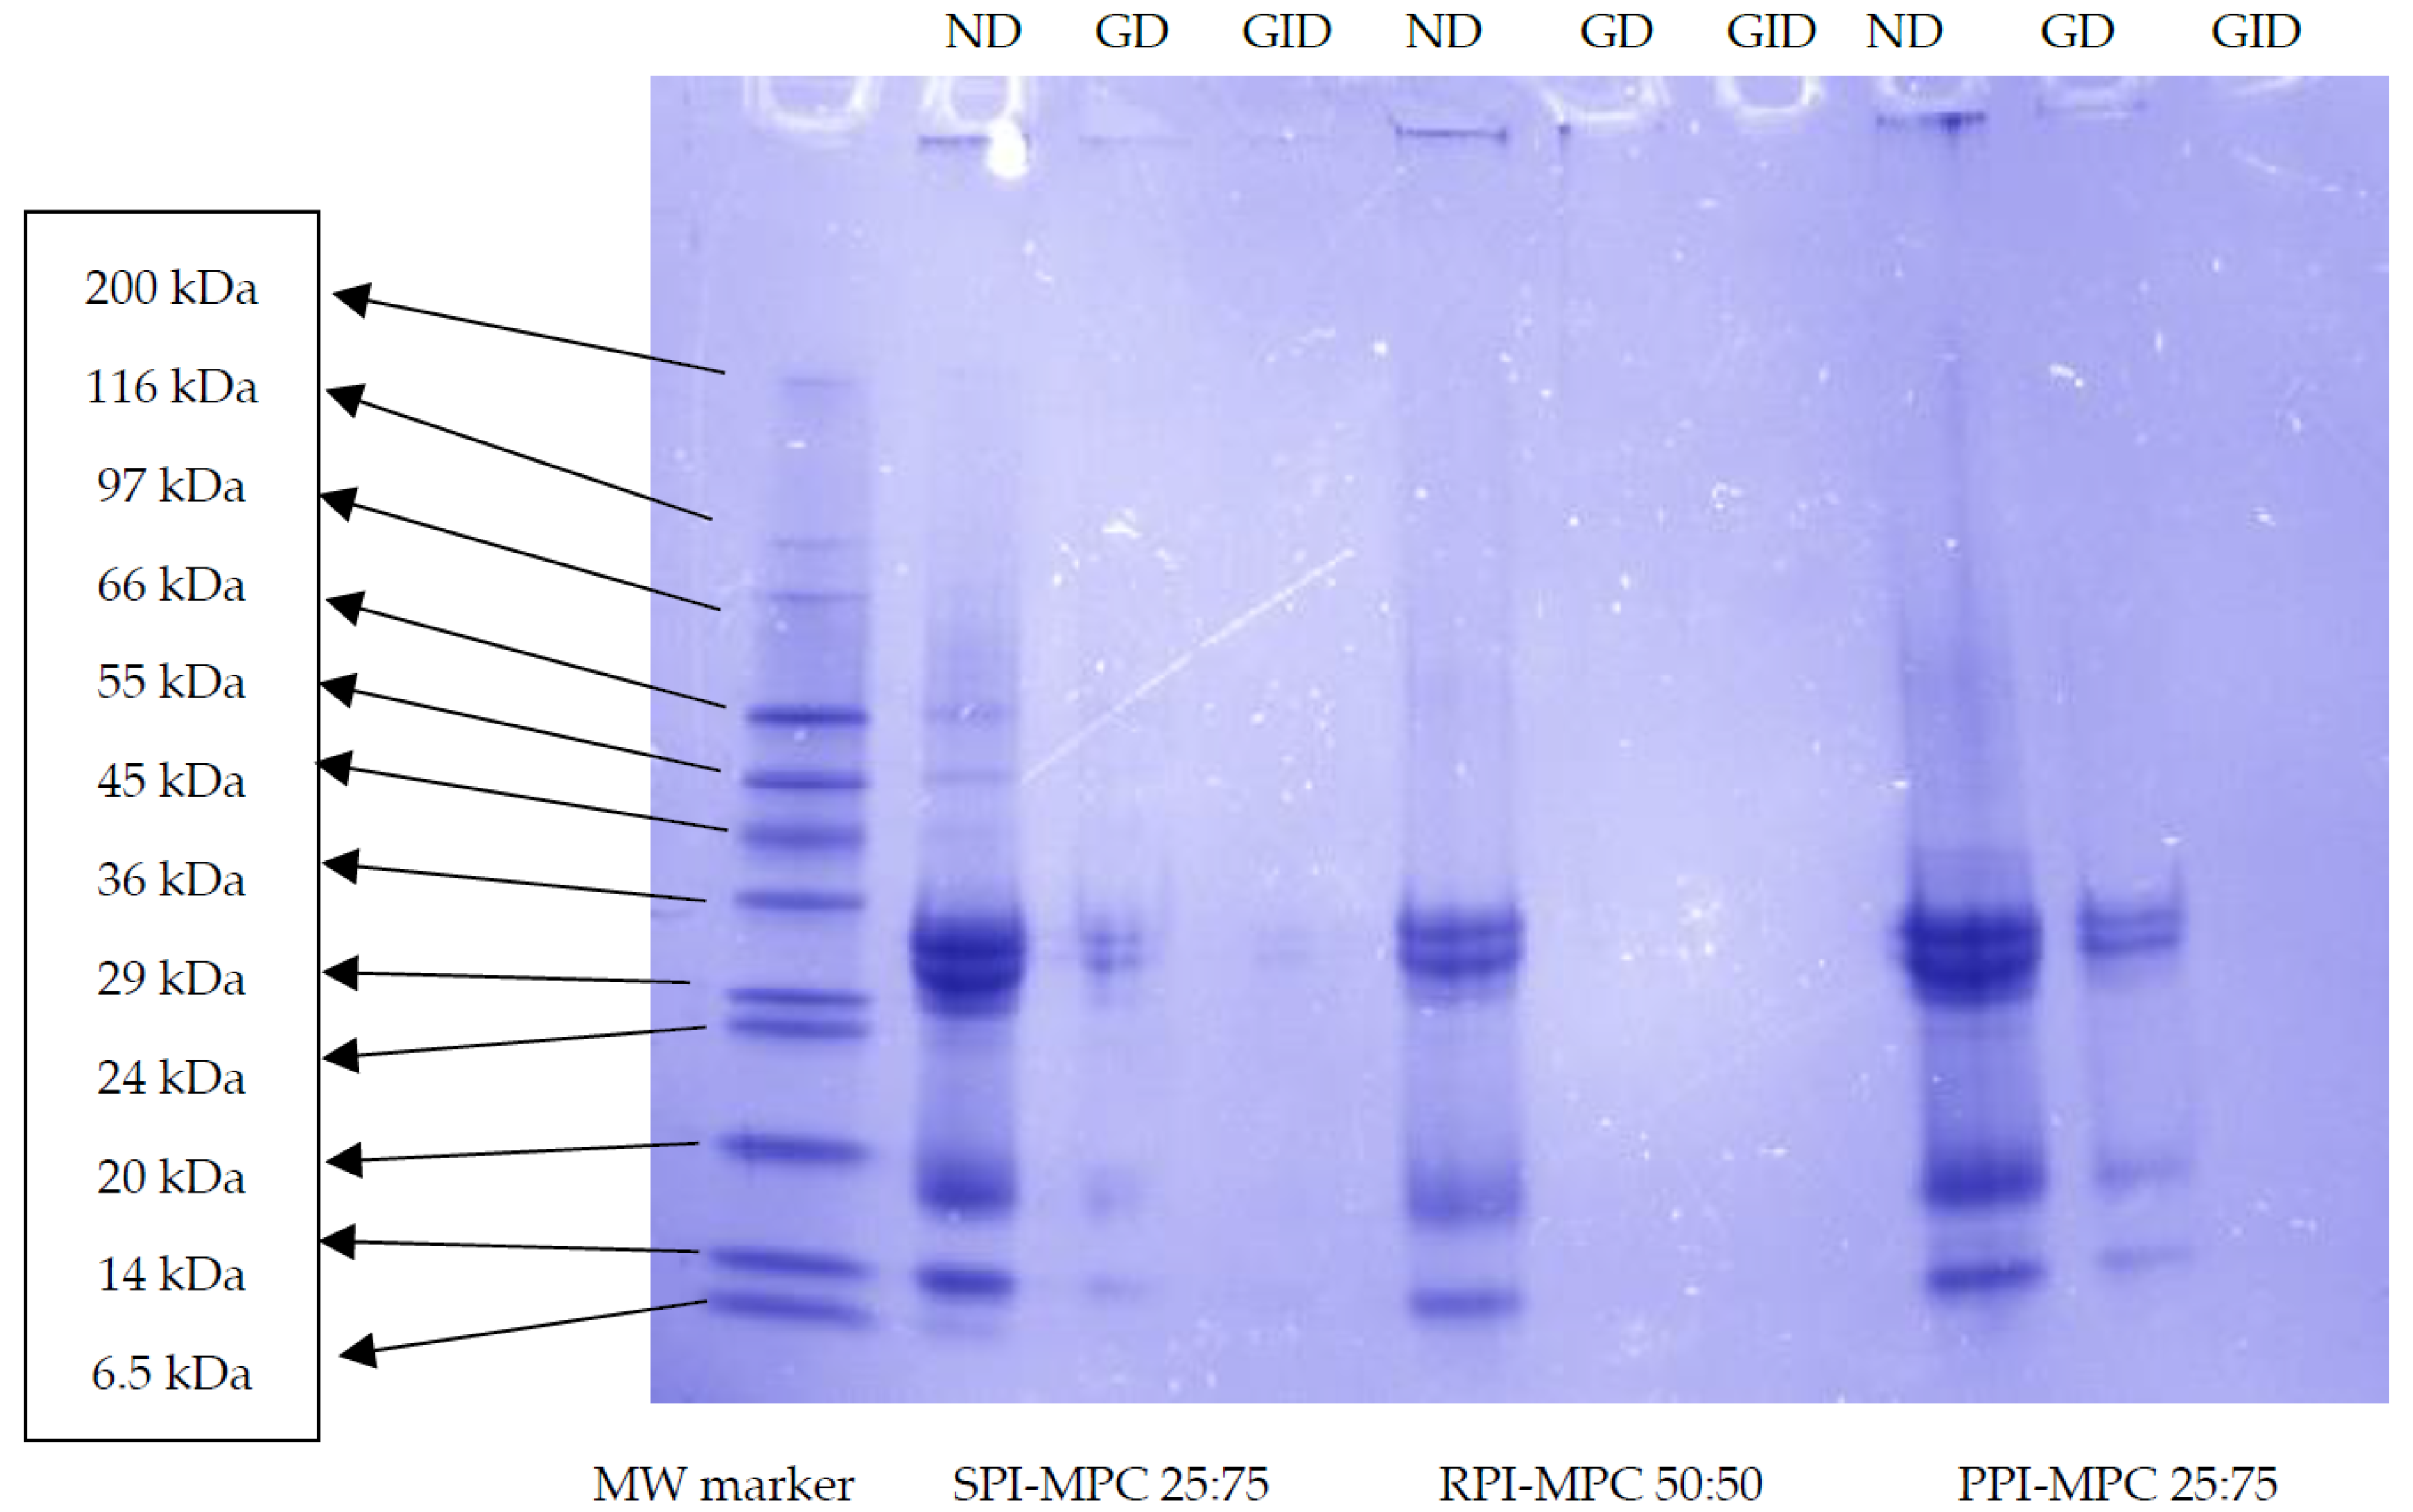
2.3. SDS-PAGE Analysis of Simulated Gastro-Intestinal Digestion (SGID)-Treated Blends

The SDS-PAGE profile of the protein blends before and after SGID is displayed in Figure 2. In the case of the blends, the bands associated with the CNs (19–25 kDa for α-, β- and κ-CN), α-la (~14 kDa) and β-lg (~18 kDa) from MPC were visible. The SPI–MPC blend also displayed two major bands at approx. 37 kDa and 40 kDa. These represent the acidic subunits of glycinin. In addition, the 2S storage proteins present in SPI–MPC were visible with MWs of 12–15 kDa. The lane containing the PPI–MPC blend had a band at ~38 kDa. This probably represents legumin, a hexameric protein, which is normally separated into two subunit polypeptides (α = acidic 38–40 kDa and β = basic 19–22 kDa) when S–S bonds are broken under reducing conditions [16]. In the case of the RPI–MPC 50:50 bands, the MPC proteins were less intense as the proportion of MPC in this blend was lower than in the two other blends. A CN band appeared in the RPI–MPC blend lane. Similarly, the prolamins observed at 13–16 kDa were separated in the RPI–MPC blends. However, no other bands could be readily distinguished in the RPI–MPC blend.
The electrophoretic pattern obtained from the digested samples after the gastric phase yielded low intense bands associated with CN and WP fragments of MPC in SPI–MPC and PPI–MPC blends while no bonds was observed for RPI–MPC blend. The difference may be due to the lower ratio of MPC used for the generation of the RPI–MPC blend (50% vs. 75% for SPI–MPC and PPI–MPC blends). After intestinal digestion, no bands were observed for all samples. This showed that the individual proteins in the protein blends were readily digested during SGID. These results highlight the high digestibility of the protein blends studied herein under the SGID conditions employed.

2.4. Degree of Hydrolysis (DH)

It is well known that plant proteins are more limited in their digestibility properties than animal proteins due to differences in their AA composition and protein structure [17]. As mentioned earlier in Section 2.2, the digestibility and PDCAAS for the plant protein isolates reported herein may be an overestimation, thus the actual digestibility may be lower than the PDCAAS value because the estimation of PDCAAS does not consider ANFs [15]. Therefore, assessment of the DH values could help provide a better understanding of the digestion pattern of the plant proteins and the plant protein–MPC blends. The DH of the samples was measured using the TNBS method. As shown in Table 2, there were differences between the DH results of the SGID treated samples.
Among the isolates, PPI had a significantly higher (p < 0.05) DH (3.95%) after the gastric digestion phase compared to RPI and SPI. Plant protein isolates had DH values in the range 6.62–9.50% after the gastric followed by intestinal digestion. The DH of digested blends in all three plant–MPC samples was higher compared to the DH of digested plant protein isolates, in the cases of both gastric digestion and gastric followed by intestinal digestion. Among the gastric digested blends, SPI–MPC had the highest DH (6.58%) while it had the lowest DH (12.65%) among the blends after gastric followed by intestinal digestion. A DH of 43% for SPI digested using the INFOGEST digestion protocol was previously reported by Jiang et al. [18]. Differences in the initial enzyme/substrate ratio, initial substrate concentration and enzyme activity may be the reasons for the differences between the results herein and those in the study by Jiang et al. [18]. In addition, Jiang et al. [18] used 2 h for gastric and 3 h for intestinal digestion vs. 1.5 and 2.5 h, respectively, used in the study herein. Among the blends, RPI–MPC gave the lowest DH (4.41%) for the gastric phase, while giving the highest DH after gastric followed by intestinal digestion (16.99%). The PPI–MPC blend after gastric followed by intestinal digestion yielded a DH between the values obtained for SPI–MPC and RPI–MPC SGID-digested samples (15.07%). A marked increase in hydrolysis of all blends was observed following simulated gastro-intestinal digestion compared to simulated gastric digestion alone.
The secondary structure of plant proteins consists of a high amount in β-sheet conformation and a relatively low extent of α-helix structure in comparison to animal proteins. This is especially the case for legume proteins such as soy and pea proteins and may be a reason for their lower digestibility in their native state in comparison with animal proteins [19]. Other reasons for the lower digestibility of plant proteins compared to animal proteins may be associated with the presence of, e.g., trypsin/chymotrypsin inhibitors and lectins which prevent complete hydrolysis by pancreatic proteases in plant protein ingredients. The presence of other ANFs, such as tannins and phytate in plant protein ingredients may also inhibit digestion [20]. These are not present in animal origin proteins.
In summary, a difference in the pattern of digestion of the different blends was observed. This showed that SPI–MPC was digested more extensively at the beginning of the digestion process (gastric phase), while PPI– and RPI–MPC blends were digested to a lower extent during gastric digestion and were more extensively digested during the intestinal phase. Differences in the structure and profiles of the plant proteins and the presence of various ANFs in plants may be the main reason for the differences in the DH values after digestion. Previously, it was reported that the rate of digestion of different proteins differs. For example, the digestion of SPI and CN has been reported to be slower than WP [21]. This provides further support for the efficacy of ingesting a protein blend to increase and prolong post-exercise muscle protein anabolism [21]. This is the first report on the DH achieved for plant protein–MPC blends during simulated in vitro gastric and gastric followed by intestinal digestion.

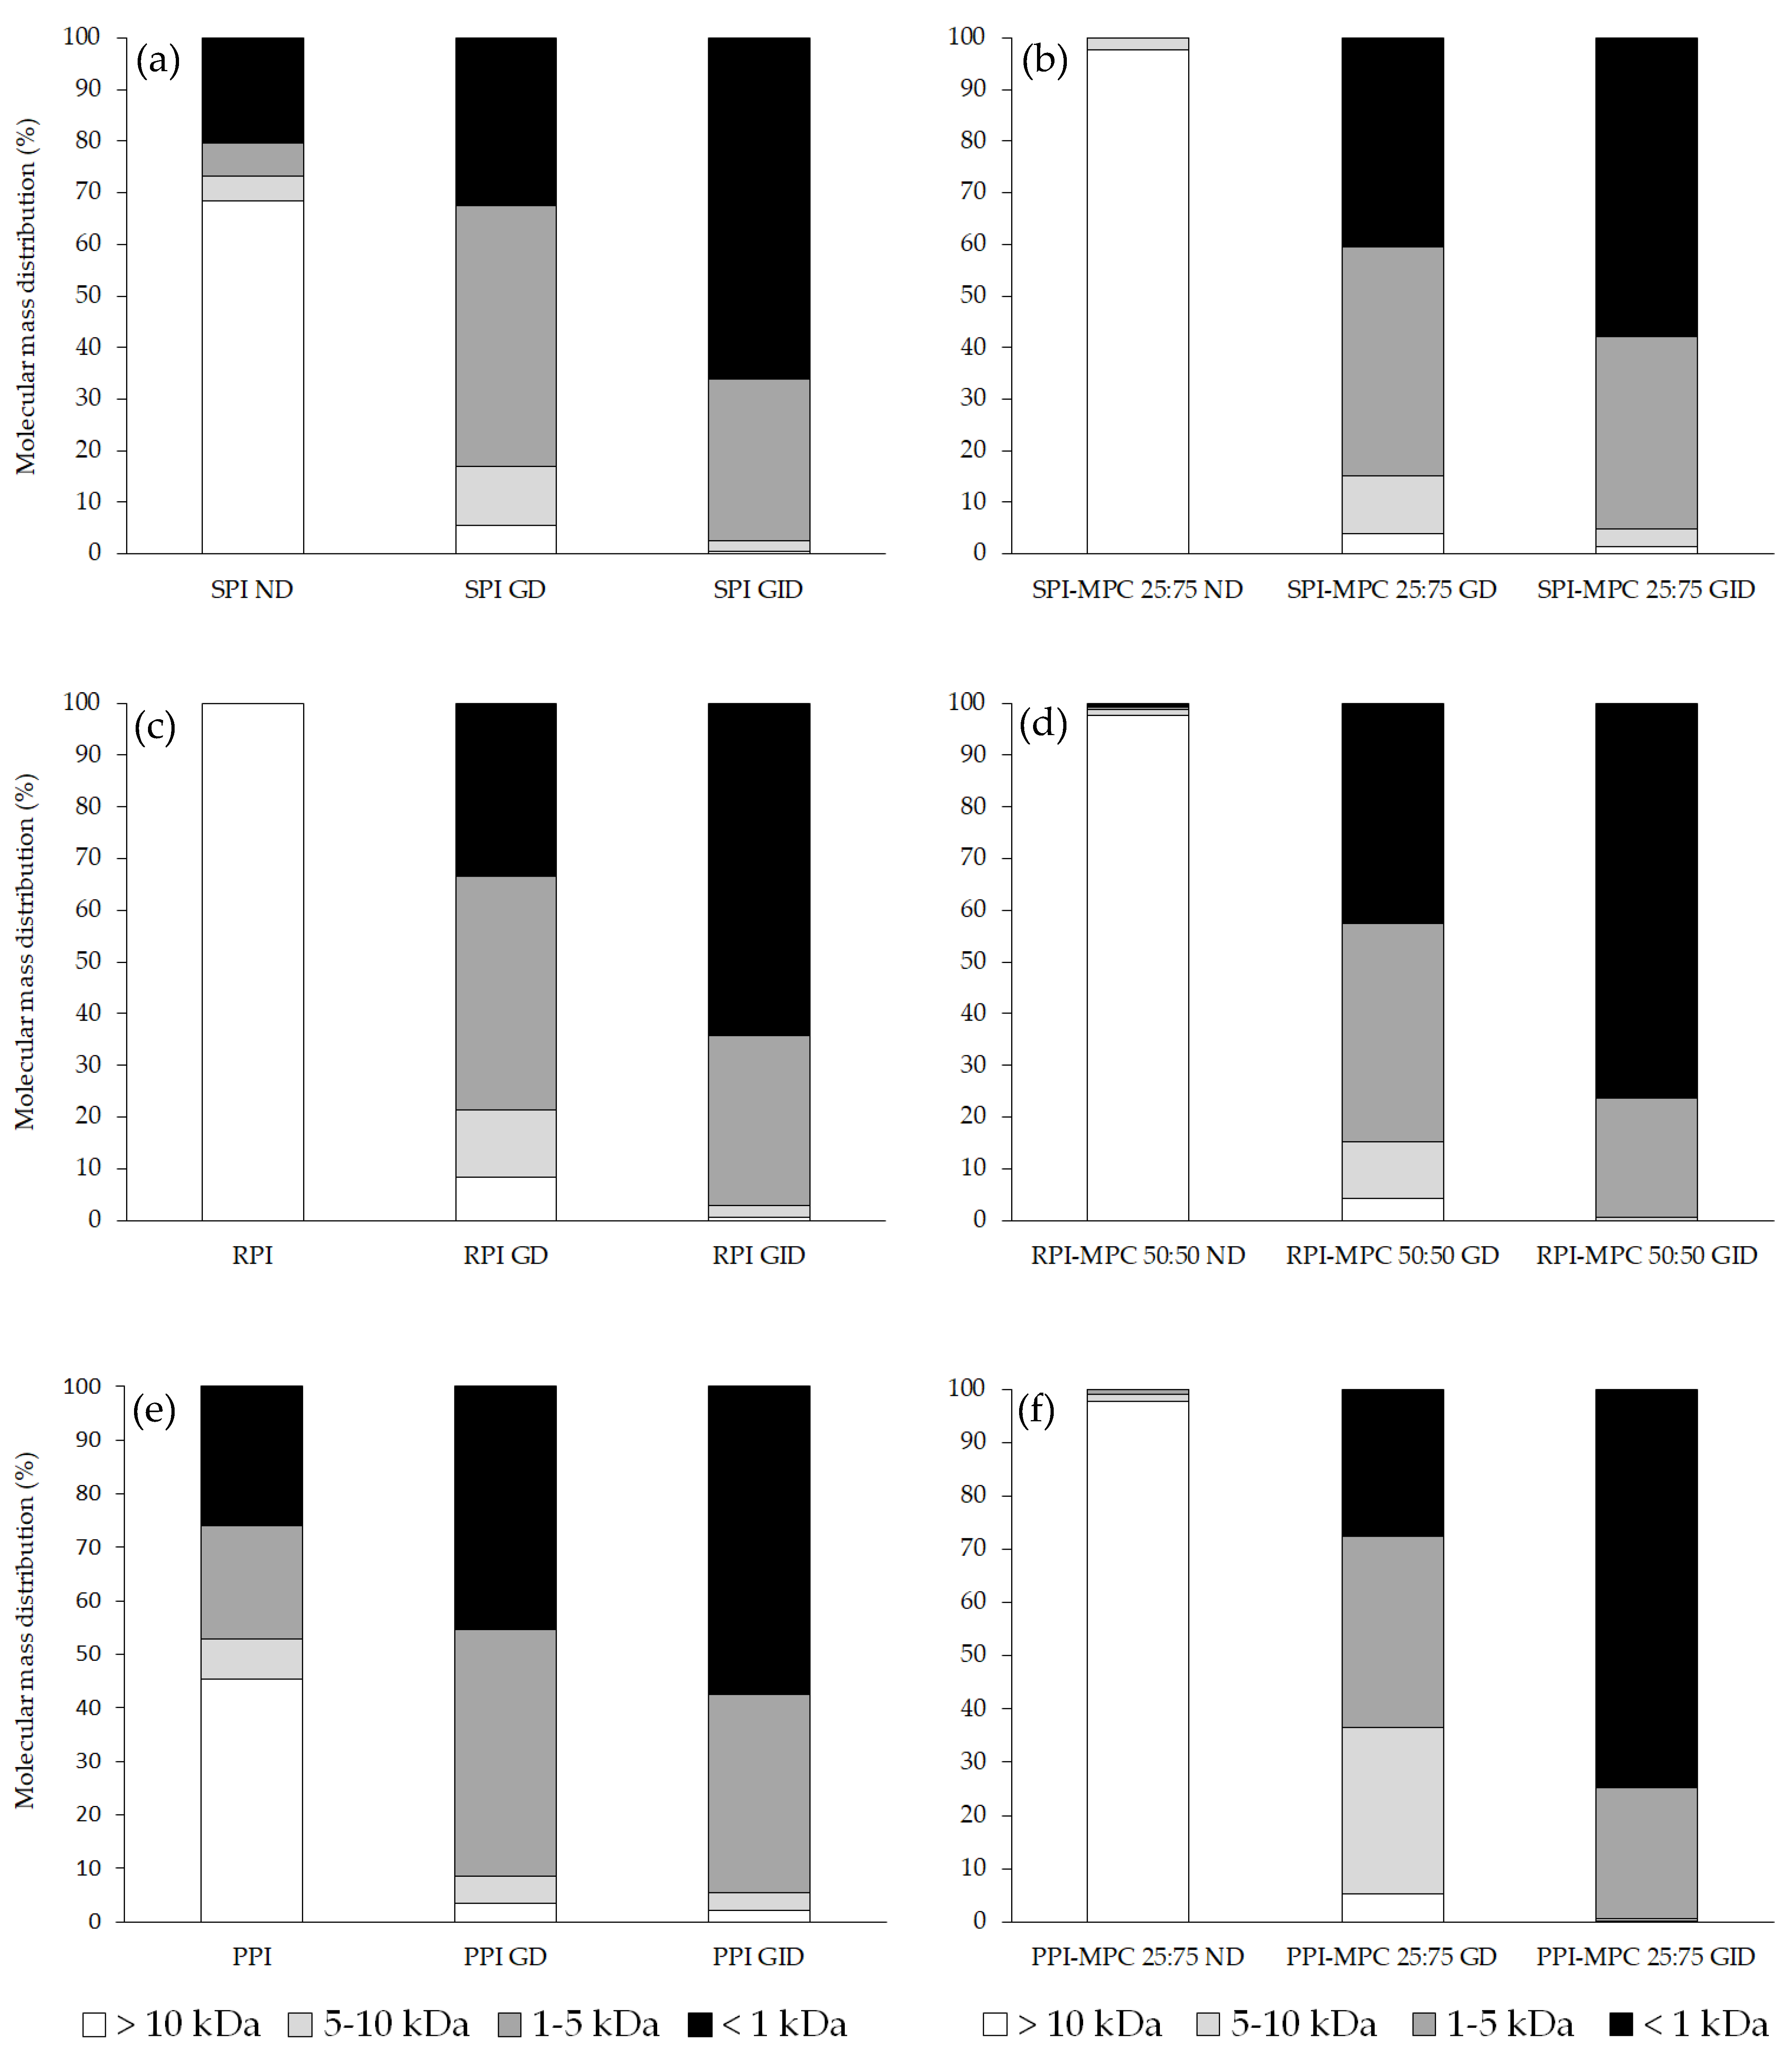
2.5. Molecular Mass Distribution

The results of GP-HPLC analysis are shown in Figure 3. As expected, there were major difference between the molecular mass distributions of the plant protein ingredients. As displayed in Figure 3, RPI had the highest proportion of proteinaceous components (~100%) with MW > 10 kDa, while in the case of SPI and PPI, this proportion was 68 and 45%, respectively. Interestingly, all the blends prior to digestion had over 97% proteinaceous components with a molecular mass > 10 kDa. These may either arise from the MPC sample or may be due to the occurrence of interactions between the SPI or PPI with MPC during the blending which resulted in the appearance of a higher proportion of proteinaceous components with MW > 10 kDa. This was reduced when the samples were incubated with pepsin (gastric phase). At the end of gastric digestion of the RPI, SPI and PPI, the proportion of the proteinaceous components with MW > 10 kDa was 8%, 6% and 3%, respectively. This showed effective digestion of plant proteins with pepsin. Furthermore, at the end of gastric digestion, all of the blends had over 95% proteinaceous components with a MW < 10 kDa. Among the gastric digested blends, SPI–MPC 25:75 and RPI–MPC 50:50 had a higher ratio of proteinaceous components with a MW < 1 kDa (over 40%) compared to the PPI–MPC 25:75 blend (~30%). This corresponded to a lower extent of digestion during the gastric phase in the case of PPI compared to the other blends. The highest proportion of molecules with MWs between 5–10 kDa (31%) was also associated with the PPI–MPC blend after gastric digestion.
Incubation of the gastric digested samples with Corolase PP (which simulates intestinal proteolytic digestion) resulted in more extensive digestion in all cases. A high proportion of peptides < 1 kDa was found in all samples after in vitro SGID, more than 95% of the proteinaceous components after SGID had MW < 5 kDa. The lowest extent of digestion among the individual plant proteins was associated with PPI which still had 2% of its molecules with a MW > 10 kDa. This value for SPI and RPI was 0.5 and 0.6%, respectively. The higher extent of digestion during SGID is in agreement with a previous study, which showed that SGID digested pea, soy and rice proteins had < 2% proteinaceous components with MW > 10 kDa [22]. Similarly, Xu et al. [23] observed a high digestibility for rice bran protein powder incubated with trypsin at pH 7.5 and 41 °C for 1.9 h. They showed that 86.5% of the peptides had a MW < 1 kDa.
The lowest extent of digestion during the incubation of the blends herein with Corolase PP (intestinal phase) was found for the SPI–MPC blend and the highest for the RPI–MPC and PPI–MPC blends. The presence of low MW peptides in all blends after digestion signifies that the samples were susceptible to proteolytic breakdown during SGID. Proteinaceous components containing low molecular mass peptides may have higher biological activities compared to intact proteins. No information appears to be available in the literature on the use of GP-HPLC to analyse the effect of SGID on plant and milk protein blends.

2.6. ABTS Radical (ABTS) Scavenging Activity

The in vitro antioxidant activity of the plant protein isolates and the plant protein–MPC blends before and after SGID was measured. To this end, the EC50 for ABTS scavenging activity of the samples was calculated. Overall, the intact SPI protein had the highest antioxidant activity (EC50 = 3.05b ± 0.23 mg/mL) among the individual plant proteins. The lowest ABTS scavenging activity was associated with the RPI (EC50 = 6.42 ± 0.35 mg/mL). The high antioxidant activity for SPI may be associated with a higher content of some hydrophobic and aromatic AAs such as Trp, Pro and Gly in this protein isolate [24]. Earlier in Table 1 it was shown that the amounts of Trp, Pro and Gly in SPI were 0.9%, 4.8% and 3.8% (w/w, %), respectively, while the amounts in RPI were 0.7%, 3.2% and 3.5%, respectively, and in PPI 0.8%, 3.6% and 3.3%, respectively. The high antioxidant activity of SPI was also reported to be associated with its high Gln content [21]. Herein, the content of L-Glutamine together with L-Glutamic acid (Glx) for SPI was 18.4% (w/w, %) while this value for PPI and RPI was 13.4% and 15.5% (w/w, %), respectively. The higher antioxidant activity of SPI and PPI compared to RPI may also be linked to their higher content of phenolic components, as the total phenolics in soybeans and peas is ~2 mg/g whole grain [25], while the soluble phenolic components of rice has been reported to be <0.5 mg/g whole grain [26]. The finding related to the high antioxidant activity of SPI in this study is in agreement with a previous report which showed SPI had an antioxidant activity comparable with some animal derived proteins, e.g., CN and egg albumin [27]. It may also be the reason that blending SPI with MPC did not increase its antioxidant activity. The results showed that the antioxidant activity of SPI–MPC (EC50 = 3.25 ± 0.21 mg/mL) was the highest among the blends, followed by PPI–MPC (EC50 = 3.76 ± 0.19 mg/mL). Thus, blending PPI and RPI with MPC resulted in an improvement in overall antioxidant activity. The high antioxidant activity of WP and CN (the major constitutes of MPC) has been previously reported [28,29].
Furthermore, digestion enhanced the in vitro antioxidant activity of all samples. The samples after the gastric followed by the intestinal phase of digestion had higher in vitro antioxidant activity compared to the samples subjected only to the gastric phase, highlighting that the samples with more extensive digestion had higher in vitro antioxidant activity. Among the plant protein isolates, the highest ABTS scavenging activity after gastric digestion (EC50 = 0.31 ± 0.03 mg/mL) and after gastric followed by intestinal digestion (EC50 = 0.19 ± 0.02 mg/mL) was associated with the SPI samples. The high antioxidant activity of SPI on incubation with proteolytic enzymes has been extensively reported in the literature [30]. The high ABTS scavenging activity of peptides released from SPI hydrolysates was reported to be linked with the presence of carboxy terminal tyrosine residues [31]. The high ABTS scavenging activity of Corolase PP treated SPI was previously linked to the proteinaceous components with MWs <3 kDa [32]. The lowest activity after both gastric followed by intestinal digestion phases was associated with the RPI sample (EC50 = 2.15 ± 0.26 and 1.04 ± 0.15 mg/mL, respectively, after gastric and intestinal phases). The increase in the antioxidant activity of RPI after SGID may be linked to (a) high proportion of proteinaceous components with MW <1 kDa which was outlined earlier in Section 2.5; and (b) the solubilisation of insoluble phenolic compounds during the intestinal digestion phase as previously pointed out [33]. In addition, the beneficial antioxidant activity of rice protein hydrolysates generated using Alcalase has been recently reported [34]. The EC50 for the PPI digested samples after the gastric and intestinal phases was 0.94 ± 0.07 and 0.49 ± 0.03 mg/mL, respectively. These values were in between the SPI and RPI digested samples. Previously, a high antioxidant activity for hydrolysed PPI generated using different enzymes (e.g., thermolysin and alcalase) was reported [35,36].
Among the digested blends, the lowest ABTS scavenging EC50 value was associated with the SPI–MPC digested blend after both the gastric and intestinal digestion phases (0.11 ± 0.01 and 0.10 ± 0.01 mg/mL, respectively), which is indicative of the most potent antioxidant activity (Table 2). This is in line with the results for the SPI digested sample (compared to other plant protein isolates). The high antioxidant activity of the SPI digested sample per se and the presence of 75% MPC in the SPI–MPC blend are the main reasons for the high antioxidant activity observed for this sample after gastric and intestinal digestion. The PPI–MPC blend had the second highest antioxidant activity among the blends with an EC50 value for ABTS scavenging equal to 0.76 ± 0.01 and 0.26 ± 0.01 mg/mL after the gastric and the intestinal digestion phases, respectively. While the RPI–MPC digested blend had the lowest antioxidant activity among the plant protein–MPC digested blends tested herein. The inclusion of MPC to RPI improved the antioxidant activity of the blend to some extent compared to RPI per se. It is for the reason that the milk protein digested samples, as widely shown, may act as radical scavengers [37]. However, still significantly more RPI–MPC (compared to other plant protein–MPC blends) was required to reach 50% ABTS scavenging. The EC50 value for ABTS scavenging was equal to 2.15 ± 0.06 and 1.04 ± 0.05 mg/mL after gastric and intestinal digestion, respectively. Thus, its antioxidant activity was weaker than the PPI– and SPI–MPC digested blends. The lower antioxidant activity of the digested RPI per se (compared to the PPI and SPI) and a higher amount of MPC in both SPI– and PPI–MPC blends may be potential reasons for the greater antioxidant activity of these two blends compared to the RPI–MPC blend.

3. Materials and Methods

3.1. Materials

SPI, PPI and RPI from Pulsin Ltd. (Gloucester, UK) were purchased at a local health food store. MPC85 (85% (w/w) protein) was from a commercial supplier. The details of the composition of plant protein samples and MPC are provided in supplementary data (Table S1). Sodium hydroxide, acetic acid and trinitrobenzenesulfonic acid (TNBS) were from Fisher Scientific (Dublin, Ireland). The hydrochloric acid and trichloro acetic acid (TCA) was from VWR (Dublin, Ireland). The Kjeldahl tablets, sulfuric acid (>98%), boric acid, 2-mercaptoethanol, methanol, protein molecular weight (MW) markers (6.5–200 kDa), 2,2’-azino-bis(3-ethylbenzothiazoline-6-sulfonic acid) (ABTS), pepsin (1616 U/mg), Sudan III, ninhydrin reagent (2% (w/v) solution), trifluoroacetic acid (TFA) and Trolox standard were from Sigma-Aldrich (Dublin, Ireland). The hexane and acetonitrile (ACN) were from Honeywell International Inc. (Dublin, Ireland). Comassie R, Laemmli buffer and Mini-Protean TGX (4–20%) pre-cast polyacrylamide gels were from Bio-Rad Laboratories Inc. (CA, USA). The sodium dodecyl sulphate (SDS) was from National Diagnostics (GA, USA). Corolase PP® (4.4 U/mg) was from AB Enzymes GmbH (Darmstadt, Germany). PDCAAS analysis kits were purchased from Megazyme (Bray, Ireland).

3.2. Blending of Plant Protein Samples with MPC

Three blends were prepared: SPI–MPC, 25:75, PPI–MPC, 25:75 and RPI–MPC, 50:50 (w/w% on a protein basis). These blends were then reconstituted in distilled water (to 5% (w/v) on a protein basis) by stirring at 50 °C for 1 h, followed by cooling at 20 °C for 30 min. The pH of the samples was adjusted to pH 7.0 using 1.0 M NaOH and 1.0 M HCl (where required) and all samples were then freeze-dried (Labconco benchtop freeze-dryer, Kansas City, MO, USA) to give stable homogenous protein blends.

3.3. Reverse-Phase Ultra-Performance Liquid Chromatography (RP-UPLC)

The SPI, RPI, PPI samples and their associated blends were subjected to RP-UPLC (Acquity UPLC, Waters, Dublin, Ireland) system (n = 2). Mobile phase A was 0.1% (v/v) TFA and mobile phase B was 80% (v:v) ACN and 0.1% (v/v) TFA. Samples were reconstituted in mobile phase A to reach a protein concentration of 0.5% (w/v), then filtered through 0.2 µm cellulose acetate filters (Millipore, Carrigtwohill, Ireland). An aliquot of 10 μL was injected into the Acquity UPLC BEH C18, 130 Å column (2.1 mm × 50 mm × 1.7 mm) equipped with an Acquity BEH C18 (1.7 mm) vanguard pre-column. The flow rate was set at 0.3 mL/min over 51 min using a gradient program previously detailed by Cermeño et al. [38].

3.4. Protein Digestibility Corrected Amino Acid Score (PDCAAS)

The AA profile of MPC was determined (n = 2) by an external provider (ALS Life Sciences, Co. Tipperary, Ireland). The AA composition of the plant isolates was as provided by the manufacturer (Pulsin Ltd., Gloucester, UK). The AA composition of the samples was expressed as g AA/100 g protein.
Digestion of blends for calculation of the PDCAAS was carried out (n = 3) according to the manufacturers (Megazyme, Bray, Ireland) protocol. The MPC sample, the plant protein isolates, the plant protein–MPC blends, different controls and CN were weighted (500 mg on a protein basis) into a 50 mL centrifuge tube. The samples were re-suspended with 19 mL of 0.06 N HCl and were shake-incubated (37 °C, 230 rpm, 30 min) using a SI600 orbital incubator (Stuart, Staffordshire, UK). Pepsin (1 mL at 1 mg/mL) was added to each tube and shake-incubated (37 °C, 230 rpm, 60 min). After this step, the pH of the samples was adjusted to 7.4 using 1.0 M Tris HCl, pH 7.4. A mixture of trypsin-chymotrypsin (1:1, Megazyme) at a concentration of 5 mg/mL was prepared and a 200 µL aliquot was added to each sample. It was then shake-incubated (37 °C, 230 rpm, 4 h). The samples were placed in a water bath (WiseCircu® type WCB, Witeg Labortechnik GmbH, Wertheim, Germany) at 98 °C for 10 min to inactivate the enzymes. After cooling, 4 mL of sample was mixed with 1 mL TCA (40%) and it was then stored at 4 °C for 16 h. An aliquot of 1.75 mL from the non-precipitated part was centrifuged (10 min, 15,000× g, 4 °C) (Hettich Zentrifugen Universal 320R centrifuge, Andreas Heittich GmbH Co., Tuttlingen, Germany). The supernatants from each sample were diluted 1:9 (v:v) using 50 mM sodium acetate, pH 5.5, except for CN (Megazyme) which was diluted at 1:19 (v:v). A blank was prepared using a mixture of reagents without addition of protein sample.
The amine content in the samples obtained from the previous step was measured using the ninhydrin colourimetric method. A calibration curve was generated using L-glycine dissolved in 50 mM sodium acetate, pH 5.5, to obtain different concentrations (i.e., 0, 0.005, 0.007, 0.010, 0.025, 0.050, 0.075, 0.100, 0.250, 0.500, 0.750 and 1.000 mM). Determination of amine content was carried out by the addition of 100 µL blank, standard or sample to 50 µL ninhydrin reagent (2% (w/v)) in a 96-well microtitre plate (Biotek Synergy HT, Winoosky, VT, USA). The plate was then shake-incubated (70 °C, 30 min, 100 rpm), followed by cooling at room temperature for 10 min. Thereafter, 150 µL ethanol (50% (v/v)) was added to each well. The plate was placed in a plate reader, shaken for 5 min at 30 °C and then the absorbance at λ = 570 nm was recorded. The primary amine concentration was determined (n = 3) using the L-Glycine standard curve, accordingly, the primary amine concentration corrected for AAs in the samples was calculated using Equation (1):
primary   amine   concentration   corrected   for   AAs   in   samples   ( mM ) = ( primary   amine   concentration   of   samples   ( mM ) ) + ( 4 × [ Pro ] [ Lys ] ) + ( 2 × [ His ] ) + ( 2 × [ Arg ] )
where [Pro], [Lys], [His] and [Arg] are the concentrations (mM) of L-Proline, L-Lysine, L-Histidine and L-Arginine, respectively, in the initial samples.
Using the values obtained herein for the Megazyme control samples, the CN sample and the verified values provided by Megazyme (which are on the basis of the literature values obtained from a rat model) for each of the control samples and CN, the corrected primary amine concentration for the standard samples was fitted using a linear regression (Megazyme). The slope and the intercept of the lines were used for calculation of the in vitro digestibility according to Equation (2):
in   vitro   degestibility = ( ( slope   of   the   line × primary   amine   concentration   corrected   for   AAs ) + intercept ) 100
Furthermore, the first limiting EAA in each sample was identified by comparison of the quantity of each EAA in the test samples against the FAO/WHO [39] recommended EAA for humans. The EAA with the lowest ratio (Equation (3)) was considered as the first limiting EAA.
ratio   of   first   limiting   EAA = ( mass   of   first   limiting   EAA   in   sample   ( mg ) mass   of   protein   in   sample   ( g ) ) / ( mass   of   first   limiting   EAA   in   refernece   ( mg ) mass   of   protein   in   refernece   sample   ( g ) )
The in vitro PDCAAS of the test samples was finally obtained using Equation (4):
in   vitro   PDCAAS = in   vitro   digestibility   × ratio   of   the   first   limiting   EAA

3.5. Simulated Gastro-Intestinal Digestion (SGID) of the Plant Isolates and Their Associated Blends

SGID on the individual plant proteins and the blends was carried out (n = 3) according to Walsh et al. [40]. Flasks containing the samples (100 mL, 2% (w/v) protein) were incubated in a water bath (37 °C, 30 min). The pH was adjusted to pH 2.0 using 1 N HCl. Gastric digestion took place for 90 min following the addition of pepsin (2.5% (w/v) protein). The pH of the sample was then adjusted to pH 7.5 using 1 M NaOH. Intestinal digestion occurred with the addition of Corolase PP (1% (w/v) protein) and incubation for 150 min at 37 °C. Thermal deactivation of the enzymes was performed at 90 °C for 10 min. The respective pH values were kept constant throughout each digestion phase using a pH stat (Metrohm 902 Titrando pH-STAT, Herisau, Switzerland). The samples containing digested protein were then freeze-dried. Three samples were retained from each sample: sample prior to digestion, a sample that has undergone simulated gastric digestion and a sample that has undergone simulated gastric followed by intestinal digestion. These were subsequently characterised for their degree of hydrolysis (DH%), sodium dodecyl sulfate polyacrylamide gel electrophoresis (SDS-PAGE), and gel permeation - high performance liquid chromatography (GP-HPLC) profiles, and in vitro antioxidant activity.

3.6. SDS-PAGE Analysis

SDS-PAGE analysis was used to visualise the protein profiles of the digested and undigested samples. Samples (~4 g/mL on a protein basis) were mixed 1:1 with a mixture of 2-mercaptoethanol and Laemmli buffer (1:19) in Eppendorf tubes. The tubes were mixed for 5 min at 200 rpm and 95 °C using a DX-100/DX-100R Dry Block Thermo-Shaker (IRISanalytical, London, UK). An aliquot of 5 µL of a protein marker standard (6.5–200 kDa) and 10 µL of samples (~20 µg protein) was pipetted into each lane on the SDS-PAGE gel. Separation was achieved using a Power PAC 1000 Bio-Rad electrophoresis apparatus (Hercules, CA, USA) set at 150 V and 15–50 mA for 60 min.

3.7. Degree of Hydrolysis (DH)

The DH of the SGID digested samples was determined (n = 3) according to the method described by Le Maux et al. [41], where test samples at 5% (w/v) protein were diluted (1:49) in 1% (w/v) SDS. Samples were heated for 30 min at 50 °C. The 5% (w/v) TNBS stock solution was diluted to 0.5% (w/v) using a 1:1 mixing solution of water and sodium phosphate buffer (0.2125 M, pH 8.2). Aliquots (10 μL) from each sample were then added to a 96-well micro plate (Sarstedt Ltd, Wexford, Ireland) along with 160 μL of TNBS in each well. The plate was maintained at 50 °C and the absorbance was recorded every 5 min during 1 h at λ = 350 nm using a BioTek Synergy HT reader (Winooski, VT, USA). Leu at various concentrations (0, 2, 5, 7, 14, 21, 28 and 56 mg/mL in 1% (w/v) SDS) was used as a standard.

3.8. Gel Permeation–High Performance Liquid Chromatography (GP-HPLC)

Test samples containing 0.25% (w/v) protein dissolved in mobile phase (30% ACN, 0.1% TFA) were prepared for GP-HPLC analysis (n = 3). Samples were then filtered into Eppendorf tubes using 0.2 μm polytetrafluoroethylene syringe filters (VWR, Dublin, Ireland) and 200 μL of each sample was transferred into HPLC sample vials. Separation was performed by isocratic elution on a TSK G2000 SW separating column (600 × 7.5 mm ID) fitted with a TSKGEL SW guard column (75 × 7.5 mm ID—Tosoh Bioscience, Tokyo, Japan) over 51 min. The absorbance of the eluent was monitored at 214 nm and separation was carried out at a flow rate of 0.5 mL/min. Molecular mass standards including bovine serum albumin (67.5 kDa), β-lactoglobulin (β-lg, 36 kDa), α-lactalbumin (α-la, 14.2 kDa), aprotinin (6.5 kDa), bacitracin (1.4 kDa), LWMR (0.605 kDa), DE (0.262 kDa) and L-Tyrosine (0.181 kDa) were used for generation of the calibration curve [42].

3.9. ABTS Radical (ABTS) Scavenging Assay

The ABTS scavenging activity was determined (n = 3) according to Amigo-Benavent et al. [43]. Freeze-dried digested SGID-treated plant protein isolates and blends as well as non-digested protein samples (21 mg on a protein basis) were reconstituted in 1 mL of phosphate-buffered saline (PBS) pH 7.4 and were subsequently centrifuged (Hettich Zentrifugen Universal 320R centrifuge, Andreas Heittich GmbH Co., Tuttlingen, Germany) at 4 °C and 5000× g for 5 min. ABTS was diluted to an absorbance of ~0.7 (Au) at λ = 734 nm. An aliquot (160 μL) of this was added to the digested samples (at final concentrations of 0.00, 0.02, 0.05, 0.10, 0.2, 0.50, 1.00 and 2.00 mg/mL) obtained from the gastric and intestinal digestion stages in a microtiter plate. PBS was used as a blank. The absorbance was recorded using a BioTek Synergy HT reader (VT, USA) over 6 min, with shaking at 30 °C. The EC50 (half maximal effective concentration) for ABTS scavenging activity was calculated according to Amigo-Benavent et al. [43].

3.10. Statistical Analysis

Data values were presented as means ± standard deviation (SD). All experiments were performed at least in triplicate, except where mentioned otherwise. One-way analysis of variance followed by the Tukey post hoc comparison test was carried out to test for significant differences using Minitab® Release 15 for Windows (Coventry, UK). A p-value < 0.05 was considered as statistically significant.

4. Conclusions

In this study, the use of plant proteins (SPI, RPI and PPI) in combination with MPC represented a promising strategy for overcoming the challenge associated with the low level of digestibility of plant proteins. Herein, it was shown that the contribution of MPC to SPI, PPI and in particular RPI increased the in vitro digestibility and PDCAAS value associated with the samples. In addition, the antioxidant activity of the blends of PPI–MPC and RPI–MPC before and after SGID digestion treatment was higher than the individual plant proteins showing that blending of plant and milk proteins is a promising strategy to provide protein ingredients with high antioxidant activity. The prospect for future research in this area is strong and further explorations of different plant protein sources as alternatives to dairy proteins should allow a deeper insight into the nutritional and functional capabilities of the blends.

Supplementary Materials

The following is available online at https://www.mdpi.com/article/10.3390/catal11070787/s1, Table S1: Moisture, protein, ash and lipid content along with reconstitution pH (0.05% (w/v) on a protein basis) of soy, rice and pea protein isolates and milk protein concentrate.

Author Contributions

Conceptualization, M.K. and R.J.F.; methodology, M.K.; validation, M.K. and R.J.F.; formal analysis, M.K.; investigation, M.K.; resources, R.J.F.; writing—original draft preparation, M.K.; writing—review and editing, R.J.F.; supervision, R.J.F.; project administration, R.J.F.; funding acquisition, M.K. and R.J.F. All authors have read and agreed to the published version of the manuscript.

Funding

This project has received funding from the European Union’s Horizon 2020 research and innovation programme under the Marie Skłodowska-Curie Career-FIT Grant Agreement No. 713654.

Data Availability Statement

Not applicable.

Conflicts of Interest

The authors declare that there are no conflict of interest.

Abbreviations

AbbreviationDescription
ABTS2,2′-azino-bis(3-ethylbenzothiazoline-6-sulfonic acid)
α-laα-lactalbumin
β-lgβ-lactoglobulin
ACNacetonitrile
AAamino acid
ANFantinutritional factor
BCAAbranched chain amino acid
DHdegree of hydrolysis
DIASdigestible indispensable amino acid score
EAAessential amino acid
GP-HPLCgel permeation - high performance liquid chromatography
EC50half maximal effective concentration
MPCmilk protein concentrate
MWmolecular weight
NEAAnon-essential amino acid
PPCpea protein concentrate
PPIpea protein isolate
PBSphosphate-buffered saline
PAGEpolyacrylamide gel electrophoresis
PDCAASprotein digestibility corrected amino acid score
RP-UPLCreverse-phase ultra-performance liquid chromatography
RPCrice protein concentrate
RPIrice protein isolate
SGIDsimulated gastro-intestinal digestion
SDSsodium dodecyl sulfate
SDstandard deviation
SPIsoy protein isolate
TCAtrichloroacetic acid
TFAtrifluoroacetic acid
TNBStrinitrobenzenesulfonic acid
WPwhey protein

References

  1. Anderson, C.A.M.; Bradley, R. The potential of novel plant protein foods to improve dietary patterns and markers of cardiovascular health. Am. J. Clin. Nutr. 2020, 112, 1151–1152. [Google Scholar] [CrossRef] [PubMed]
  2. Loveday, S.M. Plant protein ingredients with food functionality potential. Nutr. Bull. 2020, 45, 321–327. [Google Scholar] [CrossRef]
  3. Foegeding, E.A.; Davis, J.P. Food protein functionality: A comprehensive approach. Food Hydrocolloid 2011, 25, 1853–1864. [Google Scholar] [CrossRef]
  4. Boye, J.; Zare, F.; Pletch, A. Pulse proteins: Processing, characterization, functional properties and applications in food and feed. Food Res. Int. 2010, 43, 414–431. [Google Scholar] [CrossRef]
  5. Alves, A.C.; Tavares, G.M. Mixing animal and plant proteins: Is this a way to improve protein techno-functionalities? Food Hydrocolloid 2019, 97, 105171. [Google Scholar] [CrossRef]
  6. Silva, J.V.C.; Jacquette, B.; Amagliani, L.; Schmitt, C.; Nicolai, T.; Chassenieux, C. Heat-induced gelation of micellar casein/plant protein oil-in-water emulsions. Colloids Surf. A 2019, 569, 85–92. [Google Scholar] [CrossRef]
  7. Reidy, P.T.; Walker, D.K.; Dickinson, J.M.; Gundermann, D.M.; Drummond, M.J.; Timmerman, K.L.; Fry, C.S.; Borack, M.S.; Cope, M.B.; Mukherjea, R.; et al. Proteinblend ingestion following resistance exercise promoteshuman muscle protein synthesis. J. Nutr. 2013, 143, 410–416. [Google Scholar] [CrossRef]
  8. Reidy, P.T.; Walker, D.K.; Dickinson, J.M.; Gundermann, D.M.; Drummond, M.J.; Timmerman, K.L.; Cope, M.B.; Mukherjea, R.; Jennings, K.; Volpi, E.; et al. Soy-dairy protein blend and whey protein ingestion after resistance exercise increases amino acid transport and transporter expression in human skeletal muscle. J. Appl. Physiol. 2014, 116, 1353–1364. [Google Scholar] [CrossRef] [PubMed]
  9. Butteiger, D.N.; Cope, M.; Liua, P.; Mukherjea, R.; Volpi, E.; Rasmussen, B.B.; Krul, E.S. A soy, whey and caseinate blend extends postprandial skeletal muscle protein synthesis in rats. Clin. Nutr. 2013, 32, 585–591. [Google Scholar] [CrossRef] [Green Version]
  10. Liu, J.; Klebach, M.; Visser, M.; Hofman, Z. Amino acid availability of a dairy and vegetable protein blend compared to single casein, whey, soy, and pea proteins: A double-blind, cross-over trial. Nutrients 2019, 11, 2613. [Google Scholar] [CrossRef] [Green Version]
  11. Khalesi, M.; FitzGerald, R.J. Insolubility in milk protein concentrates: Potential causes and strategies to minimize its occurrence. Crit. Rev. Food Sci. Nutr. 2021. [Google Scholar] [CrossRef] [PubMed]
  12. Mathai, J.K.; Liu, Y.; Stein, H.H. Values for digestible indispensable amino acid scores (DIAAS) for some dairy and plant proteins may better describe protein quality than values calculated using the concept for protein digestibility-corrected amino acid scores (PDCAAS). Br. J. Nutr. 2017, 117, 490–499. [Google Scholar] [CrossRef] [PubMed]
  13. Rutherfurd, S.M.; Fanning, A.C.; Miller, B.J.; Moughan, P.J. Protein digestibility-corrected amino acid scores and digestible indispensable amino acid scores differentially describe protein quality in growing male rats. J. Nutr. 2015, 145, 372–379. [Google Scholar] [CrossRef] [Green Version]
  14. Gorissen, S.H.M.; Witard, O.C. Characterising the muscle anabolic potential of dairy, meat and plant-based protein sources in older adults. Proc. Nutr. Soc. 2018, 77, 20–31. [Google Scholar] [CrossRef] [PubMed]
  15. Sarwar, G. The protein digestibility–corrected amino acid score method overestimates quality of proteins containing antinutritional factors and of poorly digestible proteins supplemented with limiting amino acids in rats. J. Nutr. 1997, 127, 758–764. [Google Scholar] [CrossRef] [Green Version]
  16. Jiang, J.; Zhu, B.; Liu, Y.; Xiong, Y. Interfacial structural role of pH-shifting processed pea protein in the oxidative stability of oil/water emulsions. J. Agric. Food Chem. 2014, 62, 1683–1691. [Google Scholar] [CrossRef]
  17. Dickinson, E. Milk protein interfacial layers and the relationship to emulsion stability and rheology. Colloids Surf. B 2001, 20, 197–210. [Google Scholar] [CrossRef]
  18. Jiang, L.; Liu, Y.; Li, L.; Qi, B.; Ju, M.; Xu, Y.; Zhang, Y.; Sui, X. Covalent conjugates of anthocyanins to soy protein: Unravelling their structure features and in vitro gastrointestinal digestion fate. Food Res. Int. 2019, 120, 603–609. [Google Scholar] [CrossRef]
  19. Stojadinovic, M.; Radosavljevic, J.; Ognjenovic, J.; Vesic, J.; Prodic, I.; Stanic-Vucinic, D.; Velickovic, T.C. Binding affinity between dietary polyphenols and β-lactoglobulin negatively correlates with the protein susceptibility to digestion and total antioxidant activity of complexes formed. Food Chem. 2013, 136, 1263–1271. [Google Scholar] [CrossRef] [PubMed]
  20. Gilani, G.S.; Xiao, C.W.; Cockell, K.A. Impact of antinutritional factors in food proteins on the digestibility of protein and the bioavailability of amino acids and on protein quality. Br. J. Nutr. 2012, 108, 315–332. [Google Scholar] [CrossRef]
  21. Paul, G.L. The rationale for consuming protein blends in sports nutrition. J. Am. Coll. Nutr. 2009, 28, 464–472. [Google Scholar] [CrossRef]
  22. Nongonierma, A.B.; FitzGerald, R.J. Investigation of the potential of hemp, pea, rice and soy protein hydrolysates as a source of dipeptidyl peptidase IV (DPP-IV) inhibitory peptides. Food Digest. Res. Curr. Opin. 2015, 6, 19–29. [Google Scholar] [CrossRef]
  23. Xu, Z.; Mao, T.M.; Huang, L.; Yu, Z.C.; Yin, B.; Chen, M.L.; Cheng, Y.H. Purification and identification immunomodulatory peptide from rice bran protein hydrolysates. Food Agric. Immunol. 2019, 30, 150–162. [Google Scholar] [CrossRef] [Green Version]
  24. Nwachukwu, I.D.; Aluko, R.E. Structural and functional properties of food protein-derived antioxidant peptides. J. Food Biochem. 2019, 43, e12761. [Google Scholar] [CrossRef] [PubMed] [Green Version]
  25. Han, H.; Baik, B.-K. Antioxidant activity and phenolic content of lentils (Lens culinaris), chickpeas (Cicer arietinum L.), peas (Pisum sativum L.) and soybeans (Glycine max), and their quantitative changes during processing. Int. J. Food Sci. Technol. 2008, 43, 1971–1978. [Google Scholar] [CrossRef]
  26. Tian, S.; Nakamura, K.; Kayahara, H. Analysis of phenolic compounds in white rice, brown rice, and germinated brown rice. J. Agric. Food Chem. 2004, 52, 4808–4813. [Google Scholar] [CrossRef]
  27. Peñta-Ramos, E.A.; Xiong, Y.L. Antioxidant activity of soy protein hydrolysates in a liposomal system. J. Food Sci. 2002, 67, 2952–2956. [Google Scholar] [CrossRef]
  28. Cervato, G.; Cazzola, R.; Cestaro, B. Studies on the antioxidant activity of milk caseins. Int. J. Food Sci. Nutr. 1999, 50, 291–296. [Google Scholar] [CrossRef] [PubMed]
  29. Gad, A.S.; Khadrawy, Y.A.; El-Nekeety, A.A.; Mohamed, S.R.; Hassan, N.S.; Abdel-Wahhab, M.A. Antioxidant activity and hepatoprotective effects of whey protein and Spirulina in rats. Nutrition 2011, 27, 582–589. [Google Scholar] [CrossRef]
  30. Liu, T.; Zhao, M. Physical and chemical modification of SPI as a potential means to enhance small peptide contents and antioxidant activity found in hydrolysates. Innov. Food Sci. Emerg. 2010, 11, 677–683. [Google Scholar] [CrossRef]
  31. Beermann, C.; Euler, M.; Herzberg, J.; Stahl, B. Anti-oxidative capacity of enzymatically released peptides from soybean protein isolate. Eur. Food Res. Technol. 2009, 229, 637–644. [Google Scholar] [CrossRef]
  32. Guan, H.; Diao, X.; Jiang, F.; Han, J.; Kong, B. The enzymatic hydrolysis of soy protein isolate by Corolase PP under high hydrostatic pressure and its effect on bioactivity and characteristics of hydrolysates. Food Chem. 2018, 245, 89–96. [Google Scholar] [CrossRef] [PubMed]
  33. Ciulu, M.; Cádiz-Gurrea, M.L.; Segura-Carretero, A. Extraction and analysis of phenolic compounds in rice: A review. Molecules 2018, 23, 2890. [Google Scholar] [CrossRef] [PubMed] [Green Version]
  34. Fathi, P.; Moosavi-Nasab, M.; Mirzapour-Kouhdasht, A.; Khalesi, M. Generation of hydrolysates from rice bran proteins using a combined ultrasonication-Alcalase hydrolysis treatment. Food Biosci. 2021. [Google Scholar] [CrossRef]
  35. Pownall, T.L.; Udenigwe, C.C.; Aluko, R.E. Amino acid composition and antioxidant properties of pea seed (Pisum sativum L.) enzymatic protein hydrolysate fractions. J. Agric. Food Chem. 2010, 58, 4712–4718. [Google Scholar] [CrossRef] [PubMed]
  36. Ding, J.; Liang, R.; Yang, Y.; Sun, N.; Lina, S. Optimization of pea protein hydrolysate preparation and purification of antioxidant peptides based on an in silico analytical approach. LWT Food Sci. Technol. 2020, 123, 109126. [Google Scholar] [CrossRef]
  37. Awad, S.; El-Sayed, M.; Wahba, A.; El Attar, A.; Yousef, M.; Zedan, M. Antioxidant activity of milk protein hydrolysate in alloxan-induced diabetic rats. J. Dairy Sci. 2016, 99, 8499–8510. [Google Scholar] [CrossRef] [PubMed] [Green Version]
  38. Cermeño, M.; Connolly, A.; O’Keeffe, M.B.; Flynn, C.; Alashi, A.M.; Aluko, R.E.; FitzGerald, R.J. Identification of bioactive peptides from brewers’ spent grain and contribution of Leu/Ile to bioactive potency. J. Funct. Foods 2019, 60, 103455–103463. [Google Scholar] [CrossRef]
  39. Food and Agriculture Organization of the United Nations/World Health Organization (FAO/WHO). Protein Quality Evaluation: Report of the Joint FAO/WHO Expert Consultation; Food and Agriculture Organization of the United Nations: Auckland, New Zealand, 2011. [Google Scholar]
  40. Walsh, D.J.; Bernard, H.; Murray, B.A.; MacDonald, J.; Pentzien, A.K.; Wright, G.A.; Wal, J.M.; Struthers, A.D.; Meisel, H.; FitzGerald, R.J. In vitro generation and stability of the lactokinin β-Lactoglobulin fragment (142–148). J. Dairy Sci. 2004, 87, 3845–3857. [Google Scholar] [CrossRef] [Green Version]
  41. Le Maux, S.; Nongonierma, A.B.; Barre, C.; FitzGerald, R.J. Enzymatic generation of whey protein hydrolysates under pH-controlled and non pH-controlled conditions: Impact on physicochemical and bioactive properties. Food Chem. 2016, 199, 246–251. [Google Scholar] [CrossRef] [PubMed] [Green Version]
  42. Spellman, D.; O’Cuinn, G.; FitzGerald, R.J. Physicochemical and sensory characteristics of whey protein hydrolysates generated at different total solids levels. J. Dairy Res. 2005, 72, 138–143. [Google Scholar] [CrossRef] [PubMed] [Green Version]
  43. Amigo-Benavent, M.; Khalesi, M.; Thapa, G.; FitzGerald, R.J. Methodologies for bioactivity assay: Biochemical study. In Biologically Active Peptides; Elsevier: Amsterdam, The Netherlands, 2021; pp. 103–153. [Google Scholar] [CrossRef]
Figure 1. Reverse-phase ultra-performance liquid chromatography profiles of the blends of soy (SPI), rice (RPI) and pea protein isolate (PPI) with milk protein concentrate (MPC) dissolved in 0.1% (v/v) trifluoroacetic acid.
Catalysts 11 00787 g001
Figure 2. Sodium dodecyl phosphate polyacrylamide gel electrophoresis (SDS-PAGE) profile of molecular weight (MW) protein marker, SPI–MPC 25:7, RPI–MPC 50:50 and PPI–MPC 25:75 blends, before and after gastric (pepsin) and intestinal (Corolase PP) digestion. SPI, PPI, RPI and MPC represent soy, pea and rice protein isolate and milk protein concentrate, respectively. ND, GD and GID represent non-, gastro- and gastro-intestinal digested, respectively.
Catalysts 11 00787 g002
Figure 3. Molecular mass distribution profiles of SPI (a) and SPI–MPC 25:75 blend (b); RPI (c) and RPI–MPC 50:50 blend (d); and PPI (e) and PPI–MPC 25:75 blend (f), before and after simulated gastric and gastro-intestinal digestion. SPI, PPI, RPI and MPC represent soy, pea and rice protein isolate and milk protein concentrate, respectively. ND, GD and GID represent non-, gastro- and gastro-intestinal digested, respectively.
Catalysts 11 00787 g003
Table 1. Total amino acid composition (g/100 g protein), in vitro digestibility, first limiting essential amino acid, ratio of non-essential amino acids to total amino acids (%), ratio of branched chain amino acids to total amino acids (%) and protein digestibility corrected amino acid score of soy, pea and rice protein isolate, milk protein concentrates and plant protein isolate–MPC blends.
Amino Acid (g/100 g Protein)MPCSPIPPIRPISPI–MPC 25:75 (Protein Basis)PPI–MPC 25:75 (Protein Basis)RPI–MPC 50:50 (Protein Basis)
L-Cysteine0.541.300.801.500.730.601.02
L-Methionine2.021.300.902.301.841.742.16
L-Tryptophan1.080.900.800.701.031.010.89
L-Aspartic acid + L-Asparagine6.2810.909.207.307.437.016.79
L-Threonine3.723.203.103.103.593.563.41
L-Serine4.895.104.204.404.944.724.65
L-Glutamic acid + L-Glutamine17.1018.4013.4015.5017.4216.1716.30
L-Proline8.204.803.603.207.357.055.70
L-Glycine1.503.803.303.502.071.952.50
L-Alanine2.653.803.404.702.942.843.68
L-Valine5.334.104.004.605.025.004.97
L-Isoleucine4.273.903.604.104.184.104.19
L-Leucine7.667.006.708.507.507.428.08
L-Tyrosine4.273.703.004.404.133.954.34
L-Phenylalanine4.094.904.405.104.294.174.60
L-Lysine7.015.905.803.006.736.715.01
L-Histidine1.932.402.001.902.051.951.92
L-Arginine2.777.207.007.103.883.834.94
Ratio of BCAAs (%)20.0316.2018.0620.2619.1719.7220.15
First limiting EAATrpTrpCys + MetLysTrpTrpTrp
Ratio of NEAAs (%)43.0149.3546.0946.8844.6943.7444.94
In vitro digestibility (%)9410610810798102102
PDCAAS1.091.081.030.701.131.321.03
AA: amino acid; BCAA: branched chain amino acid; EAA: essential amino acid; NEAA: non-essential amino acid; PDCAAS: protein digestibility corrected amino acid score; SPI: soy protein isolate; PPI: pea protein isolate; RPI: rice protein isolate; MPC: milk protein concentrate. The AA data for the SPI, RPI and PPI samples was as provided by the manufacturer.
Table 2. Degree of hydrolysis and azinobis ethylbenzothiazoline sulfonic acid radical scavenging activity of the soy, rice and pea protein isolates and their associated blends with milk protein concentrate after digestion with pepsin (gastric phase) followed by Corolase PP (intestinal phase).
SampleDH (%), Gastric DigestionDH (%), Gastric Followed by Intestinal DigestionEC50 (mg/mL), UndigestedEC50 (mg/mL), Gastric DigestionEC50 (mg/mL), Gastric Followed by Intestinal Digestion
SPI2.44 ± 0.32 a,*8.64 ± 0.41 a3.05 ± 0.23 a0.31 ± 0.03 b0.19 ± 0.01 b
RPI2.15 ± 0.03 a7.58 ± 0.96 a6.42 ± 0.35 d2.27 ± 0.24 e1.89 ± 0.27 d
PPI3.95 ± 0.24 b8.90 ± 0.60 a5.21 ± 0.20 c0.94 ± 0.07 d0.49 ± 0.03 c
SPI–MPC (25:75)6.58 ± 0.12 d12.65 ± 0.40 b3.25 ± 0.21 a0.11 ± 0.01 a0.10 ± 0.01 a
RPI–MPC (50:50)4.41 ± 0.24 b,c16.99 ± 0.62 d4.12 ± 0.28 c2.15 ± 0.26 e1.04 ± 0.15 e
PPI–MPC (25:75)4.66 ± 0.25 c15.08 ± 0.37 c3.76 ± 0.19 b0.76 ± 0.01 c0.26 ± 0.05 c
DH: degree of hydrolysis amino acid; ABTS: azinobis ethylbenzothiazoline sulfonic acid radical; EC50: half maximal effective concentration; SPI: of soy protein isolate; PPI: pea protein isolate; RPI: rice protein isolate; MPC: milk protein concentrate. Data represent mean ± standard deviation (n = 3). * Different letters in each column represent significant difference between data (p < 0.05).
Publisher’s Note: MDPI stays neutral with regard to jurisdictional claims in published maps and institutional affiliations.

