
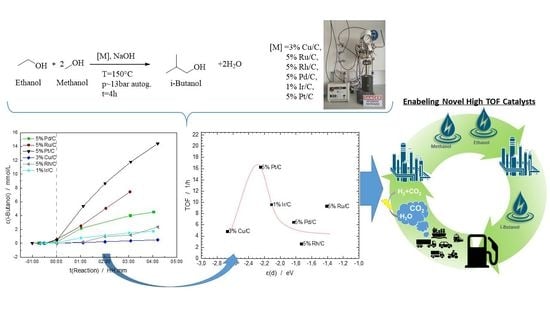
Elucidating the Influence of the d-Band Center on the Synthesis of Isobutanol

 , ,
, ,
Abstract
1. Introduction
2. Results
2.1. Catalyst Characterization
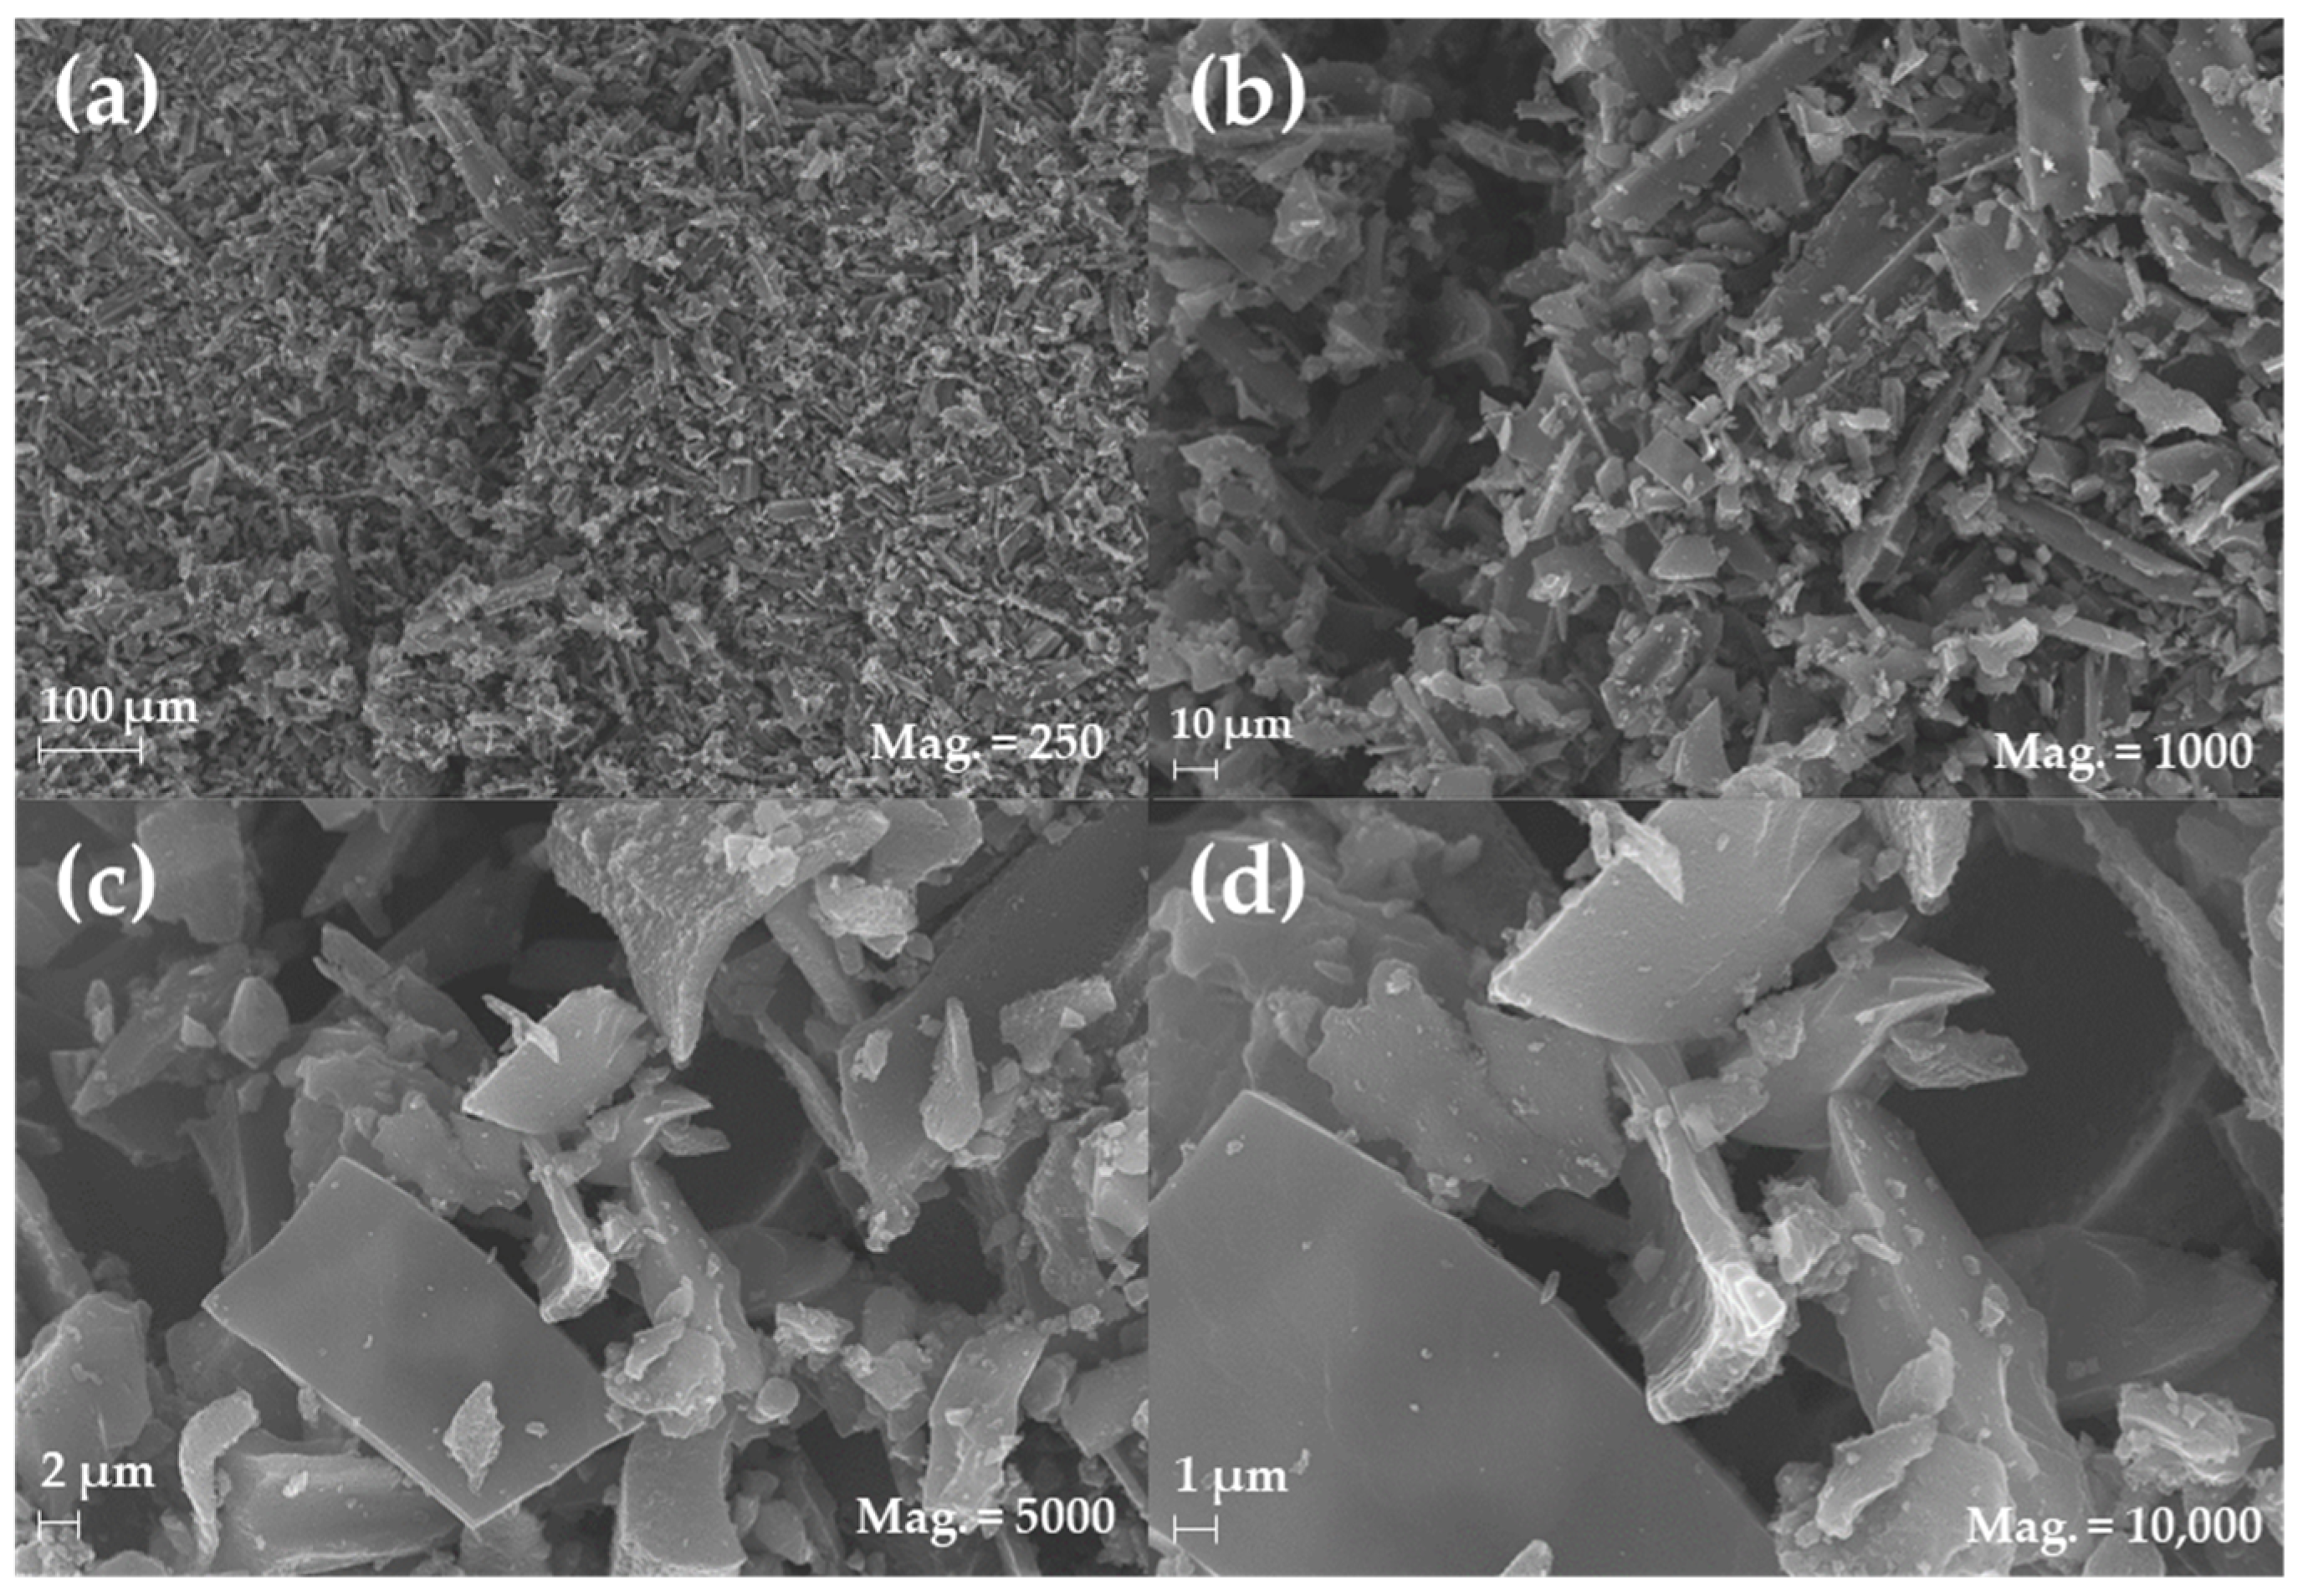
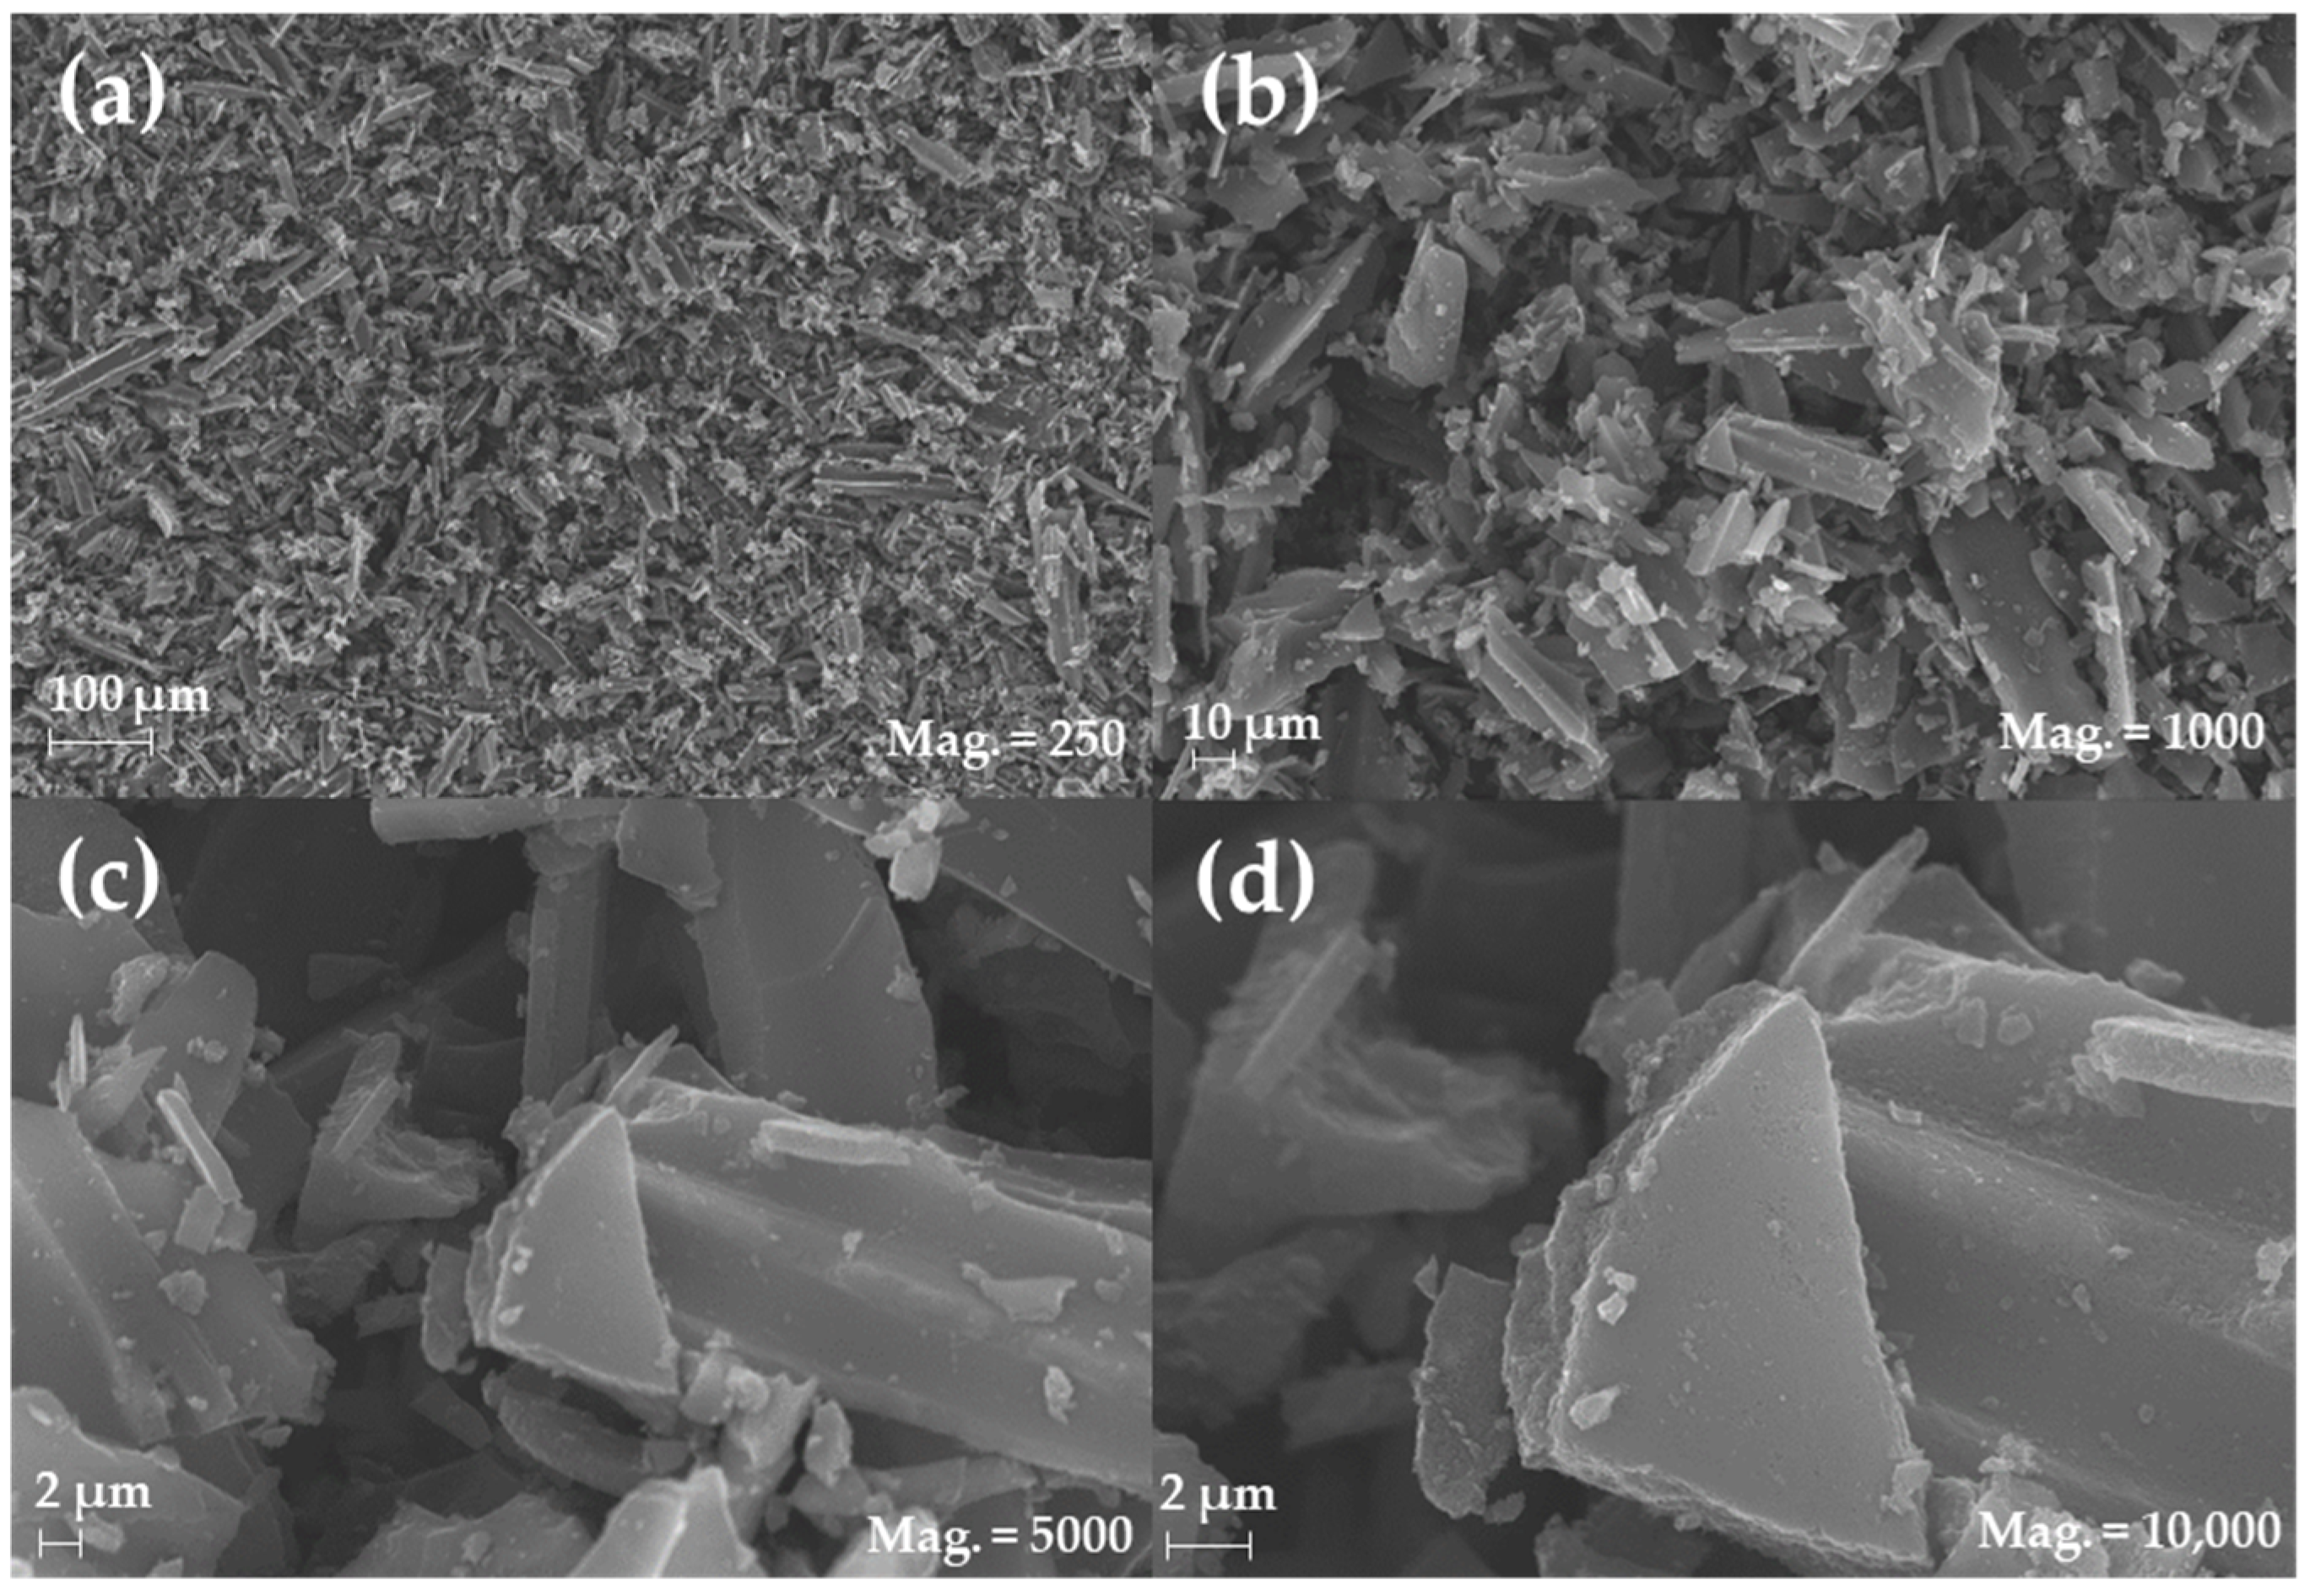
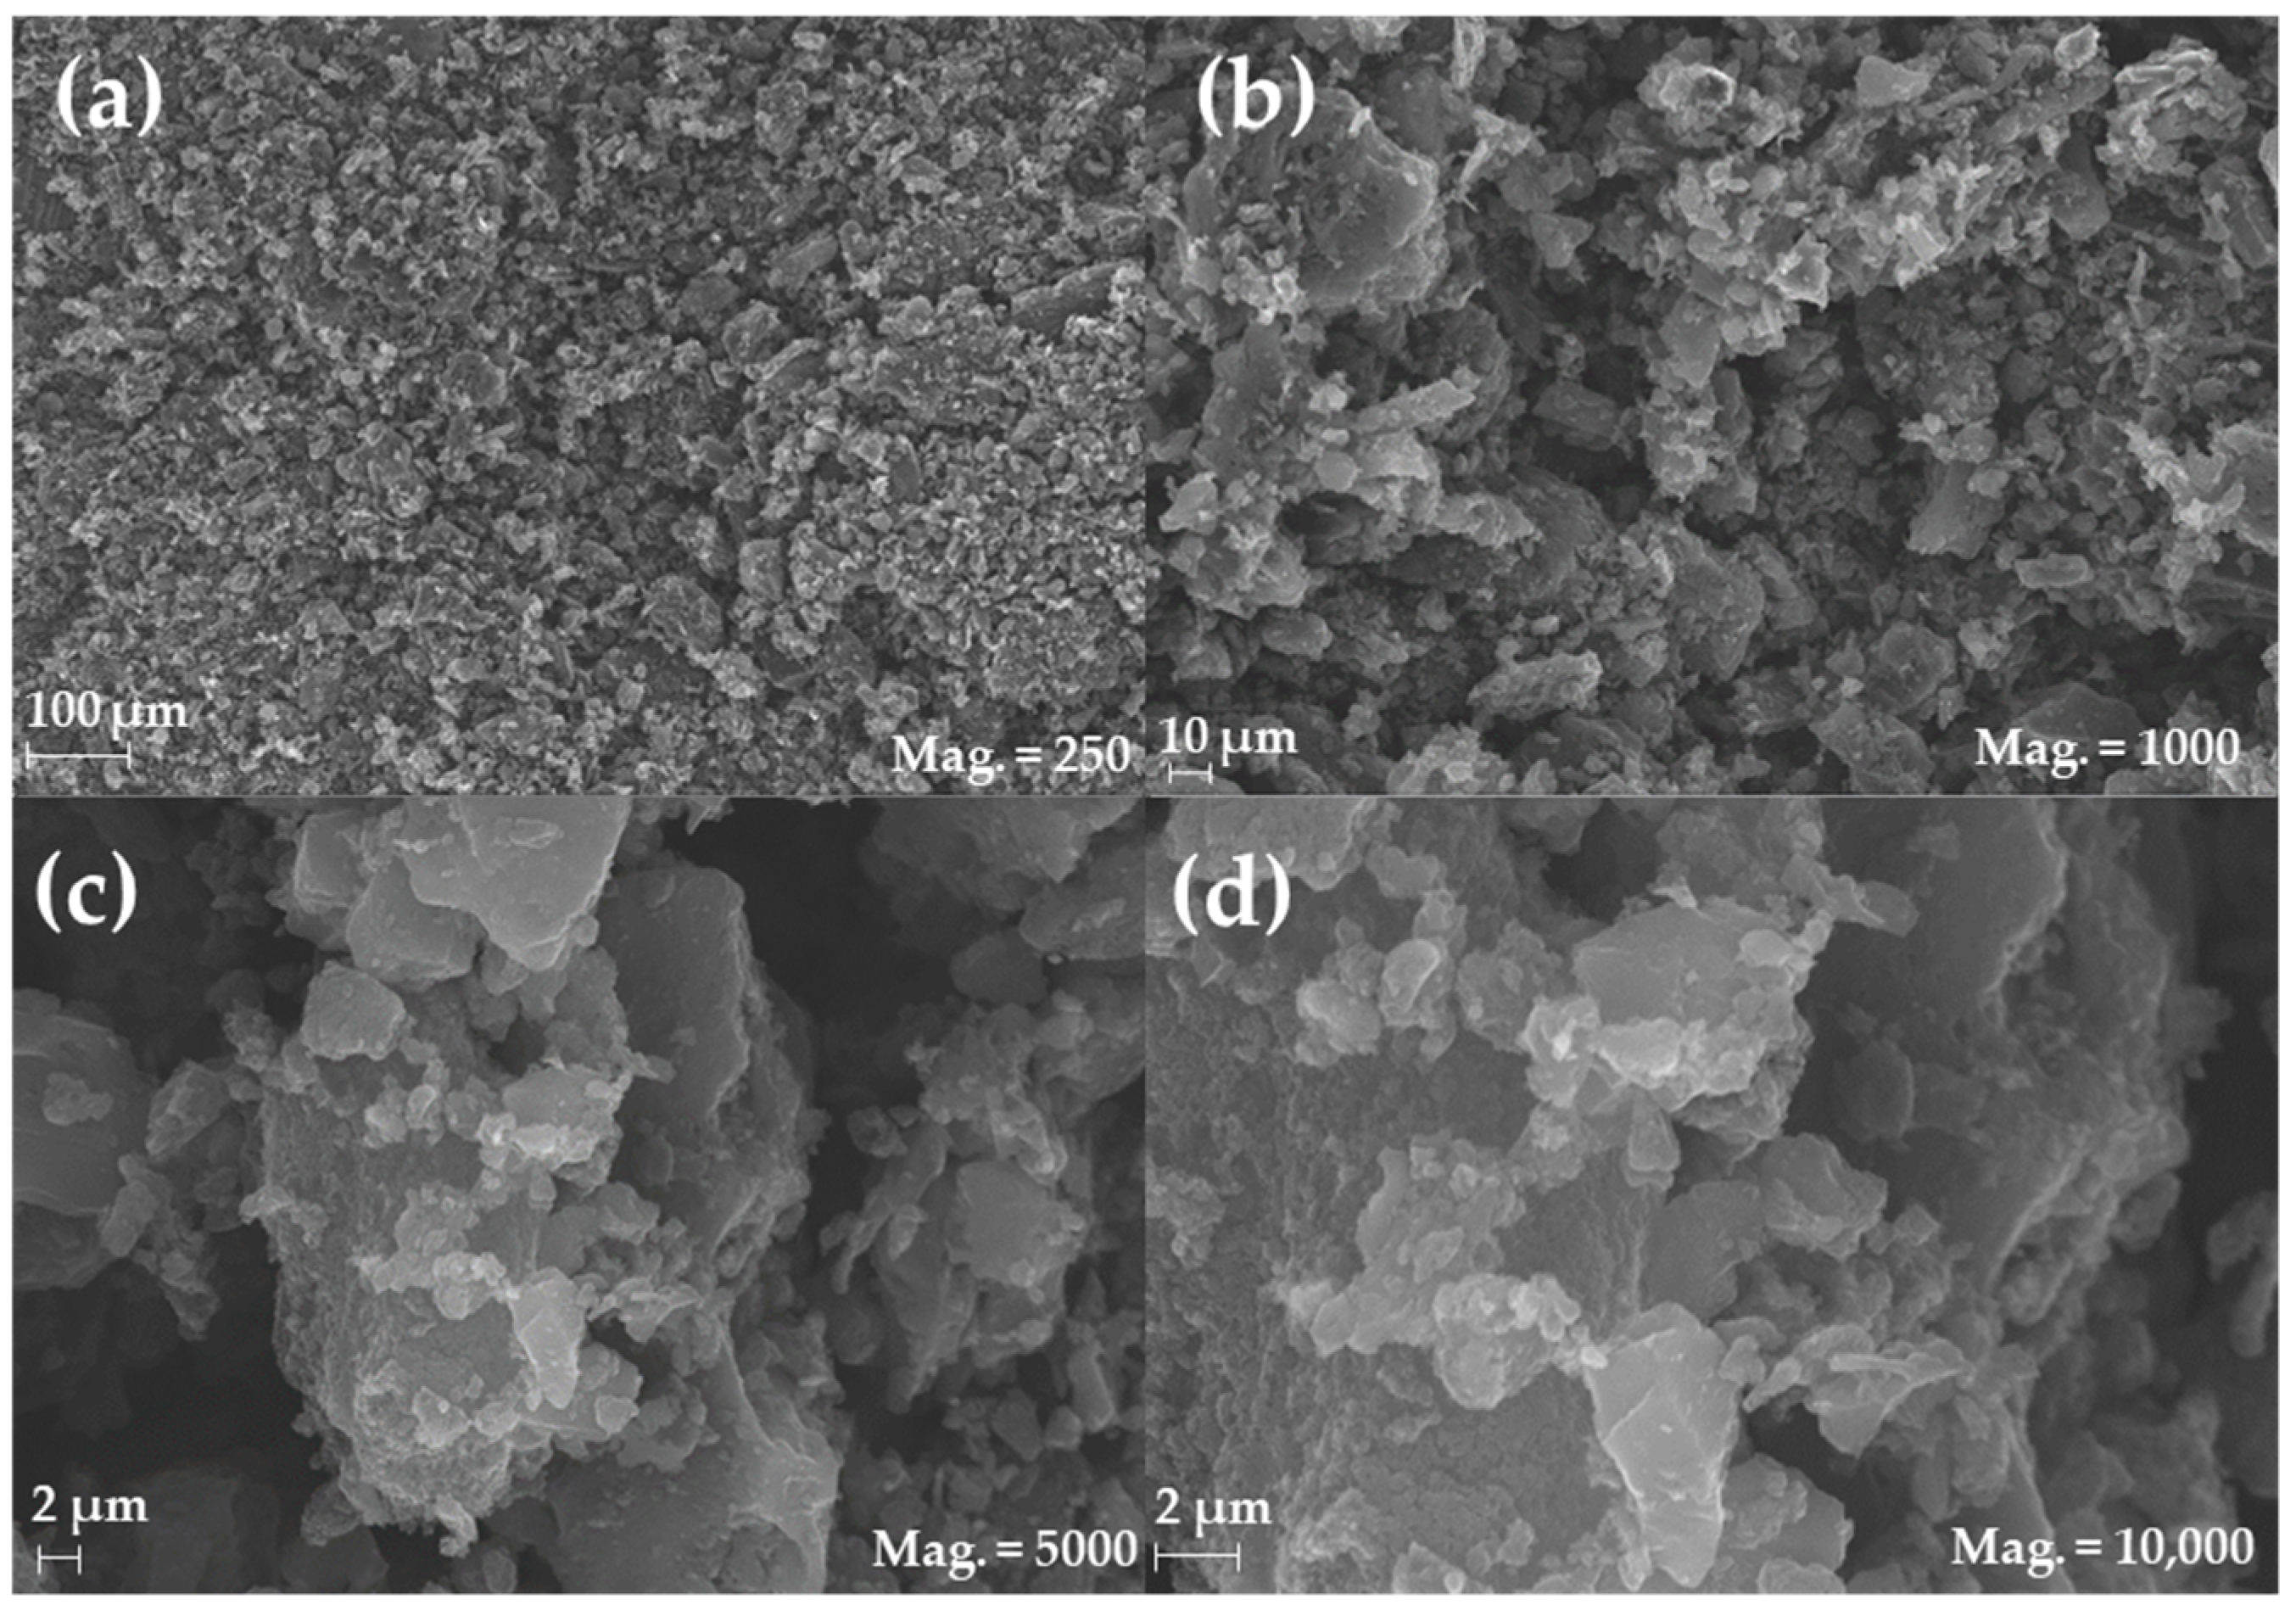
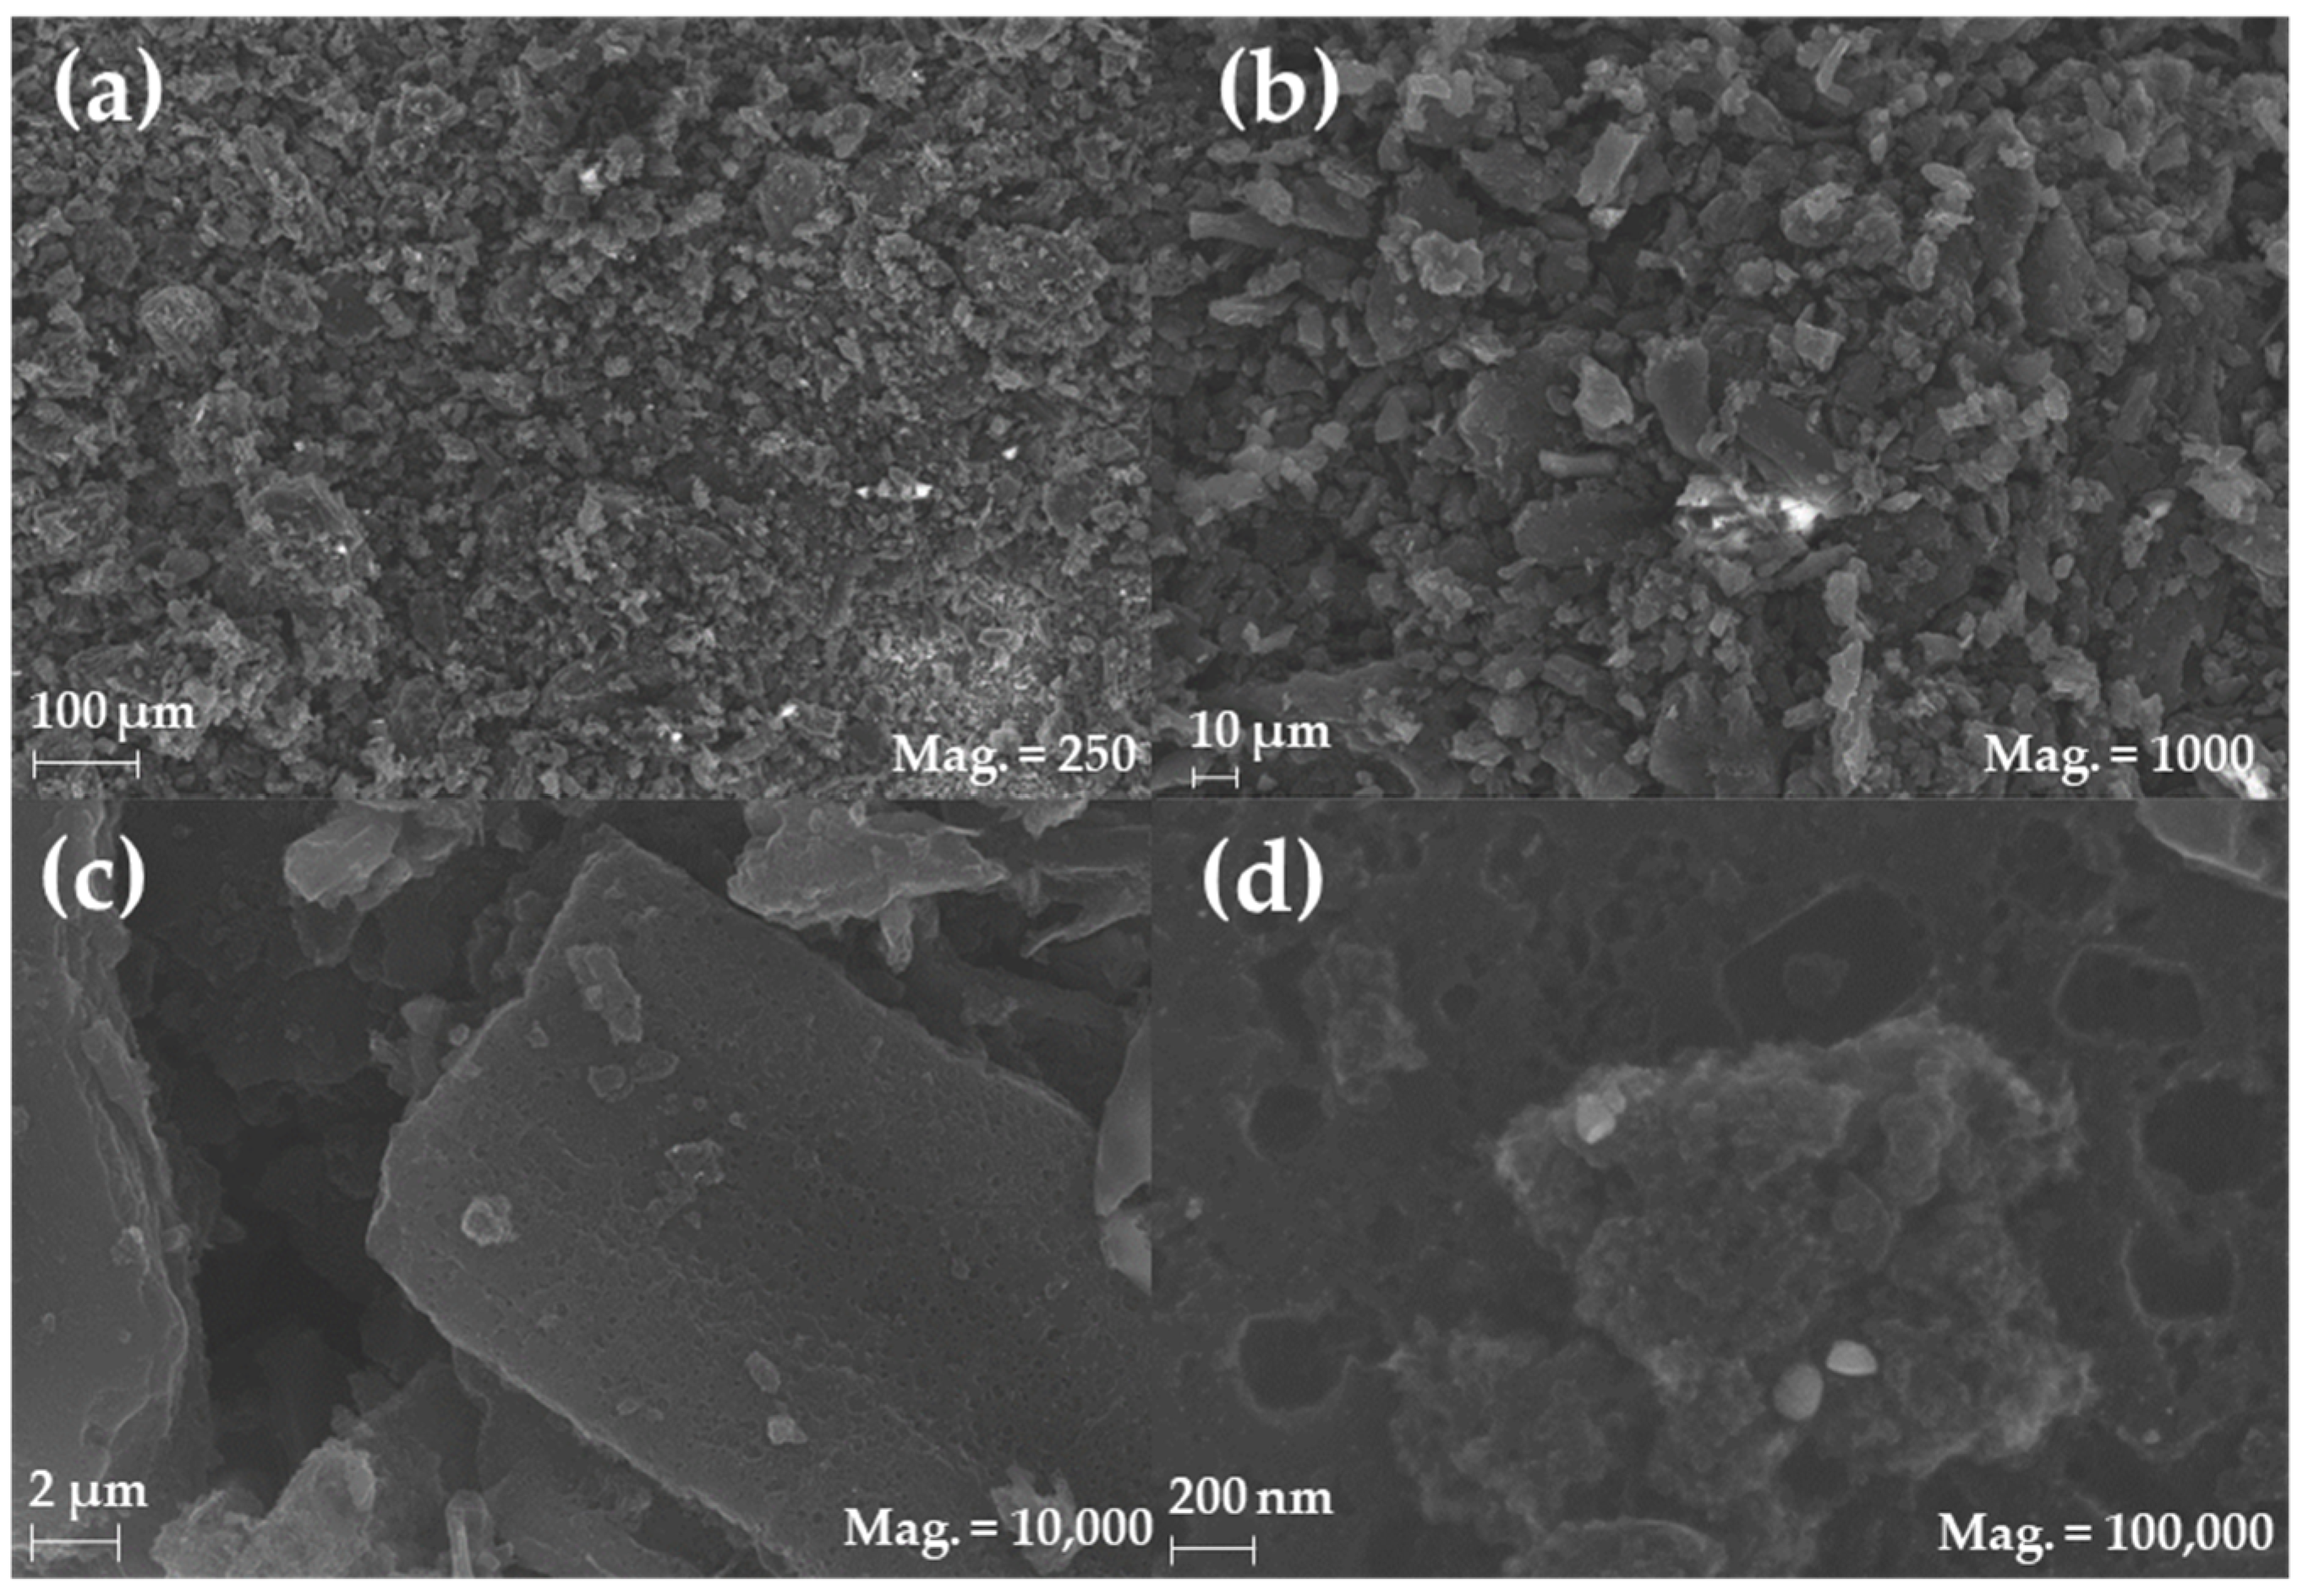
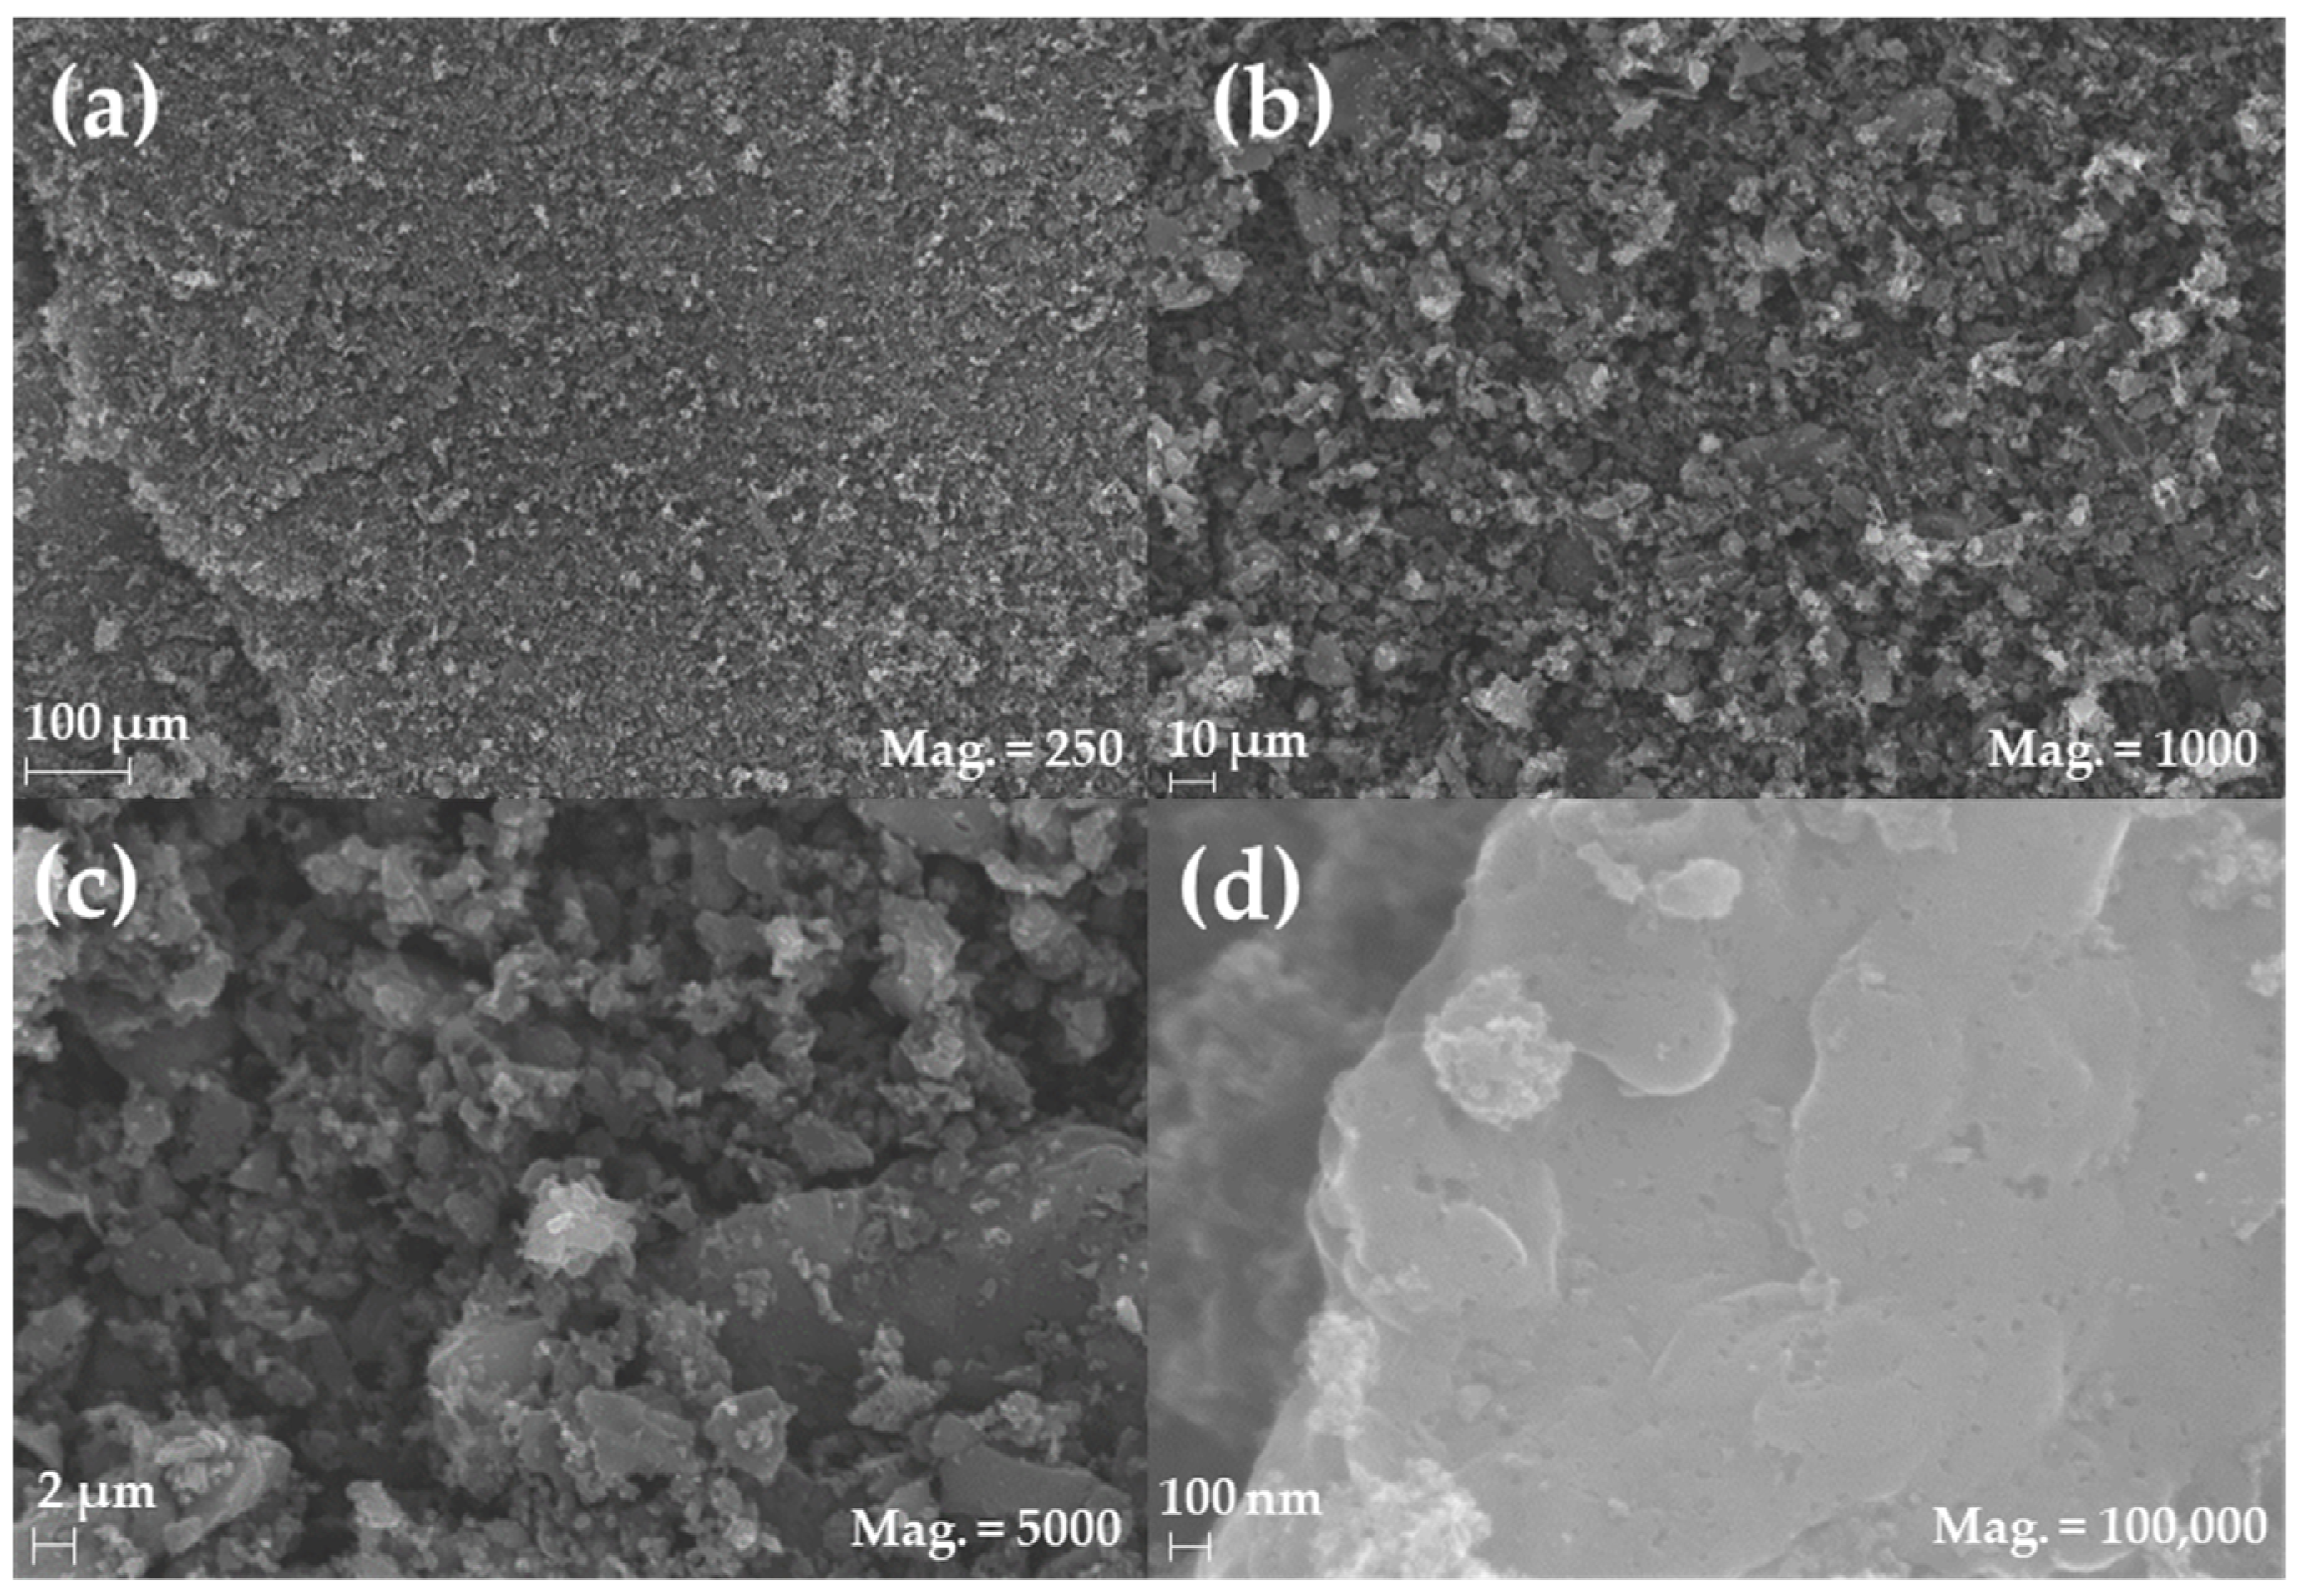
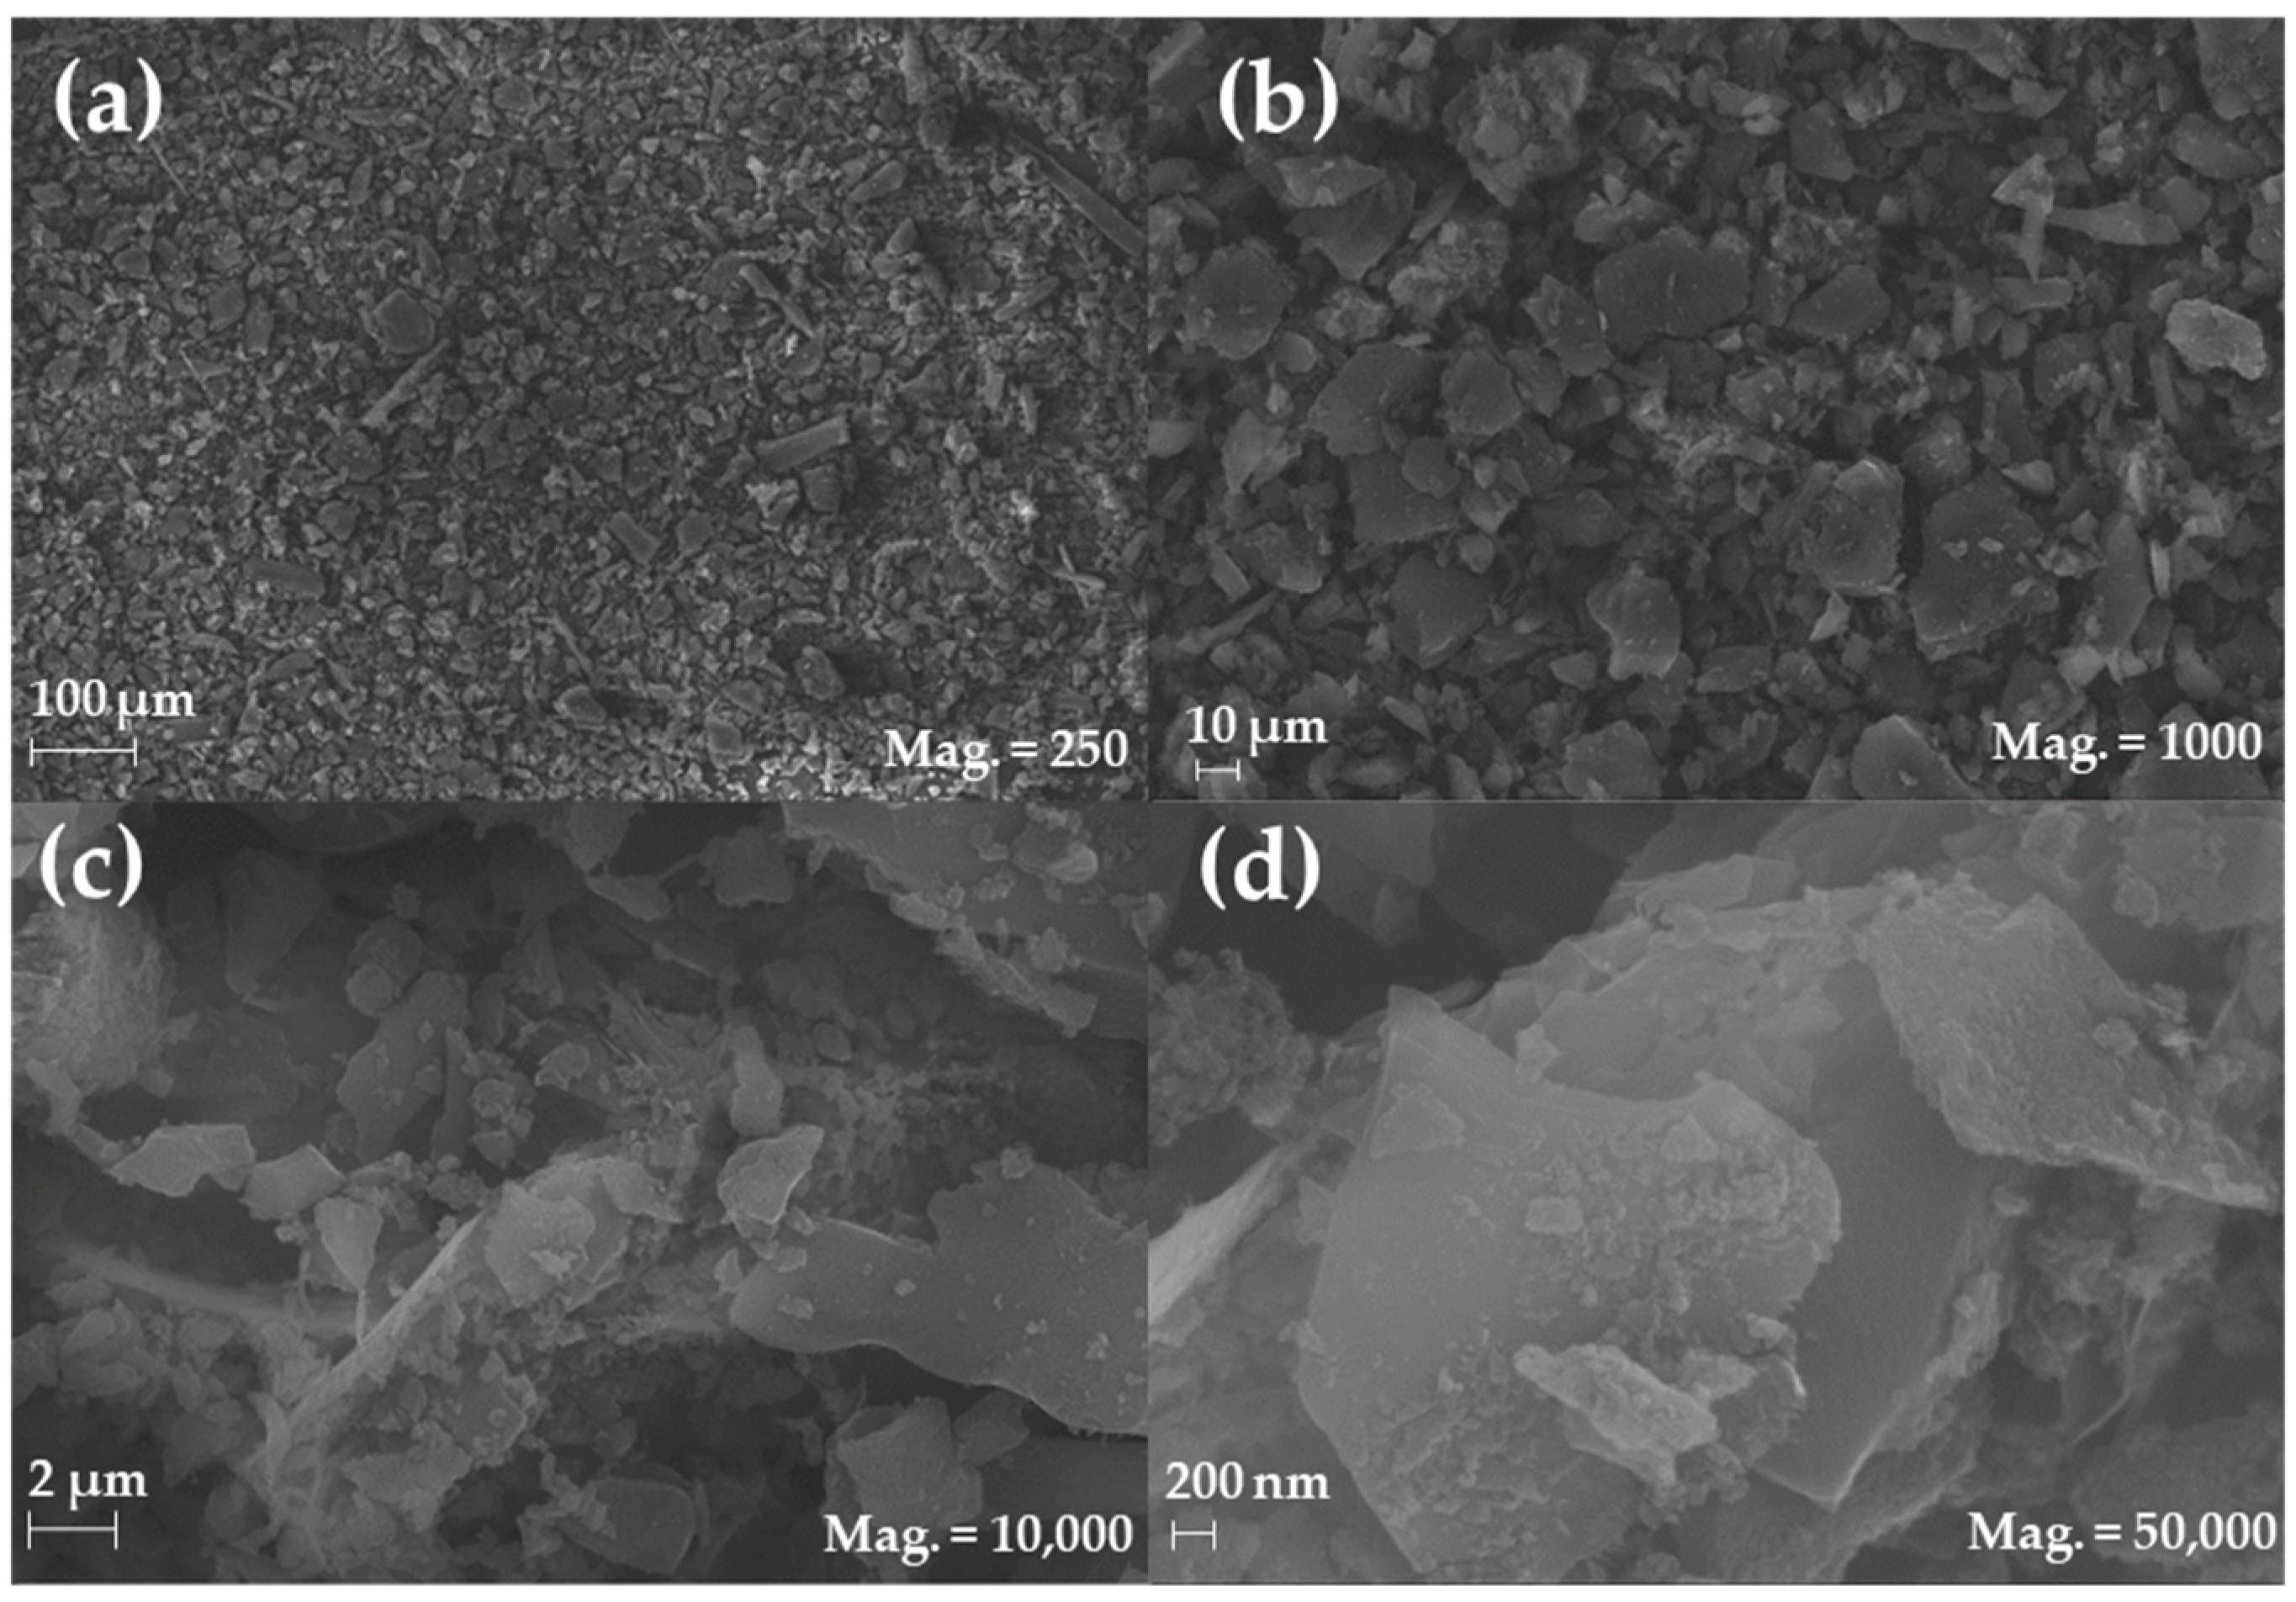
2.2. SEM Results
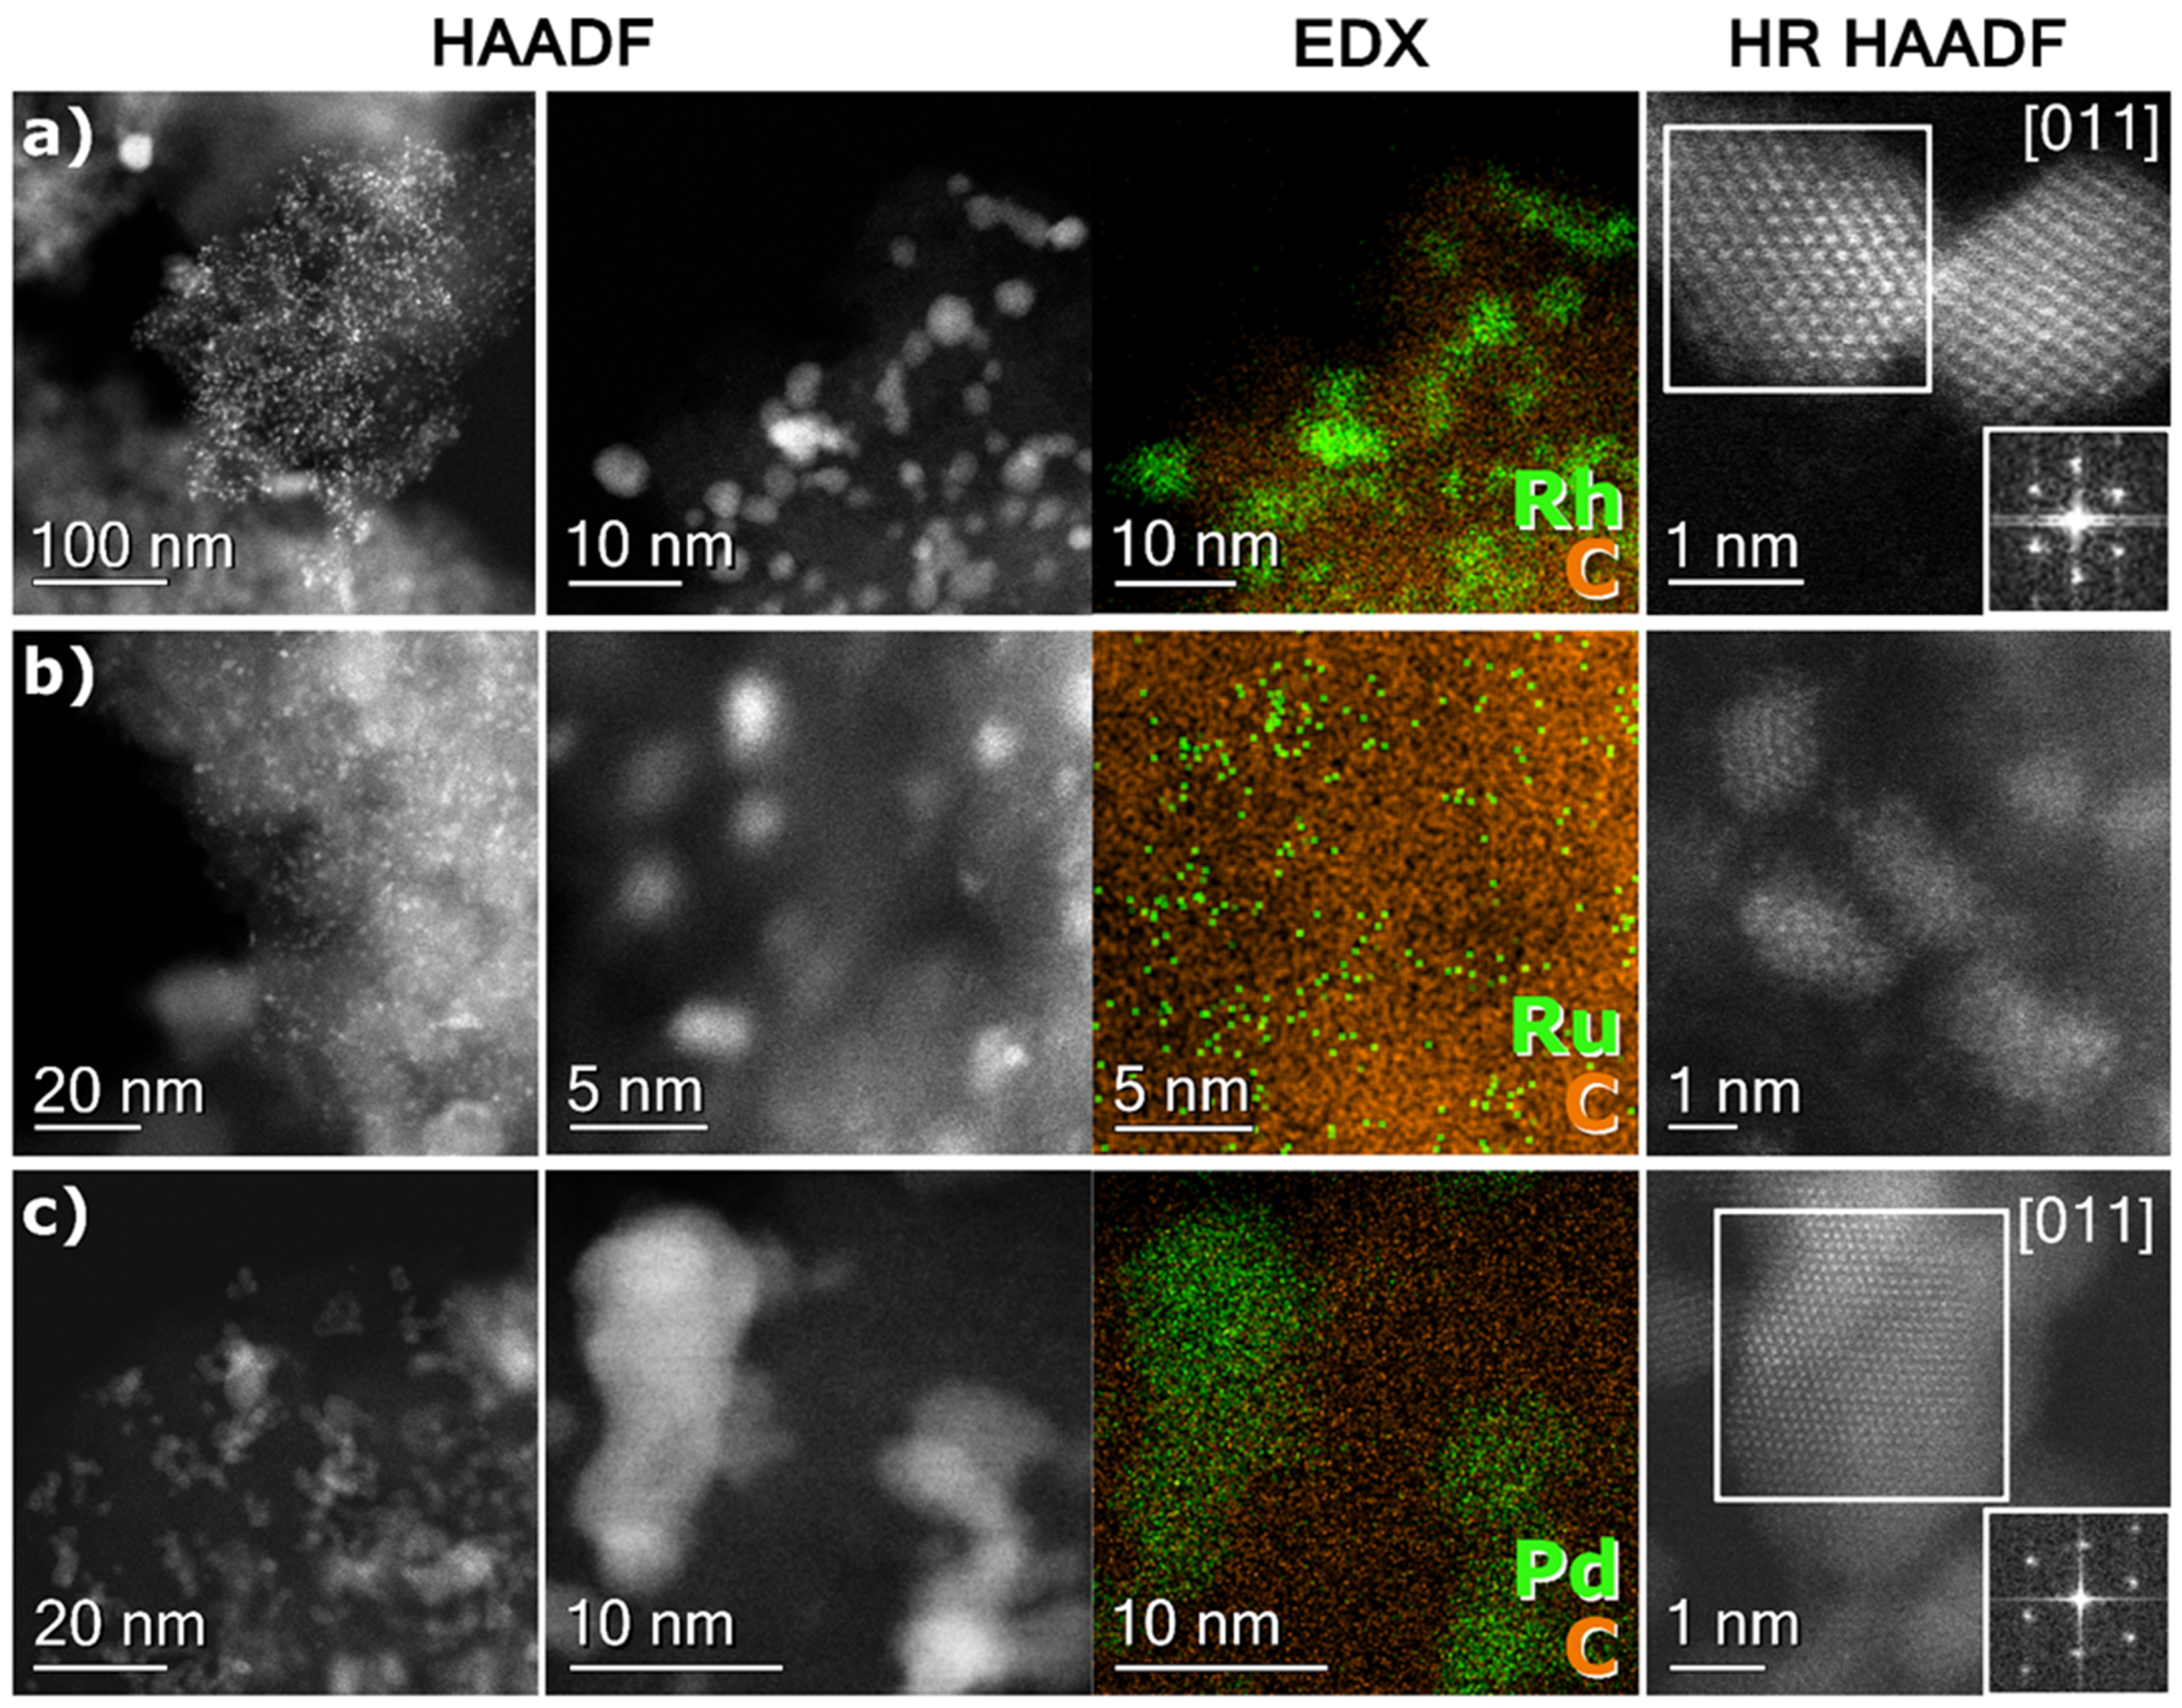
2.3. TEM Results
2.4. H2 Chemisorption Results
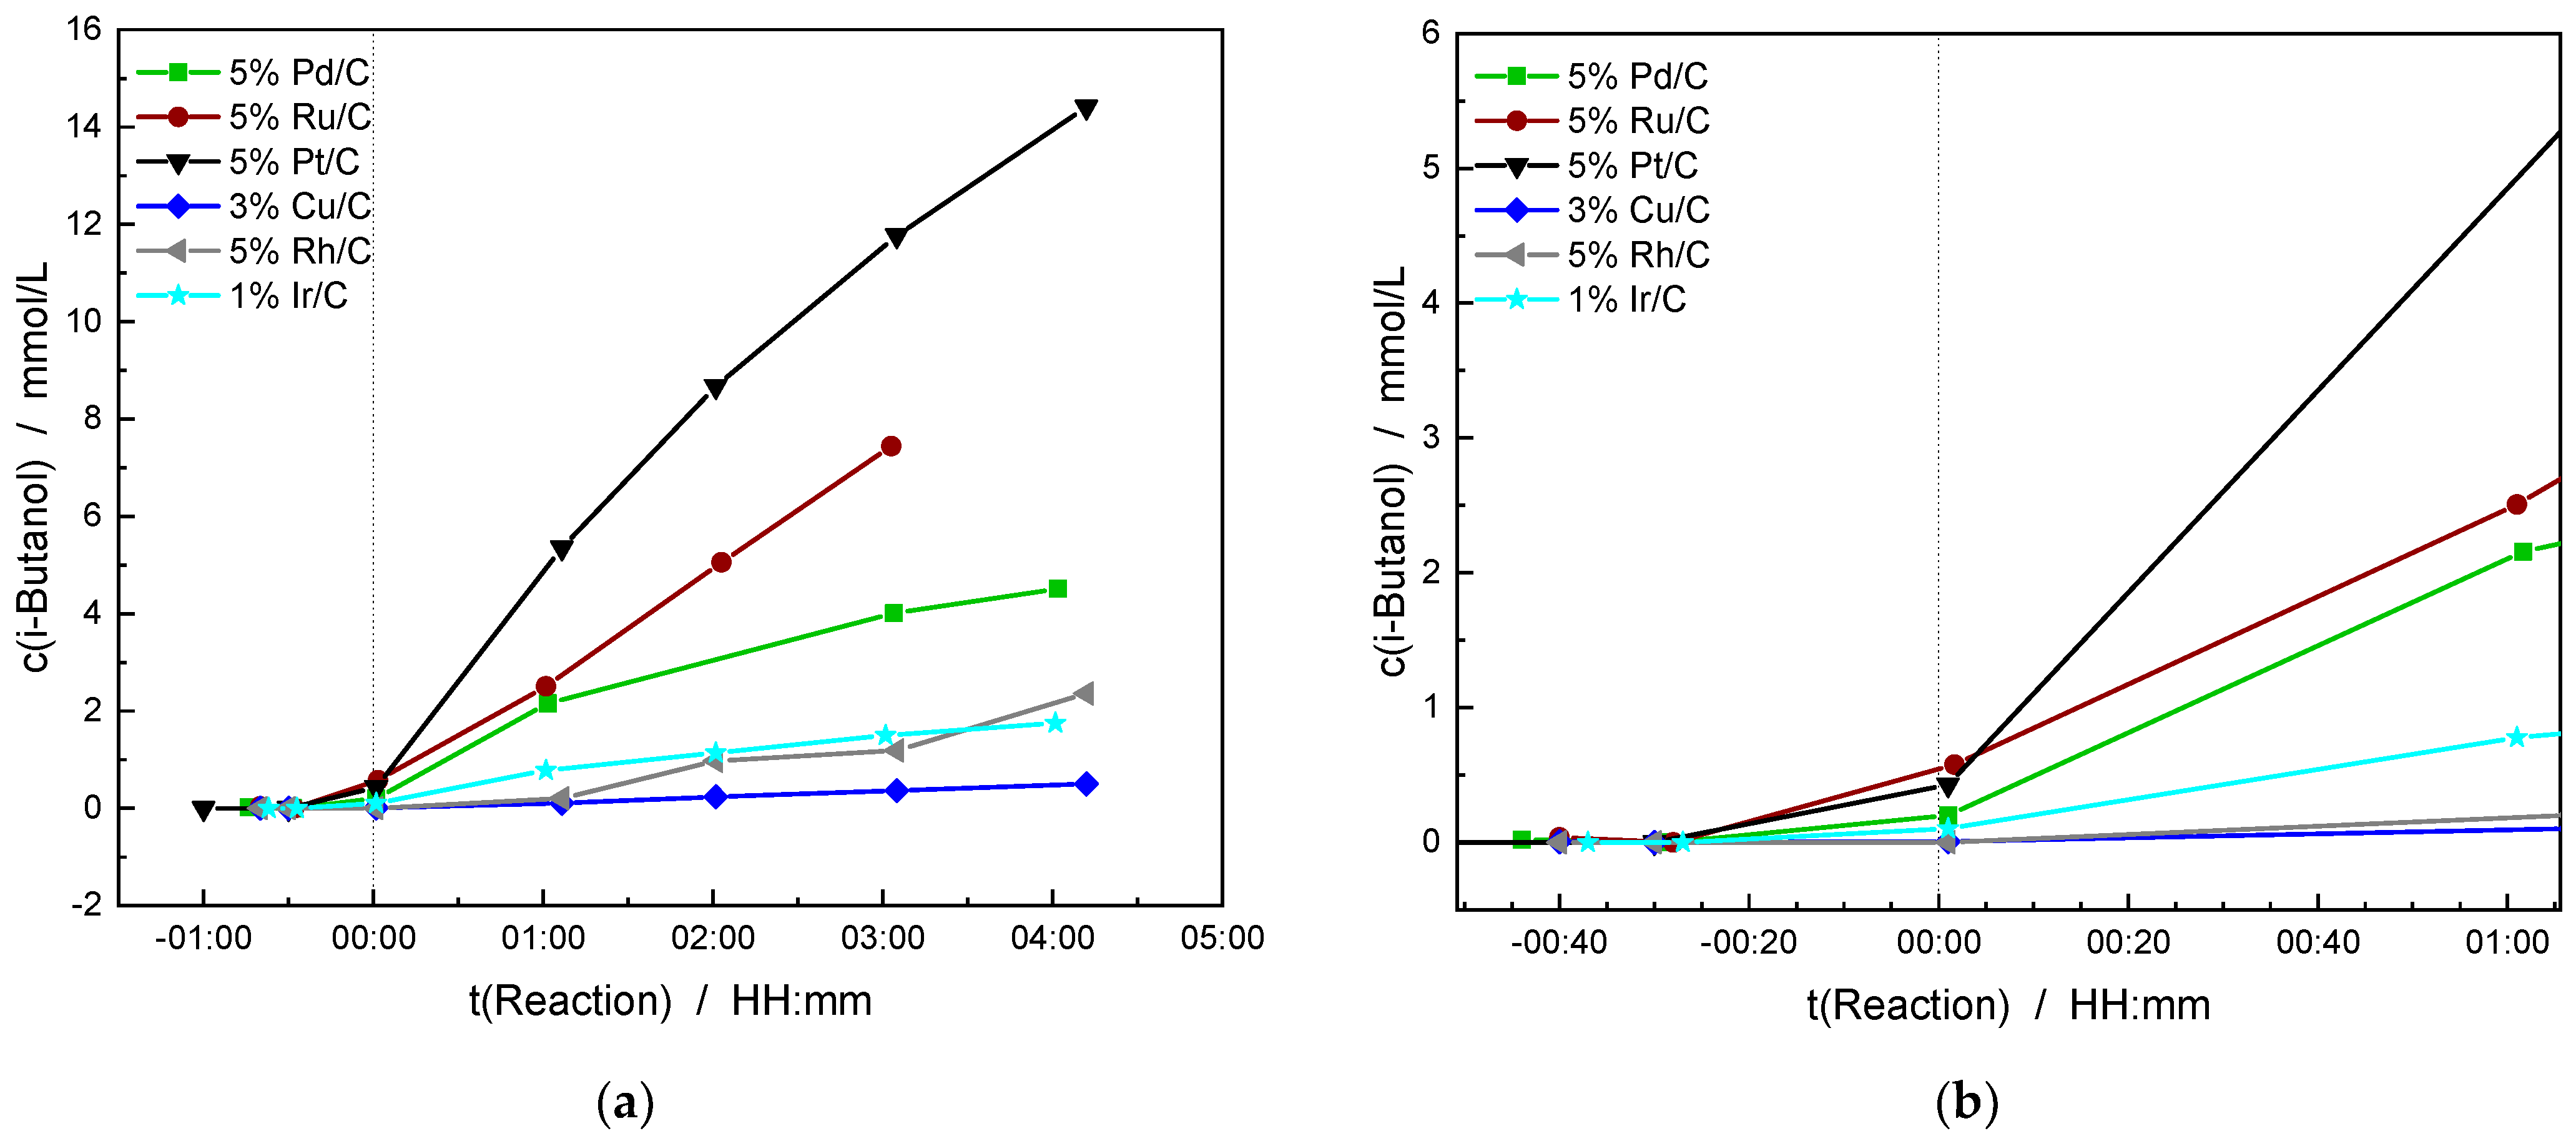
2.5. Catalytic Experiments

| Entry | Catalyst | EDX | ε(d) d | STY | TOF | Yield (Selectivity a) in % | |||
|---|---|---|---|---|---|---|---|---|---|
| wt% | eV | mmolh−1g−1 | h−1 | Acetaldehyde | Propanal | n-Propanol | i-Butanol | ||
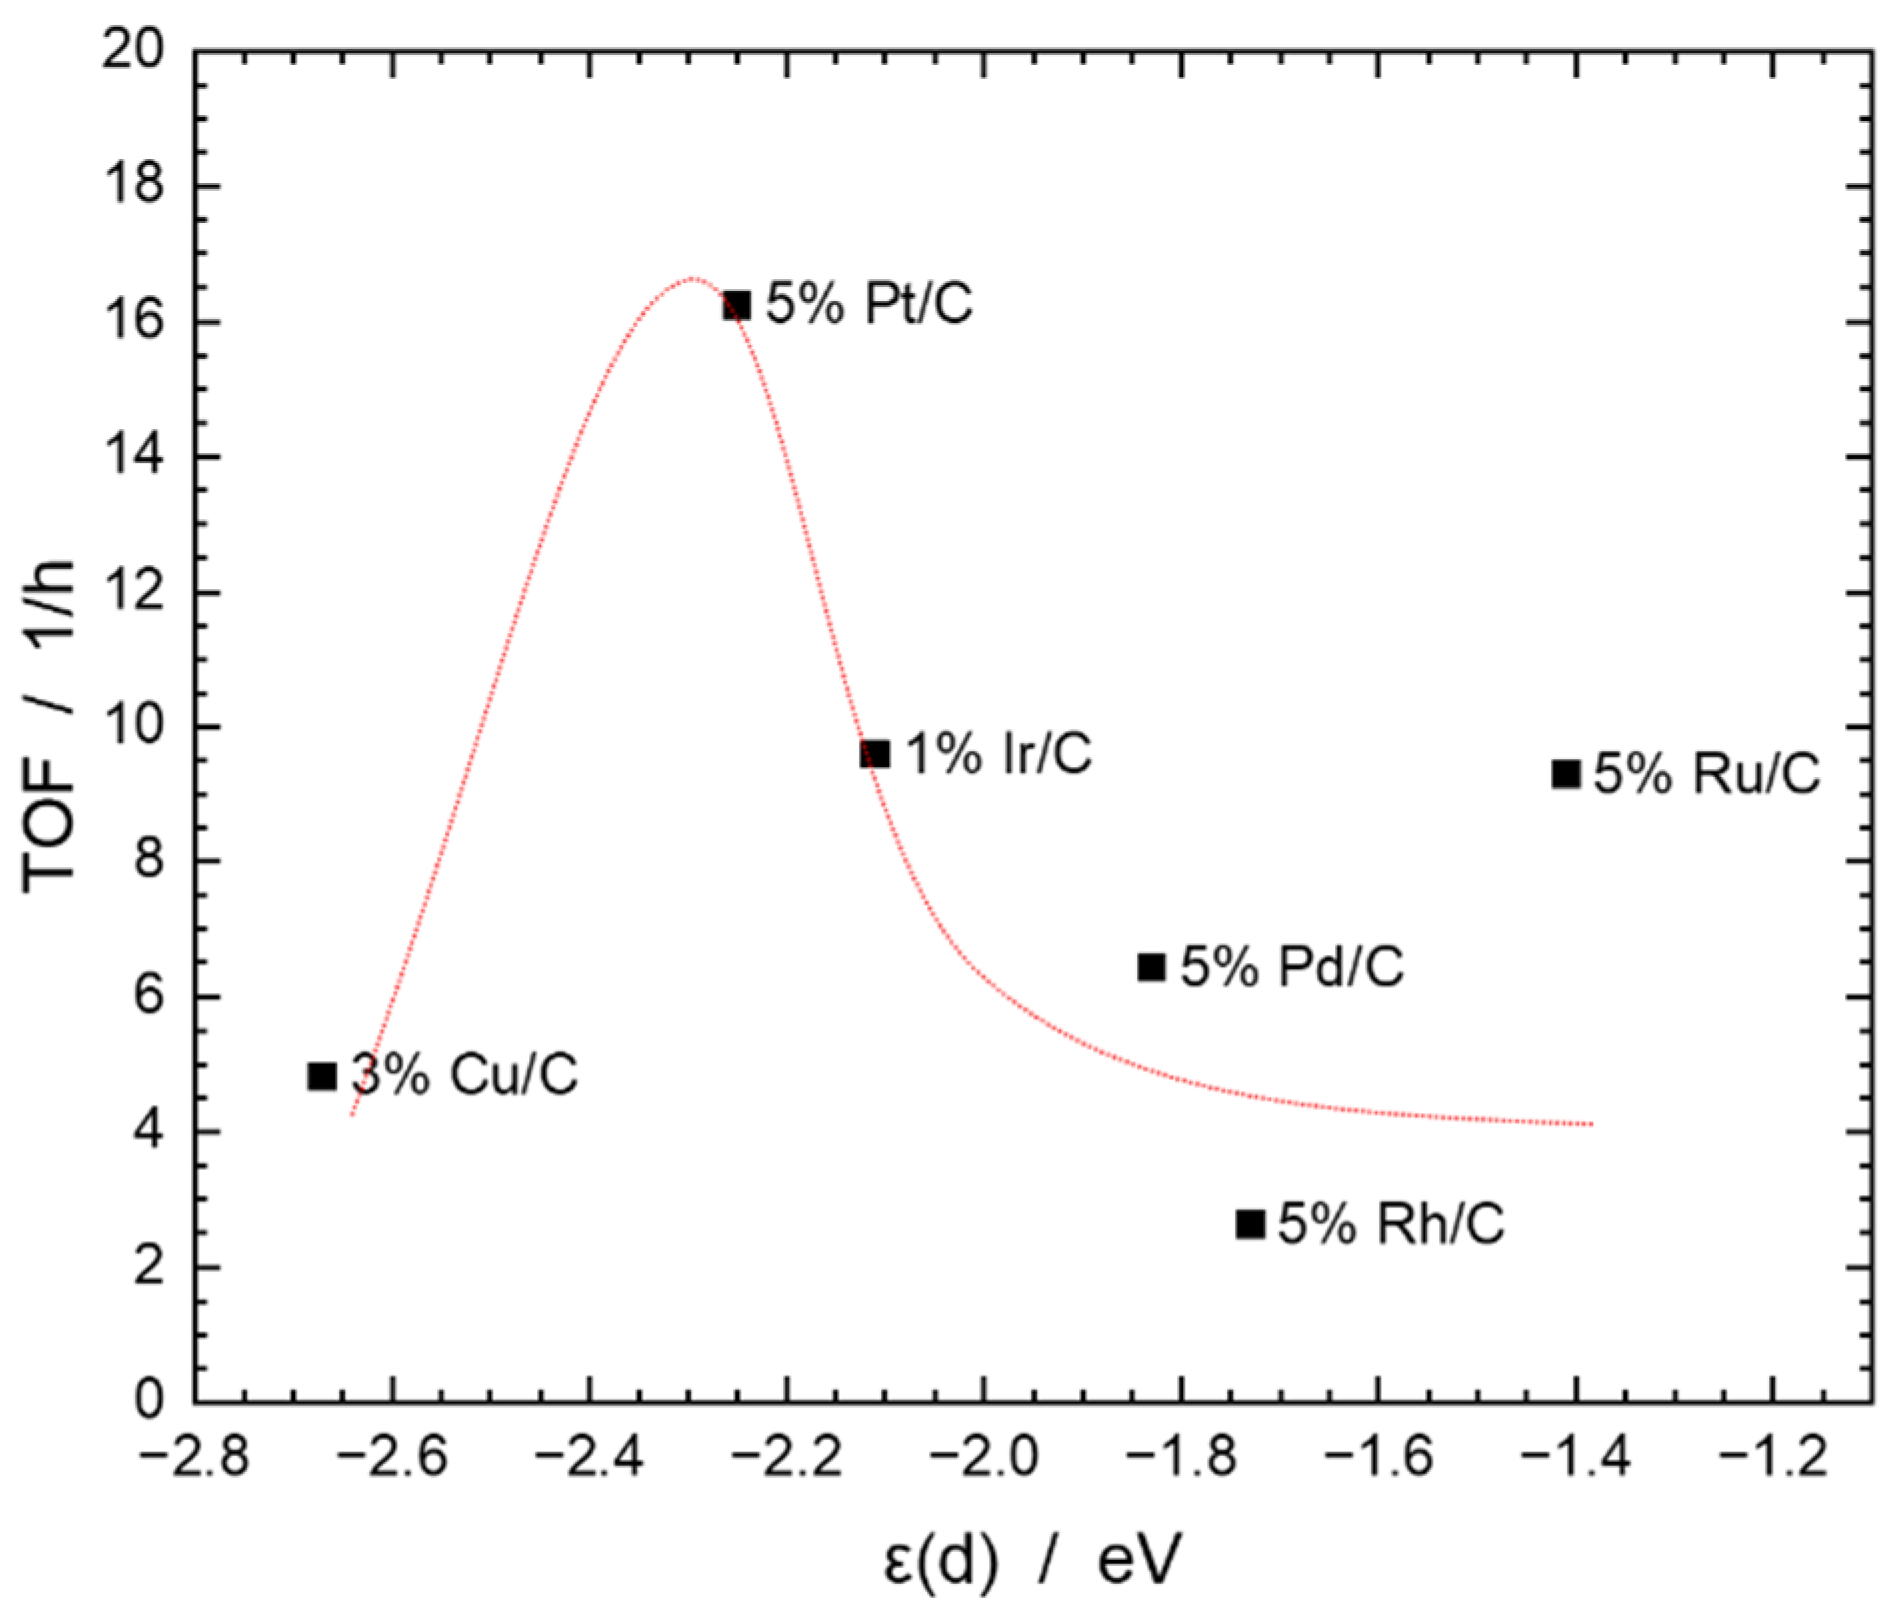
| 1 | 5% Ru/C | 4.45 | −1.41 | 1.47 | 9.29 | – | – | 0.27 (13.36) | 1.77 (86.64) |
| 2 | 5% Rh/C b | 6.05 | −1.73 | 0.04 | 2.62 | – | 0.21 (27.89) | – | 0.69 (60.94) |
| 3 | 5% Pd/C | 4.19 | −1.83 | 0.10 | 6.44 | – | – | 0.31 (28.01) | 0.81 (71.44) |
| 4 | 5% Pt/C | 7.03 | −2.25 | 2.72 | 16.25 | – | – | 0.25 (11.07) | 1.99 (88.93) |
| 5 | 1% Ir/C | 1.29 | −2.11 | 0.34 | 9.58 | 0.03 (8.53) | – | – | 0.27 (91.47) |
| 6 | 1% Ir/C c | 1.29 | −2.11 | 0.14 | 2.10 | 0.04 (22.85) | – | – | 0.15 (77.15) |
| 7 | 3% Cu/C | 1.60 | −2.67 | 0.07 | 4.83 | 0.54 (79.51) | 0.002 (0.25) | 0.01 (1.40) | 0.13 (18.85) |
| 8 | 3% Cu/C c | 1.60 | −2.67 | 0.06 | 3.96 | 0.14 (66.16) | – | – | 0.07 (33.84) |
3. Materials and Methods
3.1. STEM Measurements
3.2. XRD Measurements
3.3. Catalytic Experiments
3.4. Surface Analysis
3.5. ICP-OES Measurements
4. Conclusions
Supplementary Materials
Author Contributions
Funding
Acknowledgments
Conflicts of Interest
References
- Biermann, M.; Gruß, H.; Hummel, W.; Gröger, H.C. Guerbet alcohols: From processes under harsh conditions to synthesis at room temperature under ambient pressure. ChemCatChem 2016, 8, 895–899. [Google Scholar] [CrossRef]
- Gabriëls, D.; Hernández, W.Y.; Sels, B.; van der Voort, P.; Verberckmoes, A. Review of catalytic systems and thermodynamics for the Guerbet condensation reaction and challenges for biomass valorization. Catal. Sci. Technol. 2015, 5, 3876–3902. [Google Scholar] [CrossRef]
- Wu, X.Y.; Fang, G.Q.; Tong, Y.Q.; Jiang, D.H.; Liang, Z.; Leng, W.H.; Liu, L.; Tu, P.X.; Wang, H.J.; Ni, J.; et al. Catalytic Upgrading of Ethanol to n-Butanol: Progress in Catalyst Development. ChemSusChem 2018, 11, 71–85. [Google Scholar] [CrossRef]
- Pang, J.; Zheng, M.; Zhang, T. Synthesis of Ethanol and Its Catalytic Conversion; Elsevier: Amsterdam, The Netherlands, 2019; pp. 89–191. ISBN 9780128170991. [Google Scholar]
- Ueda, W.; Yokoyama, T.; Moro-Oka, Y.; Ikawa, T. Enhancement of Surface Base Property of Magnesium Oxide by the Combination of Metal Ion. Chem. Lett. 1985, 14, 1059–1062. [Google Scholar] [CrossRef]
- Cimino, S.; Lisi, L.; Romanucci, S. Catalysts for conversion of ethanol to butanol: Effect of acid-base and redox properties. Catal. Today 2018, 304, 58–63. [Google Scholar] [CrossRef]
- Ndou, A.; Plint, N.; Coville, N.J. Dimerisation of ethanol to butanol over solid-base catalysts. Appl. Catal. A-Gen. 2003, 251, 337–345. [Google Scholar] [CrossRef]
- Quesada, J.; Faba, L.; Diaz, E.; Ordonez, S. Copper-Basic Sites Synergic Effect on the Ethanol Dehydrogenation and Condensation Reactions. ChemCatChem 2018, 10, 3583–3592. [Google Scholar] [CrossRef]
- Zhang, J.; Shi, K.; An, Z.; Zhu, Y.; Shu, X.; Song, H.; Xiang, X.; He, J. Acid–Base Promoted Dehydrogenation Coupling of Ethanol on Supported Ag Particles. Ind. Eng. Chem. Res. 2020. [Google Scholar] [CrossRef]
- Tsuchida, T.; Kubo, J.; Yoshioka, T.; Sakuma, S.; Takeguchi, T.; Ueda, W. Reaction of ethanol over hydroxyapatite affected by Ca/P ratio of catalyst. J. Catal. 2008, 259, 183–189. [Google Scholar] [CrossRef]
- Ogo, S.; Onda, A.; Yanagisawa, K. Selective synthesis of 1-butanol from ethanol over strontium phosphate hydroxyapatite catalysts. Appl. Catal. A Gen. 2011, 402, 188–195. [Google Scholar] [CrossRef]
- Riittonen, T.; Salmi, T.; Mikkola, J.P.; Wärnå, J. Direct Synthesis of 1-Butanol from Ethanol in a Plug Flow Reactor: Reactor and Reaction Kinetics Modeling. Top. Catal. 2014, 57, 1425–1429. [Google Scholar] [CrossRef]
- Marcu, I.-C.; Tichit, D.; Fajula, F.; Tanchoux, N. Catalytic valorization of bioethanol over Cu-Mg-Al mixed oxide catalysts. Catal. Today 2009, 147, 231–238. [Google Scholar] [CrossRef]
- Wu, X.Y.; Fang, G.Q.; Liang, Z.; Leng, W.H.; Xu, K.Y.; Jiang, D.H.; Ni, J.; Li, X.N. Catalytic upgrading of ethanol to n-butanol over M-CeO2/AC (M = Cu, Fe, Co, Ni and Pd) catalysts. Catal. Commun. 2017, 100, 15–18. [Google Scholar] [CrossRef]
- Furukawa, S.; Ehara, K.; Ozawa, K.; Komatsu, T. A study on the hydrogen activation properties of Ni-based intermetallics: A relationship between reactivity and the electronic state. Phys. Chem. Chem. Phys. 2014, 16, 19828–19831. [Google Scholar] [CrossRef] [PubMed]
- Gorzkowski, M.T.; Lewera, A. Probing the Limits of d-Band Center Theory: Electronic and Electrocatalytic Properties of Pd-Shell–Pt-Core Nanoparticles. J. Phys. Chem. C 2015, 119, 18389–18395. [Google Scholar] [CrossRef]
- Abe, H.; Yoshikawa, H.; Umezawa, N.; Xu, Y.; Saravanan, G.; Ramesh, G.V.; Tanabe, T.; Kodiyath, R.; Ueda, S.; Sekido, N.; et al. Correlation between the surface electronic structure and CO-oxidation activity of Pt alloys. Phys. Chem. Chem. Phys. 2015, 17, 4879–4887. [Google Scholar] [CrossRef]
- Nilsson, A.; Pettersson, L.G.M.; Hammer, B.; Bligaard, T.; Christensen, C.H.; Nrskov, J.K. The electronic structure effect in heterogeneous catalysis. Catal Lett 2005, 100, 111–114. [Google Scholar] [CrossRef]
- Hammer, B.; Norskov, J.K. Why gold is the noblest of all the metals. Nature 1995, 376, 238–240. [Google Scholar] [CrossRef]
- Pettersson, L.G.M.; Nilsson, A. A Molecular Perspective on the d-Band Model: Synergy Between Experiment and Theory. Top. Catal. 2014, 57, 2–13. [Google Scholar] [CrossRef]
- Abild-Pedersen, F.; Nilsson, A.; Nørskov, J.K. Comment on “Using Photoelectron Spectroscopy and Quantum Mechanics to Determine d-Band Energies of Metals for Catalytic Applications”. J. Phys. Chem. C 2013, 117, 6914–6915. [Google Scholar] [CrossRef]
- Hofmann, T.; Yu, T.H.; Folse, M.; Weinhardt, L.; Bär, M.; Zhang, Y.; Merinov, B.V.; Myers, D.J.; Goddard, W.A.; Heske, C. Using Photoelectron Spectroscopy and Quantum Mechanics to Determine d-Band Energies of Metals for Catalytic Applications. J. Phys. Chem. C 2012, 116, 24016–24026. [Google Scholar] [CrossRef]
- Lu, C.; Lee, I.C.; Masel, R.I.; Wieckowski, A.; Rice, C. Correlations between the Heat of Adsorption and the Position of the Center of the D-Band: Differences between Computation and Experiment. J. Phys. Chem. A 2002, 106, 3084–3091. [Google Scholar] [CrossRef]
- Siddiki, S.M.A.H.; Touchy, A.S.; Jamil, M.A.R.; Toyao, T.; Shimizu, K. C-Methylation of Alcohols, Ketones, and Indoles with Methanol Using Heterogeneous Platinum Catalysts. ACS Catal. 2018, 8, 3091–3103. [Google Scholar] [CrossRef]
- Wouters, C.; Lehrheuer, B.; Heuser, B.; Pischinger, S. Ottomischkraftstoffe mit Methanol, Ethanol und Butanol. MTZ Mot. Z 2020, 81, 16–23. [Google Scholar] [CrossRef]
- Schemme, S.; Breuer, J.L.; Samsun, R.C.; Peters, R.; Stolten, D. Promising catalytic synthesis pathways towards higher alcohols as suitable transport fuels based on H2 and CO2. J. CO2 Util. 2018, 27, 223–237. [Google Scholar] [CrossRef]
- Singh, P.; Hui, X.; Sung, C.-J. Soot formation in non-premixed counterflow flames of butane and butanol isomers. Combust. Flame 2016, 164, 167–182. [Google Scholar] [CrossRef]
- Hui, X.; Niemeyer, K.E.; Brady, K.B.; Sung, C.-J. Reduced Chemistry for Butanol Isomers at Engine-Relevant Conditions. Energy Fuels 2017, 31, 867–881. [Google Scholar] [CrossRef]
- Brunauer, S.; Emmett, P.H.; Teller, E. Adsorption of Gases in Multimolecular Layers. J. Am. Chem. Soc. 1938, 60, 309–319. [Google Scholar] [CrossRef]
- Neimark, A.V.; Sing, K.S.W.; Thommes, M. Surface Area and Porosity. In Handbook of Heterogeneous Catalysis, 2nd ed.; Wiley-VCH: Weinheim, Chichester, 2008; ISBN 3527312412. [Google Scholar]
- Edington, J.W. Electron Diffraction in the Electron Microscope. In Electron Diffraction in the Electron Microscope; Edington, J.W., Ed.; Macmillan Education: London, UK, 1975; pp. 1–77. ISBN 978-0-333-18292-5. [Google Scholar]
- Pasel, J.; Häusler, J.; Schmitt, D.; Valencia, H.; Meledina, M.; Mayer, J.; Peters, R. Ethanol Dehydrogenation: A Reaction Path Study by Means of Temporal Analysis of Products. Catalysts 2020, 10, 1151. [Google Scholar] [CrossRef]
- Almithn, A.S.; Hibbitts, D.D. Supra-monolayer coverages on small metal clusters and their effects on H 2 chemisorption particle size estimates. AIChE J. 2018, 64, 3109–3120. [Google Scholar] [CrossRef]
- Héroguel, F.; Gebert, D.; Detwiler, M.D.; Zemlyanov, D.Y.; Baudouin, D.; Copéret, C. Dense and narrowly distributed silica-supported rhodium and iridium nanoparticles: Preparation via surface organometallic chemistry and chemisorption stoichiometry. J. Catal. 2014, 316, 260–269. [Google Scholar] [CrossRef]
- Miller, J.T.; Meyers, B.L.; Modica, F.S.; Lane, G.S.; Vaarkamp, M.; Koningsberger, D.C. Hydrogen Temperature-Programmed Desorption (H2 TPD) of Supported Platinum Catalysts. J. Catal. 1993, 143, 395–408. [Google Scholar] [CrossRef]
- Behm, R.J.; Penka, V.; Cattania, M.-G.; Christmann, K.; Ertl, G. Evidence for ‘‘subsurface’’ hydrogen on Pd(110): An intermediate between chemisorbed and dissolved species. J. Chem. Phys. 1983, 78, 7486–7490. [Google Scholar] [CrossRef]
- Montemore, M.M.; van Spronsen, M.A.; Madix, R.J.; Friend, C.M. O2 Activation by Metal Surfaces: Implications for Bonding and Reactivity on Heterogeneous Catalysts. Chem. Rev. 2018, 118, 2816–2862. [Google Scholar] [CrossRef]
- Gervasini, A.; Bennici, S. Dispersion and surface states of copper catalysts by temperature-programmed-reduction of oxidized surfaces (s-TPR). Appl. Catal. A-Gen. 2005, 281, 199–205. [Google Scholar] [CrossRef]
- Garbarino, G.; Riani, P.; Villa García, M.; Finocchio, E.; Sanchez Escribano, V.; Busca, G. A study of ethanol dehydrogenation to acetaldehyde over copper/zinc aluminate catalysts. Catal. Today 2020, 354, 167–175. [Google Scholar] [CrossRef]
- Ponomareva, E.A. Copper Catalysts based on carbon-carbon fiburous materials for ethanol dehydrogenation. Russ. J. Appl. Chem. 2016, 89, 598–602. [Google Scholar] [CrossRef]
- Ponomareva, E.A. Dehydrogenation of ethanol over carbon-supported Cu-Co catalysts modified by catalytic chemical vapor deposition. React. Kinet. Mech. Catal. 2017, 122, 399–408. [Google Scholar] [CrossRef]
- Wang, Q.-N.; Shi, L.; Li, W.; Li, W.-C.; Si, R.; Schüth, F.; Lu, A.-H. Cu supported on thin carbon layer-coated porous SiO 2 for efficient ethanol dehydrogenation. Catal. Sci. Technol. 2018, 8, 472–479. [Google Scholar] [CrossRef]
- Zhang, P.; Wang, Q.-N.; Yang, X.; Wang, D.; Li, W.-C.; Zheng, Y.; Chen, M.; Lu, A.-H. A Highly Porous Carbon Support Rich in Graphitic-N Stabilizes Copper Nanocatalysts for Efficient Ethanol Dehydrogenation. ChemCatChem 2017, 9, 505–510. [Google Scholar] [CrossRef]
- Li, M.-Y.; Lu, W.-D.; He, L.; Schüth, F.; Lu, A.-H. Tailoring the Surface Structure of Silicon Carbide Support for Copper Catalyzed Ethanol Dehydrogenation. ChemCatChem 2019, 11, 481–487. [Google Scholar] [CrossRef]
- Hammer, B.; Nørskov, J.K. Theoretical surface science and catalysis—calculations and concepts. In Impact of Surface Science on Catalysis; Gates, B.C., Ed.; Academic Press: San Diego, CA, USA, 2000; pp. 71–129. ISBN 9780120078455. [Google Scholar]
- Li, M.; Borsay, A.; Dakhchoune, M.; Zhao, K.; Luo, W.; Züttel, A. Thermal stability of size-selected copper nanoparticles: Effect of size, support and CO2 hydrogenation atmosphere. Appl. Surf. Sci. 2020, 510, 145439. [Google Scholar] [CrossRef]
- Bowker, M.; Madix, R.J. XPS, UPS and thermal desorption studies of alcohol adsorption on Cu(110). Surf. Sci. 1982, 116, 549–572. [Google Scholar] [CrossRef]
- WACHS, I. The selective oxidation of CH3OH to H2CO on a copper(110) catalyst. J. Catal. 1978, 53, 208–227. [Google Scholar] [CrossRef]
- Shan, J.; Lucci, F.R.; Liu, J.; El-Soda, M.; Marcinkowski, M.D.; Allard, L.F.; Sykes, E.C.H.; Flytzani-Stephanopoulos, M. Water co-catalyzed selective dehydrogenation of methanol to formaldehyde and hydrogen. Surf. Sci. 2016, 650, 121–129. [Google Scholar] [CrossRef]
- Boucher, M.B.; Marcinkowski, M.D.; Liriano, M.L.; Murphy, C.J.; Lewis, E.A.; Jewell, A.D.; Mattera, M.F.G.; Kyriakou, G.; Flytzani-Stephanopoulos, M.; Sykes, E.C.H. Molecular-scale perspective of water-catalyzed methanol dehydrogenation to formaldehyde. ACS Nano 2013, 7, 6181–6187. [Google Scholar] [CrossRef]
- Wanke, S.E.; Flynn, P.C. The Sintering of Supported Metal Catalysts. Catal. Rev. 1975, 12, 93–135. [Google Scholar] [CrossRef]
- Gao, P.; Wang, A.; Wang, X.; Zhang, T. Synthesis of Highly Ordered Ir-Containing Mesoporous Carbon Materials by Organic–Organic Self-Assembly. Chem. Mater. 2008, 20, 1881–1888. [Google Scholar] [CrossRef]
- Liu, Q.; Xu, G.Q.; Wang, Z.D.; Liu, X.R.; Wang, X.C.; Dong, L.L.; Mu, X.D.; Liu, H.Z. Iridium Clusters Encapsulated in Carbon Nanospheres as Nanocatalysts for Methylation of (Bio)Alcohols. ChemSusChem 2017, 10, 4748–4755. [Google Scholar] [CrossRef] [PubMed]
- Hoffmann, R. Solids and Surfaces: A Chemist’s View of Bonding in Extended Structures; Print on demand der Ausg, 1988; Wiley-VCH: New York, NY, USA, 2002; ISBN 0471187100. [Google Scholar]
- Kovács, A.; Schierholz, R.; Tillmann, K. FEI Titan G2 80-200 CREWLEY. JLSRF 2016, 2. [Google Scholar] [CrossRef]


| Catalyst | BET | Total Pore Volume | Pore Radius |
|---|---|---|---|
| m2/g | mL/g | Å | |
| 5% Pd/C | 980.06 | 0.68 | 18.13 |
| 5% Pt/C | 805.10 | 0.59 | 16.99 |
| 5% Ru/C | 6.61 | 0.01 | 18.11 |
| 1% Ir/C | 1013.17 | 0.72 | 19.36 |
| 5% Rh/C | 803.22 | 0.56 | 19.28 |
| 3% Cu/C | 1270.90 | 1.01 | 19.31 |
| Catalyst i | EDX (wt%) | - | - | - | - | - | - |
|---|---|---|---|---|---|---|---|
| C | O | Metal i | Ca | Si | Al | P | |
| Pd/C | 89.85 ± 0.47 | 6.24 ± 0.13 | 4.19 ± 0.36 | - | - | - | - |
| Pt/C | 83.93 ± 0.24 | 7.95 ± 0.23 | 7.03 ± 0.08 | 1.10 ± 0.03 | - | - | - |
| Ru/C | 86.80 ± 0.32 | 8.20 ± 0.32 | 4.45 ± 0.17 | - | 0.55 ± 0.09 | - | - |
| Ir/C | 92.37 ± 0.12 | 5.72 ± 0.19 | 1.29 ± 0.08 | - | 0.62 ± 0.01 | - | - |
| Rh/C | 87.93 ± 0.39 | 5.46 ± 0.19 | 6.05 ± 0.20 | - | 0.38 ± 0.01 | 0.19 ± 0.01 | - |
| Cu/C | 86.40 ± 0.33 | 11.49 ± 0.11 | 1.6 ± 0.21 | - | - | - | 0.52 ± 0.04 |
| Specific Ametal | D | dchemisorption | dTEM | ||
|---|---|---|---|---|---|
| m2/gSample | m2/gmetal | % | nm | nm | |
| Pt/C | 8.97 | 127.5 | 46 | 2.2 | 2.3 |
| Ru/C | 8.58 | 192.8 | 36 | 2.5 | 2.1 |
| Rh/C | 6.54 | 108.2 | 24 | 4.5 | 2.6 |
| Ir/C | 2.59 | 200.7 | 53 | 1.3 | 2.3 |
| Pd/C | 7.07 | 168.7 | 38 | 3.0 | 3.2 |
| Cu/C | 0.63 | 39.2 | 6 | 17.1 | 6.1 |
Publisher’s Note: MDPI stays neutral with regard to jurisdictional claims in published maps and institutional affiliations. |
© 2021 by the authors. Licensee MDPI, Basel, Switzerland. This article is an open access article distributed under the terms and conditions of the Creative Commons Attribution (CC BY) license (http://creativecommons.org/licenses/by/4.0/).
Share and Cite
Häusler, J.; Pasel, J.; Woltmann, F.; Everwand, A.; Meledina, M.; Valencia, H.; Lipińska-Chwałek, M.; Mayer, J.; Peters, R. Elucidating the Influence of the d-Band Center on the Synthesis of Isobutanol. Catalysts 2021, 11, 406. https://doi.org/10.3390/catal11030406
Häusler J, Pasel J, Woltmann F, Everwand A, Meledina M, Valencia H, Lipińska-Chwałek M, Mayer J, Peters R. Elucidating the Influence of the d-Band Center on the Synthesis of Isobutanol. Catalysts. 2021; 11(3):406. https://doi.org/10.3390/catal11030406
Chicago/Turabian StyleHäusler, Johannes, Joachim Pasel, Friederike Woltmann, Andreas Everwand, Maria Meledina, Helen Valencia, Marta Lipińska-Chwałek, Joachim Mayer, and Ralf Peters. 2021. "Elucidating the Influence of the d-Band Center on the Synthesis of Isobutanol" Catalysts 11, no. 3: 406. https://doi.org/10.3390/catal11030406
APA StyleHäusler, J., Pasel, J., Woltmann, F., Everwand, A., Meledina, M., Valencia, H., Lipińska-Chwałek, M., Mayer, J., & Peters, R. (2021). Elucidating the Influence of the d-Band Center on the Synthesis of Isobutanol. Catalysts, 11(3), 406. https://doi.org/10.3390/catal11030406