1. Introduction
The world consumption of fossil fuel has increased dramatically because of the fast expansion of industrialization and population [
1]. However, the main energy sources of industrial applications still come from fossil fuel. The large-scale consumption of fossil fuel results in the production of industrial wastes, such as carbon dioxide, SO
x or NO
x, which result in the global warming effect, acid rain or the increase in the concentration of particulates in air. To decrease the consumption of fossil fuel, the development and application of renewable energy such as solar, wind, hydropower or geothermal heat have been widely discussed in the academia or the industry [
2]. Although the applications of renewable energy are good ways to decrease the consumption of fossil fuel, the variations of renewable energy are the major problem for further applications. Developments of various energy storage systems to store renewable energy are thus necessary. The possible energy storage systems such as Zn–air batteries, Li-based chargeable batteries or supercapacitors have been developed for several decades in order to balance the variations of these renewable energies, but the limitation of these storage capacities is a major obstacle for further application [
3,
4,
5,
6]. In contrast, hydrogen energy, which is considered as a clean and high energy density carrier, is a good way to store renewable energy. Converting solar energy into hydrogen gas is a possible way to solve the global energy requirement. Major technologies based on photo-conversion for hydrogen production are photoelectrochemical (PEC) water splitting, photocatalytic reactions or photovoltaic–electrocatalyst tandem cell water splitting [
7]. Hydrogen production using the photoelectrochemical reaction is a simple way to obtain hydrogen gas at a certain photoelectrode [
8]. However, the photo-driven hydrogen production efficiency for the PEC reactions is still low and far away from the target of industrial application [
7,
9]. A major obstacle for low photo-driven hydrogen production is the low light absorption, low carrier mobility and high recombination rate of photo-excited electron-hole pairs for these semiconductors. Li and Wu (2015) [
9] reviewed and discussed the advantages and weaknesses of these semiconductors. Metal oxides show good stabilities in electrolytes but poor efficiencies for PEC reactions. Metal sulfides are visible-light active semiconductors with good PEC performances. However, their poor stabilities in aqueous solutions limit their further industrial applications. Recently, the interesting ternary I–IV–VI semiconductors and their solid solutions with various II–VI semiconductors have been reported as photoelectrodes used for energy applications under light irradiation [
10,
11,
12,
13,
14,
15,
16,
17,
18,
19,
20]. However, most reports using I–IV–VI and their solid solution semiconductors have focused on their characterization and application in the photovoltaic-related fields [
17,
18,
19,
20]. The reports about the Ag-based I–IV–VI and their solid solutions with II–VI semiconductors are also fewer in number than those for Cu-based semiconductors. For hydrogen productions using Ag-based I–II–IV–VI photoelectrodes, Cheng et al. (2018) [
10] observed the influence of Zn contents in samples on the PEC performances of pure Ag
2ZnSnS
4 photoelectrodes in a salt-water solution. A pure Ag
2ZnSnS
4 photoelectrode showed a poor PEC performance of 0.19 mA/cm
2 at 1.23 V vs. a RHE (reversible hydrogen electrode) in the 0.5 M NaCl aqueous solution. The major reason for the low PEC performance is due to its low carrier concentration. Increasing the Ag content in the Ag
2ZnSnS
4 photoelectrode resulted in a high carrier concentration and therefore improved its PEC performance. The ratio of [Ag]/[Zn + Sn] at 0.8 and the ratio of [Zn]/[Sn] set at 0.90 in the Ag
2ZnSnS
4 sample had the highest PEC performance of 0.31 mA/cm
2 with the potential set at 1.23 V, versus the relative hydrogen electrode applied on the sample. Almessiere et al. (2015) electrodeposited the Ag–Sn–S thin films on indium–tin–oxide conductive glass substrates. The best PEC performance of their photoelectrode in 0.5 M Na
2SO
4 was 0.15 mA/cm
2 at 0 V vs. Ag/AgCl. Li et al. (2013) [
13] also prepared the stannite-type multicomponent metal sulfide (Ag
2ZnSnS
4) nanoparticles using the solvothermal treatment combined with a post-annealing process. The hydrogen production of 10 μmol/h using these stannite Ag
2ZnSnS
4 nanoparticles was observed in the aqueous solution containing SO
32- and S
2- ions under light irradiation. With the loading of 1% Pt nanoparticles on the surface of these stannite Ag
2ZnSnS
4 nanoparticles, the maximum H
2 production of 580 μmol/h was observed due to the fast separation of photo-excited electron-hole pairs. Our group also prepared the Ag
8SnS
6 photoelectrodes using a simple chemical bath deposition [
21]. By adjusting the [Ag]/[Ag + Sn] molar ratio in the reaction bath, pure Ag
8SnS
6 photoelectrode could be obtained with the [Ag]/[Ag + Sn] molar ratio of 0.5–0.6 in reaction the solution. The best PEC performance of the Ag
8SnS
6 photoelectrode was 0.71 mA/cm
2 in the aqueous solution containing SO
32− and S
2− ions under light irradiation. Although the Ag–Sn–S and stannite Ag
2ZnSnS
4 photoelectrodes showed the possibilities for PEC hydrogen production, their poor PEC performances in the aqueous solutions under light irradiation indicate that the Ag-based I–IV–VI and their solid solutions have to be further developed in order to approach the target of industrial application [
7,
9]. According to the phase diagram of the Ag
2SnS
3–ZnS system proposed by Nagaoka et al. (2021) [
22], ternary Ag–Sn–S (ex. Ag
8SnS
6) is easily formed during the preparation of the Ag
2ZnSnS
4 sample. A pure Ag
2ZnSnS
4 sample with only the stoichiometric ratio of silver, zinc, tin and sulfur powders set in the sample and long heat treatment (~30–40 h) can be obtained. The reports on the phase change with the incorporation of Zn ions into the pure Ag
8SnS
6 samples and its influence on their PEC performances are still not enough for further industrial applications. In the present study, the incorporation of Zn ions in a solution bath for the growth of Ag–Zn–Sn–S semiconductor thin films was prepared on glass and indium–tin–oxide (ITO) coated glass substrates using a chemical bath deposition (CBD). The influence of Zn ions incorporated into the samples on their phases, morphologies, optical properties and PEC responses in the electrolytes was measured.
2. Resuts and Discussion
In this study, we incorporated the Zn ions into the solution bath for the growth of Ag–Zn–Sn–S multicomponent metal sulfides for solar-driven hydrogen production. The concentrations of Zn ions in the precursor solutions were changed in order to investigate their influences on the crystal phases, surface morphologies, optical properties and their PEC performances in electrolytes. The ratios of [Zn]/[Sn] in the precursor solutions were set at 0.1, 0.15, 0.2, 0.25, 0.3, and 0.35, and named as sample A–F, respectively. In an aqueous reaction bath, thioacetamide undergoes the following reaction [
21]:
The following reactions then take place:
Because of the low solubility of metal sulfide, most metal sulfides are formed as powders suspended in the solution instead of films grown on the surface of substrates. To minimize this process, the chelating agents were used to form complexes with these metal ions. It allowed us to control the release rates of Ag
+, Zn
2+, and Sn
2+ ions during the reactions taking place on the surface of the substrate. With the addition of ethylenediaminetetraacetic acid disodium salt (EDTA) and trisodium citrate, cations of Ag
+, Zn
2+ and Sn
2+ in the solution can form complexes. Then, these metal ion complexes and the sulfide ions migrate to the substrate surface, where the heterogeneous reaction takes place to form binary Ag
2S, ZnS and SnS
2 films. The oxygen dissolved in the solution bath is the oxidation agent for converting Sn(II) ions to Sn(IV) ions [
21]:
After thermal treatments of the samples, the following reaction takes place:
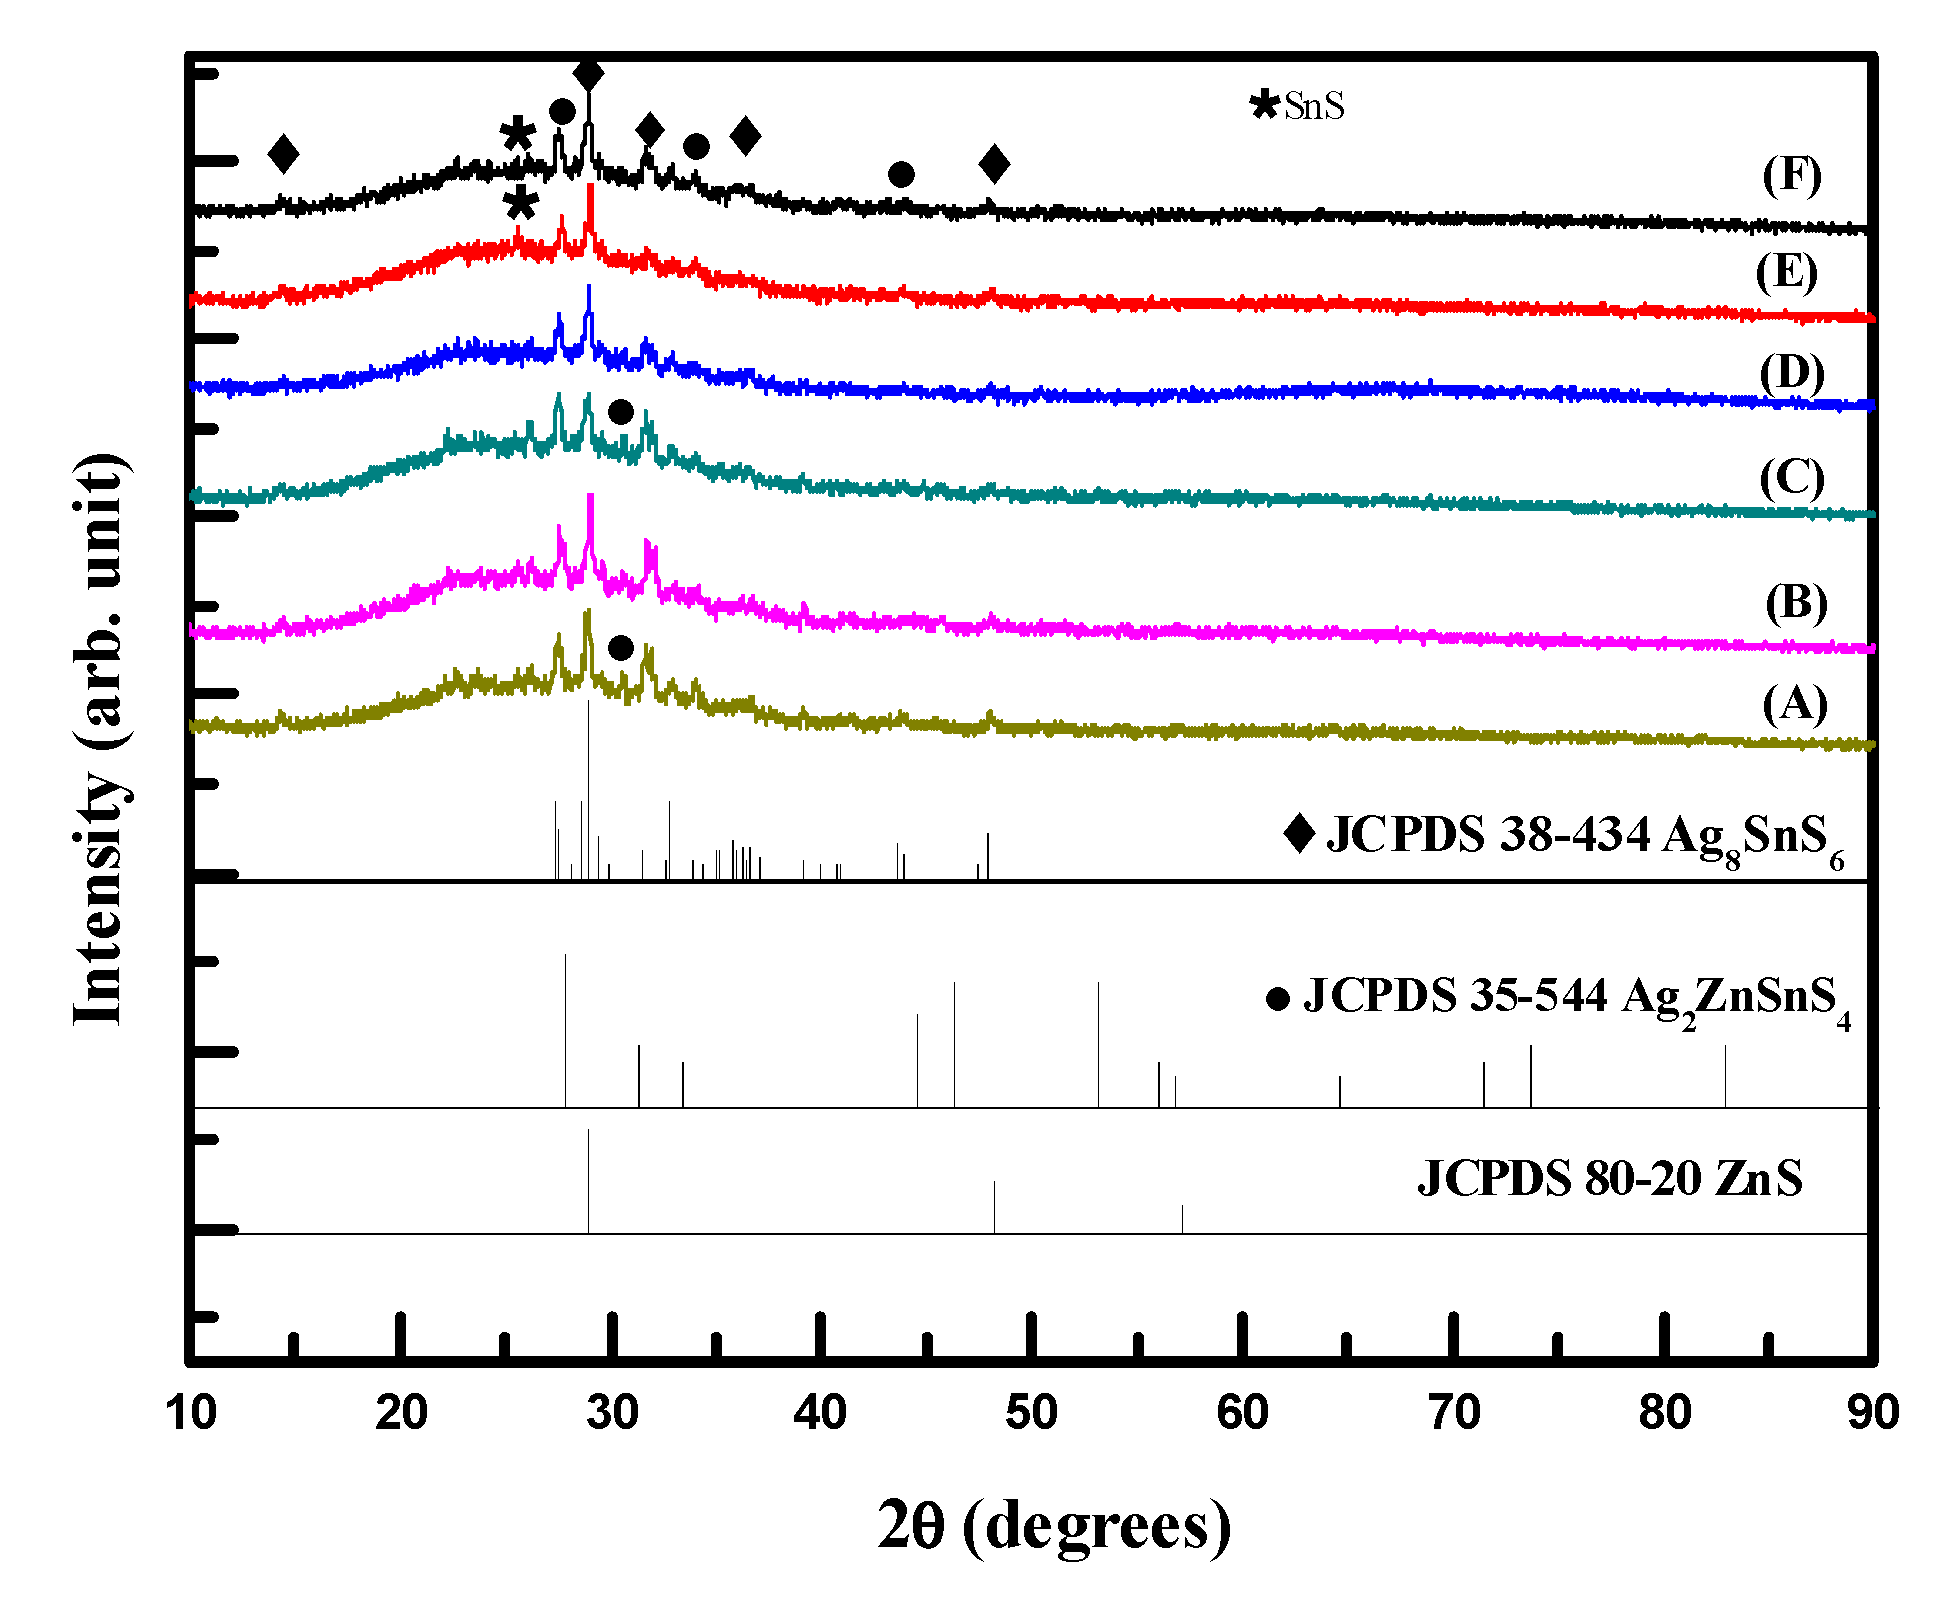
Figure 1 shows the XRD patterns of samples after thermal treatments. The standard peaks for Ag
8SnS
6 (JCPDS card no. 38-434), Ag
2ZnSnS
4 (JCPDS card no. 35-544) and ZnS (JCPDS card no. 80-20) were also shown in
Figure 1. All samples had the Ag
2ZnSnS
4 phase but the orthorhombic Ag
8SnS
6 (JCPDS no. 38-434) was also observed. With an increase in the Zn content in the precursor solution (samples A–C), the peak at 2θ of 28.95°, which corresponds to the (0 0 2) crystal plane for the Ag
8SnS
6, decreased while the peak at 2θ of 27.42°, which corresponds to the (1 1 2) crystal plane for the Ag
2ZnSnS
4, increased. The peak intensity for the (1 1 2) crystal plane of the Ag
2ZnSnS
4 was almost the same as that for the (0 0 2) crystal plane of the Ag
8SnS
6 at the sample C ([Zn]/[Sn] molar ratio of 0.2 in the precursor solution). With a further increase in the Zn content in the precursor solution, (samples D–F), the peaks for the Ag
2ZnSnS
4 phase decreased and the peaks for the Ag
8SnS
6 increased. At the high Zn content in the precursor solution, minor amount of SnS (JCPDS no. 79-2193) in samples E and F was observed. According to the phase diagram reported by Nagaoka et al. (2021) [
22], the ternary Ag–Sn–S phase is easily formed during the preparation of the Ag
2ZnSnS
4 sample. For the CBD deposition of metal sulfides on substrates, binary metal sulfides were first formed during the deposition. After thermal treatment (>300 °C), binary metal sulfides react with each other to form ternary metal sulfides such as Ag
8SnS
6. At higher temperature thermal treatment (>450 °C), the ZnS and the ternary Ag
8SnS
6 then react with each other to form a Ag
2ZnSnS
4 sample. At low Zn content in the precursor solution, the ternary Ag
8SnS
6 was first formed during the thermal treatment. Then the ZnS reacted with some ternary Ag
8SnS
6 to from the Ag
2ZnSnS
4 sample. The major phase of sample A was therefore the Ag
8SnS
6 phase with some amount of Ag
2ZnSnS
4. With an increase in the Zn content in sample, more ZnS were formed during the CBD. After thermal treatments of samples B and C, the peaks for Ag
2ZnSnS
4 increased. At the high Zn content in the precursor solution (samples D–F), theoretically, the peak intensity of Ag
2ZnSnS
4 would increase with an increase in Zn content in the sample. However, the results in
Figure 1 show different results.
The possible reason may be due to too high Zn content in the sample, which resulted in the decrease in the peak intensity of the Ag
2ZnSnS
4 phase. Then, we examined the compositions of samples A–F using EDS (energy-dispersive X-ray spectrometry) analysis.
Table 1 shows the molar ratios of samples A–F obtained from EDS analysis. From the results shown in
Table 1, we found that the [Zn]/[Sn] molar ratios in the samples were much higher than those set in the precursor solutions. This indicated that the growth rate of ZnS was much higher than that for SnS
2. The [Zn]/[Sn] molar ratio for sample C approached to the stoichiometric ratio of the Ag
2ZnSnS
4 phase. For samples D–F, we found that the [Zn]/[Sn] molar ratios for the samples were much higher than 1. High Zn contents in the samples resulted in the phase separations of the Ag
2ZnSnS
4, Ag
8SnS
6 and SnS phases. The phase diagram reported by Nagaoka et al. (2021) [
22] showed the same result. A pure Ag
2ZnSnS
4 sample with only the stoichiometric ratio of silver, zinc, tin and sulfur powders set in the sample at a long time heat treatment (~30–40 h) can be obtained [
22]. Additionally, by increasing the Zn content in the precursor solution, the [Zn]/[Sn] molar ratios in samples increased, while the [Ag]/[Zn + Sn] molar ratio in samples decreased. The [Ag]/[Zn + Sn] molar ratios for all samples were greater than 1, which indicated that samples were the Ag-rich Ag–Zn–Sn–S samples. The [S]/[Ag + Zn + Sn] molar ratios in samples obtained from EDS analysis were less than 1, which indicated that some S vacancies formed in the samples. According to the results proposed by Yeh and Cheng (2016) [
21] and Hu et al. (2012) [
23], the sulfur vacancies were easily formed at the ternary Ag
8SnS
6 samples.
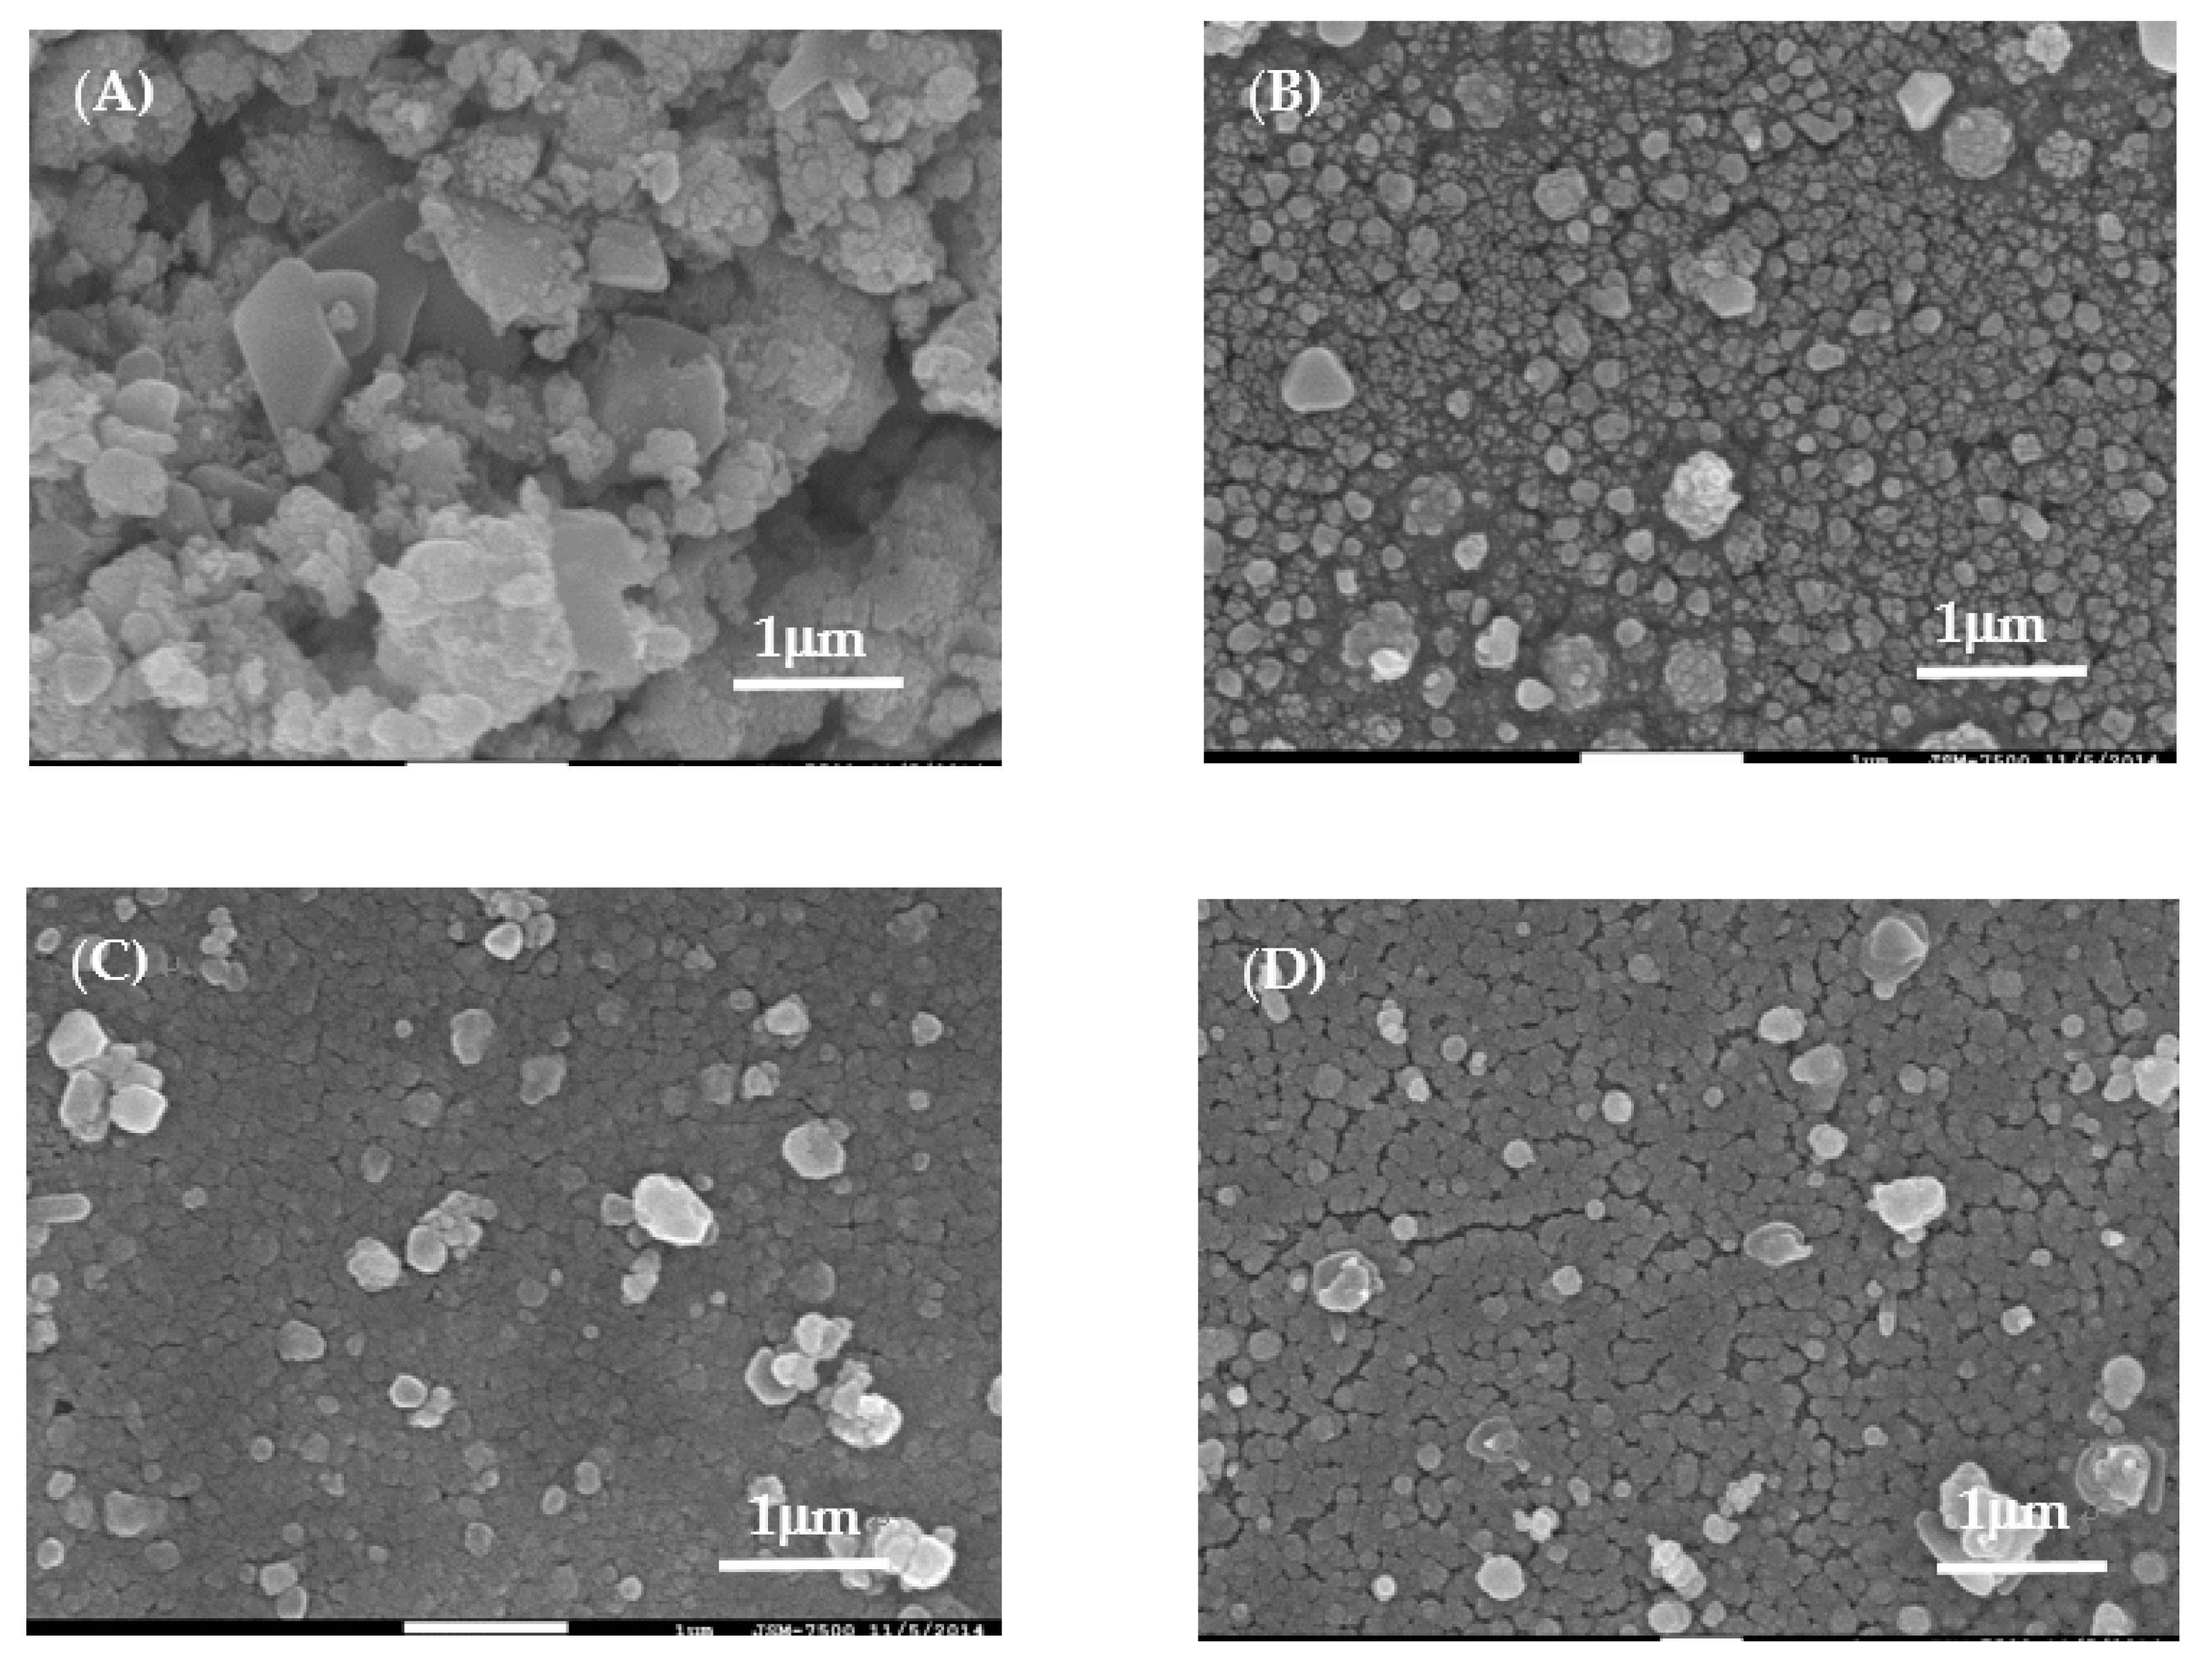
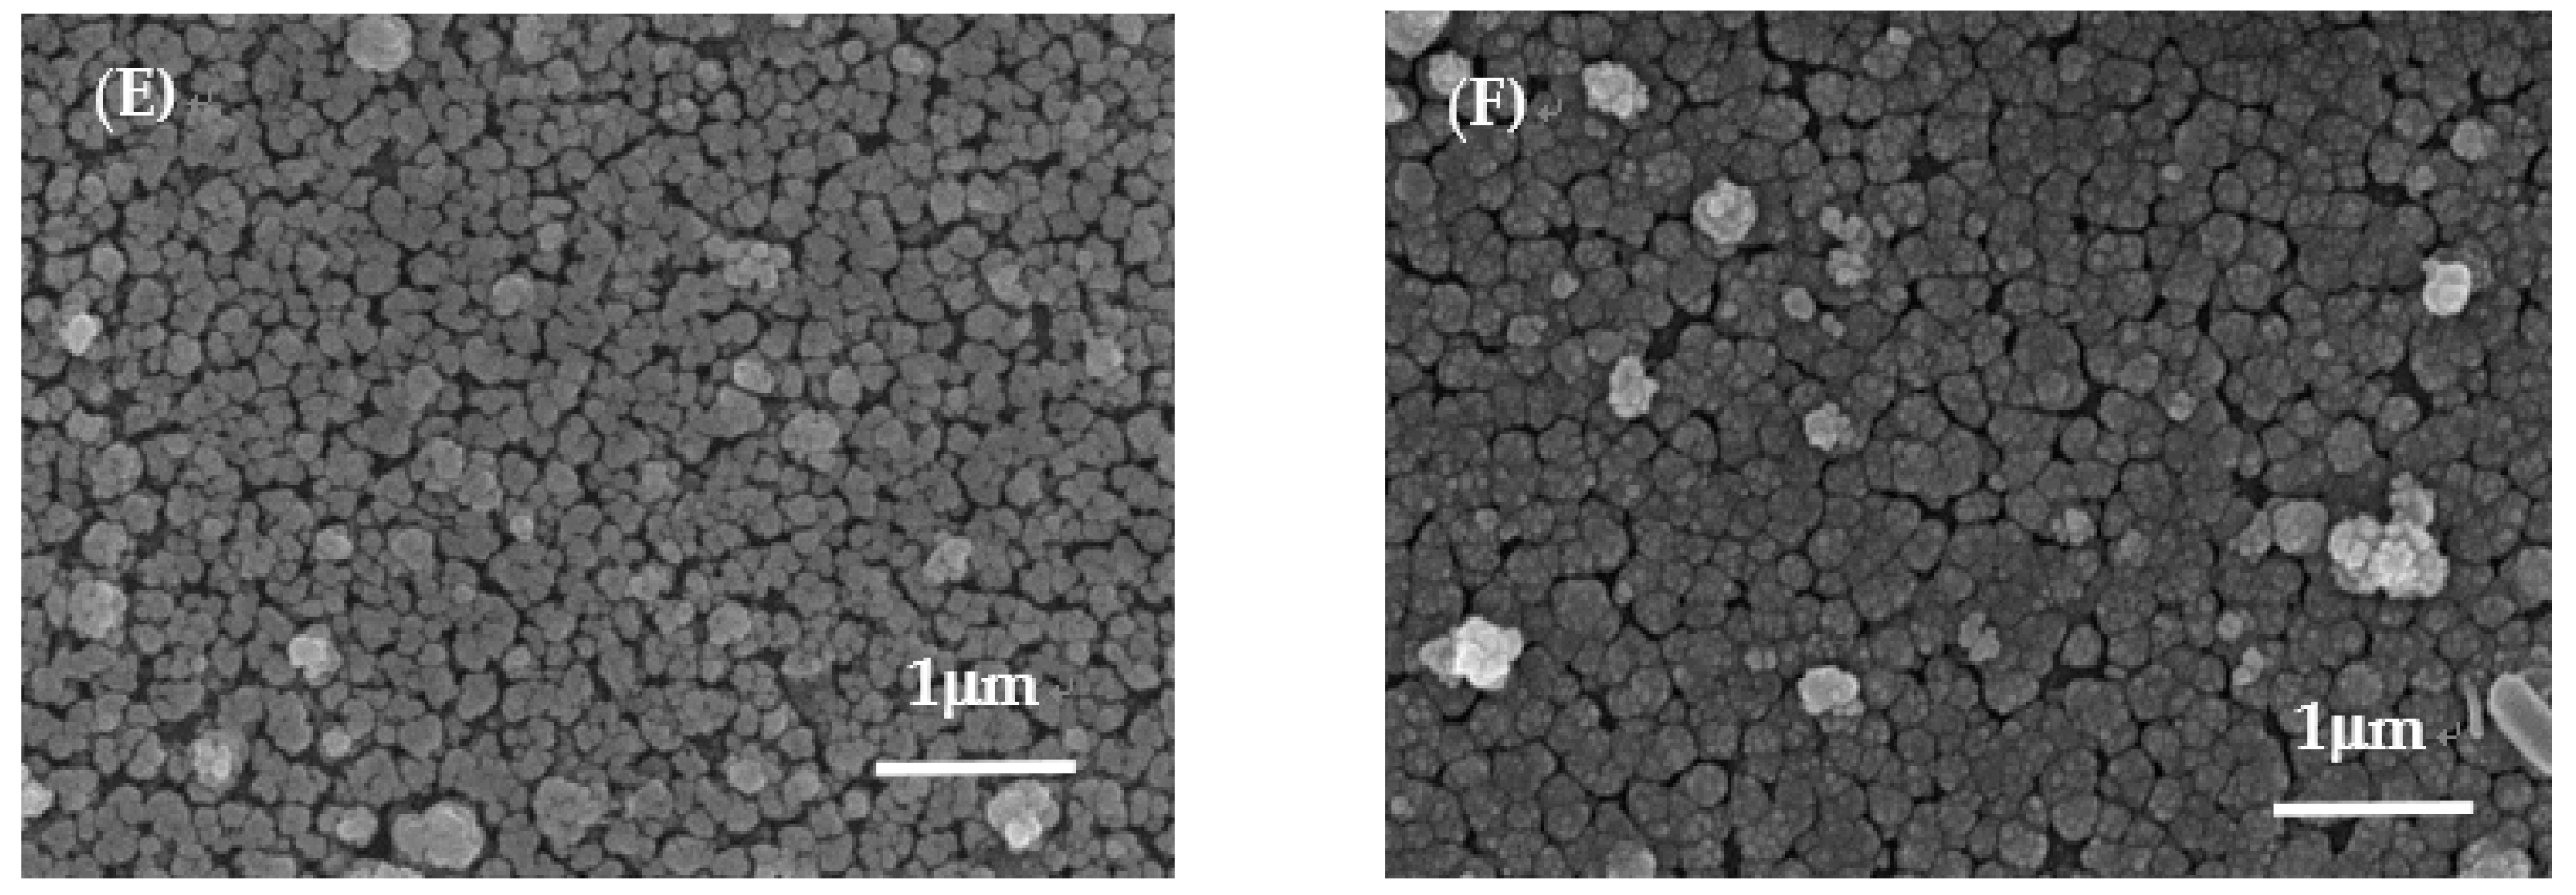
Figure 2 shows the FE-SEM images of samples A–F at 40 k(X). From the results shown in
Figure 2, we found that the surface microstructures of samples were affected by the [Zn]/[Sn] molar ratios in the samples. The plate-like microstructures with some spherical aggregates can be observed at sample A. The plate-like microstructures could be the formation of the Ag
8SnS
6 phase with the orientation (0 0 2) crystal plane, as shown in
Figure 1. The surface microstructures of sample A are similar to those for Ag
8SnS
6 prepared using a solventless method [
23], CBD [
21] and those of Cu
2SnS
3 ternary semiconductors [
24]. By increasing the Zn content to 0.15 in the precursor solution (sample (B)), the surface microstructures changed to small plate-like microstructures with large amounts of small grain aggregates. Due to the increase in the intensity of the (1 1 2) crystal plane of Ag
2ZnSnS
4, the microstructures of the sample changed from plate-like microstructures to small spherical aggregates.
With the [Zn]/[Sn] molar ratio kept at 0.2 in the precursor solution (sample C), the surface microstructures became irregular spherical grains. The plate-like microstructures almost disappeared due to the formation of certain amount for Ag
2ZnSnS
4 phase with the orientation (1 1 2) crystal plane, as shown in
Figure 1. The microstructure of sample C was the same as those of the Ag
2ZnSnS
4 powders reported by Li et al. (2013) [
13] and Liang et al. (2019) [
25]. With the Zn content in samples further increasing (samples D–F), the microstructures at sample surface were irregular spherical grains. Some pinholes and cracks were also observed in samples E and F. The thicknesses of the samples obtained from surface profile measurements are 1.8 ± 0.1 μm.
The optical properties of samples are important for the evaluation of their PEC performances under light irradiation.
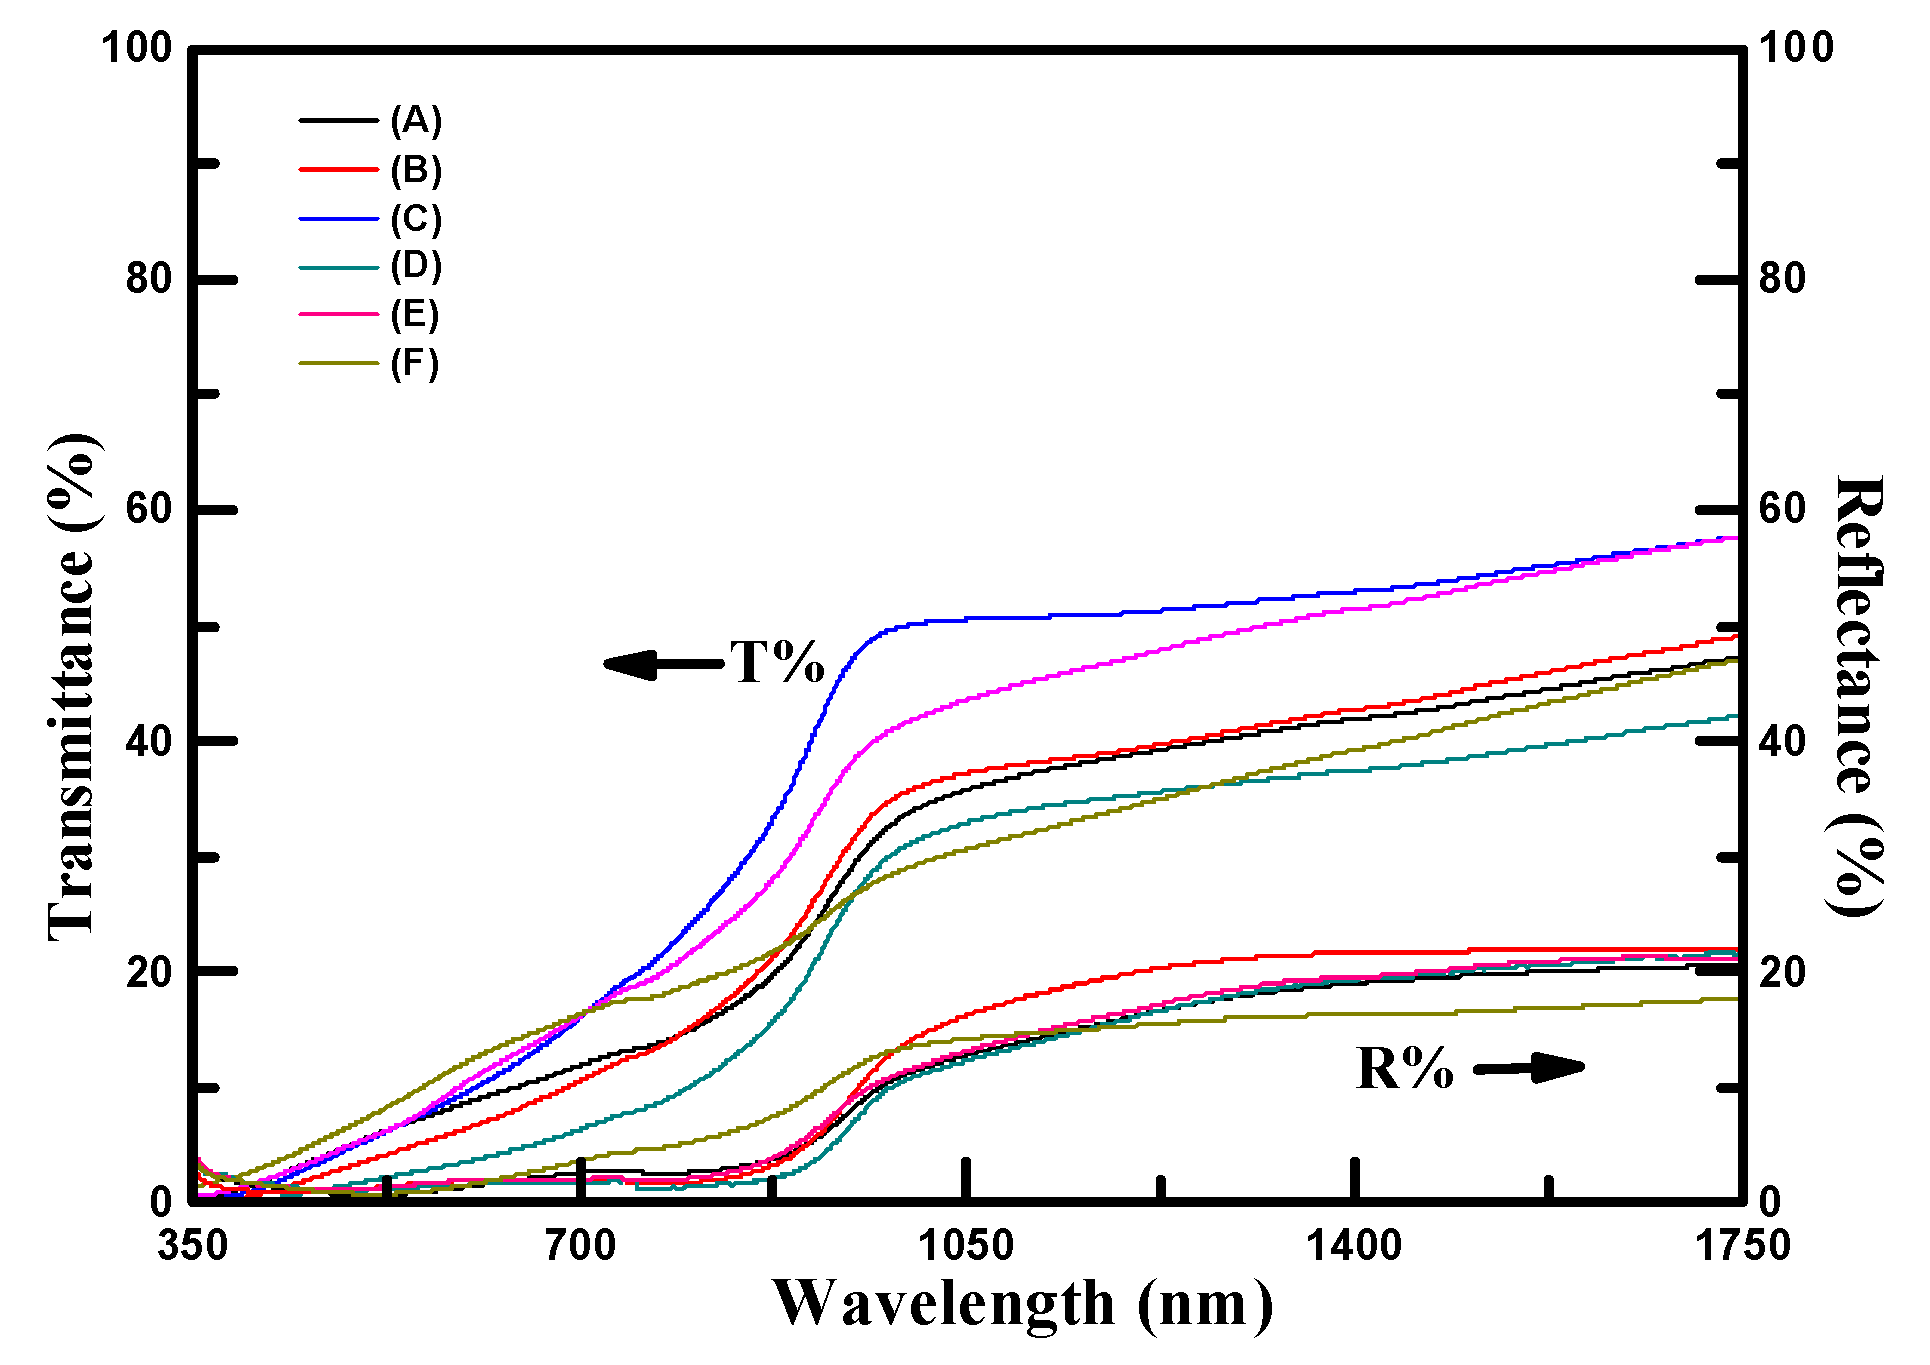
Figure 3 shows the transmittance and reflectance spectra of samples measured at the light wavelength in the range of 350–1750 nm. The reflectance spectra of all samples were in the range of 0–20%. The reflectance spectra of all samples approached to 0% at the light wavelength of less than 880 nm and increased to 20% at the light wavelength of greater 1000 nm. The transmittance spectra of samples were in the range of 0–50%. At the light wavelength of greater than 900 nm, the transmittance spectra of samples approached the maximum value. The maximum transmittance of 50% for sample C was observed. The absorption coefficients (
α) of samples can be estimated using the Manifacier model [
26]:
where
t is the thickness of the sample and
T and
R are the transmittance and reflectance data, respectively [
26]. The relationship between the absorption coefficient (
α) and the incident photon energy (
hv) can be written as:
where
A is a constant. Generally,
n is 1/2 for a direct band gap and 2 for an indirect band gap [
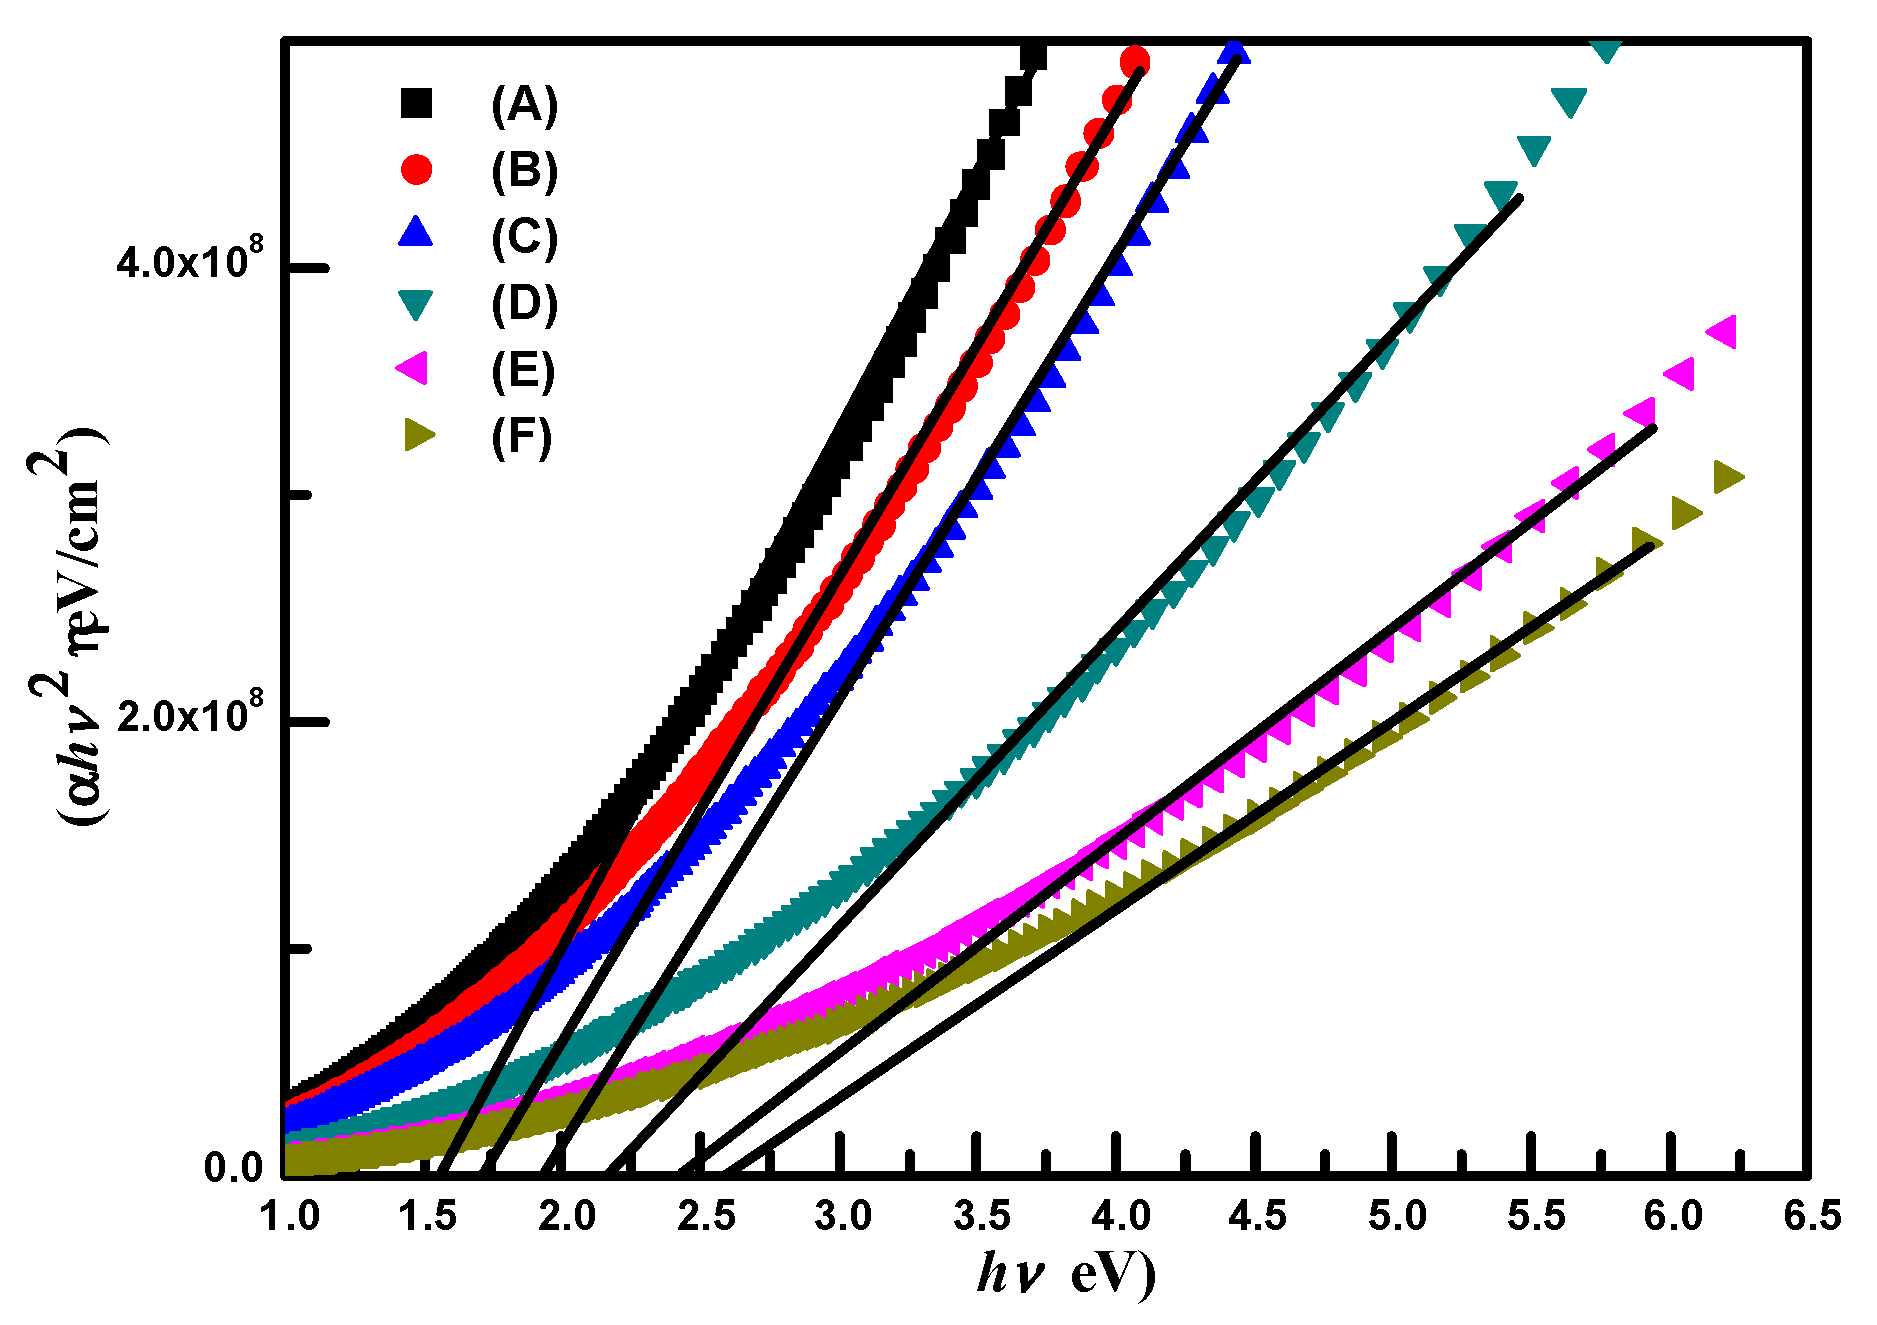
27]. The optical energy band gaps (
Eg) of samples can be obtained by plotting (
αhν)
1/n with respect to
hv and extrapolating the plot to (
αhν)
1/n = 0. The linear dependence of (
αhν)
2 on
hv is shown in
Figure 4.
The energy band gaps (Eg) of samples A–F obtained from the
Figure 4 were 1.57, 1.71, 1.95, 2.16, 2.44 and 2.61 eV, respectively. They are listed in
Table 2. The energy band gaps of Ag
8SnS
6, Ag
2ZnSnS
4, and ZnS were in the range of 1.28–1.39 eV [
21], 2.0–2.1 eV [
13,
28] and around 3.6 eV [
28], respectively. The energy band gap of samples A and B were located in the range between the energy band gaps of Ag
8SnS
8 and Ag
2ZnSnS
4. The energy band gap of sample C approached to that for Ag
2ZnSnS
4 reported in the literature [
13,
25,
28]. The energy band gaps of samples D–F were larger than 2.0 eV due to their high Zn contents in the samples. Some low crystalline ZnS may be formed in the samples although it was not detected in the XRD patterns of samples D–F.
Room-temperature Hall measurements with a magnetic flux of 0.57 T were employed to measure the conduction type, carrier concentration, and mobility of the samples on glass substrates. All samples are n-type semiconductors, which is consistent with previous studies [
10,
17,
25,
29]. The carrier concentrations and carrier mobilities of samples were in the ranges of 6.57 × 10
12–1.76 × 10
14 cm
−3 and 7.14–39.22 cm
2/V·s, respectively. Detailed results are shown in
Table 2. The carrier concentrations of samples increased with an increase in Zn content in the samples, while the mobilities of samples increased with increasing Zn content in the samples when the [Z]/[Sn] molar ratio of less than 0.2 was in the reaction solution. After that, the mobility decreased with an increase in the Zn content in the precursor solution. The possible reason is due to the pinholes or cracks formed in the samples, as shown in
Figure 2. The pinholes or cracks formed in the samples are the defects that may result in the decrease in the mobilities of the samples and therefore decrease their PEC performances [
21]. The carrier concentration and mobility for Ag
8SnS
6 are 10
12 cm
−3 and 89.3 cm
2/V·s [
11,
21]. The carrier concentration and mobility of Ag
2ZnSnS
4 are in the range of 10
14–10
15 cm
−3 and 0.9–7.0 cm
2/V·s [
17,
30]. The carrier concentrations and mobilities of samples were in the range of those for Ag
8SnS
6 and Ag
2ZnSnS
4 reported in the literature.
The flat-band potential (
EFB) of a sample in an electrolyte is also important for PEC hydrogen production. The relationship between the capacitance (
C) of a sample in the electrolyte and the applied voltage (
E) is given by the Mott–Schottky equation [
21,
31]. The Mott-Schottky equation is:
where
ε is the dielectric constant of the sample,
A is the surface area of the sample/electrolyte interface,
ND is the sample’s carrier concentration,
EFB is the flat-band potential of the sample,
e is the electric charge, and
ε0 is the permittivity of the vacuum. The slope of the Mott–Schottky plot is +1 (positive) for an n-type semiconductor, and −1 (negative) for a p-type semiconductor. The measurements of Mott–Schottky plots of samples were carried out in the aqueous Na
2S (0.35 M) + K
2SO
3 (0.25 M) solution. The frequency of impedance was set at 10 kHz for these measurements because the equivalent circuit of the samples in the solution can be simplified into a resistance–capacitance (RC) circuit.
Figure 5 shows the Mott–Schottky plots for samples in the electrolyte.
EFB can be obtained from
E0, the point of intersection of a C
−2 vs.
E plot with the
E-axis:
The flat-band potentials obtained from the Mott–Schottky plots for samples A–F are −0.84, −0.76, −0.82, −0.80, −0.79 and −0.85 V vs. Ag/AgCl, respectively. They are also listed in
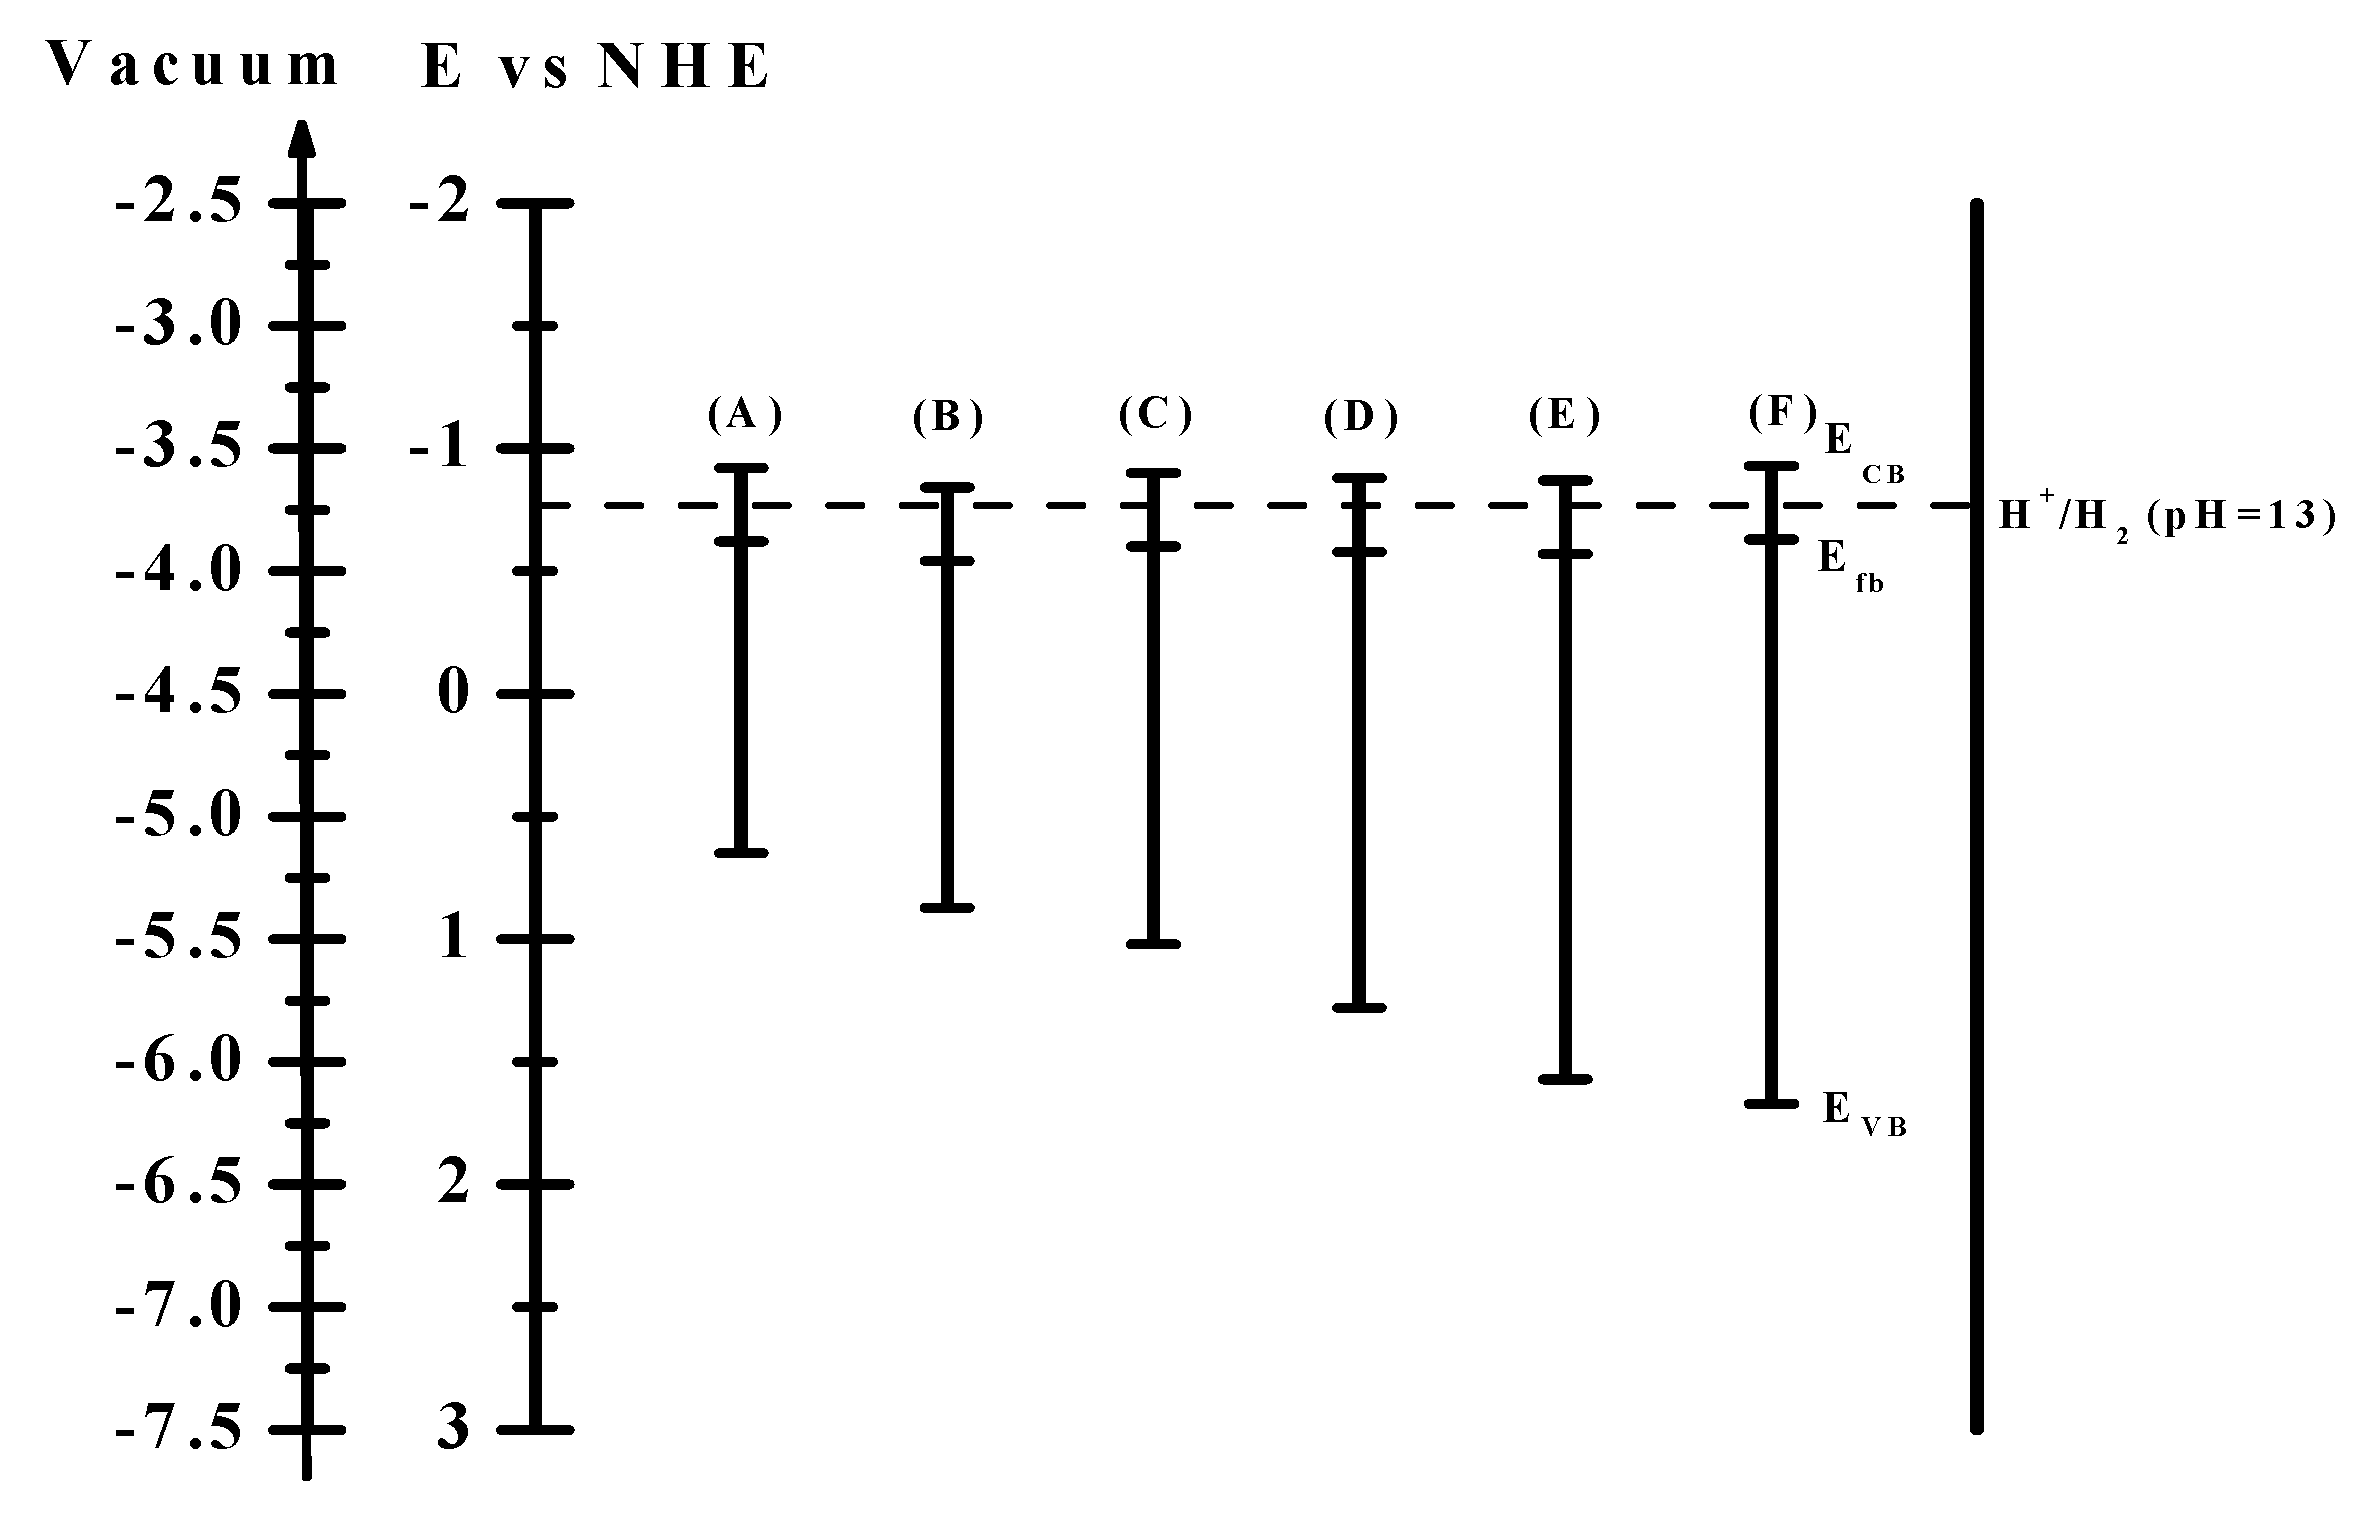
Table 2. Since the slopes of the Mott–Schottky plots for all samples are positive, the samples are n-type semiconductors, which is consistent with the Hall measurements. The positions of the conduction and valence bands for samples A–F can be estimated using their flat-band potentials and energy band gaps.
Figure 6 shows the band positions of the samples in an aqueous 0.35 M Na
2S + 0.25 M K
2SO
3 solution. The conduction bands of all samples are more negative than the hydrogen reduction potential, making them suitable for hydrogen production.
The current density-applied voltage plots of samples A–F in the dark and under irradiation were employed to examine their PEC performances for hydrogen production. In order to compare with the PEC performances of metal sulfides reported in the literature [
13,
21,
28,
30], the aqueous 0.35 M Na
2S + 0.25 M K
2SO
3 solution was employed as the electrolyte.
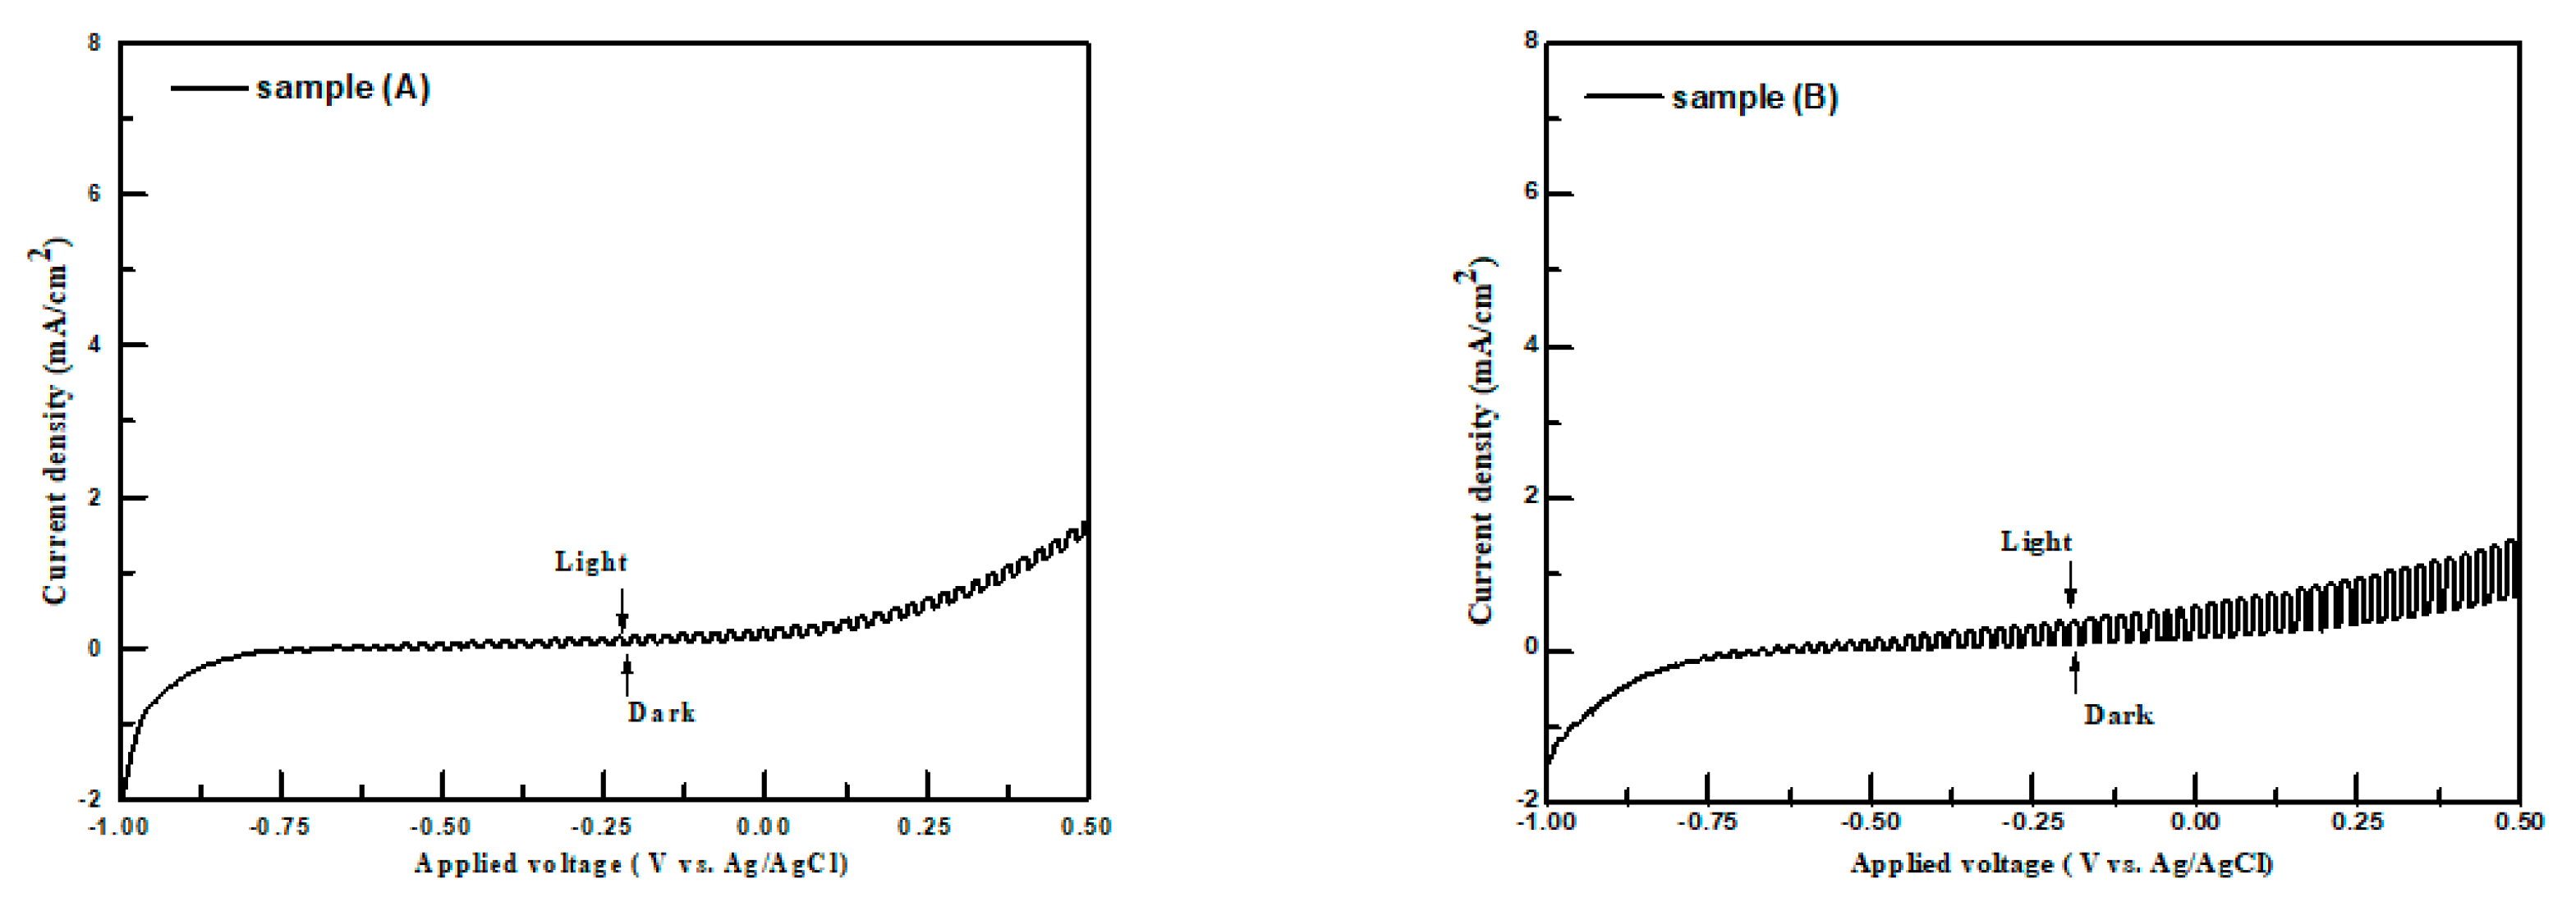
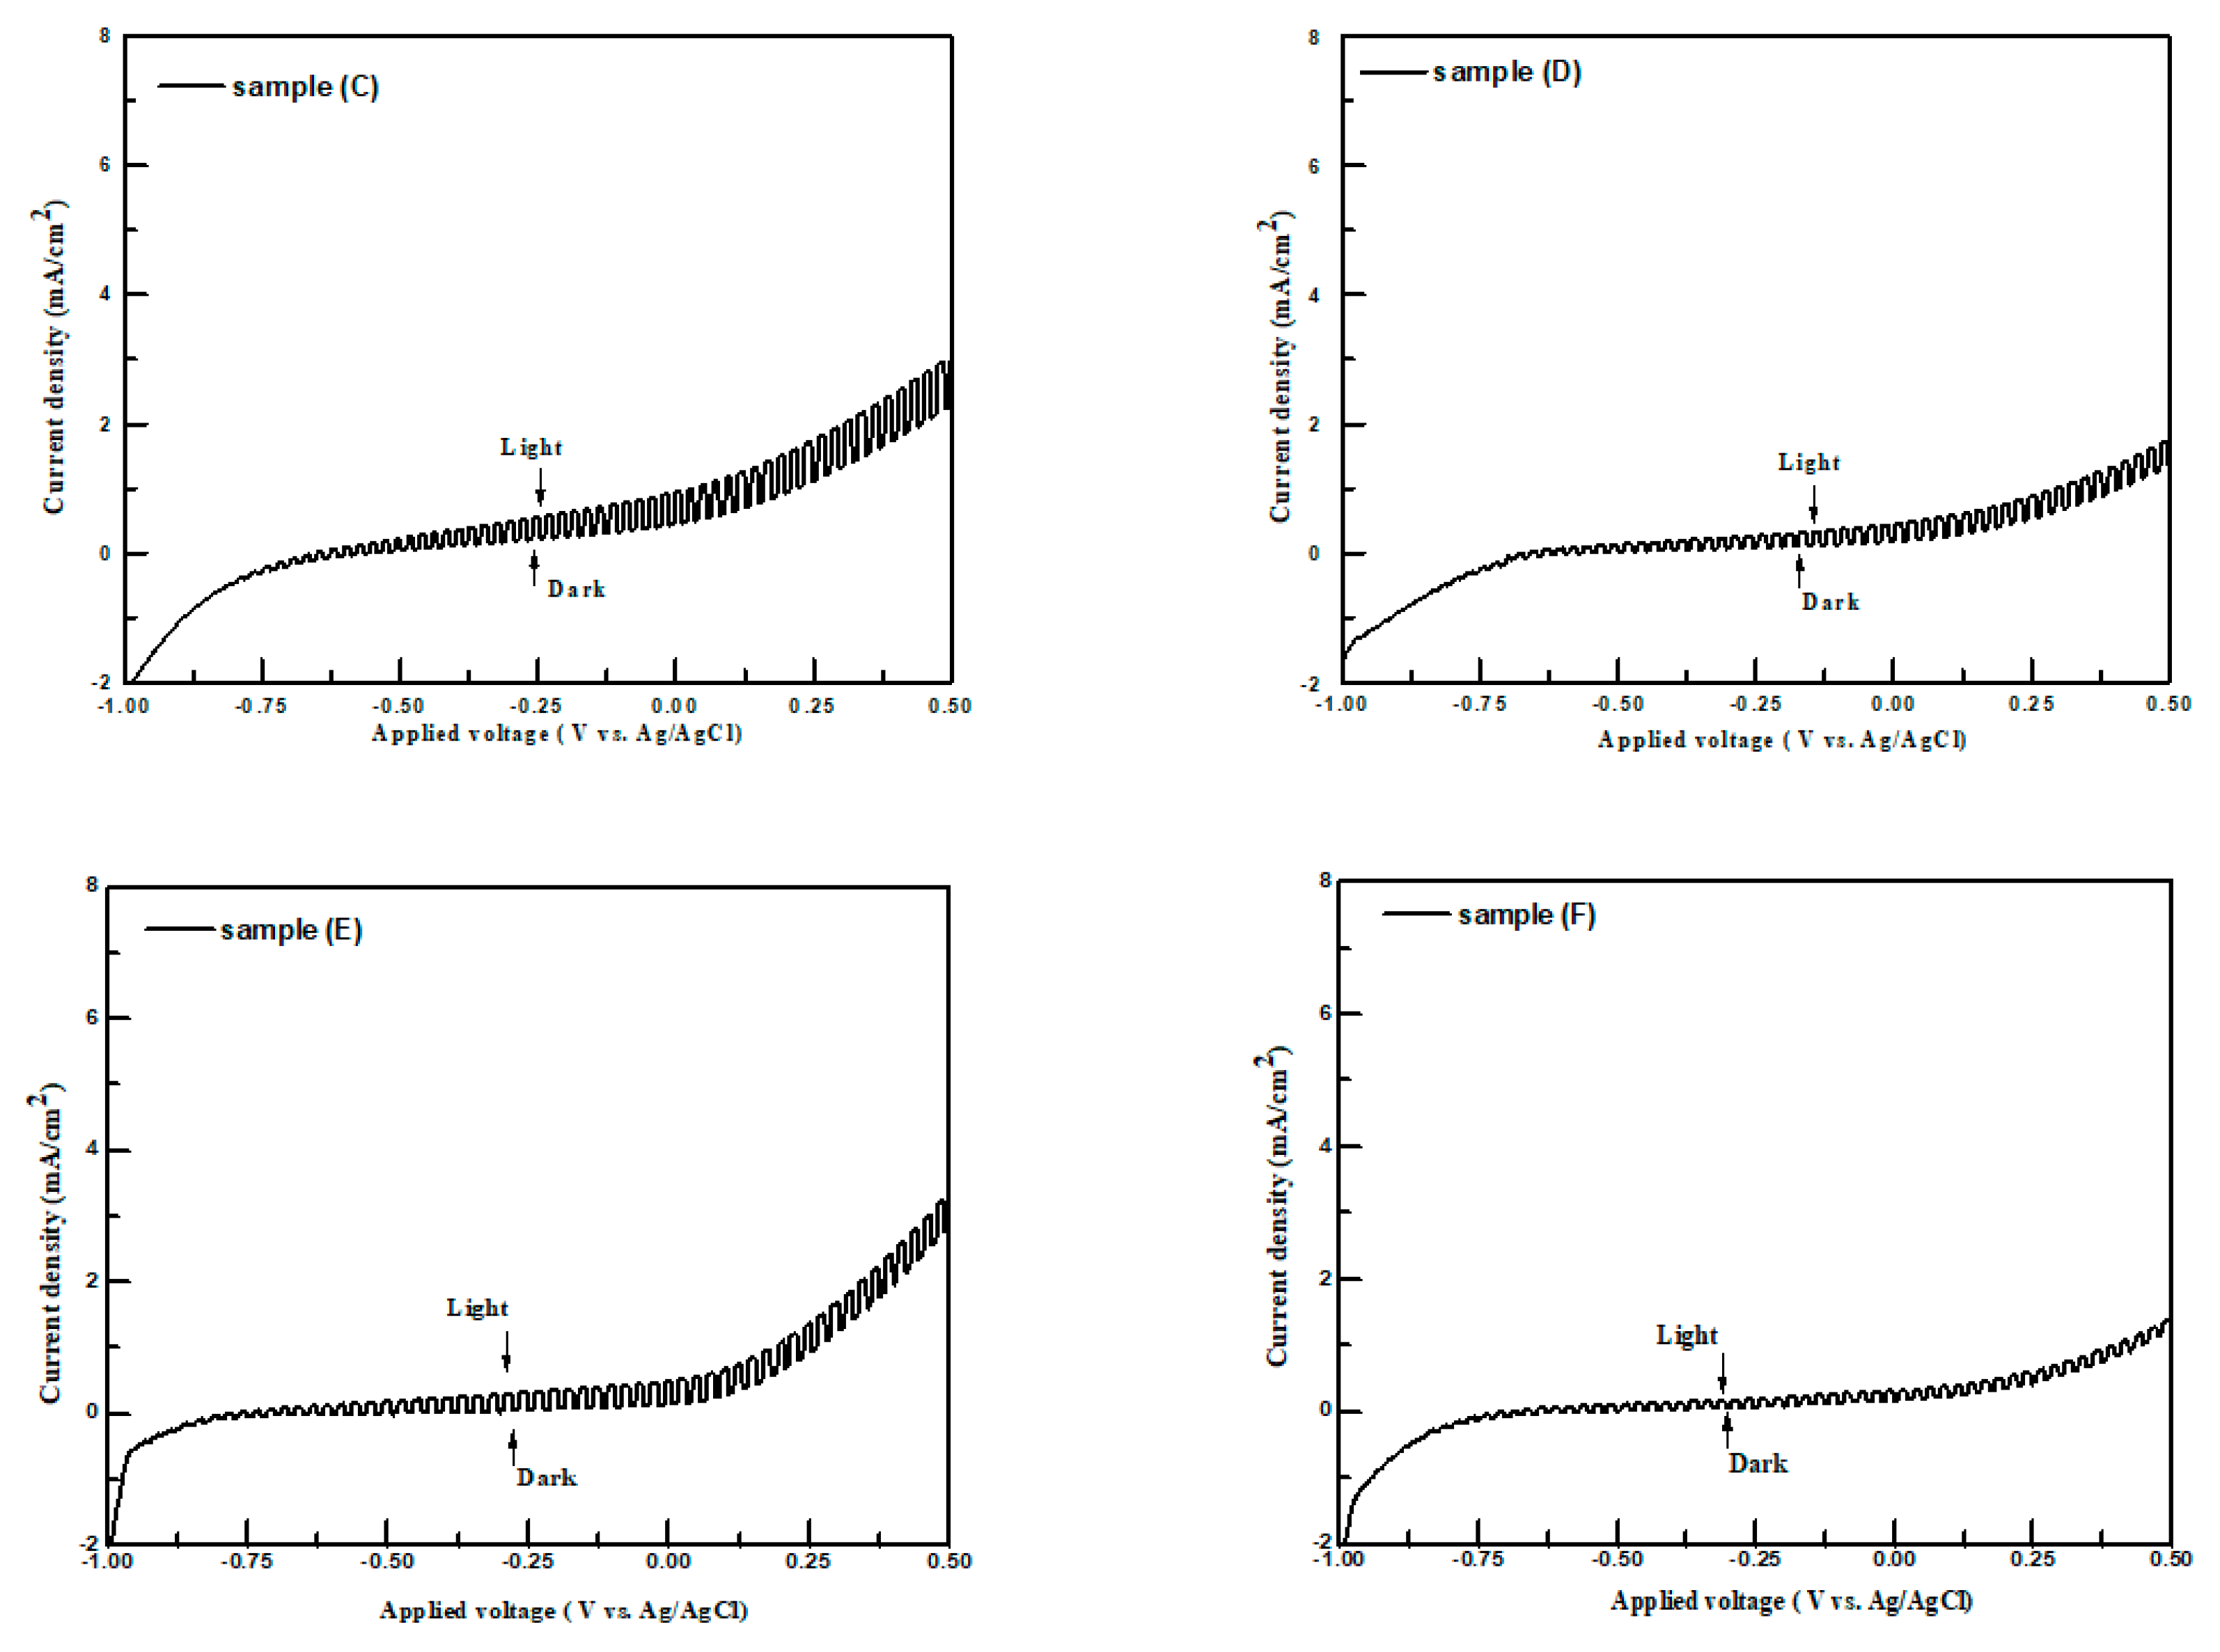
Figure 7 shows the typical current density-applied voltage measurements obtained using the chopping method for samples A–F with applied potentials in the range of −1.0 V to 0.5 V vs. an Ag/AgCl electrode in the 0.25 M Na
2S + 0.35 M K
2SO
3 aqueous solution, respectively.
In the aqueous Na
2S + K
2SO
3 solution, S
2− and SO
32− ions are hole scavengers, which is the same as those reported in the literature [
13,
21,
27]. Water is reduced to hydrogen by the electrons produced in the conduction band of samples, accompanied by the oxidation of SO
32− ions under illumination. The current density of samples at an applied voltage in the Na
2S (0.35 M) and K
2SO
3 (0.25 M) aqueous solution increased under illumination because of the following reactions [
13,
21,
28]:
All samples show the increase in anodic current density under illumination in the electrolyte with the applied voltage becoming more positive, which means that the samples were n-type semiconductors. They agree well with those obtained from the Mott–Schottky plots and room-temperature Hall measurements. The differences of current density in the dark and under light irradiation for samples at a certain external bias were named as PEC performances. The PEC performances of samples at 0 V vs. Ag/AgCl are listed in
Table 2. The highest PEC performance of samples in this study was 1.38 mA/cm
2 in the Na
2S (0.35 M) and K
2SO
3 (0.25 M) solution. It was observed that the PEC performances of the samples increased from 0.23 to 1.38 mA/cm
2 when the [Zn]/[Sn] molar ratio in the solution bath was increased from 0.1 to 0.20 (samples A to C). For the [Zn]/[Sn] molar ratios of greater than 0.25 in the precursor solution (samples D–F), their PEC performances decreased. This indicates that there is an optimum [Zn]/[Sn] molar ratio in the sample which leads to the maximum PEC performance under illumination. Several factors such as mobilities, surface microstructures or energy bang gaps of samples may influence their PEC performances in the electrolyte. Bronger and Carius [
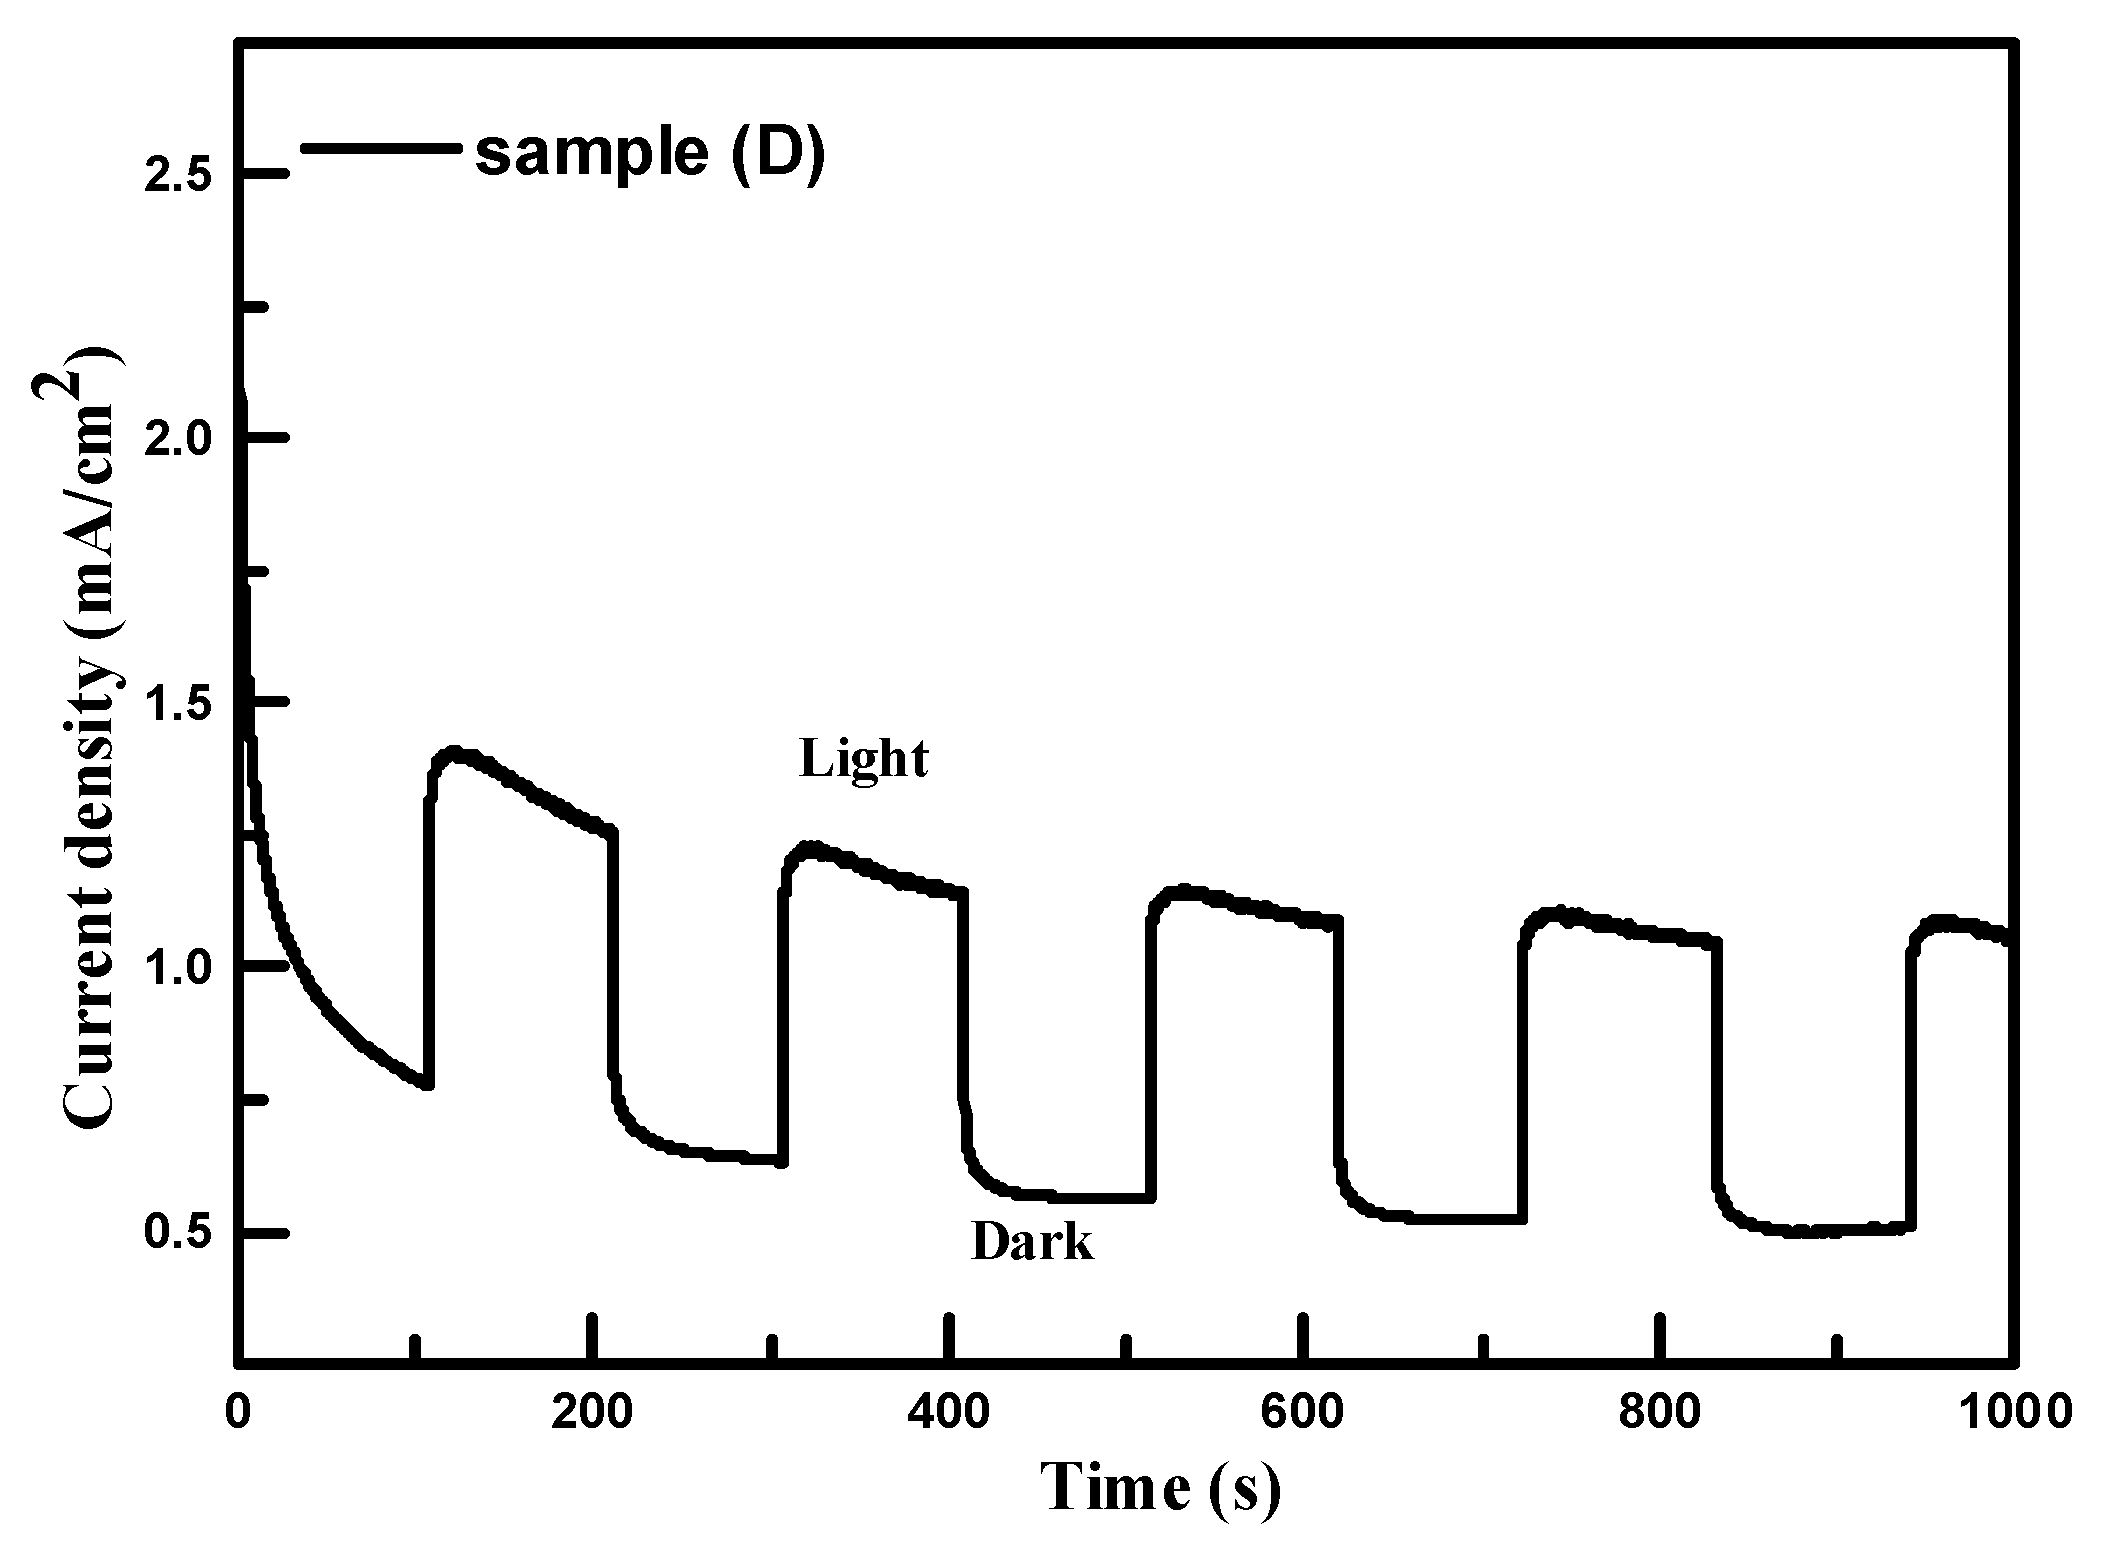
32] reported that carrier mobility is an important property for the efficiency of solar cells. Low carrier mobility leads to high carrier recombination, which could limit the efficiency of solar cells. Sample C had the highest PEC performance due to its highest carrier mobility and poor PEC performance for sample F was observed due to it having the lowest carrier mobility. The stability of sample C was tested in the K
2SO
3 (0.25 M) and Na
2S (0.35 M) aqueous solution under illumination, as is given in
Figure 8. The anodic current changed from 1.40 mA/cm
2 to 1.20 mA/cm
2 in the aqueous solution during a 1000 sec stability test. These experimental results show that the Ag–Zn–Sn–S sample with an [Zn]/[Sn] molar ratio of 0.95 in the sample had the highest PEC performance in the electrolyte containing S
2− and SO
32− ions under illumination.
3. Materials and Methods
The incorporation of Zn ions in the reaction bath for the growth of Ag–Zn–Sn–S samples on substrates was carried out. Multi-component Ag–Zn–Sn–S thin films were directly deposited on the surface of glass or ITO-coated glass substrates using CBD. The detailed deposition procedure is similar to that used in a previous study [
21]. Aqueous cationic and anionic solutions were prepared separately before the growth of films. The cationic solution contained 4 mL of AgNO
3 (0.4 M), 3 mL of 0.04–0.14 M Zn(NO
3)
2, 3 mL of SnCl
2 (0.4 M), 1.25 mL of NH
4NO
3 (0.4 M buffer solution), 10 mL of tri-sodium citrate (0.4 M chelating agent I), and 0.54 mL of 0.4 M ethylenediaminetetraacetic acid disodium salt (Na2-EDTA, chelating agent II). The pH value of the bath was kept at 1 using concentrated H
2SO
4 in order to decrease the formation of metal complexes such as Sn(OH)
2. 35 mL of 0.6 M thioacetamide (TAA, CH
3CSNH
2) solution, the source of S
2− ions, was then added into the cationic solution and mixed well. Pre-cleaned glass or ITO-coated glass substrates were placed vertically into the reaction solution. The reaction solution was put on a hot plate with magnetic stirring and the reaction temperature of the solution was kept at 70 °C. After 4 h of deposition, the samples were removed and cleaned ultrasonically in a water bath for 5 min in order to obtain uniform and compact samples, which were then dried in an oven at 70 °C. The detailed deposition parameters are shown in
Table 3. The annealing of Ag–Zn–Sn–S metal samples was carried out in a closed graphite container. The graphite box was loaded into an evacuated quartz tube under a rapid thermal annealing (RTA) process in order to obtain Ag–Zn–Sn–S thin films. The chamber used for RTA was first evacuated to 5.0 × 10
−3 Torr in order to avoid the influence of oxygen gas. Thermal treatment of Ag–Zn–Sn–S samples was set at 160 °C for 5 min. and 450 °C for 5 min.
The crystallographic study of films on glass substrates was carried out using an X-ray diffractometer (D2-Phaser X-ray diffractometer, Bruker, A26-X1-1) with CuKα (λ = 1.5405 Å) radiation. The X-ray diffraction (XRD) patterns of samples were recorded in the 2θ range of 10° to 90°. The surface morphology and composition of the film were analyzed using a field emission scanning electron microscope (FE-SEM; JEOL JSM-7500F) equipped with an energy-dispersive X-ray spectrometry (EDS). The spectral transmittance and reflectance of the samples were measured using an ultraviolet-visible-near-infrared (UV-VIS-NIR) spectrophotometer with an integrating sphere (JASCO V-670) in the wavelength range of 350–1750 nm at room temperature. The thickness of the samples was determined using a surface profiler (Surfcorder ET 3000). The mobility, resistivity, and carrier concentrations of the samples were measured using room-temperature Hall measurements (Ecopia HMS-3000) with a magnetic flux of 0.57 T.
The Mott–Schottky plots of samples were measured using a computer-controlled potentiostat (CH Instruments, 600C) equipped with a frequency response analyzer. A three-electrode setup was employed, where the samples, a Pt plate electrode and an Ag/AgCl electrode were the working, counter, and reference electrodes, respectively. The electrolyte, aqueous K2SO3 (0.25 M) and Na2S (0.35 M), was freshly prepared using de-ionized water and degassed by purging with high-purity nitrogen, followed by ultrasonication for 30 min before each experiment. The frequency of 10 kHz was set for the measurement of Mott–Schottky plots of samples. All experiments were carried out in a nitrogen environment at a temperature of 25 °C. The applied potentials were in the range of −1.0–0.0 V vs. an Ag/AgCl electrode.
The measurements of PEC performances of the samples were carried out in a quartz electrolytic cell with the sample (average area = 1.0 cm2), a Pt plate electrode (average area = 1.0 cm2), and an Ag/AgCl electrode as the working, counter, and reference electrodes, respectively. An aqueous K2SO3 (0.25 M) and Na2S (0.35 M) solution was used as the electrolyte. All measurements were carried out in a nitrogen environment at a temperature of 25 °C. Current densities, as a function of the applied potential (−1.0–0.5 V vs. an Ag/AgCl electrode) for the samples, were recorded with a computer-controlled potentiostat (CHI 600 C) for all PEC experiments. A 300-W Xe short arc lamp (Perkin Elmer PE300BF) with a white light intensity of 100 mW/cm2 was employed to simulate solar light.
