Abstract
In order to determine the potential of biochemical and structural features of Elaeis guineensis Jacq. oil palm mesocarp lipases, the LIP2 gene was isolated, expressed, purified and characterized through the Escherichia coli microbial recombinant system. Gene analysis of LIP2 revealed that it is composed of 1584 base pairs which are encoded in 528 amino acid residues with a molecular weight of around 57 kDa. LIP2 has distinctive lipolytic properties in terms of α/β fold and the catalytic triad for lipase. The LIP2 lipase was successfully expressed and purified from E. coli Rosetta (DE3) via affinity chromatography. The optimal temperature and pH for the lipase activity was 30 °C and a pH of 9, respectively. Stability was profoundly increased with the addition of metal ions (Ca2+, Mg2+, Mn+, and Ni+), along with organic solvents (ethanol and octanol). pNP myristate was the most suitable among all pNP esters. In biophysical characterization analysis, LIP2 has a thermal denaturing point at 66 °C, which mostly consists of random patterns (39.8%) followed by α-helix (30.3%), turns (23.8%) and β-sheet (6.2%). From the successful purification and characterization, the potential of oil palm mesocarp lipase was able to be further explored.
1. Introduction
Lipase is a versatile enzyme commonly used in industry, with applications as varied as yogurt and cheese fermentation, baking, laundry detergents, biocatalyst and alternative products [1]. In general, lipases breakdown ester bonds in fats or oil into fatty acids and glycerol. Their role as a global enzyme in the market has significantly grown compared to the other hydrolysis enzymes such as peptidases [2]. Lipases from microorganisms are a major source as compared to plant lipases [3,4]. The protein structure of the lipases from plants has not been widely studied due to the low protein expression and laborious purification to produce, which tends to cause less purified protein compared to lipases expressed in microorganisms. Purification of plant lipases may cause damage and undesirable effects on the purified lipase protein through the downstream processing, since it is quite complex and tedious to extract plant lipases without getting other compounds such as high lipid and phenolic contents. These can cause conformation changes which eventually lead to different results in characterization and structural studies, especially in an analysis of their potential application in industry. Plants also take a longer time to grow and germinate compared to the other microorganisms like bacteria and yeast. Handling of plant culture in the laboratory might also lead to microbial contamination and affect lipase production [3,5,6]. Nevertheless, many plant lipases have been studied recently involving various methods of purification and characterization.
There is an alternative way in which lipase can be produced in high yields, within a short time, and only requiring a small-scale facility by using microorganisms [7]. In this study, lipase-producing genes located in mesocarp oil palm E. guineensis was studied. Mesocarp is a reddish pulp in the fleshy middle layer of the pericarp of an oil palm fruit, and can be found between its epicarp and its endocarp. During the process of maturation (bruising and abscission), the mesocarp undergoes triglycerides hydrolysis and produces a great amount of free fatty acids. Genome studies have been done before, and more than one lipase-like gene can be found in the mesocarp [8,9]. The lipases from the mesocarp were proven to be serine hydrolases. It has been proven that the oil palm fruit mesocarp contains high lipase activity [10,11]. However, some of the eukaryotes may produce more than one of a same kind family of enzymes. It is thus difficult for the enzyme produced to be studied specifically or comprehensively due to the same family-expressed proteins being interfered with and affected by each other. Assaying the mesocarp lipase activity was a difficult task before, because of the non-solubility of the substrate and the strong dependence of the activity on the physico-chemical state of the substrate. The extract needs to be prepared and assayed for lipase activity as fast as possible after harvest, as the fruits need to be mature but not bruised. Because of this, the assay results were likely to be disarrayed [11].
In this case, a lipase gene was selected from a few lipase genes based on the tendency for it to be successfully expressed in a recombinant system. In order to learn more about them, lipase recombinants were constructed and cloned in order to be expressed, purified and characterized. Cloning does more than increase product purity and quality, as clones are also easier to manipulate genetically for better and more stable enzymes with useful biochemical characteristics [9,12]. Lipases extracted from microbial recombinants often have properties that make them more suitable for studies. This is due to their less laborious and better purification methods compared to the lipase-producing plant itself. The purifications of the lipase from plant-like mesocarps may have some deleterious and undesirable effects through the downstream process, as it can cause the conformation changes which eventually lead to different results in characterization and structural studies [3]. Thus, using a microbial system to express the plant lipase will be more suitable in terms of purification, so that characterization can be carried out effectively.
2. Results
2.1. Gene analysis of LIP2
A total of 1.535 Gb and 1.2 Gb extended of an assembled sequence and transcriptome of E. guineensis genomic have been covered. There were few lipase-like genes found based on the genes from the prediction method annotation [8,9]. From the genomic domain hit, full ORF for LIP2 gene was analyzed using the ORF finder (https://www.ncbi.nlm.nih.gov/orffinder (accessed on 3 February 2021)). It consists of 1584 bp of nucleotides responsible for encoding the lipase and 528 amino acid residues when translated. Using NCBI Protein Basic Local Alignment Search Tool web software, LIP2 has a domain hit for Lipase 3 or triacylglycerol lipase, which belongs to the superfamily of α/β hydrolase, as shown in Figure 1. The active site of a lipase contains a catalytic triad consisting of Serine—Histidine—Aspartic acid, but unlike most serine proteases, the active site is buried inside the structure covered with a lid. BLASTp PDB-based results revealed that the LIP2 lipase is homologous to most of the α/β hydrolase family.
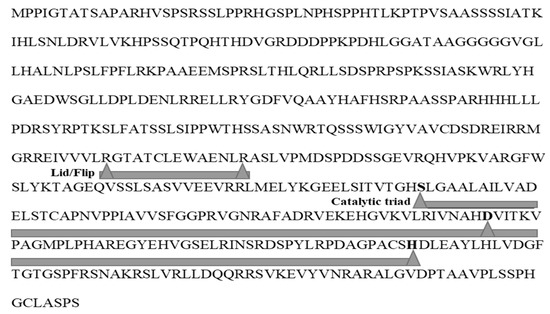
Figure 1.
Translation of full ORF of LIP2 on the direct strand. Lid/Flap at ARG273-ARG286 and catalytic triad at SER355-HIS458-ASP413.
2.2. Structure Prediction via Homology Modelling
The overall predicted structure of LIP2 lipase was modelled using YASARA application software was based on five templates related to LIP2 (2YIJ, 1USW, 5AP9, 1LGY, 5GW8). The highest similarity of LIP2 is phospholipase A1-iigamma 2YIJ from Arabidopsis thaliana with an identical percentage of 34.79%, followed by Aspergillus niger feruloyl esterase 1USW (30.43%), Thermomyces lanuginosus lipase 5AP9 (32.02%), Rhizopus niveus lipase Ii 1LGY (31.91%) and Malassezia globosa hypothetical secretory lipase 5GW8 (30.72%), according to their query cover. Only 2YIJ comes from a family of phospholipase, the rest of the templates belong to esterase and α/β hydrolase family.
LIP2 lipase has the catalytic triad responsible for the lipase to be active, which is located at 355 for serine, 413 for aspartic acid and 458 for histidine (Figure 2). The YASARA program showed that LIP2 mostly consists of α-helix (30.93%), followed by β-sheet (11.60%) and others (57.47%) with an accuracy of 80.41%. The LIP2 lipase model was built by YASARA and evaluated to ensure the reliability of the model stereochemistry validated by a Ramachandran plot using PROCHECK (https://servicesn.mbi.ucla.edu/PROCHECK/) [13]. The Ramachandran plot scores of the predicted structure for LIP2 lipase showed 84.0% of the amino acid in favorable region; 14.9% of amino acids in additional allowed region; 0.6% amino acids in the generously allowed region; and only 0.6% in the disallowed region. Proline phenylalanine and glycine contribute more to the disallowed region (Figure 2). The characteristics and patterns of amino acids, and whether they fit correctly or incorrectly in a structure, can be measured by another validation software called ERRAT2. The ERRAT2 score of the predicted LIP2 lipase structure showed 92.82% quality, with calculated error values of more than 99% at some residues, namely 209, 318, 319, 320, 321, 322 and 323. However, these amino acids are not responsible for the lipolytic activity between the substrate and the binding site of LIP2.
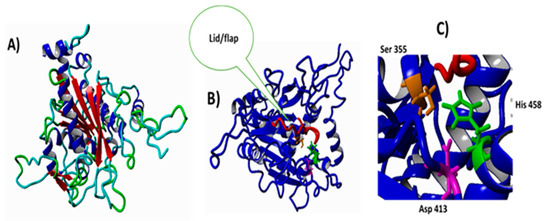
Figure 2.
The predicted structure of LIP2 lipase using homology modelling. (A) Overview of LIP2-predicted tertiary structure. (B) LIP2 with lid and flip labeled in red. (C) Position of catalytic triad in the active site of the LIP2 region.
2.3. Screening of Recombinant LIP2 Lipase on Agar Plate
Preliminary screening was carried out by streaking the transformant on tributyrin-Luria-Bertani agar (50 µg/mL ampicillin). Lipolysis was detected on the tributyrin agar for E. coli Rosetta (DE3) and BL21 harboring pET51b+/LIP2 by the formation of clearing zone (halo zone) around the colonies. The positive colonies were further transferred and streaked to other selective media, namely a rhodamine B agar plate and a triolein agar plate, to confirm the positivity of true lipase activity. For Rhodamine B, the screening of lipolytic recombinant was differentiated using phenol red as an indicator. E. coli Rosetta (DE3) and BL21(DE3) harboring pET51b+/LIP2 transformant distinguished positive lipolytic activity by producing fluorescence yellow or orange from the pink-orange color. In the Triolein agar plate, E. coli Rosetta (DE3) and BL21 (DE3) harboring pET51b+/LIP2 transformants formed an intense blue color around the colonies. The intense blue pigmentation was due to the release of free fatty acids
2.4. Detection of LIP2 Lipase Expression by SDS-PAGE
E. coli BL21 Rosetta (DE3) harboring pET51b+/LIP2 were chosen among the other host strains as it was able to express higher amount of LIP2 lipase. Crude lysate was prepared to analyze the protein expression on sodium dodecyl sulphate-polyacrylamide gel electrophoresis (SDS-PAGE) and estimate the molecular weight of LIP2 lipase. The supernatant from the centrifuge culture was the extracellular enzyme, while the supernatant of the sonicated pellet was the crude intracellular enzyme (soluble), and the pellet after centrifuge of the sonicated sample was the inclusion body (insoluble). SDS-Page analysis of these three samples is shown in Figure 3a. The LIP2 gene was fused to the Strep-Tag II at N-terminal and His-Tag at C-terminal regions. The molecular weight of fused LIP2 lipase protein was estimated at ~62 kDa by the “www.expasy.org/protparam/” website (accessed on 3 February 2021). As shown in Figure 3, there is a thick band for intracellular crude lysate (soluble) in lane 2 and the inclusion body (insoluble) in lane 3 appeared at ~62 kDa. In this study, intracellular enzymes (soluble form) were used for further investigation.
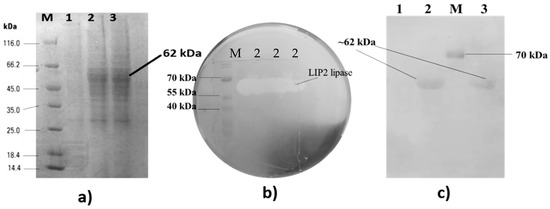
Figure 3.
Detection of LIP2 lipase expression. (a) SDS-PAGE (12%) for the crude lysate of recombinant LIP2 lipase. (b) Activity staining of LIP2 lipase using polyacrylamide gel electrophoresis on a tributyrin agar plate. (c) His-tag staining of LIP2 lipase on polyacrylamide gel electrophoresis (SDS). Lane (1) Extracellular LIP2 from E. coli Rosetta (DE3); Lane (2) Intracellular LIP2 crude lysate (soluble) from E. coli Rosetta (DE3); Lane (3) Inclusion body LIP2 (insoluble) from E. coli Rosetta (DE3); and (M) protein marker (Thermo Fisher scientific, Waltham, Massachusetts, USA)/Positive control for his-tag staining.
2.5. Optimization of Lipase Secretion
Lipase activity was assayed according to Winckler and Stuckman [14] using pNPs as substrates. The LIP2 lipase expression in prokaryotic expression system was studied. The expression of recombinant pET51b+ carrying the LIP2 gene from Elaeis guineensis Jacq. oil palm mesocarp was investigated in various Escherichia coli host strains such as TOP10, BL21 (DE3), BL21 Star (DE3) and BL21 Rosetta (DE3) in terms of their ability to express the gene upon induction as shown in Figure 4a. Meanwhile, the activity LIP2 enzyme was assay using different pNPs with different carbon lengths. The highest amount of lipase expression was obtained using E. coli BL21 Rosetta (DE3) (240.22 U/mL), followed by E. coli BL21 (DE3). E. coli TOP10 and BL21 Star (DE3), which showed lower LIP2 expression as compared to the other hosts. Among the different pNPs substrates, pNP myristate (C14) showed the highest enzyme activity.
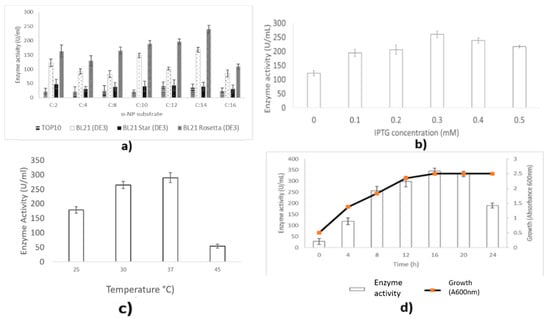
Figure 4.
Optimization of LIP2 lipase production. (a) Effect of host strains on lipase expression. (b) Effect of inducer (IPTG) concentration for LIP2 lipase secretion at A600nm 2.2. (c) Effect of temperature on expression of LIP2 lipase by E. coli Rosetta (DE3) harboring pET51b+/LIP2 at A600nm 2.2. (d) Effect of post-induction times on LIP2 lipase production secretion by E. coli Rosetta harboring pET51b+/LIP2. Error bars indicate standard deviation of means (n = 3). The absence of a bar indicates that errors were smaller than symbols and lines.
The expression of LIP2 lipase using Escherichia coli Rosetta (DE3) harboring the recombinant pET51b/LIP2 vector was investigated by varying the inducer (IPTG) concentrations (0–0.5 mM) as shown in Figure 4b. IPTG at a final concentration of 0.3 mM was the most efficient concertation for LIP2 expression up to 112.71% after 12 h of post induction. Higher inducer concentrations (0.4–0.5 mM) decreased lipase expression, perhaps due to the formation of inclusion bodies.
The effects of temperature on expression of LIP2 lipase are shown in Figure 4c. Cultivation at 37 °C for 12 h resulted in the best lipase production intracellularly, as 278.24 U/mL of lipase activity was detected. The expression of LIP2 by incubation of the recombinant E. coli Rosetta (DE3) at low or high temperatures (20 or 45 °C) decreased to 178.32 and 53.87 U/mL, respectively. E. coli cells are sensitive to the high temperatures, which make them unable to grow or replicate.
The effect of post-induction time on LIP2 lipase expression was investigated by inducing the culture media induced with a final concentration of 0.3 mM of IPTG at 37 °C up to 24 h (Figure 4d). Initially, lipase activity increased as the exponential growth phase started from 4 h to 12 h. Induction with IPTG readily could activate the tac promoter of recombinant plasmid pET51b+ even at 4 h of induction. The highest amount of LIP2 lipase activity (298.33 U/mL) was detected in the after 12 h of post induction. However, the expression of LIP2 reached the maximum level (345.34 U/mL) at 16 h post-induction, which corresponded to the stationary growth phase for the culture. The enzyme activity was decreased by prolonging the incubation time.
2.6. Purification of LIP2 Lipase
Escherichia coli Rosetta harboring pET51b+/LIP2 plasmid was used to overexpress the recombinant LIP2 lipase under the control of T7 promoter. The crude lysate LIP2 lipase with 6X histidines was prepared in a soluble form allowing for rapid purification of the recombinant protein. The addition of fusion affinity tags increased the size of LIP2 to ~62 kDa. Enzyme was successfully purified homogenously using XK16 affinity chromatography column (GE Healthcare, Chicago, IL, USA) packed with Nickel Sepharose-HP resin (Figure 5). After the column was equilibrated with a binding buffer, the crude samples were loaded onto the column. Elution was accomplished through the linear gradient of concentration increments of imidazole up to 100%. Higher catalytic activity of the LIP2 lipase was obtained from the eluted fractions. Pooled fractions resulted in 43.75% yield (Table 1). Some proteins were retained in the low-yield fractions and not included in the pooled fractions, resulting in some loss. Pooled fractions had an overall purification of approximately 3.75-fold (Table 1).
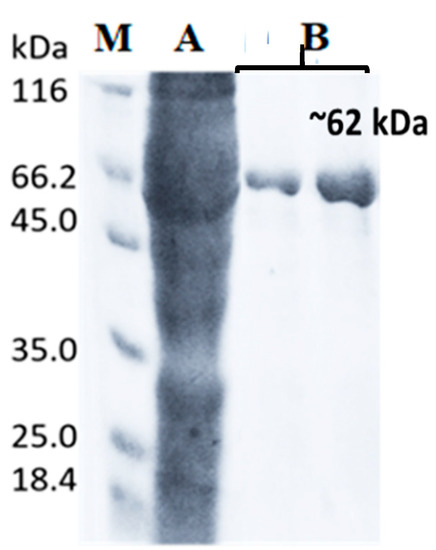
Figure 5.
SDS-PAGE profile of recombinant LIP2 lipase. (M) Protein molecular weight marker (Thermo Fisher Scientific, Waltham, MA, USA) (A) Crude LIP2 lysate, (B) Eluted fraction contained purified LIP2 lipase.

Table 1.
Summary of the LIP2 purification procedure.
2.7. Characterization of LIP2 via Biochemical Approach
2.7.1. Effect of Temperature on Lipase Activity and Stability
LIP2 lipase was mainly active between 10 and 60 °C. The activity increases with temperature to a maximum level, then abruptly declines with the further increase of temperature. The optimum temperature for the enzyme is 30 °C (Figure 6a). It remained active at a temperature of 70 °C and above, retaining at least 52.52% of its maximum activity, though it was not preferable.
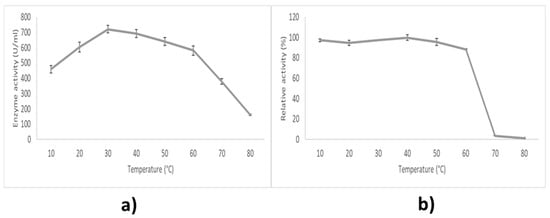
Figure 6.
Effect of temperature on LIP2 lipase. (a) Effect of temperature on lipase activity. The lipase assay was tested at different temperatures (10–80 °C). (b) The effect of temperature on lipase stability. The enzyme was pre-incubated beforehand at various temperatures (10–80 °C) in 30 min. The relative activity was calculated based on the percentage of the highest activity. Error bars indicate standard deviation of means (n = 3). Absence of bar indicates that errors were smaller than the symbols and lines.
The effects of temperature on thermostability of LIP2 were examined in Tris-HCL (pH 9.0) and assayed for 10 min at 30 °C (Figure 6b). The enzyme was pre-incubated for 30 min at different temperatures from 10 °C to 80 °C beforehand. LIP2 lipase was mainly stable between 10 °C until 60 °C, because it can still maintain at least 88.55% of its activity in this temperature range. However, its activity started to deteriorate drastically after incubation at 70 °C, as only 3.71% of its maximal activity remained. At 80 °C, LIP2 lipase almost degraded completely. The results indicate that LIP2 has an adequate thermostability at a low to medium temperature range.
2.7.2. Effect of pH on Lipase Activity and Stability
LIP2 lipase was active from pH 6.0 until pH 11.0, while the optimum pH for the activity was at pH 9.0 in Tris-HCL buffer (Figure 7a). Even so, LIP2 was capable of retaining more than 75% of its maximum activity in an alkaline condition value range from pH 8.0 until pH 10.0. In terms of pH stability, LIP2 was examined in a Tris-HCL buffer (pH 9.0) and assayed for 10 min at 30 °C. The enzyme was pre-incubated for 30 min at a different pH and buffer beforehand. LIP2 was active at pH 6.0 to 11.0 and exhibited the highest stability at pH 10.0 (Figure 7b). However, LIP2 was not able to retain much of its maximum activity at a low pH value range from pH 4.0 to pH 7.0 and a high pH of pH 11.0, respectively.
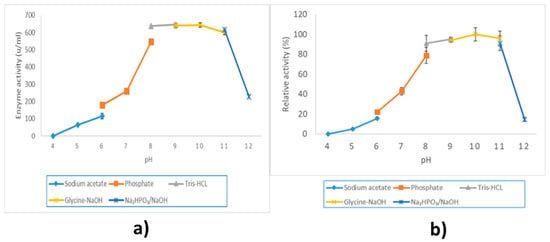
Figure 7.
Effect of pH on LIP2 lipase. (a) Effect of pH on activity. LIP2 lipase was assayed by using a buffer system with a different range of pH. (b) Effect of pH on stability. LIP2 lipase was pre-incubated beforehand using a buffer system with a different range of pH for 30 min. Sodium acetate buffer was used for the pH range of 4.0 to 6.0; potassium phosphate buffer for the pH range of 6.0 to 8.0; Tris-HCL buffer for the pH range of 8.0 to 9.0; glycine-NaOH buffer for the pH range of 9.0 to 11: and Na₂HPO₃/NaOH for the pH range of 11.0 to 12.0. The relative activity was calculated based on the percentage of the highest activity. The error bars indicate standard deviation of means (n = 3). The absence of a bar indicates that errors were smaller than the symbols and the line.
2.7.3. Effect of Metal Ion on Lipase Activity
The effects of various metal ions on the activities of LIP2 is presented in Figure 8. Enzymatic activity of LIP2 lipase was determined in the presence of two different concentrations of metal ions: 5 and 1 mM. Based on the literature, the enzyme activity of the majority of lipases increased by around 1 to 5 mM metal ions and higher concentrations could be toxic to the enzymes [15,16,17]. With the presence of 5 mM concentrations of Mg2+, Mn+, and Ni+, enzyme activity was distinctly enhanced up to 108.05%, 113.26% and 123.16%, respectively. Conversely, Rb+, Cu2+, Ca2+, Na+ and K+, markedly decreased activity to 88.57%, 37.28%, 26.27%, 20.6% and 8.01%. All the tested metal ions at 1 mM concentration decreased the lipase activity except Ca2+. Only in the presence of 1 mM Ca2+ was the activity significantly enhanced, and it increased up to 136.26%. Therefore, these two parameters were used for this condition
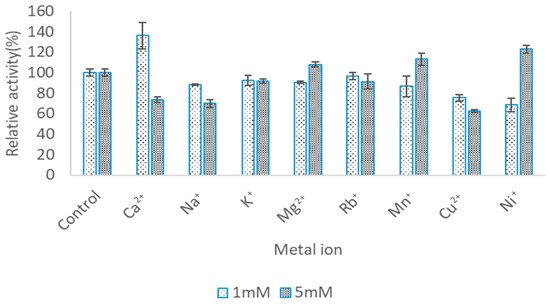
Figure 8.
Effect of metal ion on LIP2 lipase activity. The LIP2 lipase was treated with 1 mM and 5 mM of various metal ions for 30 min. The lipase assay was tested by using pNP myristate as a substrate at 30 °C in Tris-HCL (pH 9.0). The relative activity was calculated based on the percentage of activity for control. Error bars indicate standard deviation of means (n = 3). The absence of a bar indicates that the errors were smaller than symbols and bars.
2.7.4. Effect of Organic Solvents on Lipase Activity
The activities of LIP2 in various organic solvents (25%) were also tested by assaying the treated enzymes for 10 min at 30 °C (Figure 9). The enzyme was pre-incubated for 30 min in the presence of different organic solvents. Classification of organic solvents are dependent on the log P value in the graph (Figure 9). Hydrophilic, organic solvents are mostly categorized with log P < 1 (polar organic solvent) and, on the contrary, with hydrophilic organic solvents (non-polar organic solvent) the log P values are higher (log P > 1). In this case, LIP2 was inhibited by most of the solvents in the presence of DMSO, methanol, acetonitrile, 1-propanol, benzene, toluene, xylene, n-hexane and n-heptane. However, other organic solvents amplified its activity to some extent, and the maximum activity was exhibited in the presence of ethanol by 34.4%, followed by octanol by 30.3%.
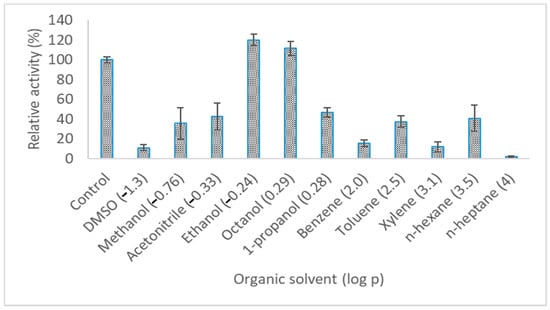
Figure 9.
Effect of organic solvents on LIP2 lipase activity. The LIP2 lipase was treated with various organic solvents for 30 min. The lipase assay was tested by using pNP myristate as a substrate at 30 °C in Tris-HCL (pH 9.0). The relative activity was calculated based on the percentage of activity for control. Error bars indicate standard deviation of means (n = 3). The absence of bar indicates that the errors were smaller than symbols and bars.
2.7.5. Effect of Substrate Specificity on Lipase Activity
Purified recombinant LIP2 lipase was capable to hydrolyze pNP esters, it was active in pNP esters of acyl fatty acid chain lengths ranging from C2 to C14, and showed the optimum activity for C14 pNP myristate. Compared with C8, the relative activities of LIP2 using C10 and C12 as substrates were 71.3% and 63.9%, respectively. The highest activity of LIP2 lipase was observed towards the C14 compared to the other tested pNP esters, while the enzyme showed considerable activity in the presence of short- and medium-chain fatty acids such as C2 and C8 (Figure 10).
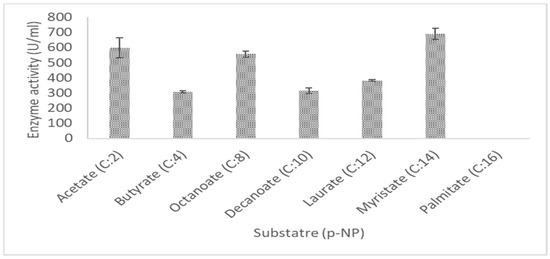
Figure 10.
Substrate specificity of purified LIP2 lipase towards pNP esters. The lipase assay was tested by using various pNP esters as a substrate at 30 °C in Tris-HCL (pH 9.0).
2.8. Circular Dichroism (CD) Spectra Analysis of LIP2 Lipase
2.8.1. Thermal Denaturation Analysis
The fitting lines were derived from the stable region in the range of denaturation (50–70 °C) to determine the Tm value. The Tm value of LIP2 lipase in the transition was 66.3 °C (Figure 11). The Tm measurement of circular dichroism was close to the LIP2 lipase deactivation profile (60 °C). Polypeptide conformations determine protein secondary structures and give rise to circular dichroism spectra. The sigmoidal shape of the resulting denaturation curve indicated a monophasic helix-coil transition of LIP2 lipase within the analyzed temperature range. The CD spectra (molecular ellipticity) of LIP2 lipase was analyzed as a function of temperature at 190–260 nm. The wavelength 222 nm was set to monitor the transition of α-helical to disoriented structures as they exhibited characteristic signals at this wavelength. The high-tension voltage (HT) value gradually increased until it reached a Tm of LIP2 lipase, and then decreased as the lipase was unfolded above the melting temperature point. This was probably due to the loss of protein secondary structures, followed by the increase of disoriented conformations. High readings of molecular ellipticity at the beginning in lower temperature were probably due to the aggregation of protein. That is why, in thermostability studies (Figure 11), LIP2 tends to have a lower activity at lower temperatures, but still has a considerably high stability.
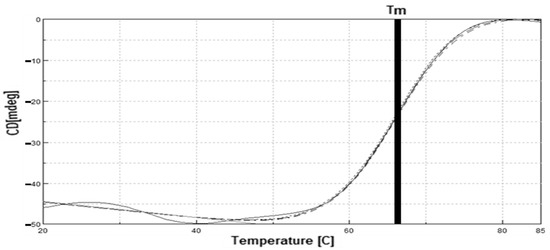
Figure 11.
Tm (Melting temperature) analysis of LIP2. The thick vertical line in the middle indicates the melting point value of LIP2 when tested within the temperature range of 20–85 °C.
2.8.2. Determination of Protein Secondary Structure Analysis
Quantitative analysis of CD spectra allows the prediction of the protein secondary structure content. The CD spectrum of LIP2 was measured in sodium phosphate buffer (pH 10.0) and the secondary structure distribution was determined using the CDSSTR program. The results were analyzed and showed that the secondary structure of LIP2 mostly consists of a random pattern (39.8%) followed by α-helix (30.3%), turns (23.8%) and β-sheet (6.2%) with an RMS of 9.64. This reading indicates that the α-helix from the CD analysis is almost the same as the prediction from the YASARA program, which is 30.93%. However, the reading for the β-sheets deviated, but only by a small margin. The reading of β-sheets from the CD analysis was lower compared to the prediction from YASARA. CD methods allow a good and accurate result for helical secondary structures. This is because the helical structures tend to be very stable, having been proper-defined and give out very strong CD signals, especially long stretches of helical amino acids. Beta-sheet structures tend to be more shifting, with both parallel and antiparallel patterns of adjacent strands, various twists, and low CD signals [18].
3. Discussion
3.1. Predicted LIP2 Structure via Homology Modelling
The α/β hydrolase fold family of enzymes is one of the well-known groups of structurally related enzymes with their various catalytic functions. Most of lipases, like LIP2, have their active site buried under secondary structure elements known as a lid, which must be opened first to change the conformation so that the active site will be exposed to the substrates [19]. The catalytic serine amino acid functions as a nucleophile and is deeply buried inside the β-sheets and exhibits less involvement in developing the catalytic triad in the lipase native state. The α/β hydrolase fold lipases usually consist of beta-sheets in the middle surrounded by an alpha-helix-like LIP2 as shown in Figure 2. The active site of LIP2 is covered with an amphipathic lid that creates a hydrophobic environment around the active amino acids and a hydrophilic region within the rare side. It has a nucleophilic histidine amino acid, which is a catalytic triad developed to efficiently operate on substrates with different chemical and physicochemical properties. The lid is capable of opening and extends for the hydrophobic surface around the active site (Figure 2). The substrate molecule was allowed to facilitate in penetrating into the reaction region by the help of a hydrophobic surface surrounding the lipase [20].
For comparison, a CD analysis reading indicates that the α-helix is almost the same with the prediction from the YASARA program, which is 30.93% as mentioned in result 2.2. However, the reading for the β-sheets was deviated but only in small margin with the others. The reading of β-sheets from the CD analysis was lower compared to the prediction from YASARA. CD methods allow a good accurate result for helical secondary structures. This is because the helical structures tend to be very stable, being proper-defined and giving out very strong CD signals, especially long stretches of helical amino acids. Beta-sheet structures tend to be more shifting with both parallel and antiparallel patterns of adjacent strands, various twists, and low CD signals [18].
3.2. Optimization of LIP2 Production
For an efficient expression of LIP2, several parameters were considered for optimization, such as host strains, inducer (IPTG) concentrations, temperatures, and time of induction. In this study, E. coli BL21 Rosetta (DE3) showed the best expression host with the growth temperature of 37 °C and a final concentration of 0.3 mM IPTG after 16 h of post-induction. The highest amount of lipase production (240.22 U/mL) was obtained with E. coli BL21 Rosetta (DE3), since it was designed to enhance the recombinant expression of eukaryotic protein. The strain contains an addition of six tRNAs for rare codons to overcome the codon bias problem. Moreover, proper folding of the disulphide-bond of recombinant protein in cytosolic fraction can be enhanced, since the glutaredoxin reductase and the thioredoxin reductase in Rosetta has been mutated [21]. The strain Bl21 Star has been reported for efficient releasing of recombinant proteins [22,23]. However, it was not suitable to use the pET system for expressing foreign protein, since a less total LIP2 active lipase was expressed. The strain TOP10 was appropriate to be used as a cloning host for propagation in the pET system, while it can be used as an expression host for certain expression vectors. Apparently, the efficiencies of various E. coli strains to produce LIP2 lipase release differed significantly.
Induction of the highest IPTG concentrations can only be increased until 0.3 mM, as values above that will decrease the lipase secretion due to inclusion of body formation. These are initiated by misfolding and accumulation in the cells upon the overproduction of gene products. Although fusion tag protein itself is a considerably soluble protein, it easily forms inclusion bodies when fused with other expressed protein [24]. It has been reported that too much of IPTG uptake into the cells includes the use of proton pumps and will eventually cause an excessive burden to the bacterial cells [25]. Both the synthesis of and the secretion of recombinant protein into culture medium are affected by the cultivation temperature [18,26]. High temperatures cause plasmid instability and promote inclusion body formation for LIP2. Low secretion of recombinant LIP2, as shown in Figure 4c, can be explained by the aggregation reaction being preferred at higher temperatures due to strong hydrophobic interactions of expressed proteins to form insoluble aggregates [27]. Post-induction time of IPTG could be optimized to simultaneously enhance the production and release of recombinant protein [28]. Following the induction, the lipase activity was found to be increased until 16 h, followed by a decline, possibly due to the outgrowth of non-induced cell-containing plasmids [29]. This could be the outcome of instantaneous metabolic unbalance of carbon and energy flows, thus affecting the protein synthesis. The best condition for the LIP2 lipase to be secreted was determined throughout the optimization.
3.3. Purification of LIP2 Lipase
LIP2 lipase was purified homogenously in a single step with the overall purification of approximately 3.75-fold and a 43.75% yield. Not so many studies on mesocarp lipase have been reported before, especially for oil palm mesocarp. However, partial purification has been reported by Abigor et al. [30] and Ngando et al. [10] from the mesocarp themselves. Based on Abigor et al. [30] reports, oil palm mesocarp lipase was partially purified using a combination of ammonium sulphate fractionation, ion exchange and gel filtration chromatography. SDS-PAGE was not used to confirm the homogeneity of the purified lipase, as only the purification table was shown in the report. A three-fold purification was achieved by ammonium sulphate fractionation, ion exchange and gel filtration chromatography with the yield of 25%, 24% and 9% respectively [30]. While Ngando et al. [10] only did a partial delipidation to get rid of the excess lipid (80%) from the mesocarp, no purification detail and SDS-PAGE information was recorded. There are actually contradicting results and differences in the characteristics for the oil palm mesocarp lipase after purification from the LIP2 lipase in all the reports mentioned, especially from Abigor et al. [30] This might be due to differences in the extraction treatments for both of the lipases. However, there have been some reports published regarding the purification of mesocarp lipase other than Elaeis Guineensis. For comparison, one of them succeed in purify Raphia palm mesocarp by 12-fold with 5.79% yield through ion exchange and gel filtration [31].
3.4. Characteristics of LIP2 Lipase
Since LIP2 has been successfully purified homogenously, the pure enzyme can be characterized via a biochemical approach upon the effects of temperature, pH, metal ion, organic solvent, and substrate specificity on its activity or stability. LIP2 lipase works best in moderate temperatures which are neither too hot nor too cold and belong to a mesophilic group. This finding slightly deviates from the reported characteristics of Elaeis guineensis oil palm mesocarp lipase as most of the lipases were active within the temperature range of 16–35 °C. There have been few studies on the effects of temperature, and all of them slightly differ from each other. Abigor et al. [30] research studies found the best temperature for mesocarp lipase to be active was at 30 °C, and the same with LIP2. However, there were contradicting data for Henderson and Osborne [32] and Ngando et al. [10] as they have optimum temperatures of 16 °C and 35 °C, respectively. However, lipase was prepared differently by Henderson and Osborne [32] and Ngando et al. [10], since both of them extracted the enzyme from the mesocarp and purified it in different ways. Not to mention these reports suggested that the production of free fatty acids from lipase was affected by the chilling temperatures in mesocarp tissue during the cold-induced assay. Ruptured oleosomes release more varieties of enzymes and substrates stored in the organelles during cold-induction and may cause indirect disturbance to the lipase assay evaluation.
Additionally, Okunwaye et al. [31] and Samsumaharto [33] did an optimization of the most active activity for the respective raphia palm mesocarp lipase and cocoa mesocarp lipase. The most optimum temperature for the lipases for both of the mesocarps to be active was 40 °C and 30–40 °C, respectively. Mesocarp lipases from plants usually have the same range of optimum temperature, which is around 30–40 °C. While for other Triacylglycerol plant lipase such as castor bean, rice bran, spurge, and papaya, sources have the same range optimum temperature from 20–40 °C, excluding walnut and almond lipase, whereas their optimum is around 70 °C [34,35,36]. However, most of them usually have a rapid decline in activity reaching 50 °C. LIP2 activity can be considered high, at above 40 °C and this characteristic is valuable in industry applications compared with other plant lipases.
The optimum pH for the activity was at pH 9.0 in Tris-HCL buffer and LIP2 was active at pH 6.0 to 11.0, while it exhibited its highest stability at pH 10.0 (Figure 7). In previous studies, Ngando et al. [10] reported that the optimum pH for oil palm mesocarp lipase was pH 9, which is the same as LIP2. Apart from Abigor et al. [30], who found the lipase to prefer a lower pH (pH 9.0), the others reported that the lipase belong to a neutral pH optimum group [32]. Different pHs can affect the state of ionization of acidic or basic amino acids. Acidic amino acids have carboxyl functional groups at their side chains while basic amino acids have amine functional groups at their side chains. Enzyme activity might be inactivated due to the changes of ionization state of the amino acids. The ionic bonds that help to hold the conformational form of the enzyme are disrupted and disoriented. This condition can lead to the changes of shape and charge properties of the substrate, so that it cannot bind to the active site and undergo the catalysis reaction. LIP2 lipase has been shown to be more stable in alkaline conditions and at a high pH compared with other oil palm fruit mesocarp lipase reported by Abigor et al. [30] or Henderson and Osborne [32], which is around pH 6.0 to 9.0 only. In comparison with lipase from other mesocarps such as Raphia palm fruit mesocarp and olive fruit, LIP2 lipase has more superiority in high pH but a lack in lower pH, whereas the other two have a considerably high activity at around pH 4.0–7.0, but a very low activity above pH 9.0 [31,37]. Many plant lipases have the same optimum pH since most of them do not grow in extreme conditions. In comparison with other plant lipase from papaya, castor bean and walnut seed, all of them have the same optimum pH, which is around pH 9.0. However, LIP2 was far more stable in a higher pH compared to them [34,35,36]. While papaya lipase has been applied widely, oil palm mesocarp lipase could be the alternative lipase to be tried and used in industry [38].
In general, metal ions are capable of stabilizing and disrupting the structure of the protein by an ion-mediated increase of hydrogen bonding networks, especially between the αβ-fold [39]. Mg2+, Mn+, and Ni+ at 5 mM concentration distinctly enhanced the LIP2 activity, while Ca2+ at 1 mM concentration significantly enhanced enzyme activity. Calcium ions can cause a stimulatory effect on lipolysis of some lipases [40]. Most of the plant lipase activity was enhanced by Ca2+ and some of them are even calcium-dependent [41]. Metal ions are capable of increasing or decreasing the stability by binding to the enzyme and change the enzyme’s conformation [42]. In this case, metals such as calcium ions at low concentrations could play an important role in providing proper structural conformation to increase enzyme activity. Many previous studies on plant lipase have shown that the lipolytic activity can be enhanced by calcium but not Mg2+ and Mn+ such as lipases from walnuts and almonds [34]. However, rice bran lipase was inhibited by the majority of metal ions [43]. LIP2 has shown a better potential activity in the presence of meta ions compared to the lipases discussed in the literature.
LIP2 was inhibited by most of the solvents, which are in the presence of DMSO, methanol, acetonitrile, 1-propanol, benzene, toluene, xylene, n-hexane, and n-heptane but increased in the presence of ethanol and octanol. Few studies have reported the effects of organic solvent on E. guineensis mesocarp lipase, but hexane was reported to be the most suitable organic solvent for lipase sample preparation from mesocarp [10,44]. Despite this, research regarding the increase of activity showed that lipase from common bacteria such as Pseudomonas sp. strain and Bacillus licheniformis were activated using ethanol as part of an organic solvent [45,46]. The use of organic solvents in enzymatic catalysis has several advantages in water-poor media such as improving the solubility of hydrophobic substrates, a shift in thermodynamic equilibrium to synthesis by hydrolysis and increasing the stability of the enzymes. Even so, the enzyme activity in the organic solvent system was not affected by the log P singularly, but was affected by other reasons such as dielectric constant, dipole moment, hydrogen binding, and polarizability [47]. Nonetheless, there is no sole major contribution to validate any absolute predictive analysis about the catalysis in the presence of organic solvents. All of those reasons are related together, directly and indirectly, in increasing or decreasing the activity of lipase.
LIP2 lipase has the best activity towards the ester-like C14 and no presence of activity at all for C16. However, C2 also shows considerably good affinity on being hydrolyzed by LIP2 lipase. Palm oil mostly consists of palmitic acid, however LIP2 did not responsible in degrading the long-chain fatty acids more than C14. There are few lipase genes expressed in oil palm mesocarp [8,9], and LIP2 as one of them can only degrade below carbon chain C14. This might solve some of the contradicting findings between Henderson and Osborne [32] and Ngando et al., [10] on the different biochemical features debate, as it may be that they were focused in characterizing different lipases in oil palm mesocarp. One of the advantages of a recombinant system is that sole protein or enzymes can be studied separately without interference with others similar proteins or enzymes. The varying substrate specificities are mainly determined by the structure of the specificity pocket, a hole or cleft on the enzyme surface at the active site that accommodates the residues at the N-terminal and C-terminal sides of the scissile peptide bond [47]. Although some substrate binding sites of most enzymes are mainly used, some of them undergo conformational changes on substrate specificities of enzymes. That is why the activity of LIP2 lipase for every substrate differ from each other, even though the varying substrates can be complemented to the enzyme pocket.
4. Materials and Methods
4.1. Structure Prediction via Homology Modelling
The homology of LIP2 lipase was modelled based on templates deposited in Protein Data Bank (PDB), which is closely related to LIP2. YASARA software (Ver. 19.12.28, Bio-Prodict and WHAT IF Foundation, Nijmegen, The Netherlands) was used to generate 3D structure of LIP2 [48]. Structure prediction analysis from YASARA was carried out by using the setting for “hm_build.mcr”. The protein structure predicted was then validated and verified via a Ramachandran plot using PROCHECK (Saves v6.0, PROCHECK, Cambridge, UK) and ERRAT (Saves v6.0, DOE-MBI, CA, USA). PROCHECK is a program that checks the stereochemical quality of a protein structure in the PDB file, in the form of a Ramachandran plot [49], while ERRAT is used to analyze the statistics of value of error function for predicted structure, as calculated by a comparison with statistics from existing highly refined structures.
4.2. PCR Amplification and Construction of the Expression Systems
Synthesis of complementary DNA (cDNA) from total RNA sample was prepared using a SensiFAST cDNA Synthesis Kit (Thermo Fisher Scientific, Waltham, MA, USA) based on the provided protocol. Rt-PCR was carried out for 1 cycle started with primer annealing (25 °C for 10 min), reverse transcription (42 °C for 15 min), and followed by inactivation (85 °C for 5 min). Product from the reaction (cDNA) was used for as template for further PCR reaction. Specific PCR primers for amplification of oil palm mesocarp lipase gene were designed based on mature LIP2 with full ORF. Restriction sites were added to facilitate the binding of LIP2 gene with the pET51b+ vector plasmid. Primers sequences used are 5′ AATTCGGATCCATGCCACCAATC GG ‘3 for forward and 5′ GAAGAATTCCTATGATGGGCTCGCCAG ‘3 for reverse. The reaction conditions used were as follows: 1 cycle (94 °C for 3 min), 30 cycles (94 °C 30 s, 60.5 °C for 30 s, followed by 72 °C for 2 min), and a final cycle of 72 °C for 5 min. Plasmid pET51b+ harboring LIP2 was transformed into E. coli BL21 (DE3), E. coli BL21 Star, E. coli TOP10 and E. coli Rosetta (DE3). Transformants were selected on qualitative screening plates.
4.3. Qualitative Screening of Transformant
Transformants were selected on Tributyrin agar plates based on the ability of the cells to produce the halo zone on the plate. The tributyrin agar plate was a contained LB agar (Difco, Detroit, MI, USA), 1% (v/v) tributyrin with 50 µg/mL ampicillin. The other two specific lipase screening plates were Rhodamine B agar and triolein agar plates. Rhodamine B agar was prepared by homogenizing of LB agar (Difco, Detroit, MI, USA) with 1% (v/v) olive oil in distilled water. The pH was adjusted to pH 7.0 and autoclaved at 121 °C for 15 min. Medium was allowed to cool down and filter sterile Rhodamine B at a final concentration of 0.001% was added into the medium. In a sterile condition, the medium was poured into sterile petri dishes aseptically. The triolein agar medium was prepared by homogenizing the LB agar (Difco, Detroit, MI, USA) with 1% (v/v) triolein in distilled water. The medium was adjusted to pH 7.0 and autoclave at 121 °C for 15 min. Victoria Blue (0.01%) was prepared separately and autoclaved. Then, Victoria Blue was filtered to the medium containing the triolein. In a sterile condition, medium was poured into sterile petri dishes aseptically. Both Rhodamine B agar and triolein agar contained ampicillin at final concentration of 50 µg/mL.
4.4. Preparation of Crude Lysate
Bacterial culture was inoculated into 200 mL LB broth (Difco, Detroit, MI, USA) in 1L bottle and incubated at 37 °C with 200 rpm agitation for 12 h. Culture (50 mL) was centrifuged at 12,000× g for 15 min at 4 °C. The supernatant was analyzed as extracellular LIP2 lipase. The cells pellet was resuspended in an equal volume of 50 mM of sodium phosphate buffer (pH 8.0) prior to sonication (Branson 250 sonifier: output 2, duty cycle 30 and min 2) and cleared by centrifugation (12,000× g, 15 min, 4 °C). The clear crude supernatant was analyzed as intracellular protein (soluble) and the pellet resuspended in the same buffer and analyzed as an inclusion body (insoluble). The intracellular protein was used to measure lipase activity.
4.5. Lipase Assay
Lipase activity was assayed according to Winckler and Stuckman using pNitrophenyl (pNP) myristate (C14) as substrate [14] (Sigma, St. Louis, MO, USA). This assay is a simple and rapid colorimetric method to determine lipase activity by measuring the amount of released 4-Nitrophenol. The total 250 µL of the reaction mixture included 220 µL of 50 mM Sodium phosphate buffer, pH 7.0, 25 µL of 10 mM pNP and 1 µL of intracellular LIP2 enzyme. The reaction mixture was incubated at 37 °C for 10 min in microplate. The absorbance of the mixture was recorded at 410 nm to calculated the lipase activity based on a pNP standard curve. One unit of activity is defined as the rate of 4-Nitrophenol released in 1 min under standard assay conditions.
4.6. Molecular Weight Determination of LIP2 Lipase
The purified fractions that showed lipase activity were pooled and subjected to SDS-PAGE according to the method described by Laemmli [50]. Protein samples were heated at 100 °C for 5 min to get the linear form of protein so they can be in correct size to be compared to the protein ladder during the gel observation. The sample was electrophoresized on a 12% resolving gel (2.5 mL 1.5 M Tris-HCl pH 8.8, 100 µL 10% SDS, 4.4 mL distilled water, 3 mL 12% Bis-acrylamide, 50 µL APS, and 10 µL TEMED) with 6% stacking gel (2.5 mL 0.5 M Tris-HCl pH 6.8, 100 µL 10% SDS, 5.9 mL distilled water, 1.5 mL 1% Bis-acrylamide and 50 µL APS) [50]. Electrophoresis was performed at constant voltage (210 V) at room temperature. Coomassie Brilliant Blue R 250 (Sigma, St. Louis, MO, USA) was used to stain the gel for 10 min, and then the gel was destained with destaining solution. The molecular mass of the protein was estimated using a protein standard marker (Thermo Fisher Scientific, Waltham, MA, USA).
4.7. Activity Staining
The protein samples were not heated in order to preserve the lipase activity. Activity staining was conducted using the same SDS-PAGE analysis protocol, except that the SDS gel was treated with 10% isopropanol for 10 min and then soaked in distilled water for 30 min. The gel was overlaid on tributyrin agar plate and incubated at 30 °C for 30 min [51].
4.8. His-Tag Staining
Further confirmation was carried out using the same SDS-PAGE analysis protocol described as in SDS-PAGE protocol, except that the SDS gel was stained with his-tag staining agent (Thermo Fisher Scientific, Waltham, MA, USA) overnight instead of Coomassie Brilliant Blue R 250 (Sigma, St. Louis, MO, USA) and washed in distilled water for 30 min.
4.9. Optimization of LIP2 Lipase Expression
Lipase expression was optimized by considering several parameters during bacterial growth, including host strains, inducer (IPTG) concentration, temperature, and time of induction. The culture was centrifuged at 12,000× g, 4 °C for 10 min. the pellet was sonicated, the intracellular crude lysate was cleared by centrifugation (12,000× g, 4 °C and 10 min) and used for lipase assay according to Wickler and Stuckman, the method as described in Section 4.4 using pNP myristate (C14) as a substrate [14].
4.9.1. Effect of Host Strains on Lipase Production
Escherichia coli BL21 (DE3), E. coli BL21 Star, E. coli TOP10 and E. coli BL21 Rosetta (DE3) harboring recombinant LIP2 in pET51b+ were tested for the expression in the lipase assay. The cells were induced with 0.1 mM of IPTG at A600nm 0.5 for 12 h. The cleared intracellular cell lysate was obtained after centrifugation (12,000× g, 4 °C, 10 min) and lipase activity was measured using different pNP substrates with different carbon chain lengths: p-nitrophenol acetate (C2), butyrate (C4), octanoate (C8), decanoate (C10), laurate (C12) myristate (C14) and palmitate (C16).
4.9.2. Effect of Inducer Concentration on Lipase Production
Escherichia coli Rosetta harboring recombinant plasmid pET51b+ was induced with different concentrations of IPTG (0.1, 0.2, 0.3, 0.4 and 0.5 mM) at A ~ 0.5 with 12 h induction times. The cleared intracellular cell lysate was obtained after centrifugation (12,000× g, 4 °C, 10 min) and lipase activity was measured.
4.9.3. Effect of Temperature on Lipase Production
Escherichia coli Rosetta harboring recombinant plasmid pET51b+ was cultured at various temperatures (25 °C, 30 °C, 37 °C and 45 °C) for lipase production study. The cells were induced with 0.3 mM of IPTG at A600nm 0.5 for 12 h. The cleared intracellular cell lysate was obtained after centrifugation (12,000× g, 4 °C, 10 min) and lipase activity was measured.
4.9.4. Effect of Post-Induction Times on Lipase Production
Escherichia coli Rosetta (DE3) harboring recombinant plasmid pET51b+ was induced with 0.3 mM of IPTG. Induction times ranging from 0–20 h at 4 h intervals were tested for lipase production study. The cleared intracellular cell lysate was obtained after centrifugation (12,000× g, 4 °C, 10 min) and lipase activity was measured.
4.10. Purification of LIP2 Lipase
His-tagged recombinant LIP2 lipase was purified using Nickel Sepharose-HP affinity chromatography. The cell pellet was resuspended in binding buffer containing 100 mM phosphate buffer (pH 7.4) with 20 mM imidazole and 0.5 M NaCl. The sonicated cells were centrifuged at 12,000× g, 4 °C for 15 min to clear the crude extract. The crude intracellular enzyme was filtered and subjected to affinity columns XK16 (GE Healthcare, Chicago, IL, USA) that was pre-equilibrated with the binding buffer at a flow rate of 0.1 mL/min. Gradient elution (0–100% of imidazole concentration) was employed to elute the recombinant enzyme using an elution buffer containing 100 mM phosphate buffer with 0.5 M imidazole and 0.5 M NaCl (pH 7.4). The active fractions were pooled together and the protein homogeneity was determined using SDS-PAGE.
4.11. Biochemical Characterization of LIP2
Purified enzyme was subjected to treatments on various parameters such as temperature, pH, metal ions, organic solvents and substrates. Whole biochemical effect studies have been conducted by performing the modified lipase assay from Wickler and Stuckman [14].
4.11.1. Effect of Temperature on Lipase Activity
The effects of temperature on lipase activity were measured by assaying the enzyme reaction mixture at different temperatures in the range of 10 °C to 80 °C with an interval of 10 °C for 10 min using phosphate buffer 50 mM, pH 8.0 and pNP Myristate (Sigma, St. Louis, MO, USA) as substrates.
4.11.2. Effect of Temperature Stability on Lipase Activity
The effects of temperature stability were measured by pre-incubating the enzyme in phosphate buffer 50 mM with pH 8.0, first at different temperatures in the range of 20 °C to 70 °C with the interval of 10 °C for 30 min. The pre-incubated enzyme proceeded with an assay at optimum temperature (30 °C).
4.11.3. Effect of pH on Lipase Activity
The effect of pH on lipase activity was measured using different type of buffer system and pH in lipase assay (Section 4.4). All buffers were prepared by following the ranges of pH 4.0 to pH 12.0 (Sodium-acetate buffer. pH 4.0 to 6.0; Phosphate buffer, pH 6.0 to 8.0, Tris-HCL buffer, pH 8.0 to 9.0; Glycine-NaOH buffer, pH 9.0 To 11.0; Na2HPO3/NaOH, pH 11.0 to 12.0).
4.11.4. Effect of pH Stability on Lipase Activity
The effect of pH stability was determined by the pre-incubation of the enzyme and buffer system the enzyme was pre-incubated for 30 min at different buffer and pH with 5 µL of sample enzymes. Different buffers were prepared in the range of pH 4.0 to pH 12.0 (Sodium-acetate buffer. pH 4.0 to 6.0; Phosphate buffer, pH 6.0 to 8.0, Tris-HCL buffer, pH 8.0 to 9.0; Glycine-NaOH buffer, pH 9.0 To 11.0; Na2HPO3/NaOH, pH 11.0 to 12.0). Different mix reaction vessels were tested with lipase assay (Section 4.4).
4.11.5. Effect of Metal Ion on Lipase Activity
The effect of metal ion was determined by the pre-incubation of the enzyme with 5 mM and 1mM metal ions. Enzymes were pre-incubated with Ca2+, Na+, K+, Mg2+, Rb+, Mn+, Cu2+, Ni+ for 30 min in different reaction mixture vessels followed by lipase assay (Section 4.4).
4.11.6. Effect of Organic Solvent on Lipase Activity
The effect of organic solvents was determined by the pre-incubation of enzymes with 25% v/v different type of organic solvents based on its log p. Enzymes were pre-incubated with DMSO (−1.3), methanol (−0.76), acetonitrile (−0.33), ethanol (−0.24), octanol (0.29), 1-propanol (0.28), benzene (2.0), toluene (2.5), xylene (3.1), n-hexane (3.5), n-heptane (4.0) for 30 min in different reaction vessels each followed by lipase assay (Section 4.4).
4.11.7. Effect of Substrate Specificity on Lipase Activity
The effects of substrate specificity on lipase activity were measured by assaying the enzyme reaction mixture using different substrates based on their carbon chain of pNP-esters according to lipase assay in Section 4.4. The substrates tested are acetate (C2), butyrate (C4), Octanoate (C8), Decanoate (C10), Laurate (C12, Myristate (C14) and palmitate (C16) (Sigma, St. Louis, MO, USA).
4.12. Thermal Denaturation and Secondary Structure Analysis
Lipase UV Circular dichroism (CD) was used to investigate the secondary structure of proteins. CD spectra was measured using JASCO J-810 spectropolarimeter (JASCO, Tokyo, Japan) at 25 °C. The secondary content measurement was conducted from wavelength of 190 to 260 nm on a 1 mm path length. Temperatures have been set to measure the changes of secondary structure from 10 to 100 °C. The protein concentration was 0.1 mg/mL and the 0.1 cm cell path length. The data were collected for every 1 nm (bandwidth) and the date pitch every 0.5 nm. Protein secondary structures content were estimated from the far-UV CD spectra based on CDSSTR program (Dichroweb, London, UK). The thermal denaturation of LIP2 lipase was optimized and measured at 222 nm from 10 °C to 85 °C with 1 °C/min heating rate. Wavelength 222 nm was set to measure α-helical content of the protein. Data collected from higher wavelengths usually have lower absorption. T is defined as a midpoint of sigmoidal melting curves using 0.5 mg/mL protein. The data were collected every 1 degree per min. Data pitch, bandwidth, response, scanning speed and accumulation were set to be 0.1-degree, 1 nm, 1 s, 1 degree per min and 3 times, respectively.
5. Conclusions
LIP2 lipase was successfully expressed into prokaryotic, which is an Escherichia coli microbial recombinant system and purified via single-step affinity chromatography. The work presented has highlighted a process of expressing oil palm mesocarp lipase in an E. coli recombinant expression system to pursue molecular approaches towards gene isolation, high level expression, purification, characterization, homology modelling, and CD analysis. Many plant lipases and their potentials have yet to be discovered compared to the microorganism. These experiments contributed to the problem statement by successfully achieving all the objective activities. The results obtained show that the unique properties and the high stability of LIP2 lipase may provide tremendous economic benefits to many industries such as the pharmaceutical and cosmetics industries due to the biosynthesis of functional lipids, as well as other broad temperature ranges and industrial applications. In the future, more plant enzymes can be studied comprehensively, because the enzymes can be isolated and purified homogenously through microbial recombinant systems. High-level production of well-characterized LIP2 lipase from plant sources have made significant contributions in the biotechnology field and will become more familiar to the scientific community.
Author Contributions
M.H.M.D., A.N. and R.N.Z.R.A.R. conceived and designed the experiments; M.H.M.D. performed the experiments and analyzed the data; M.S.M.A., A.N., M.M. and R.N.Z.R.A.R. helped supervise the project; A.N. and R.N.Z.R.A.R. contributed the materials and analysis tools; M.H.M.D. wrote the paper. All authors have read and agreed to the published version of the manuscript.
Funding
Research was funded by Universiti Putra Malaysia (GP-IPS/2017/9572100) from and SIME DARBY TECHNOLOGY CENTRE (SOID:15789-GD). M.H.M.D. was supported by Graduate Research Fellowship (GRF) fund.
Acknowledgments
The authors thank Sime Darby Technology Centre, and PUTRA IPS. This work was performed at Enzyme and Microbial Technology Research Centre, Faculty of Biotechnology and Biomolecular Sciences, UPM.
Conflicts of Interest
The authors declare no conflict of interest.
References
- Guo, Z.; Xu, X. New opportunity for enzymatic modification of fats and oils with industrial potentials. Org. Biomol. Chem. 2005, 3, 2615–2619. [Google Scholar] [CrossRef] [PubMed]
- Hasan, F.; Shah, A.A.; Hameed, A. Industrial applications of microbial lipases. Enzyme Microb. Technol. 2006, 39, 235–251. [Google Scholar] [CrossRef]
- Seth, S.; Chakravorty, D.; Dubey, V.K.; Patra, S. An insight into plant lipase research—Challenges encountered. Protein Expres. Purif. 2014, 95, 13–21. [Google Scholar] [CrossRef]
- Joshi, R.; Kuila, A. Lipase and their different industrial applications: A review. Braz. J. Biol. Sci. 2018, 5, 237–247. [Google Scholar] [CrossRef]
- Hidayat, C.; Hastuti, P.; Utazmi, S.; Wardhani, A.K.; Pradipta, D.S. Enhancing indigenous lipase activity of germinated Jatropha curcas L. seeds for the enzymatic degradation of phorbol ester. Biocatal. Agric. Biotechnol. 2014, 3, 71–76. [Google Scholar] [CrossRef]
- Melani, N.B.; Tambourgi, E.B.; Silveira, E. Lipases: From production to applications. Sep. Purif. Rev. 2020, 49, 143–158. [Google Scholar] [CrossRef]
- Borrelli, G.M.; Trono, D. Recombinant lipases and phospholipases and their use as biocatalysts for industrial applications. Int. J. Mol. Sci. 2015, 16, 20774–20840. [Google Scholar] [CrossRef] [PubMed]
- Singh, R.; Ong-Abdullah, M.; Low, E.T.L.; Manaf, M.A.A.; Rosli, R.; Nookiah, R.; Azizi, N. Oil palm genome sequence reveals divergence of interfertile species in old and new worlds. Nature 2013, 500, 335–339. [Google Scholar] [CrossRef]
- Ong, A.L.; Teh, C.K.; Mayes, S.; Massawe, F.; Appleton, D.R.; Kulaveerasingam, H. An improved oil palm genome assembly as a valuable resource for crop improvement and comparative genomics in the arecoideae subfamily. Plants 2020, 9, 1476. [Google Scholar] [CrossRef]
- Ngando, E.G.F.; Dhouib, R.; Carrière, F.; Amvam Zollo, P.H.; Arondel, V. Assaying lipase activity from oil palm fruit (Elaeis guineensis Jacq.) mesocarp. Plant. Physiol. Biochem. 2006, 44, 611–617. [Google Scholar] [CrossRef]
- Sambanthamurthi, R.; Sundram, K.; Tan, Y. Chemistry and biochemistry of palm oil. Prog. Lipid Res. 2000, 39, 507–558. [Google Scholar] [CrossRef]
- Demain, A.L.; Vaishnav, P. Production of recombinant proteins by microbes and higher organisms. Biotechnol. Adv. 2009, 27, 297–306. [Google Scholar] [CrossRef]
- Laskowski, R.A.; MacArthur, M.W.; Moss, D.S.; Thornton, J.M. PROCHECK: A program to check the stereochemical quality of protein structures. J. Appl. Crystallogr. 1993, 26, 283–291. [Google Scholar] [CrossRef]
- Winkler, U.K.; Stuckmann, M. Glycogen, hyaluronate, and some other polysaccharides greatly enhance the formation of exolipase by Serratia marcescens. J. Bacteriol. 1979, 138, 663–670. [Google Scholar] [CrossRef] [PubMed]
- Balaji, L.; Jayaraman, G. Metal ion activated lipase from halotolerant Bacillus sp. VITL8 displays broader operational range. Int. J. Biol. Macromol. 2014, 67, 380–386. [Google Scholar] [CrossRef]
- Gaur, R.; Gupta, A.; Khare, S.K. Purification and characterization of lipase from solvent tolerant Pseudomonas aeruginosa PseA. Process Biochem. 2008, 43, 1040–1046. [Google Scholar] [CrossRef]
- Ma, J.; Zhang, Z.; Wang, B.; Kong, X.; Wang, Y.; Cao, S.; Feng, Y. Overexpression and characterization of a lipase from Bacillus subtilis. Protein Expr. Purif. 2006, 45, 22–29. [Google Scholar] [CrossRef] [PubMed]
- Whitmore, L.; Wallace, B.A. Protein secondary structure analyses from circular dichroism spectroscopy: Methods and reference databases. Biopolymers 2008, 89, 392–400. [Google Scholar] [CrossRef]
- Holmquist, M. Alpha Beta-hydrolase fold enzymes structures, functions and mechanisms. Curr. Protein Pept. Sci. 2005, 1, 209–235. [Google Scholar] [CrossRef]
- Mukherjee, A.K. Hydrophobic-hydrophilic interaction in lipase catalytic triad and possibility of a cofactor mediated catalysis. Int. J. Agric. Food Sci. 2014, 4, 84–89. [Google Scholar]
- Rosano, G.L.; Ceccarelli, E.A. Recombinant protein expression in E. coli: Advances and challenges. Front. Microbiol. 2014, 5, 172. [Google Scholar] [CrossRef]
- Chemler, J.A.; Fowler, Z.L.; McHugh, K.P.; Koffas, M.A. Improving NADPH availability for natural product biosynthesis in E. coli by metabolic engineering. Metab. Eng. 2010, 12, 96–104. [Google Scholar] [CrossRef] [PubMed]
- He, W.; Fu, L.; Li, G.; Jones, J.A.; Linhardt, R.J.; Koffas, M. Production of chondroitin in metabolically engineered E. coli. Metab. Eng. 2015, 27, 92–100. [Google Scholar] [CrossRef] [PubMed]
- Frangioni, J.V.; Neel, B.G. Solubilization and purification of enzymatically active glutathione S-transferase (pGEX) fusion proteins. Anal. Biochem. 1993, 210, 179–187. [Google Scholar] [CrossRef] [PubMed]
- Malakar, P.; Venkatesh, K.V. Effect of substrate and IPTG concentrations on the burden to growth of E. coli on glycerol due to the expression of Lac proteins. Appl. Microbiol. Biotechnol. 2012, 93, 2543–2549. [Google Scholar] [CrossRef]
- Aono, R. Cultivation conditions for extracellular production of penicillinase by Escherichia coli carrying pEAP31 on a semi-large scale. Appl. Microbiol. Biotechnol. 1988, 28, 414–418. [Google Scholar] [CrossRef]
- Sørensen, H.P.; Mortensen, K.K. Advanced genetic strategies for recombinant protein expression in E. coli. J. Biotechnol. 2005, 115, 113–128. [Google Scholar] [CrossRef] [PubMed]
- Marbach, A.; Bettenbrock, K. lac operon induction in E. coli: Systematic comparison of IPTG and TMG induction and influence of the transacetylase LacA. J. Biotechnol. 2012, 157, 82–88. [Google Scholar] [CrossRef]
- Kosa, P.; Gavenciakova, B.; Nosek, J. Development of a set of plasmid vectors for genetic manipulations of the pathogenic yeast Candida parapsilosis. Gene 2007, 396, 338–345. [Google Scholar] [CrossRef][Green Version]
- Abigor, D.R.; Opute, F.I.; Opoku, A.R.; Osagie, A.U. Partial purification and some properties of the lipase present in oil palm (Elaeis guineensis) mesocarp. J. Sci. Food Agric. 1985, 36, 599–606. [Google Scholar] [CrossRef]
- Okunwaye, T.; Obibuzor, U.J.; Okogbenin, A.E. Purification and biochemical properties of lipase from raphia palm fruit mesocarp. Afr. J. Biochem. Res. 2015, 9, 73–80. [Google Scholar]
- Henderson, J.; Osborne, D.J. Lipase activity in ripening and mature fruit of the oil palm. Stability in vivo and in vitro. Phytochem. 1991, 30, 1073–1078. [Google Scholar] [CrossRef]
- Samsumaharto, R.A. Partial characterization of lipase from cocoa beans (Theobroma cacao. L.) of clone PBC 159. Indones. J. Chem. 2008, 8, 448–453. [Google Scholar] [CrossRef]
- Yeşiloğlu, Y.; Demirkan, B. Biocatalytic properties of lipase from walnut seed (Juglans regia L.). J. Am. Oil Chem. Soc. 2010, 87, 659–665. [Google Scholar] [CrossRef]
- Su, E.Z.; Zhou, Y.; You, P.Y.; Wei, D.Z. Lipases in the castor bean seed of Chinese varieties: Activity comparison, purification and characterization. J. Shanghai Univ. 2010, 14, 137–144. [Google Scholar] [CrossRef]
- Abdelkafi, S.; Barouh, N.; Fouquet, B.; Fendri, I.; Pina, M.; Scheirlinckx, F.; Carrière, F. Carica papaya lipase: A naturally immobilized enzyme with interesting biochemical properties. Plant. Foods Hum. Nutr. 2011, 66, 34–40. [Google Scholar] [CrossRef]
- Panzanaro, S.; Nutricati, E.; Miceli, A.; De Bellis, L. Biochemical characterization of a lipase from olive fruit (Olea europaea L.). Plant. Physiol. Biochem. 2010, 48, 741–745. [Google Scholar] [CrossRef]
- Gandhi, N.N.; Mukherjee, K.D. Reactivity of medium-chain substrates in the interesterification of tripalmitin catalyzed by papaya lipase. J. Am. Oil Chem. Soc. 2001, 78, 965–968. [Google Scholar] [CrossRef]
- Lee, M.; Kim, J.I.; Na, S.; Eom, K. Metal ions affect the formation and stability of amyloid β aggregates at multiple length scales. Physic. Chem. Chem. Phys. 2018, 20, 8951–8961. [Google Scholar] [CrossRef]
- Khor, H.T.; Tan, N.H.; Chua, C.L. Lipase-catalyzed hydrolysis of palm oil. J. Am. Oil Chem. Soci. 1986, 63, 538–540. [Google Scholar] [CrossRef]
- Pahoja, V.M.; Sethar, M.A. A review of enzymatic properties of lipase in plants, animals and microorganisms. J. Appl. Sci. 2002, 2, 474–484. [Google Scholar]
- Wahab, R.A.; Basri, M.; Rahman, R.N.Z.R.A.; Salleh, A.B.; Rahman, M.B.A.; Leow, T.C. Facile modulation of enantioselectivity of thermophilic Geobacillus zalihae lipase by regulating hydrophobicity of its Q114 oxyanion. Enzym. Microb. Technol. 2016, 93, 174–181. [Google Scholar] [CrossRef] [PubMed]
- Chen, C.C.; Gao, G.J.; Kao, A.L.; Tsai, C.T.; Tsai, Z.C. Two novel lipases purified from rice bran displaying lipolytic and esterification activities. Int. J. Biol. Macromol. 2019, 139, 298–306. [Google Scholar] [CrossRef] [PubMed]
- Cadena, T.; Prada, F.; Perea, A.; Romero, H.M. Lipase activity, mesocarp oil content, and iodine value in oil palm fruits of Elaeis guineensis, Elaeis oleifera, and the interspecific hybrid O × G (E. oleifera × E. guineensis). J. Sci. Food Agric. 2013, 93, 674–680. [Google Scholar] [CrossRef] [PubMed]
- Rahman, R.; Baharum, S.N.; Basri, M.; Salleh, A.B. High-yield purification of an organic solvent-tolerant lipase from Pseudomonas sp. strain S5. Anal. Biochem. 2005, 341, 267–274. [Google Scholar] [CrossRef] [PubMed]
- Malekabadi, S.; Badoei-dalfard, A.; Karami, Z. Biochemical characterization of a novel cold-active, halophilic and organic solvent-tolerant lipase from B. licheniformis KM12 with potential application for biodiesel production. Int. J. Biol. Macromol. 2018, 109, 389–398. [Google Scholar] [CrossRef]
- Kumar, A.; Dhar, K.; Kanwar, S.S.; Arora, P.K. Lipase catalysis in organic solvents: Advantages and applications. Biol. Proc. Online 2016, 18, 1–11. [Google Scholar] [CrossRef]
- Krieger, E.; Vriend, G. YASARA View—molecular graphics for all devices—From smartphones to workstations. Bioinformatics 2014, 30, 2981–2982. [Google Scholar] [CrossRef]
- Ramachandran, G.N.; Ramakrishnan, C.; Sasisekharan, V. Stereochemistry of polypeptide chain configurations. J. Mol. Biol. 1963, 7, 95–99. [Google Scholar] [CrossRef]
- Laemmli, U. Most commonly used discontinuous buffer system for SDS electrophoresis. Nature 1970, 227, 680–686. [Google Scholar] [CrossRef] [PubMed]
- Sommer, P.; Bormann, C.; Götz, F. Genetic and biochemical characterization of a new extracellular lipase from Streptomyces cinnamomeus. Appl. Environ. Microbiol. 1997, 63, 3553–3560. [Google Scholar] [CrossRef] [PubMed]


Publisher’s Note: MDPI stays neutral with regard to jurisdictional claims in published maps and institutional affiliations. |
© 2021 by the authors. Licensee MDPI, Basel, Switzerland. This article is an open access article distributed under the terms and conditions of the Creative Commons Attribution (CC BY) license (http://creativecommons.org/licenses/by/4.0/).