
Redundancy-Free Models for Mathematical Descriptions of Three-Phase Catalytic Hydrogenation of Cinnamaldehyde

Abstract
1. Introduction
2. Results and Discussion
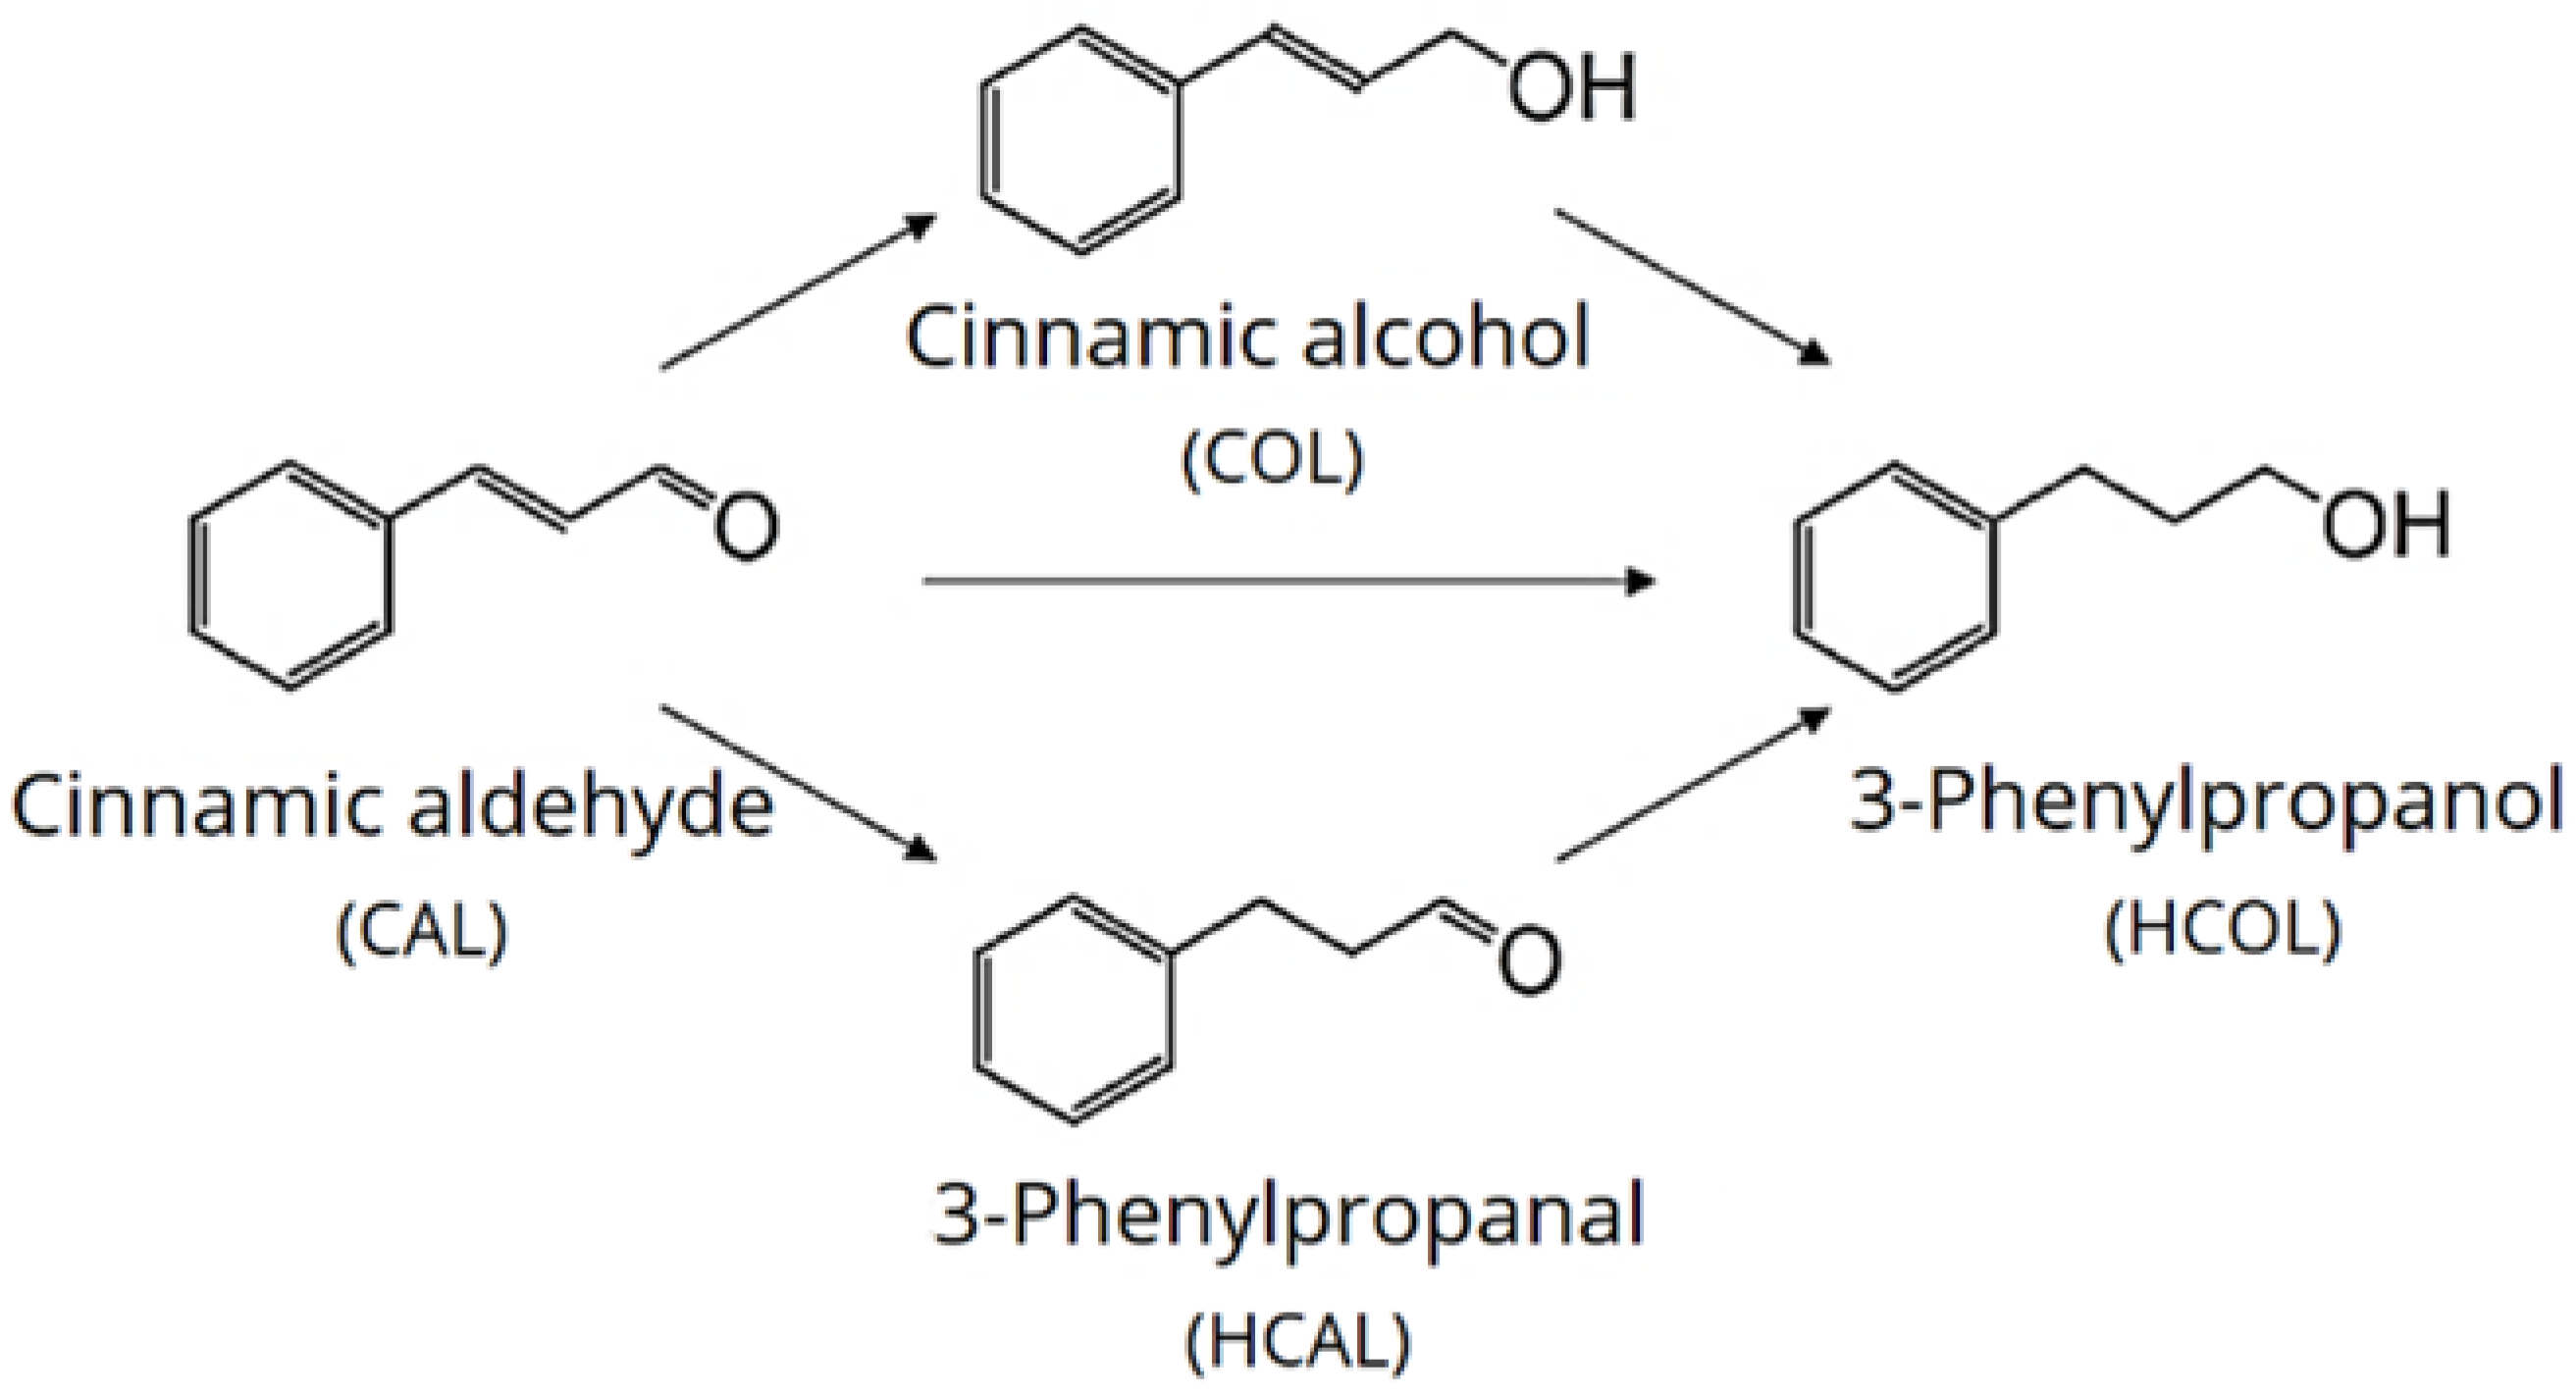
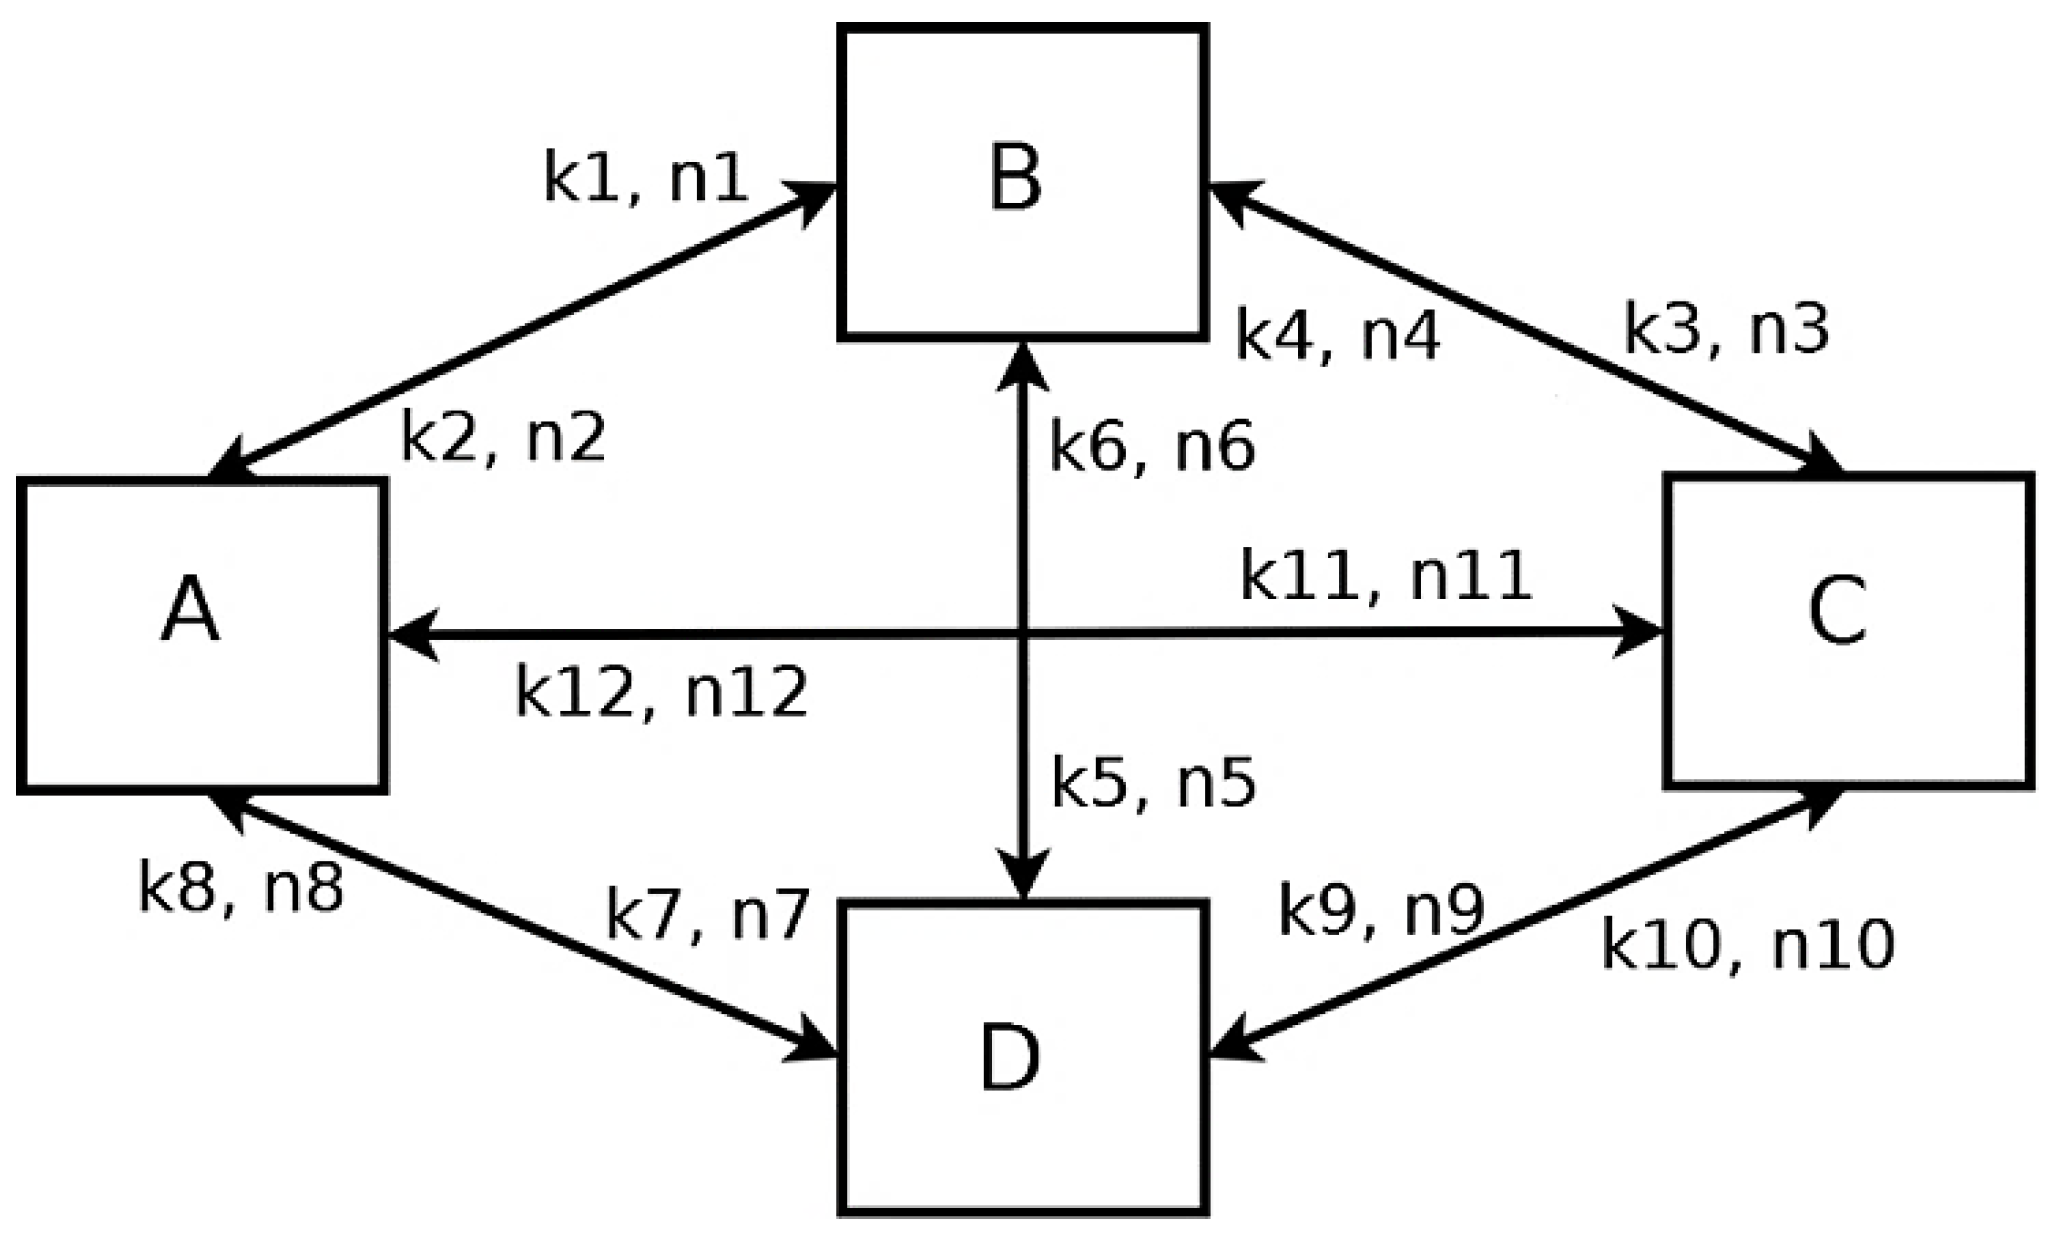
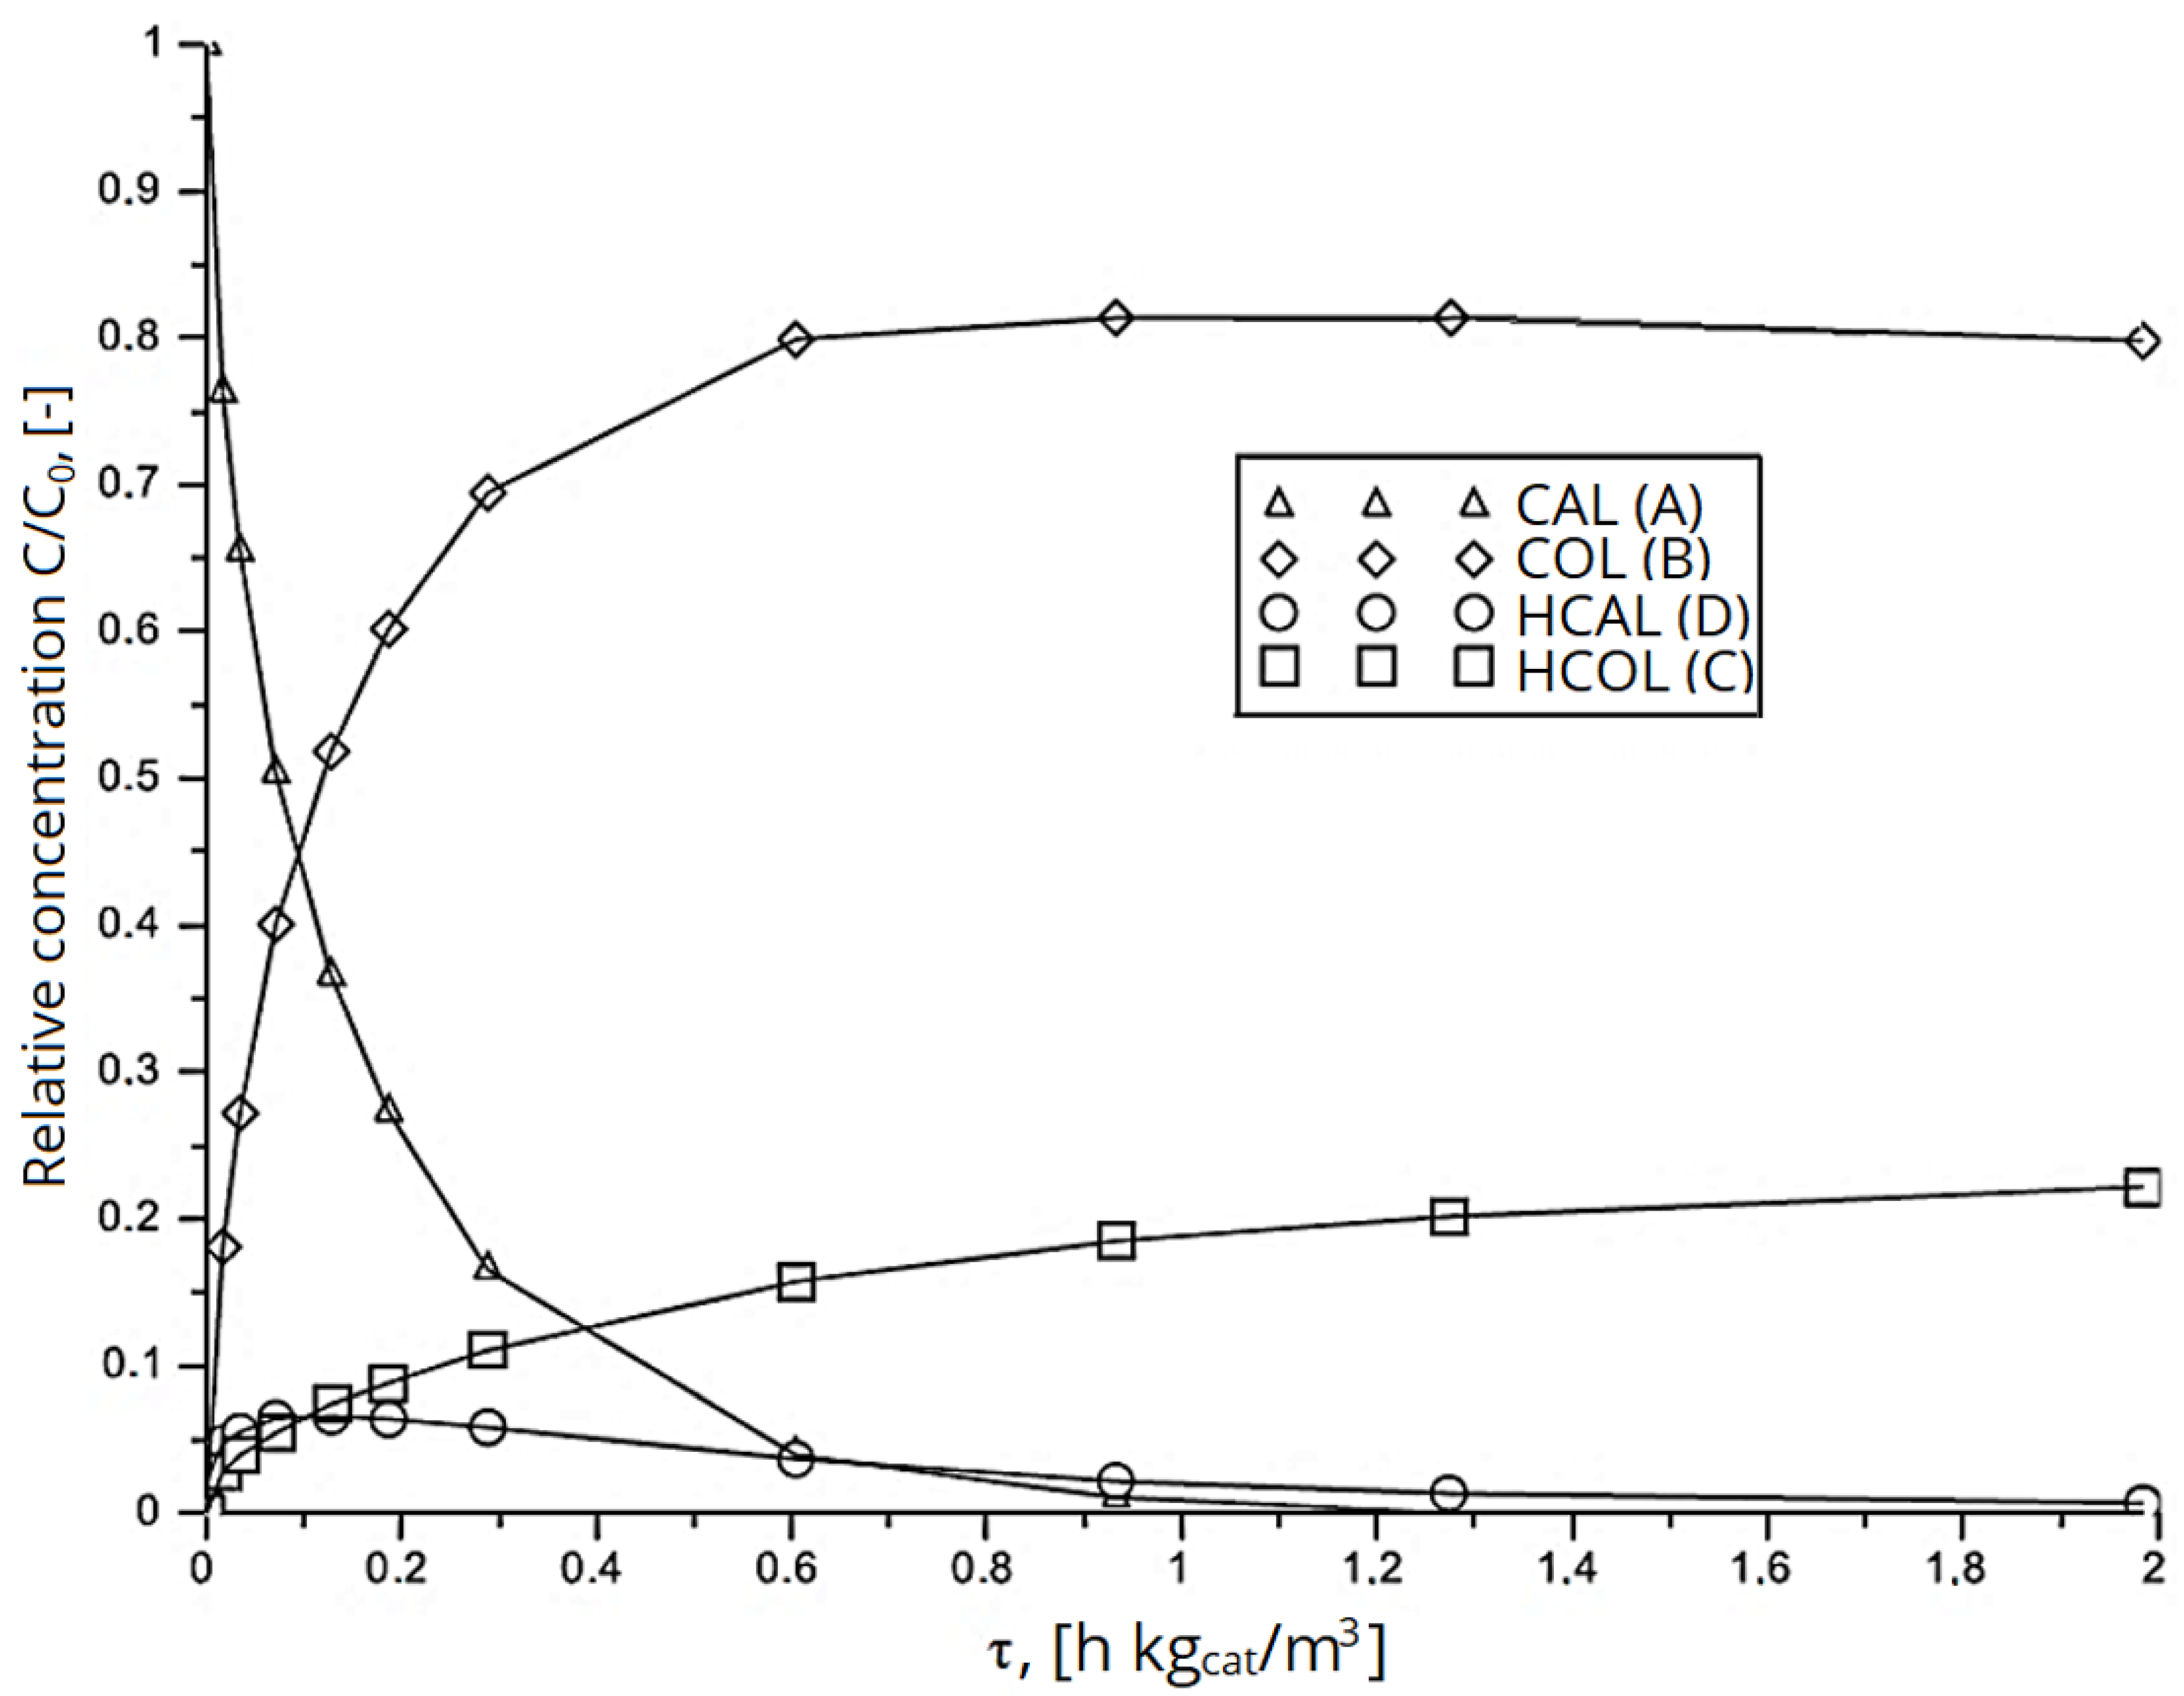
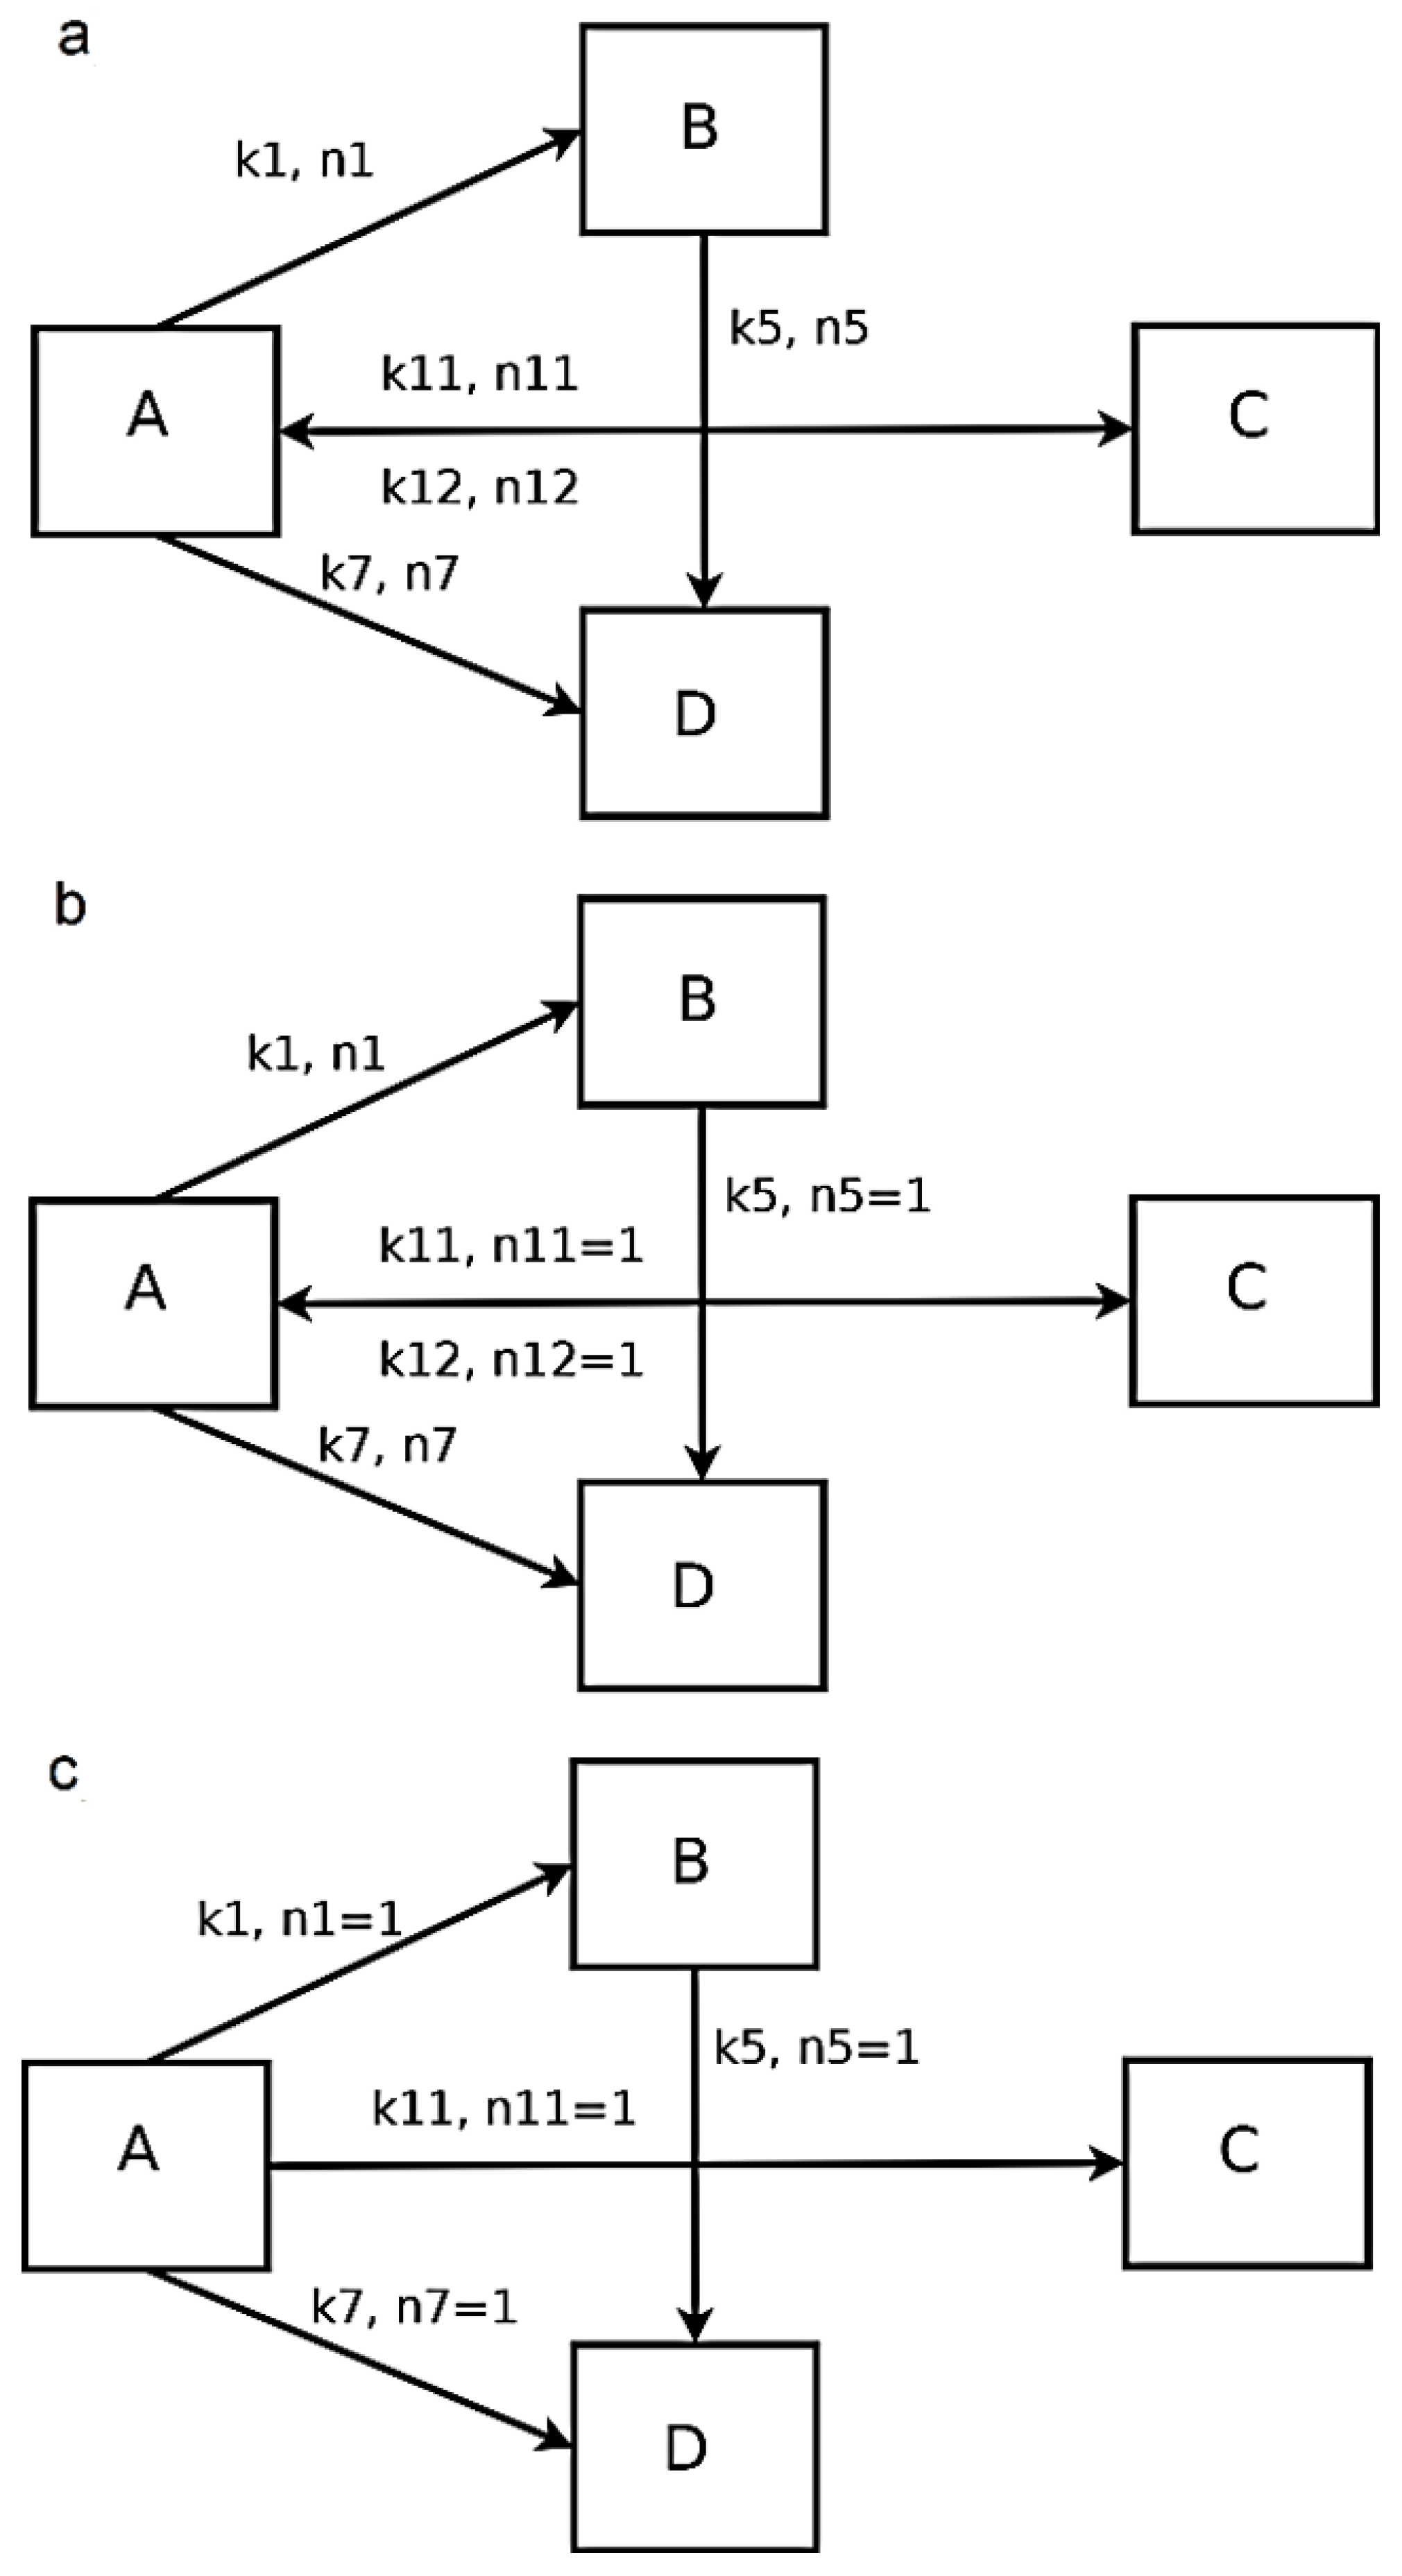
2.1. Formal Kinetic Approach
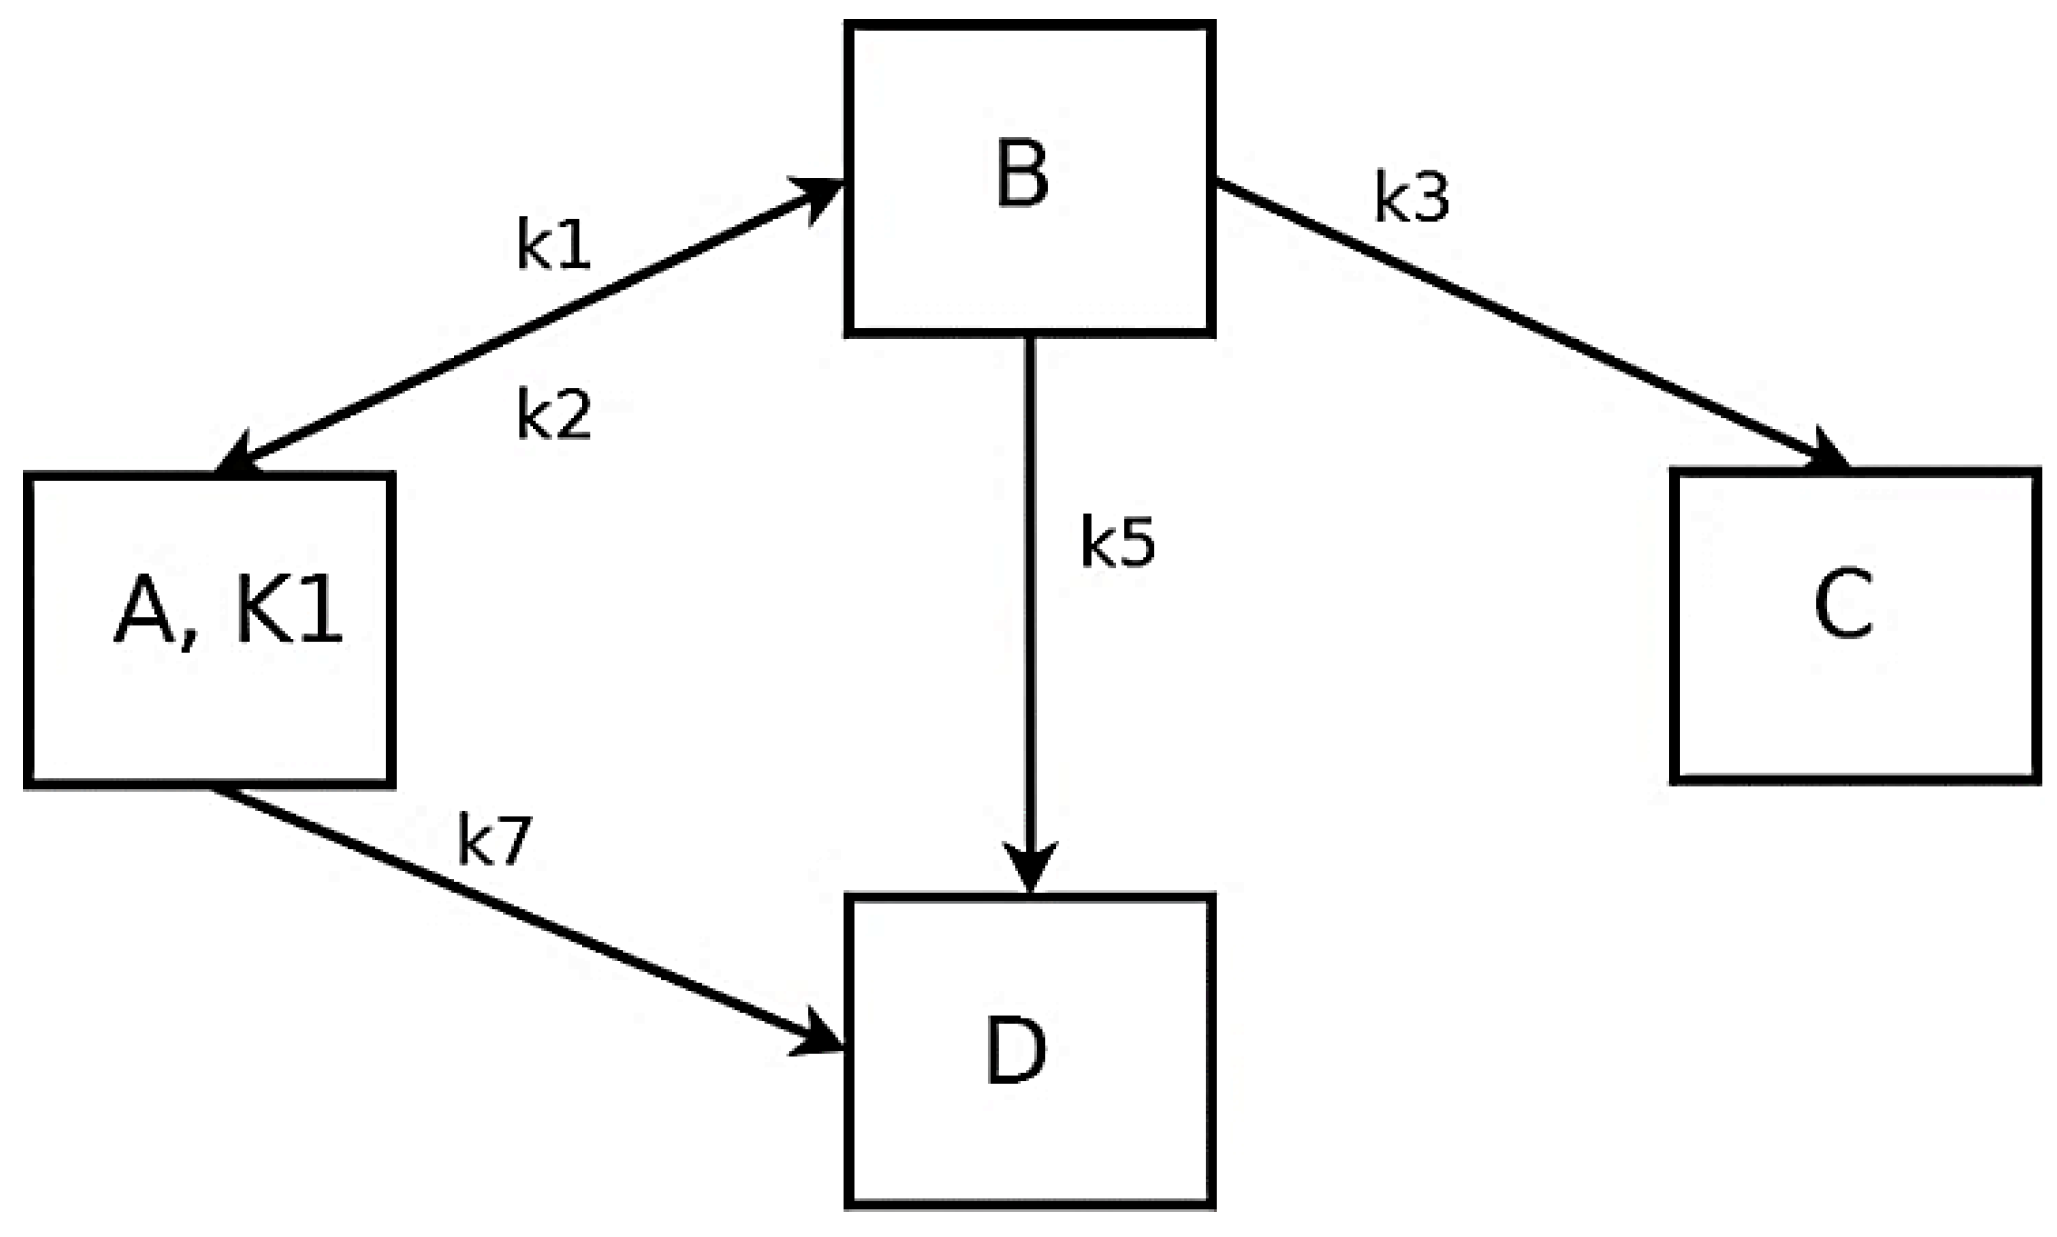
2.2. Kinetic Approach according to Langmuir-Hinshelwood Mechanism
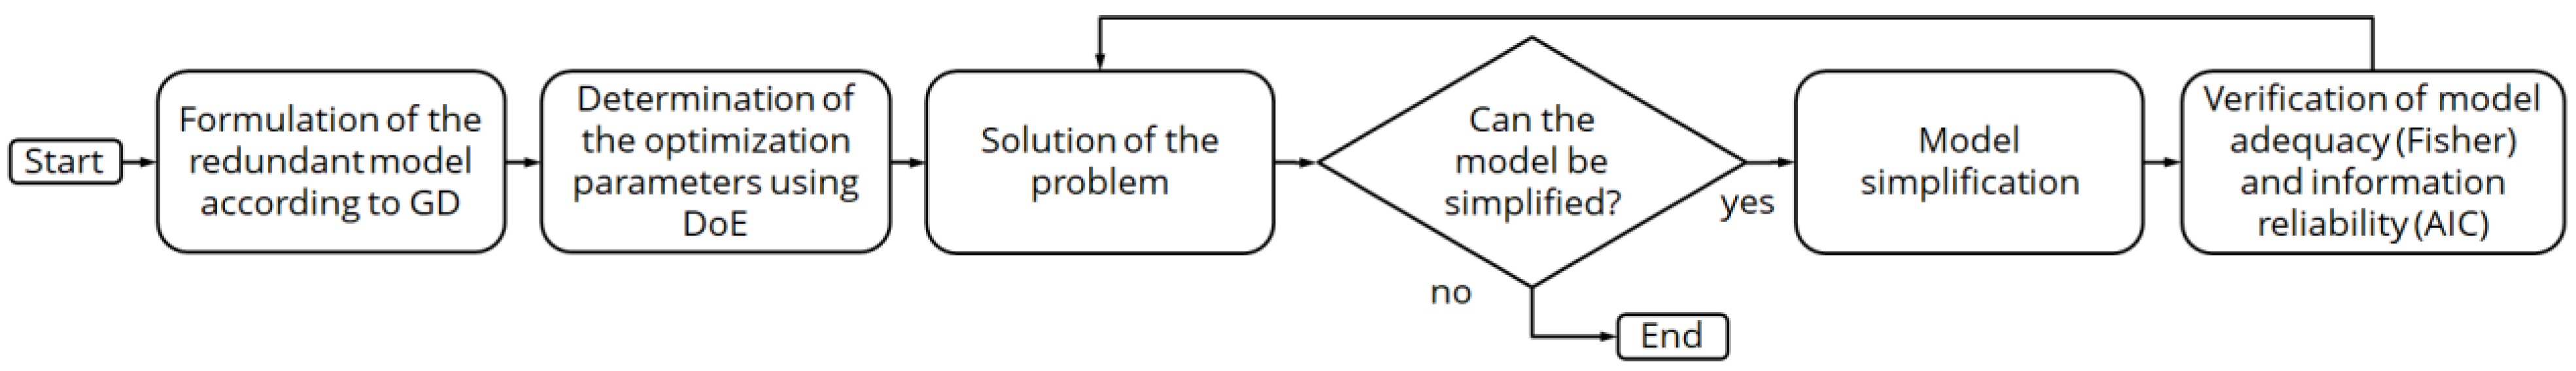
3. Materials and Methods
- Adsorption of organic molecules on the catalyst surface occurs according to Langmuir;
- Hydrogen adsorption does not compete with the adsorption of organic molecules;
- Surface reaction is the rate-determining step;
- Organic molecules are irreversibly hydrogenated;
- Hydrogenation takes place at the so-called active site (single-site model).
4. Conclusions
Funding
Data Availability Statement
Acknowledgments
Conflicts of Interest
References
- Horiuti, J.; Polanyi, M. Exchange reactions of hydrogen on metallic catalysts. Trans. Faraday Soc. 1934, 30, 1164–1172. [Google Scholar] [CrossRef]
- Claus, P. Selective Hydrogenation of α, β-Unsaturated Aldehydes and other C=O and C=C Bonds Containing Compounds. Topics Catal. 1998, 5, 51–62. [Google Scholar] [CrossRef]
- Neri, G.; Bonaccorsi, L.; Galvagno, S. Kinetic Analysis of Cinnamaldehyde Hydrogenation over Alumina-Supported Ruthenium Catalysts. Ind. Eng. Chem. Res. 1997, 36, 3554–3562. [Google Scholar] [CrossRef]
- Toebes, M.L.; Nijhuis, T.A.; Hájek, J.; Bitter, J.H.; van Dillen, A.J.; Murzin, D.Y.; de Jong, K.P. Support effects in hydrogenation of cinnamaldehyde over carbon nanofiber-supported platinum catalysts: Kinetic modeling. Chem. Eng. Sci. 2005, 60, 5682–5695. [Google Scholar] [CrossRef]
- Böttcher, S. Untersuchungen zur Flüssigphasenhydrierung von Zimtaldehyd an Pt-Fe/SiO2-Trägerkatalysatoren. Ph.D. Thesis, Technical University of Dresden, Dresden, Germany, 2013. [Google Scholar]
- Goupil, D.; Fouilloux, P.; Maurel, R. Activity and Selectivity of Pt-Fe/C Alloys for the Liquid-Phase Hydrogenation of Cinnamaldehyde to Cinnamyl Alcohol. React. Kinet. Catal. Lett. 1987, 35, 185–193. [Google Scholar] [CrossRef]
- Tronconi, E.; Crisafulli, C.; Galvagno, S.; Donato, A.; Neri, G.; Pietropaolo, R. Kinetics of Liquid-Phase Hydrogenation of Cinnamaldehyde over a Pt-Sn/Nylon Catalyst. Ind. Eng. Chem. Res. 1990, 29, 1766–1770. [Google Scholar] [CrossRef]
- Bai, Y.; Cherkasov, N.; Huband, S.; Walker, D.; Walton, R.I.; Rebrov, E. Highly Selective Continuous Flow Hydrogenation of Cinnamaldehyde to Cinnamyl Alcohol in a Pt/SiO2 Coated Tube Reactor. Catalysts 2018, 8, 58. [Google Scholar] [CrossRef]
- Borovinskaya, E.S. New approach for the non-redundant modeling of complex chemical reactions. Chem. Ing. Tech. 2018, 90, 666–672. [Google Scholar] [CrossRef]
- Borovinskaya, E.S. Redundanzfreie Modelle zur Mathematischen Beschreibung von Komplexen Reaktionsystemen. Ph.D. Thesis, Technische Universität Dresden, Dresden, Germany, 2019. [Google Scholar]
- Borovinskaya, E.S. Modeling in microreactors. In Microreactors in Preparative Chemistry: Practical Aspects in Bioprocessing, Nanotechnology, Catalysis and More; Reschetilowski, W., Ed.; Wiley-VCH: Weinheim, Germany, 2013. [Google Scholar]
- Saltelli, A.; Chan, K.; Scott, E.M. Sensitivity Analysis; John Wiley & Sons: Chichester, UK, 2008. [Google Scholar]
- Kullback, S.; Leibler, R.A. On Information and Sufficiency. Ann. Math. Stat. 1951, 22, 79–86. [Google Scholar] [CrossRef]
- Burnham, K.P.; Anderson, D.R. Model Selection and Inference: A Practical Information-Theoretic Approach; Springer: Berlin, Germany, 2002. [Google Scholar]
- Akaike, H. A new look at a statistical model identification. IEEE Trans. Autom. Control 1974, 19, 716–723. [Google Scholar] [CrossRef]
- Sugiura, N. Further analysis of the data by Akaike’s information criterion and the finite corrections. Commun. Stat. Theory Methods 1978, A7, 13–26. [Google Scholar] [CrossRef]
- Sakamoto, Y.; Ishiguro, M.; Kitagawa, G. Akaike Information Criterion Statistics; KTK Scientific Publishers: Tokyo, Japan, 1986. [Google Scholar]


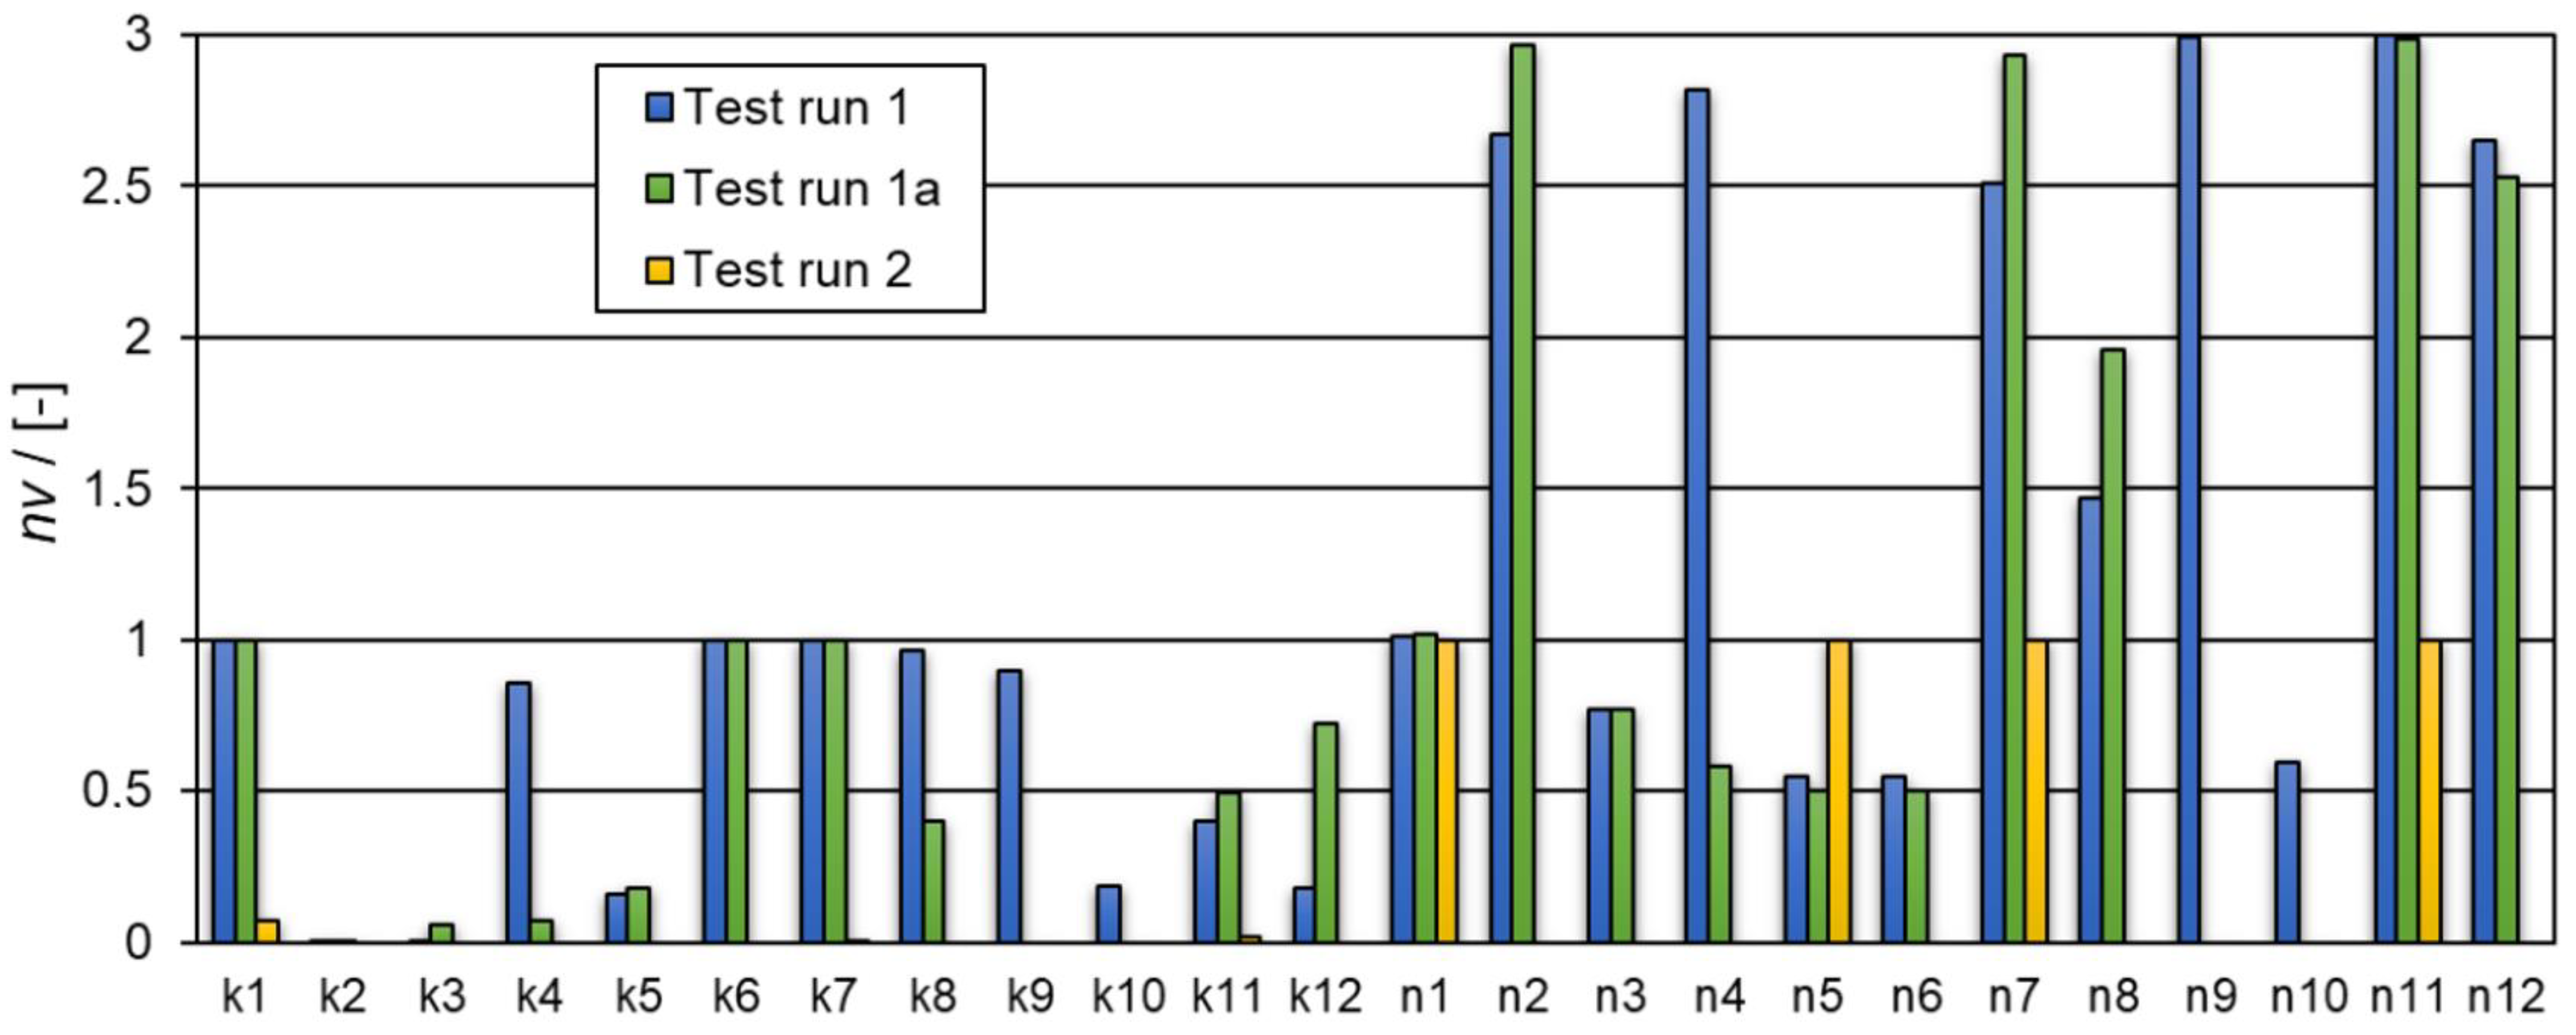
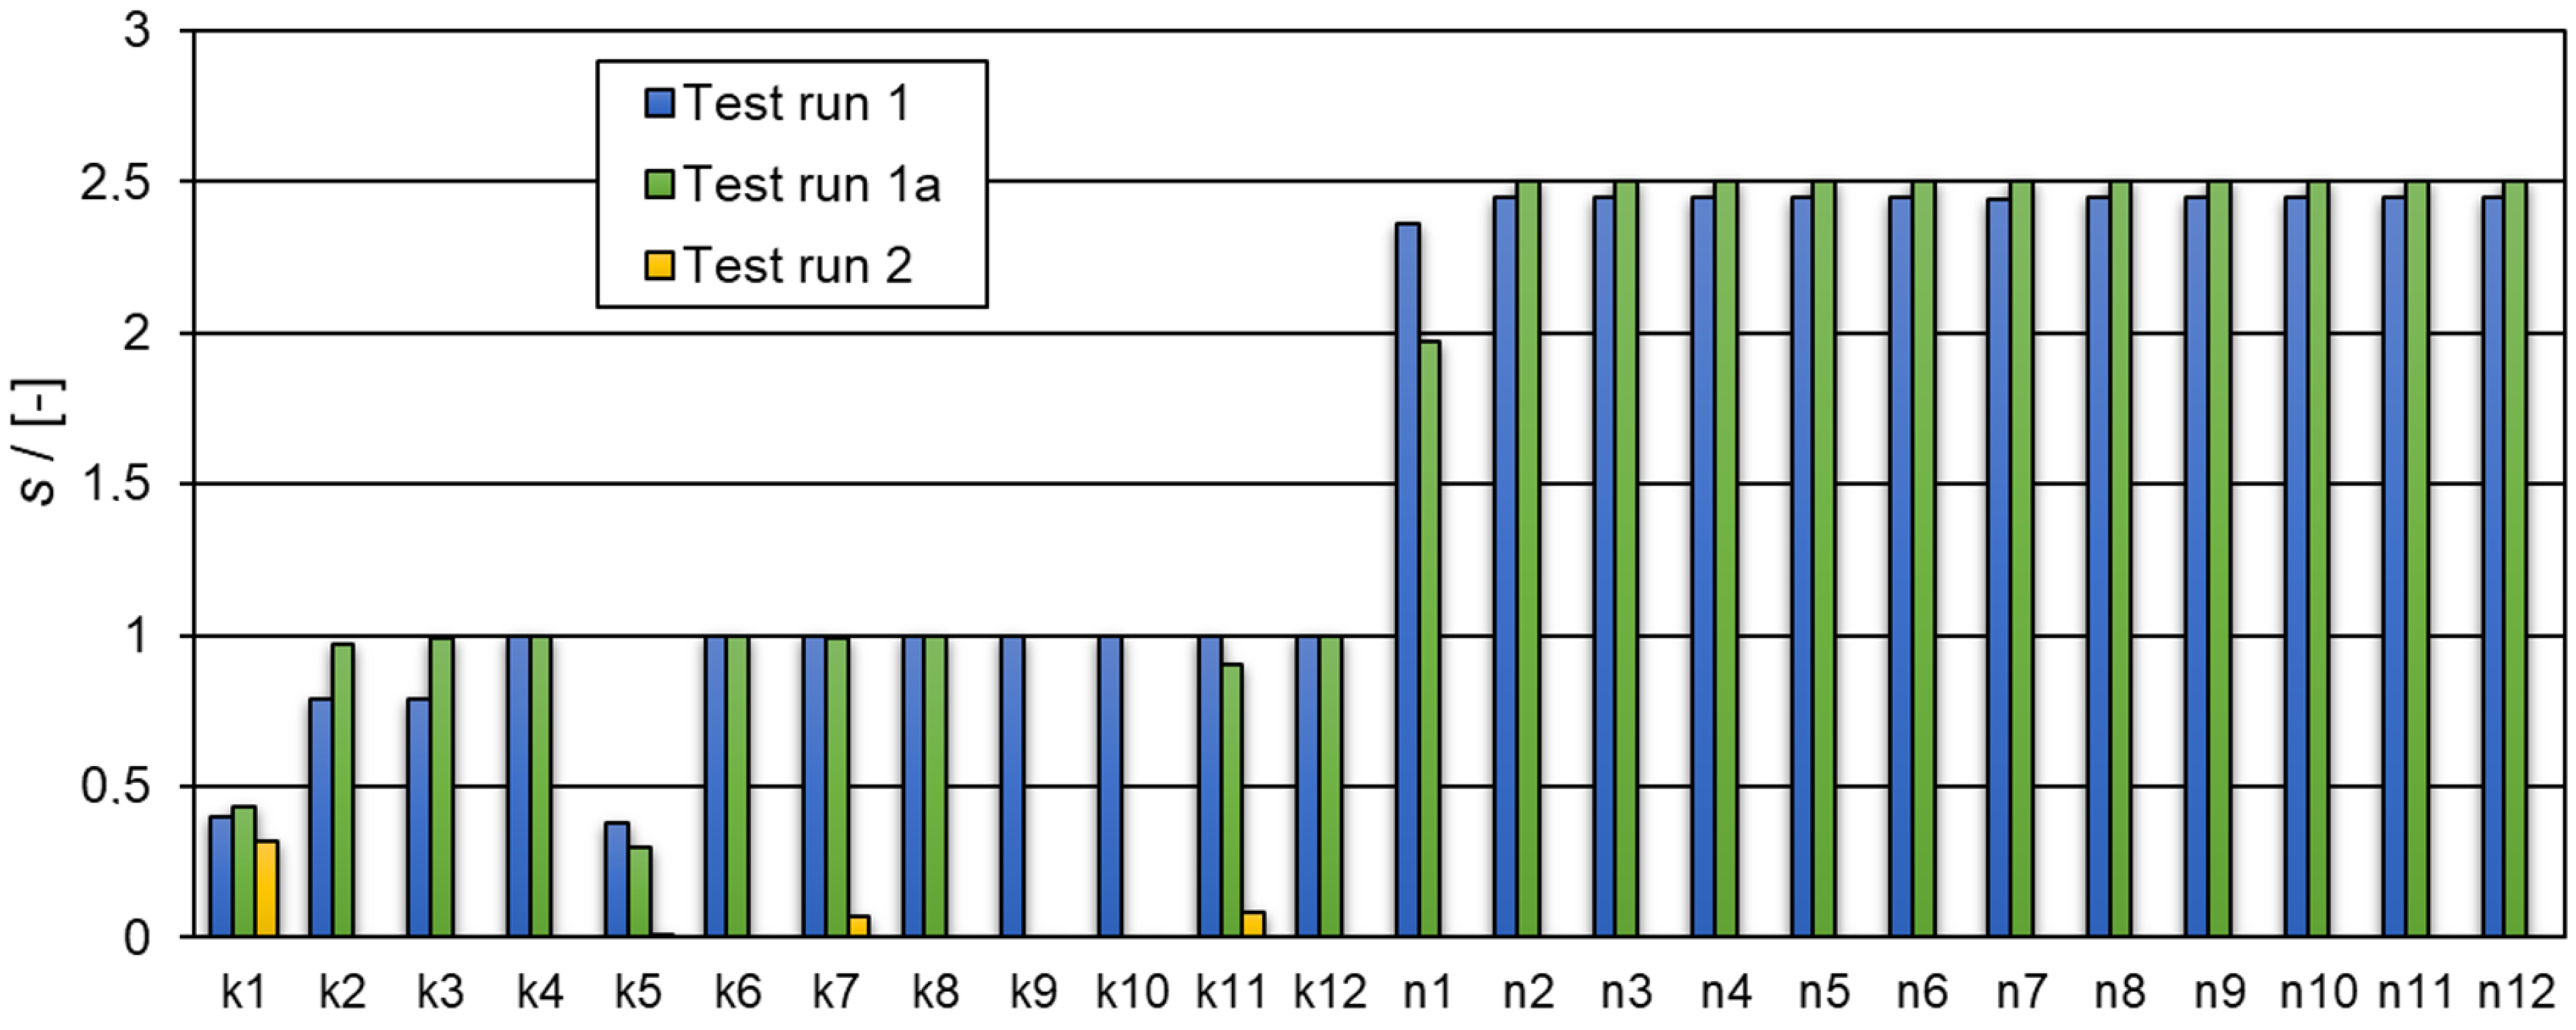
| Solution Interval | Determined Numerical Values for the Kinetic Constants k and Reaction Orders n | Equation Nr. | RSS |
|---|---|---|---|
| Test run 1 | |||
| ki ϵ [0,5], ni ϵ [0.55,3] | k1 = 4.999 k2 = 0.00169 k3 = 0.0289 k4 = 4.299 k5 = 0.798 k6 = 4.999 k7 = 4.999 k8 = 4.834 k9 = 4.496 k10 = 0.913 k11 = 1.997 k12 = 0.885 n1 = 1.008 n2 = 2.672 n3 = 0.769 n4 = 2.815 n5 = 0.550 n6 = 0.550 n7 = 2.508 n8 = 1.471 n9 = 2.995 n10 = 0.596 n11 = 2.999 n12 = 2.650 | (1) | 0.0375 |
| Test run 1a | |||
| ki ϵ [0,5], ni ϵ [0.55,3] | k1 = 4.999 k2 = 0.00003 k3 = 0.274 k4 = 0.370 k5 = 0.886 k6 = 4.999 k7 = 4.999 k8 = 2.000 k11 = 2.472 k12 = 3.626 n1 = 1.019 n2 = 2.967 n3 = 0.772 n4 = 0.581 n5 = 0.500 n6 = 0.502 n7 = 2.935 n8 = 1.958 n11 = 2.983 n12 = 2.529 | (2) | 0.0375 |
| Test run 1b | |||
| ki ϵ [0,5], ni ϵ [0.55,3] | k1 = 4.999 k5 = 0.8526 k6 = 4.999 k7 = 4.999 k8 = 4.960 k11 = 0.996 k12 = 0.00009 n1 = 1.1064 n5 = 0.5038 n6 = 0.5000 n7 = 2.3408 n8 = 1.1094 n11 = 0.828 n12 = 2.994 | - | 0.0402 |
| Test run 1c | |||
| ki ϵ [0;5], ni ϵ [0.55,3] | k1 = 4.999 k5 = 9.638·10−9 k7 = 0.804 k11 = 3.30473 k12 = 3.969·10−5 n1 = 0.722 n5 = 2.844 n7 = 2.999 n11 = 2.695 n12 = 2.219 | (3) | 0.1001 |
| Test run 1d | |||
| ki ϵ [0,5], ni ϵ [0.55,3] | k1 = 4.999 k5 = 6.160 × 10⁻⁹ k7 = 0.211 k11 = 1.349 k12 = 9.394·10−8 n1 = 0.751 n5 = 1 n7 = 2.913 n11 = 1 n12 = 1 | (3) | 0.1103 |
| Test run 1e | |||
| ki ϵ [0,5], ni ϵ [0.55,3] | k1 = 5 k5 = 1.907·10−12 k7 = 0.143 k11 = 1.133 n1 = 1 n5 = 1 n7 = 1 n11 = 1 | (3) | 0.1270 |
| Test run 2 | |||
| ki ϵ [0,100], ni ϵ [0.55,3] | k1 = 6.771 k5 = 3.675 × 10⁻¹² k7 = 0.199 k11 = 1.429 n1 = 1 n5 = 1 n7 = 1 n11 = 1 (the reaction orders n1, n5, n7, n11 were not determined, but assumed to be 1) | (4) | 0.0648 |
| Model- No. | Test Run | RSS | N | |||||
|---|---|---|---|---|---|---|---|---|
| 1 | 1 | 0.0375 | 67.53 | 25 | 43.86 | 116.08 | 110.17 | 0.0000 |
| 2 | 1a | 0.0375 | 67.53 | 21 | 35.86 | 77.86 | 71.95 | 0.0000 |
| 3 | 1b | 0.0402 | 66.86 | 15 | 23.92 | 41.06 | 35.15 | 0.0000 |
| 4 | 1c | 0.1000 | 58.16 | 11 | 16.71 | 24.96 | 19.05 | 0.0000 |
| 5 | 1d | 0.1103 | 57.22 | 8 | 10.80 | 14.91 | 9.00 | 0.0063 |
| 6 | 1e | 0.1270 | 55.87 | 5 | 4.92 | 6.50 | 0.58 | 0.4247 |
| 7 | 2 | 0.0648 | 62.30 | 5 | 4.34 | 5.92 | 0.00 | 0.5689 |
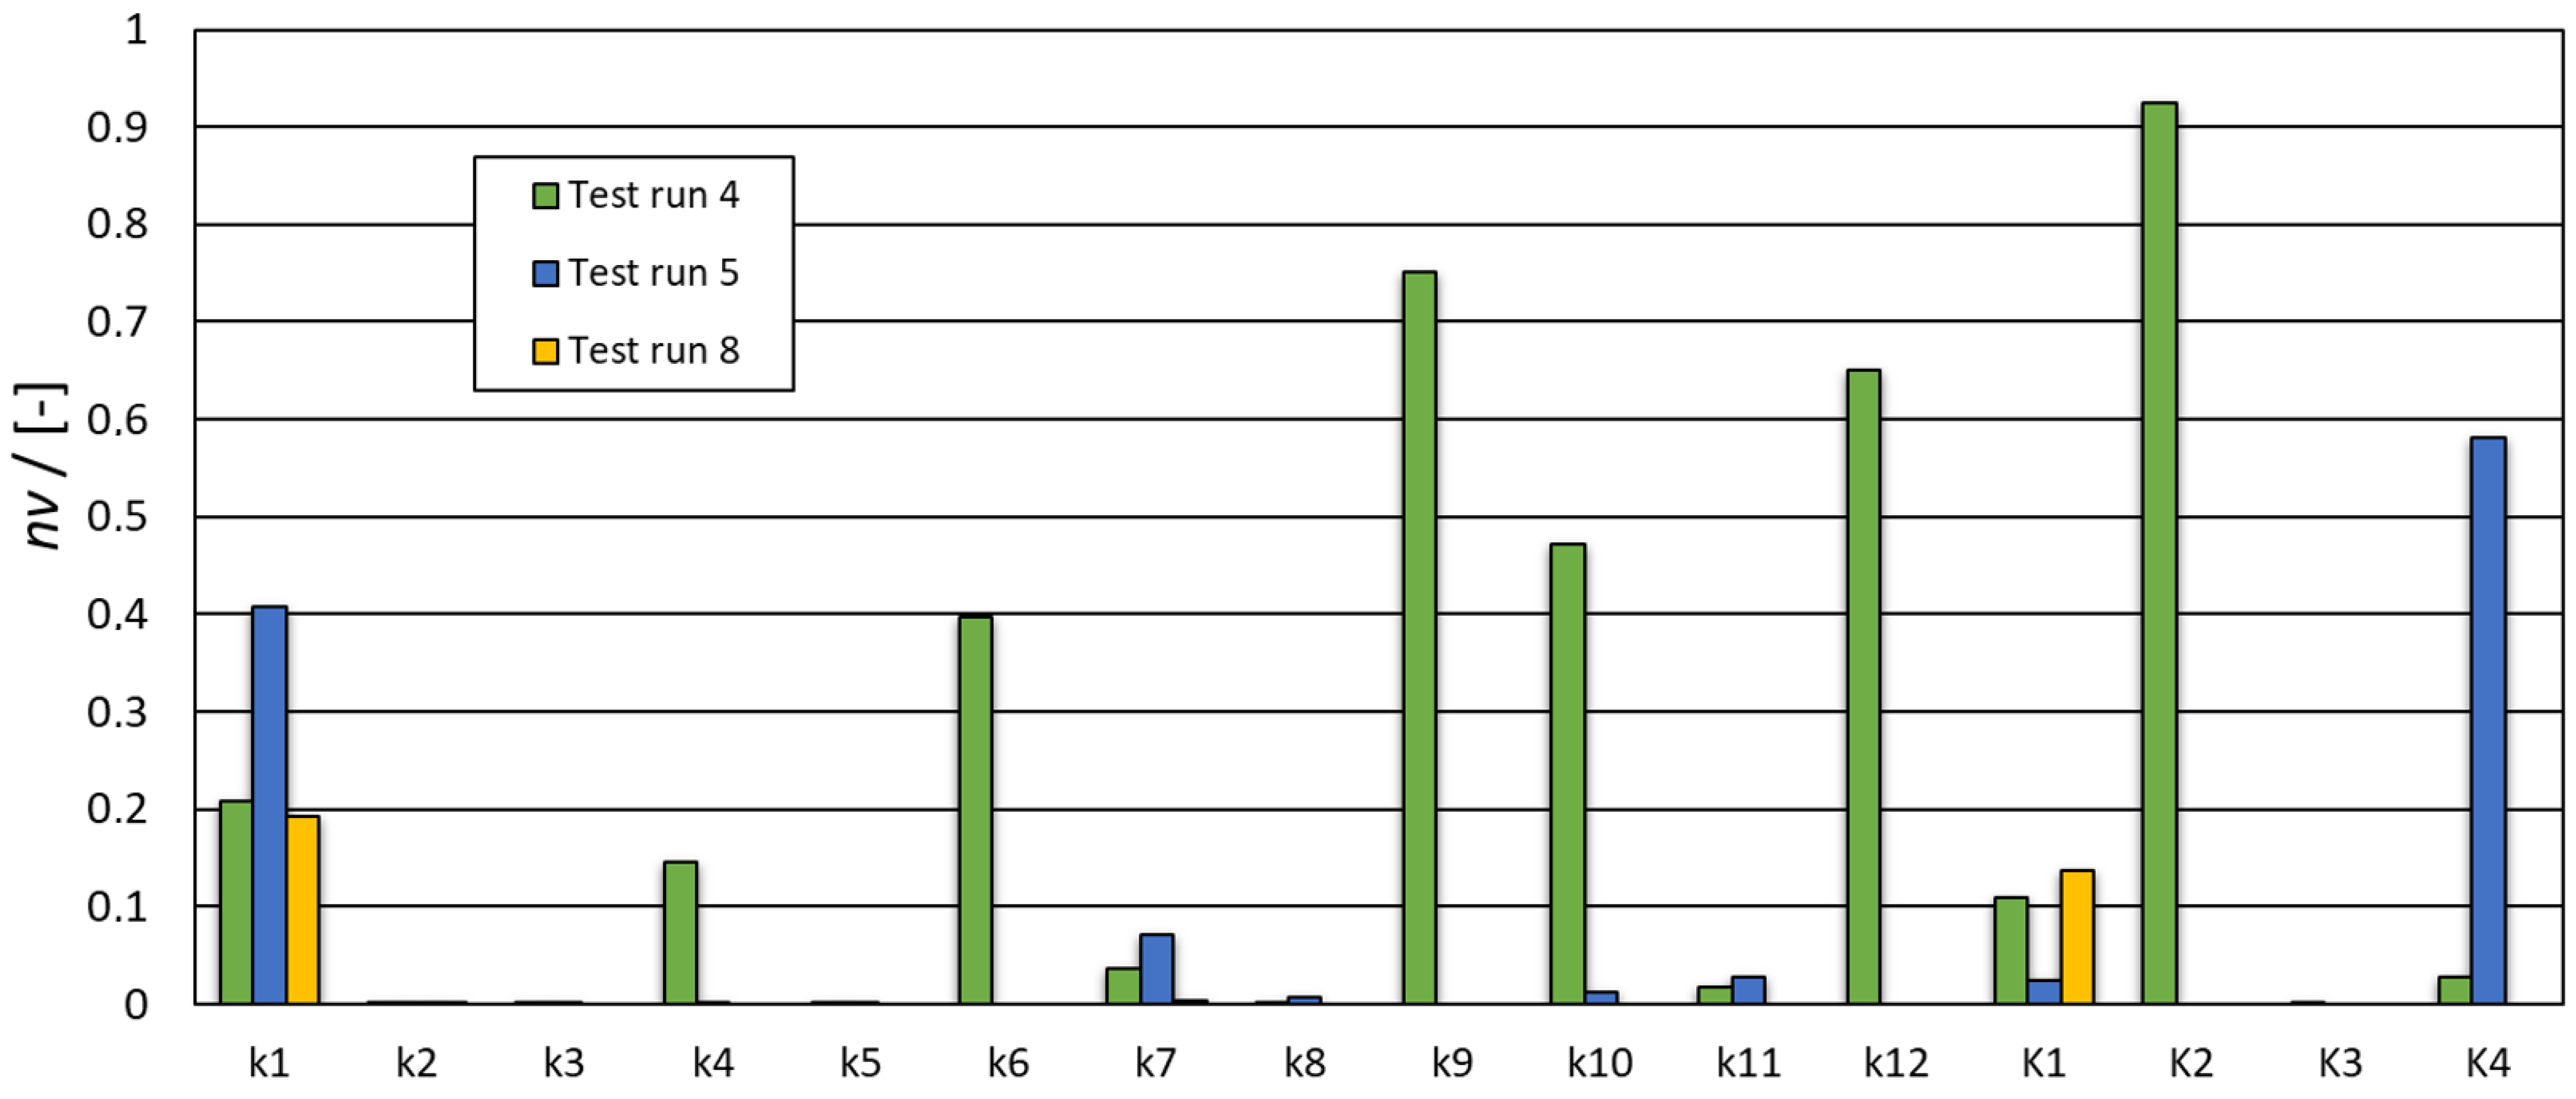
| Solution Interval | Determined Numerical Values for the Model Parameters k and n | Equation Nr. | RSS |
|---|---|---|---|
| Test run 1 | |||
| ϵ [0,1], Ki ϵ [0,1] | k1 = 0.999 k2 = 0.256 k3 = 0.0000 k4 = 0.999 k5 = 0.0233 k6 = 0.999 k7 = 0.999 k8 = 0.0000 k9 = 0.300 k10 = 0.999 k11 = 0.999 k12 = 0.655 K1 = 0.999 K2 = 0.0000 K3 = 0.999 K4 = 0.999 | (1) | 2.8512 |
| Test run 2 | |||
| ϵ [0,5], Ki ϵ [0,5] | k1 = 4.999 k2 = 0.832 k3 = 0.0004 k4 = 0.0937 k5 = 0.0283 k6 = 4.999 k7 = 2.891 k8 = 4.999 k9 = 0.140 k10 = 0.0003 k11 = 1.124 k12 = 0.004 K1 = 4.999 K2 = 1.559 K3 = 2.008 K4 = 4.999 | (1) | 0.1056 |
| Test run 3 | |||
| ϵ [0,10], Ki ϵ [0,10] | k1 = 9.999 k2 = 0.00000118 k3 = 0.188 k4 = 0.702 k5 = 0.259 k6 = 9.999 k7 = 5.441 k8 = 9.999 k9 = 0.0598 k10 = 1.100 k11 = 1.502 k12 = 0.000006 K1 = 4.238 K2 = 9.999 K3 = 9.997 K4 = 7.701 | (1) | 0.0177 |
| Test run 4 | |||
| ϵ [0,100], Ki ϵ [0,100] | k1 = 20.819 k2 = 0.00018 k3 = 0.0146 k4 = 14.641 k5 = 0.0354 k6 = 39.731 k7 = 3.633 k8 = 0.095 k9 = 75.125 k10 = 47.151 k11 = 1.739 k12 = 65.005 K1 = 10.942 K2 = 92.385 K3 = 0.0003 K4 = 2.752 | (1) | 7.965 × 10⁻⁴ |
| Test run 5 | |||
| ϵ [0,100], Ki ϵ [0,100] | k1 = 40.708 k2 = 0.0002 k3 = 0.0057 k4 = 0.1396 k5 = 0.0336 k7 = 7.136 k8 = 0.6578 k10 = 1.1538 k11 = 2.7629 K1 = 2.403 K4 = 58.04589 | (5) | 9.6711·× 10−4 |
| Test run 6 | |||
| ϵ [0,100], Ki ϵ [0,100] | k1 = 91.235 k2 = 5.632·10−7 k3 = 2.795·10−8 k5 = 0.015 k7 = 12.094 k10 = 0.636 k11 = 7.234 K1 = 1.016 K4 = 99.994 | (5) | 9.7681 × 10⁻⁴ |
| Test run 7 | |||
| ϵ [0,100], Ki ϵ [0,100] | k1 = 19.262 k2 = 0.039 k3 = 1.109·10−8 k5 = 6.465 × 10⁻⁹ k7 = 0.332 k10 = 67.251 K1 = 13.854 | (5) | 0.0166 |
| Test run 8 | |||
| ϵ [0,100], Ki ϵ [0,100] | k1 = 19.272 k2 = 0.0392 k3 = 1.364·10−10 k5 = 3.808 × 10⁻⁹ k7 = 0.332 K1 = 13.782 | (5) | 0.0166 |
| Model- No. | Test Run | N | ||||||
|---|---|---|---|---|---|---|---|---|
| 1 | 1 | 2.8512 | 26.15 | 17 | 31.62 | 55.16 | 44.90 | 0.0000 |
| 2 | 2 | 0.1056 | 57.64 | 17 | 28.76 | 52.30 | 42.03 | 0.0000 |
| 3 | 3 | 0.0177 | 74.70 | 17 | 27.21 | 50.75 | 40.48 | 0.0000 |
| 4 | 4 | 7.965 × 10⁻⁴ | 104.33 | 17 | 24.52 | 48.05 | 37.79 | 0.0000 |
| 5 | 5 | 9.6711 × 10⁻⁴ | 102.48 | 12 | 14.68 | 24.75 | 14.48 | 0.0006 |
| 6 | 6 | 9.7681 × 10⁻⁴ | 102.38 | 10 | 10.69 | 17.36 | 7.09 | 0.0230 |
| 7 | 7 | 0.0166 | 75.31 | 8 | 9.15 | 13.27 | 3.00 | 0.1779 |
| 8 | 8 | 0.0166 | 75.31 | 7 | 7.15 | 10.26 | 0.00 | 0.7985 |
Publisher’s Note: MDPI stays neutral with regard to jurisdictional claims in published maps and institutional affiliations. |
© 2021 by the author. Licensee MDPI, Basel, Switzerland. This article is an open access article distributed under the terms and conditions of the Creative Commons Attribution (CC BY) license (http://creativecommons.org/licenses/by/4.0/).
Share and Cite
Borovinskaya, E. Redundancy-Free Models for Mathematical Descriptions of Three-Phase Catalytic Hydrogenation of Cinnamaldehyde. Catalysts 2021, 11, 207. https://doi.org/10.3390/catal11020207
Borovinskaya E. Redundancy-Free Models for Mathematical Descriptions of Three-Phase Catalytic Hydrogenation of Cinnamaldehyde. Catalysts. 2021; 11(2):207. https://doi.org/10.3390/catal11020207
Chicago/Turabian StyleBorovinskaya, Ekaterina. 2021. "Redundancy-Free Models for Mathematical Descriptions of Three-Phase Catalytic Hydrogenation of Cinnamaldehyde" Catalysts 11, no. 2: 207. https://doi.org/10.3390/catal11020207
APA StyleBorovinskaya, E. (2021). Redundancy-Free Models for Mathematical Descriptions of Three-Phase Catalytic Hydrogenation of Cinnamaldehyde. Catalysts, 11(2), 207. https://doi.org/10.3390/catal11020207