
A Study into the γ-Al2O3 Binder Influence on Nano-H-ZSM-5 via Scaled-Up Laboratory Methanol-to-Hydrocarbon Reaction


Abstract
:1. Introduction
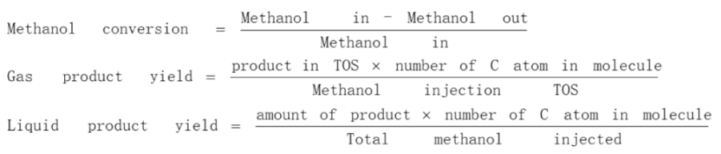
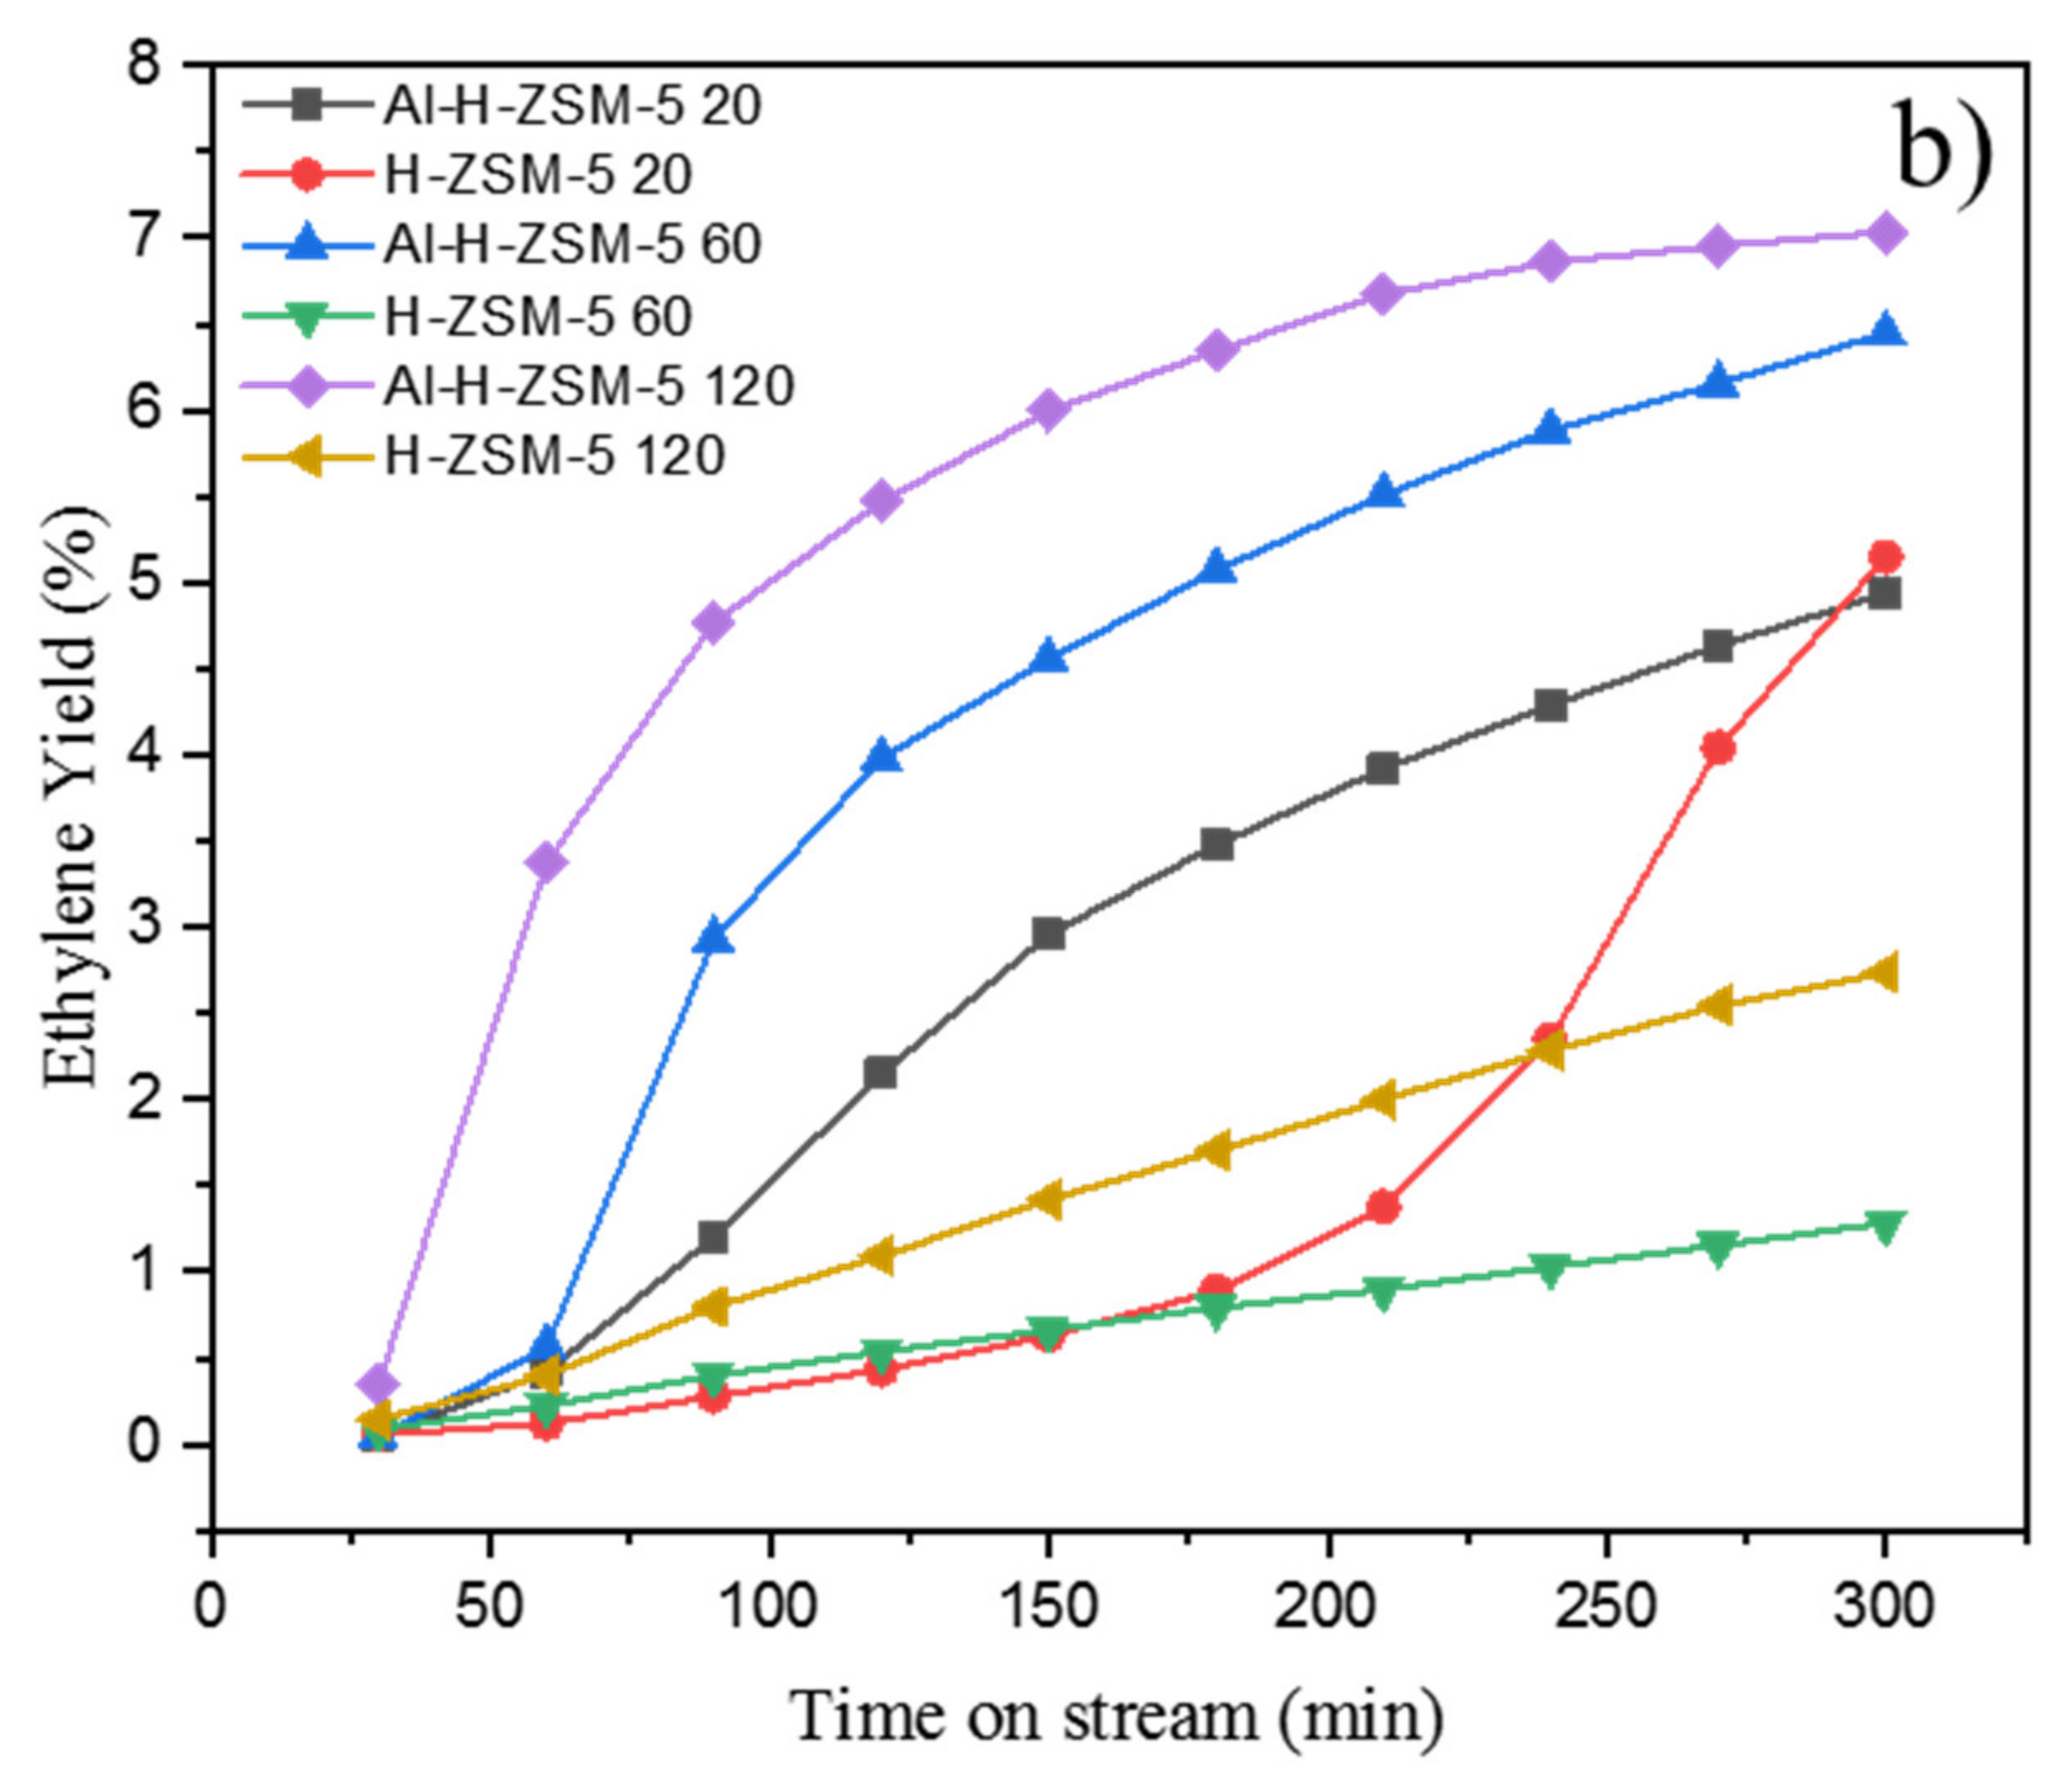
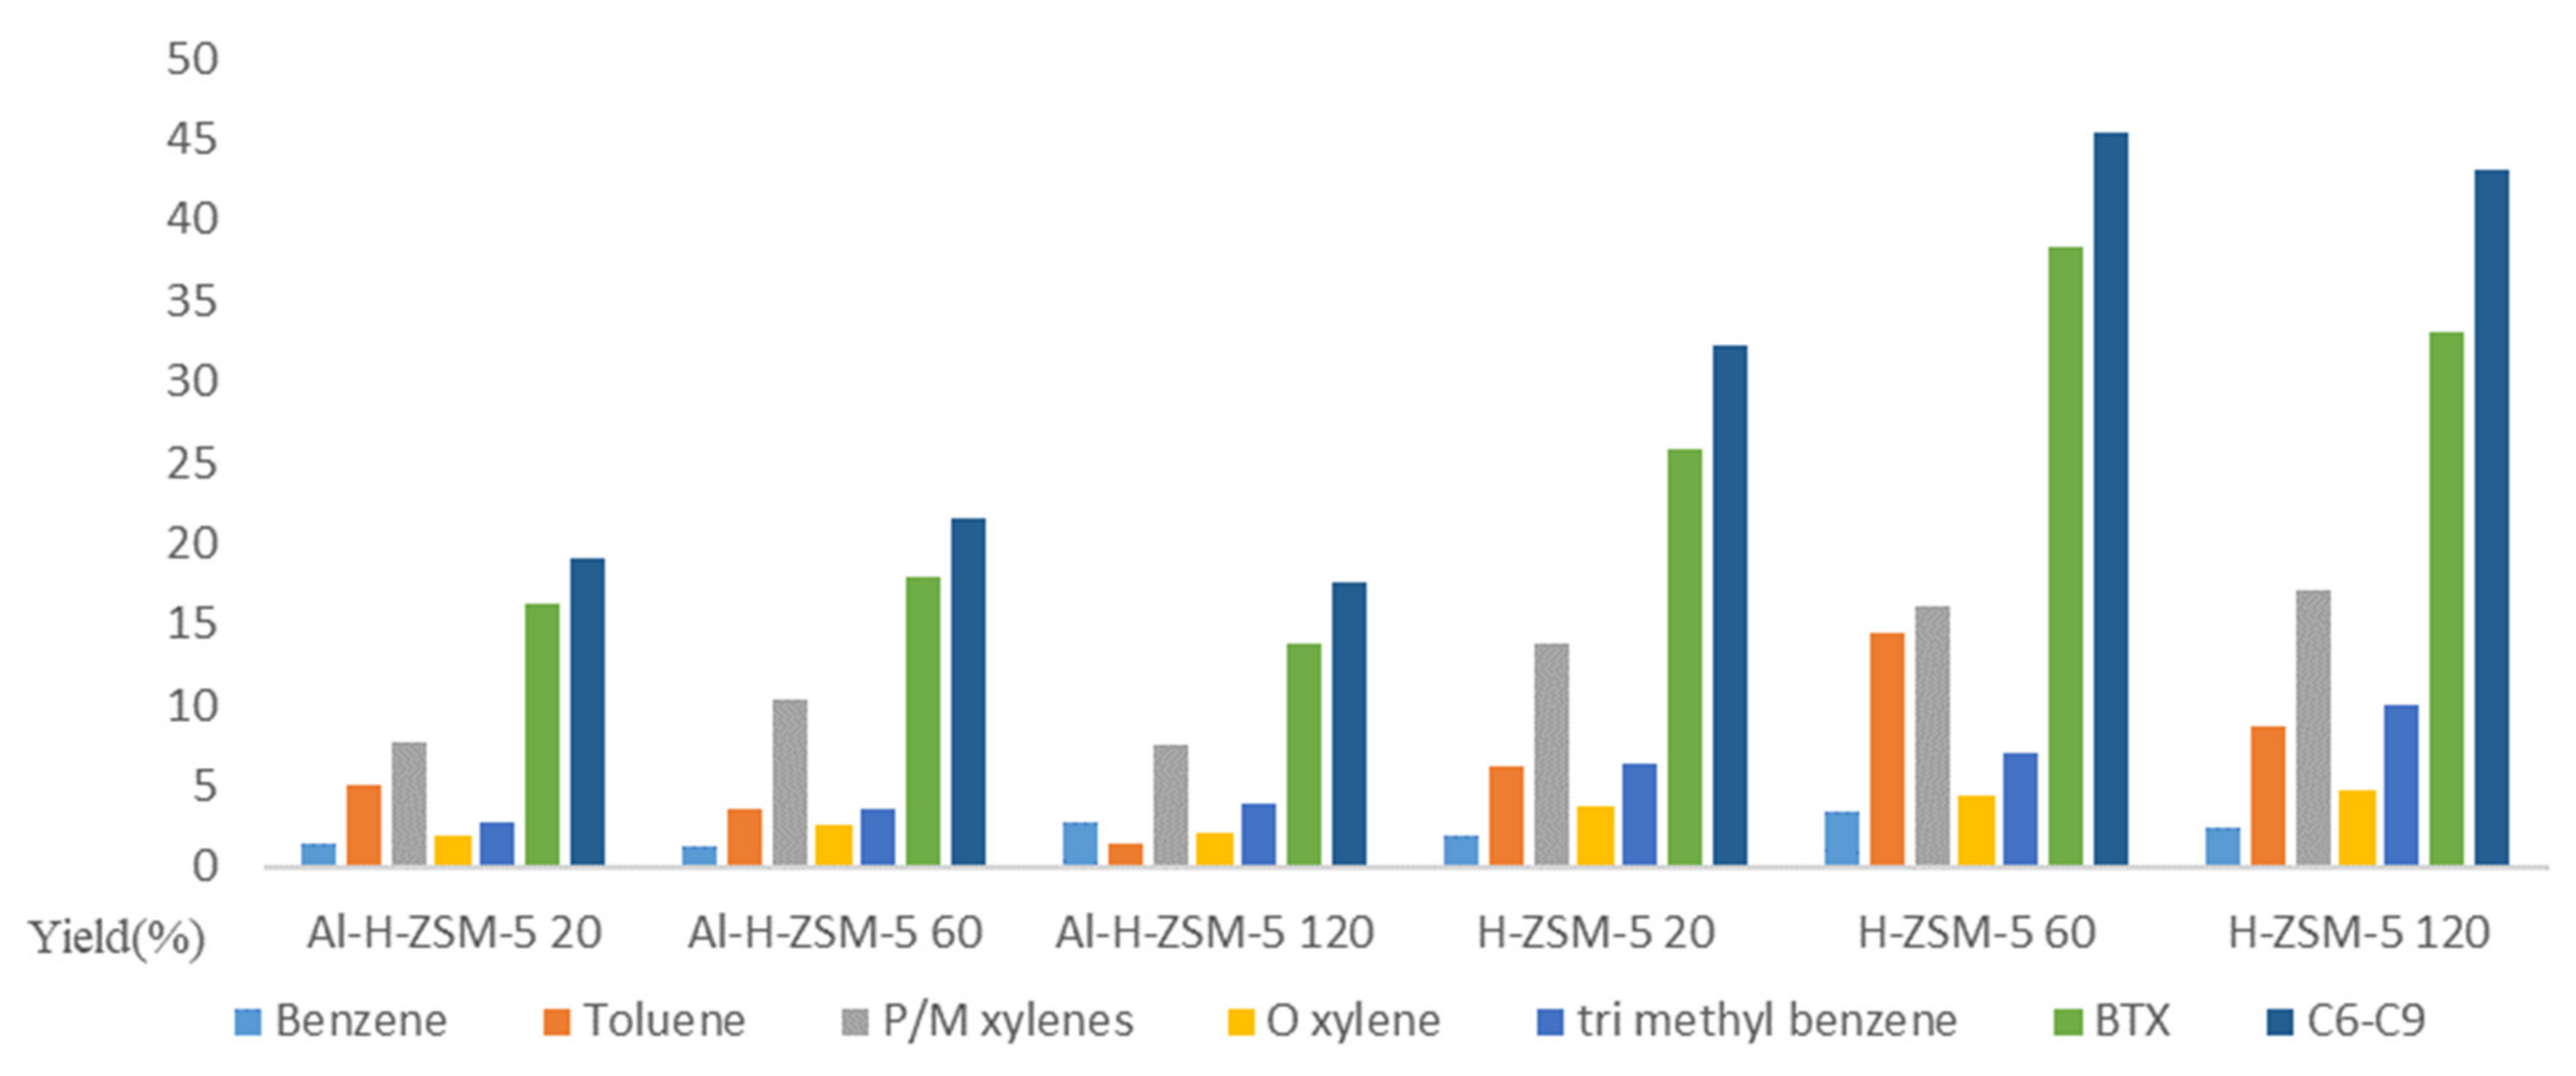
2. Catalytic Performance
3. Catalyst Characterizations
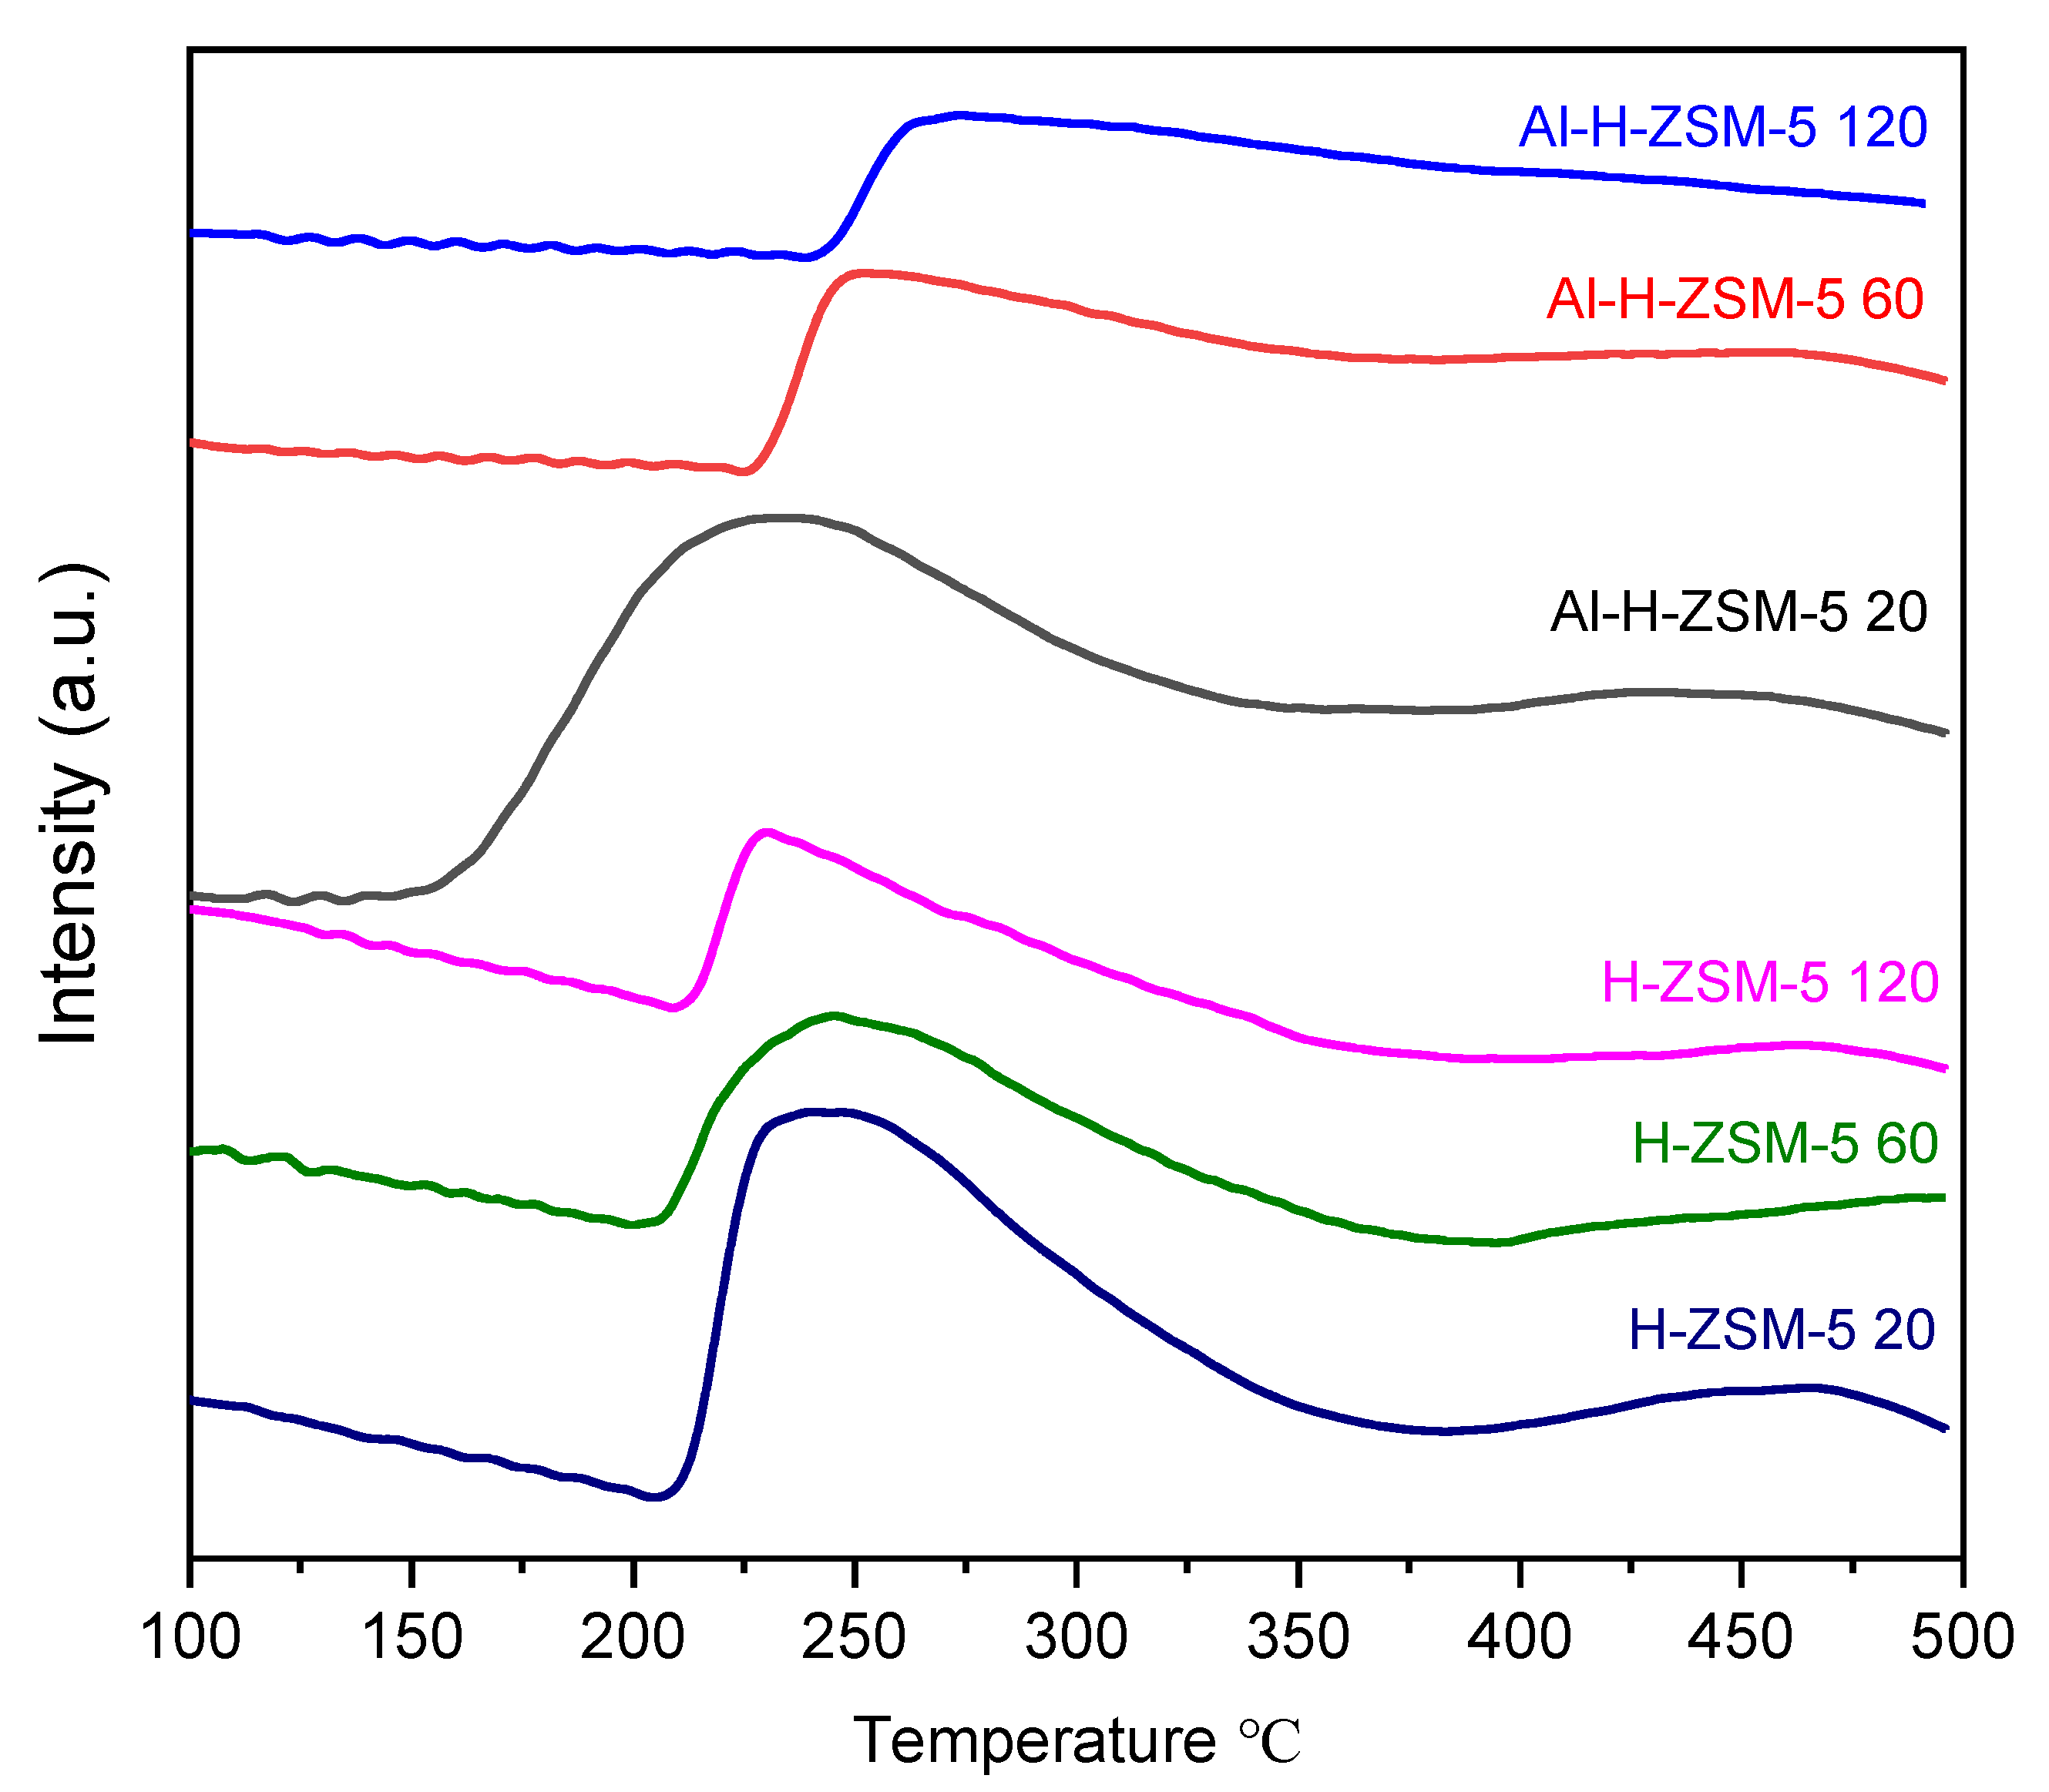
3.1. NH3-TPD
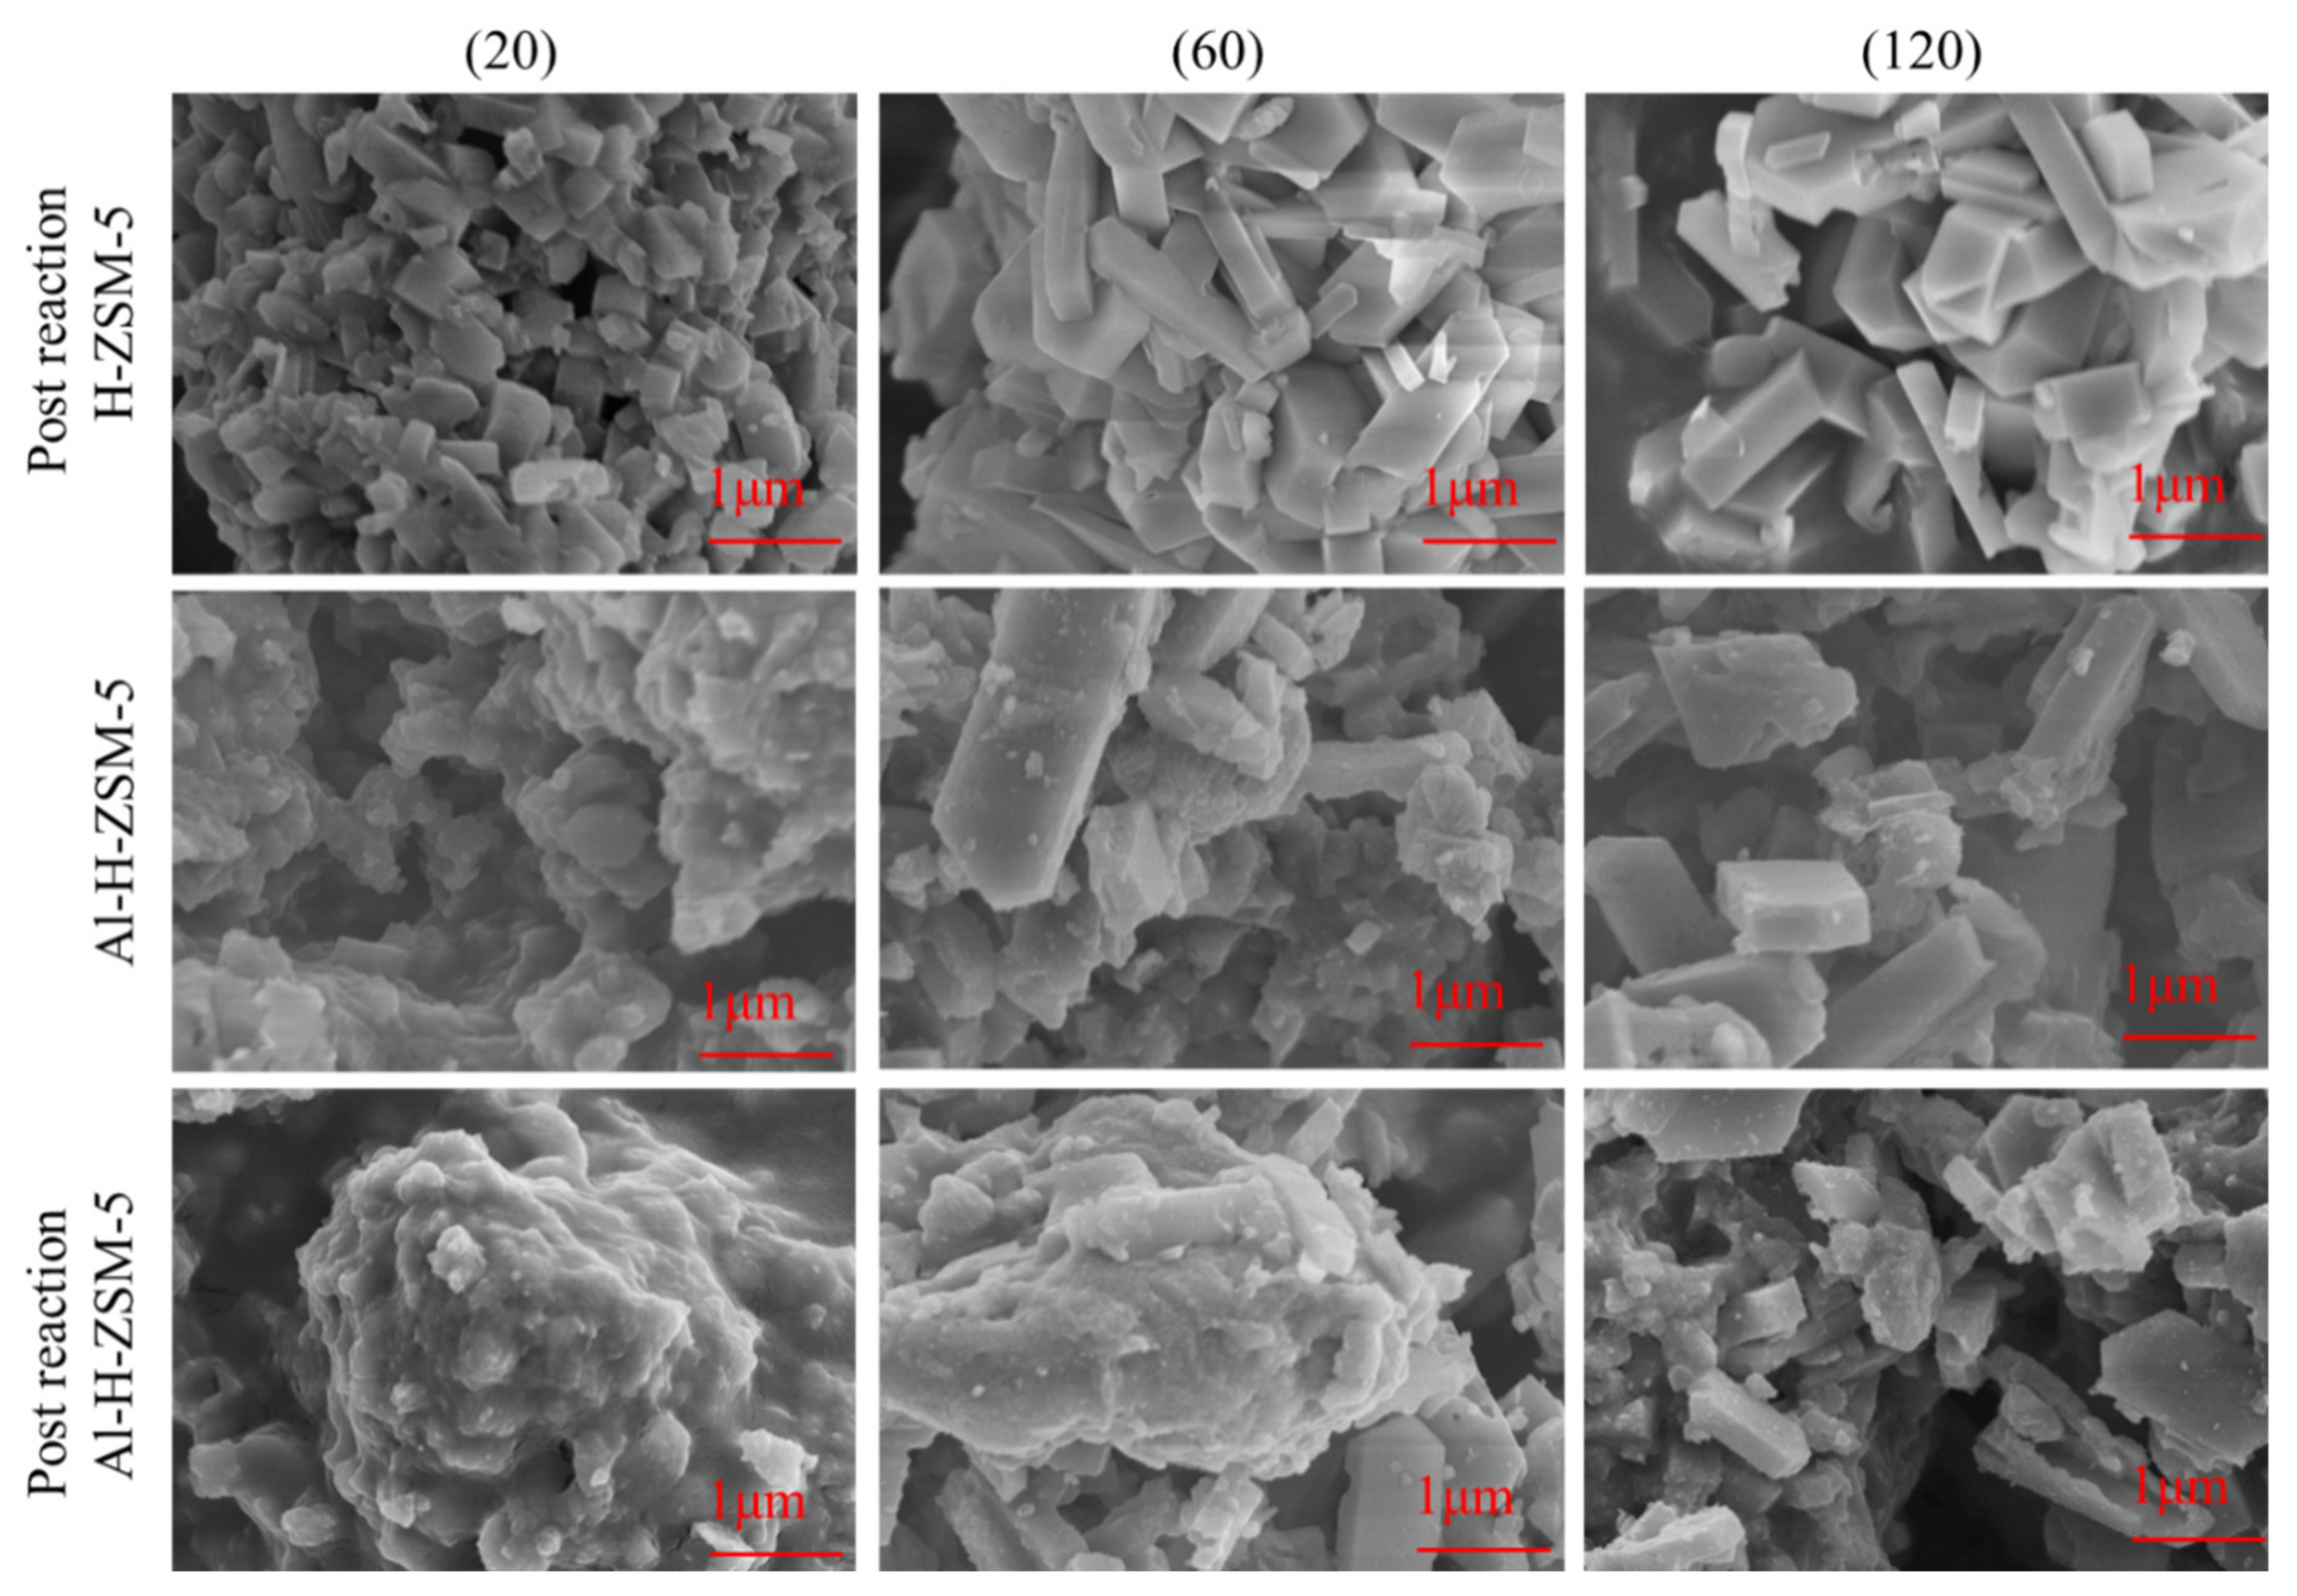
3.2. SEM
3.3. TEM
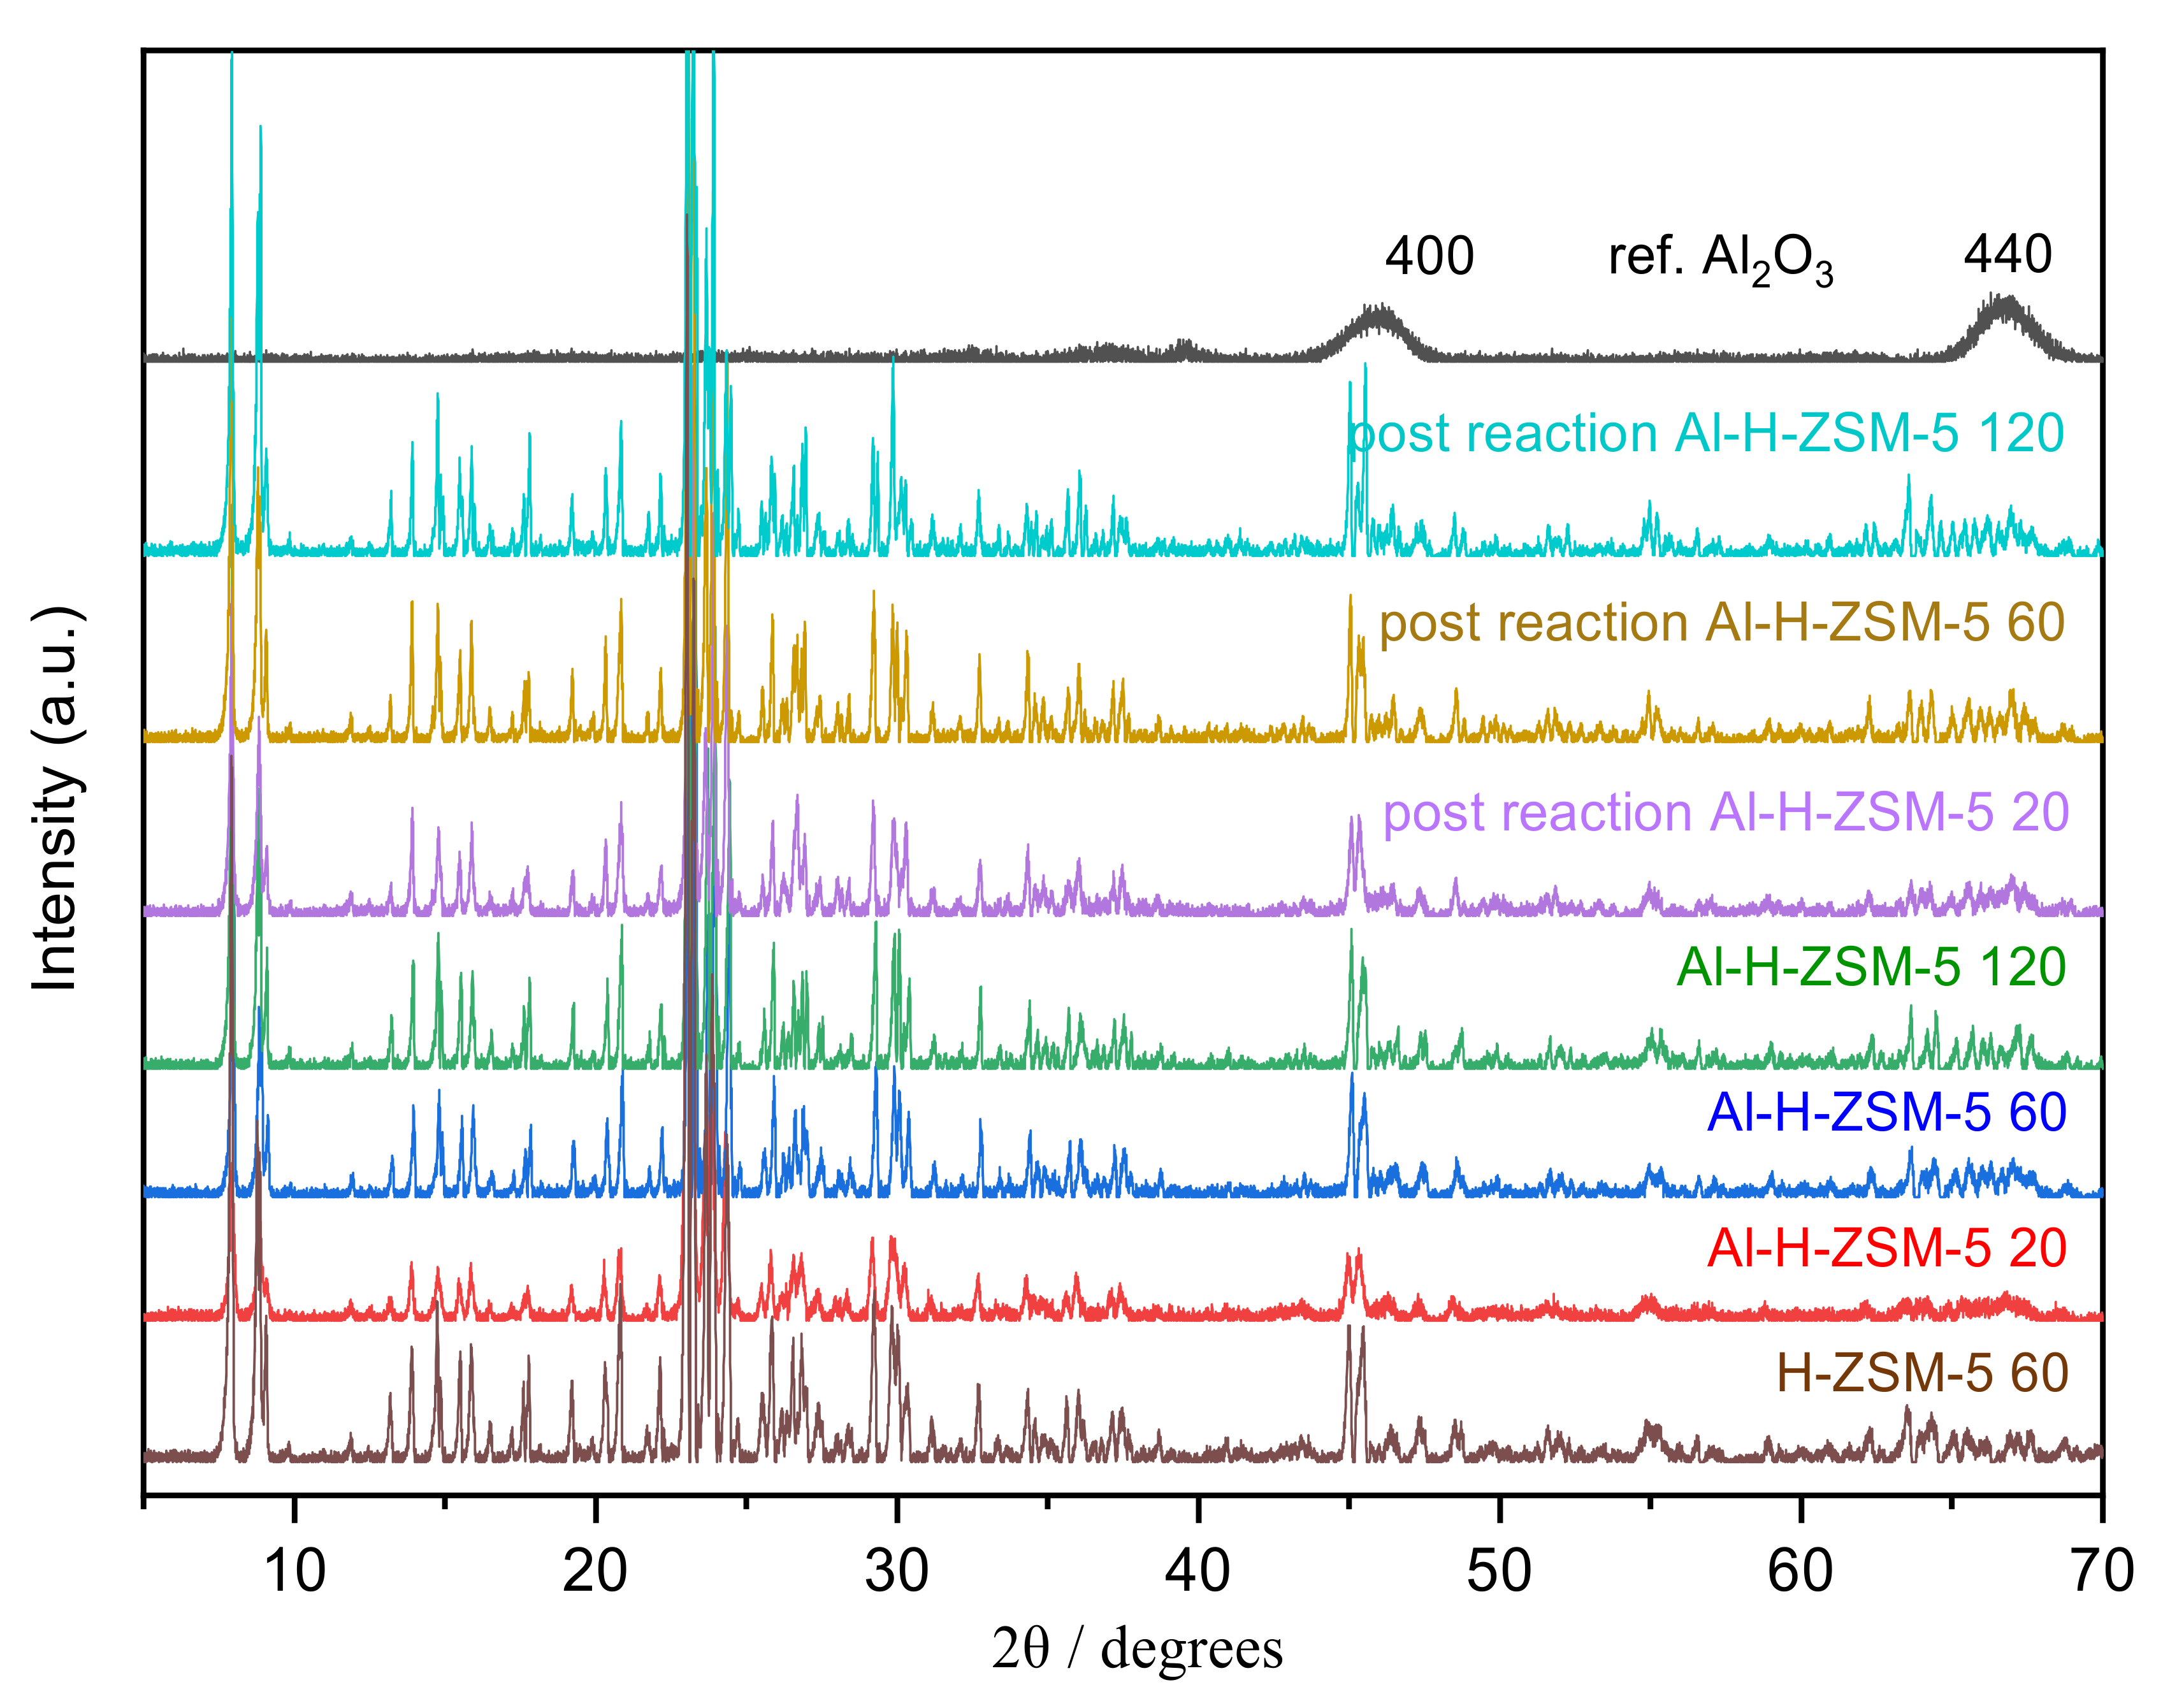
3.4. XRD
3.5. 27Al and 29Si MAS NMR
4. Coke Characterization
4.1. 13C-NMR
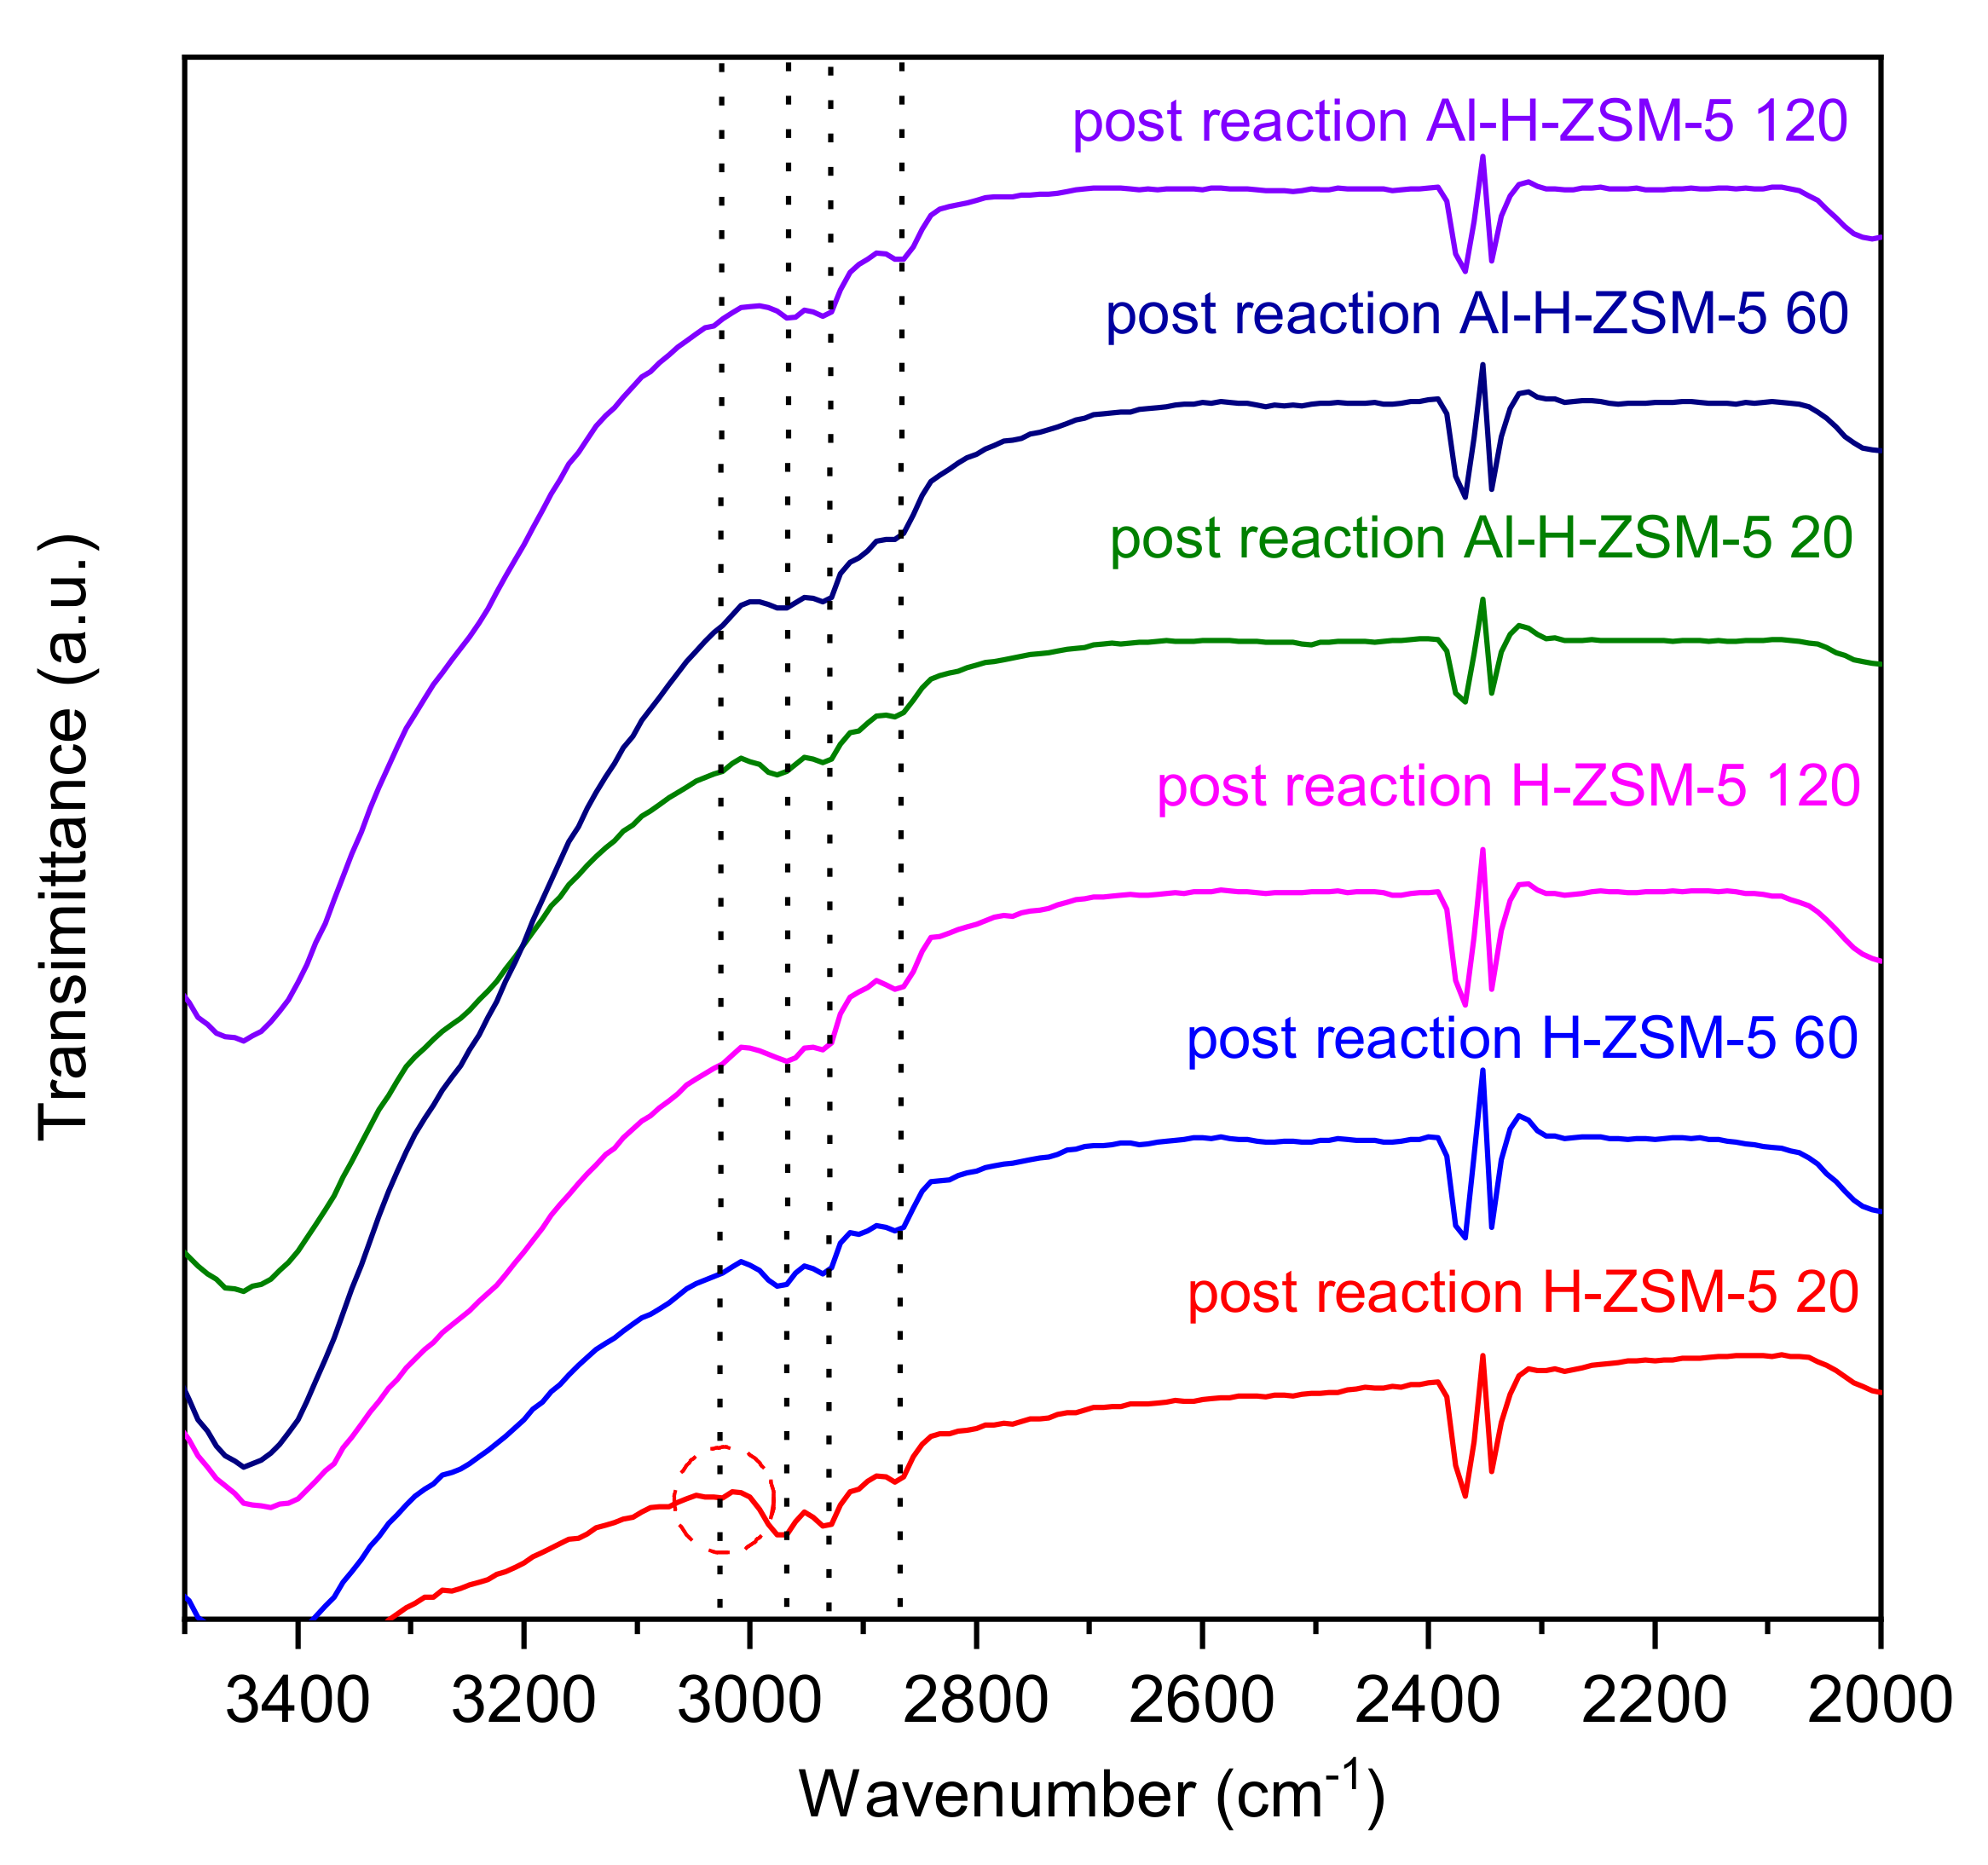
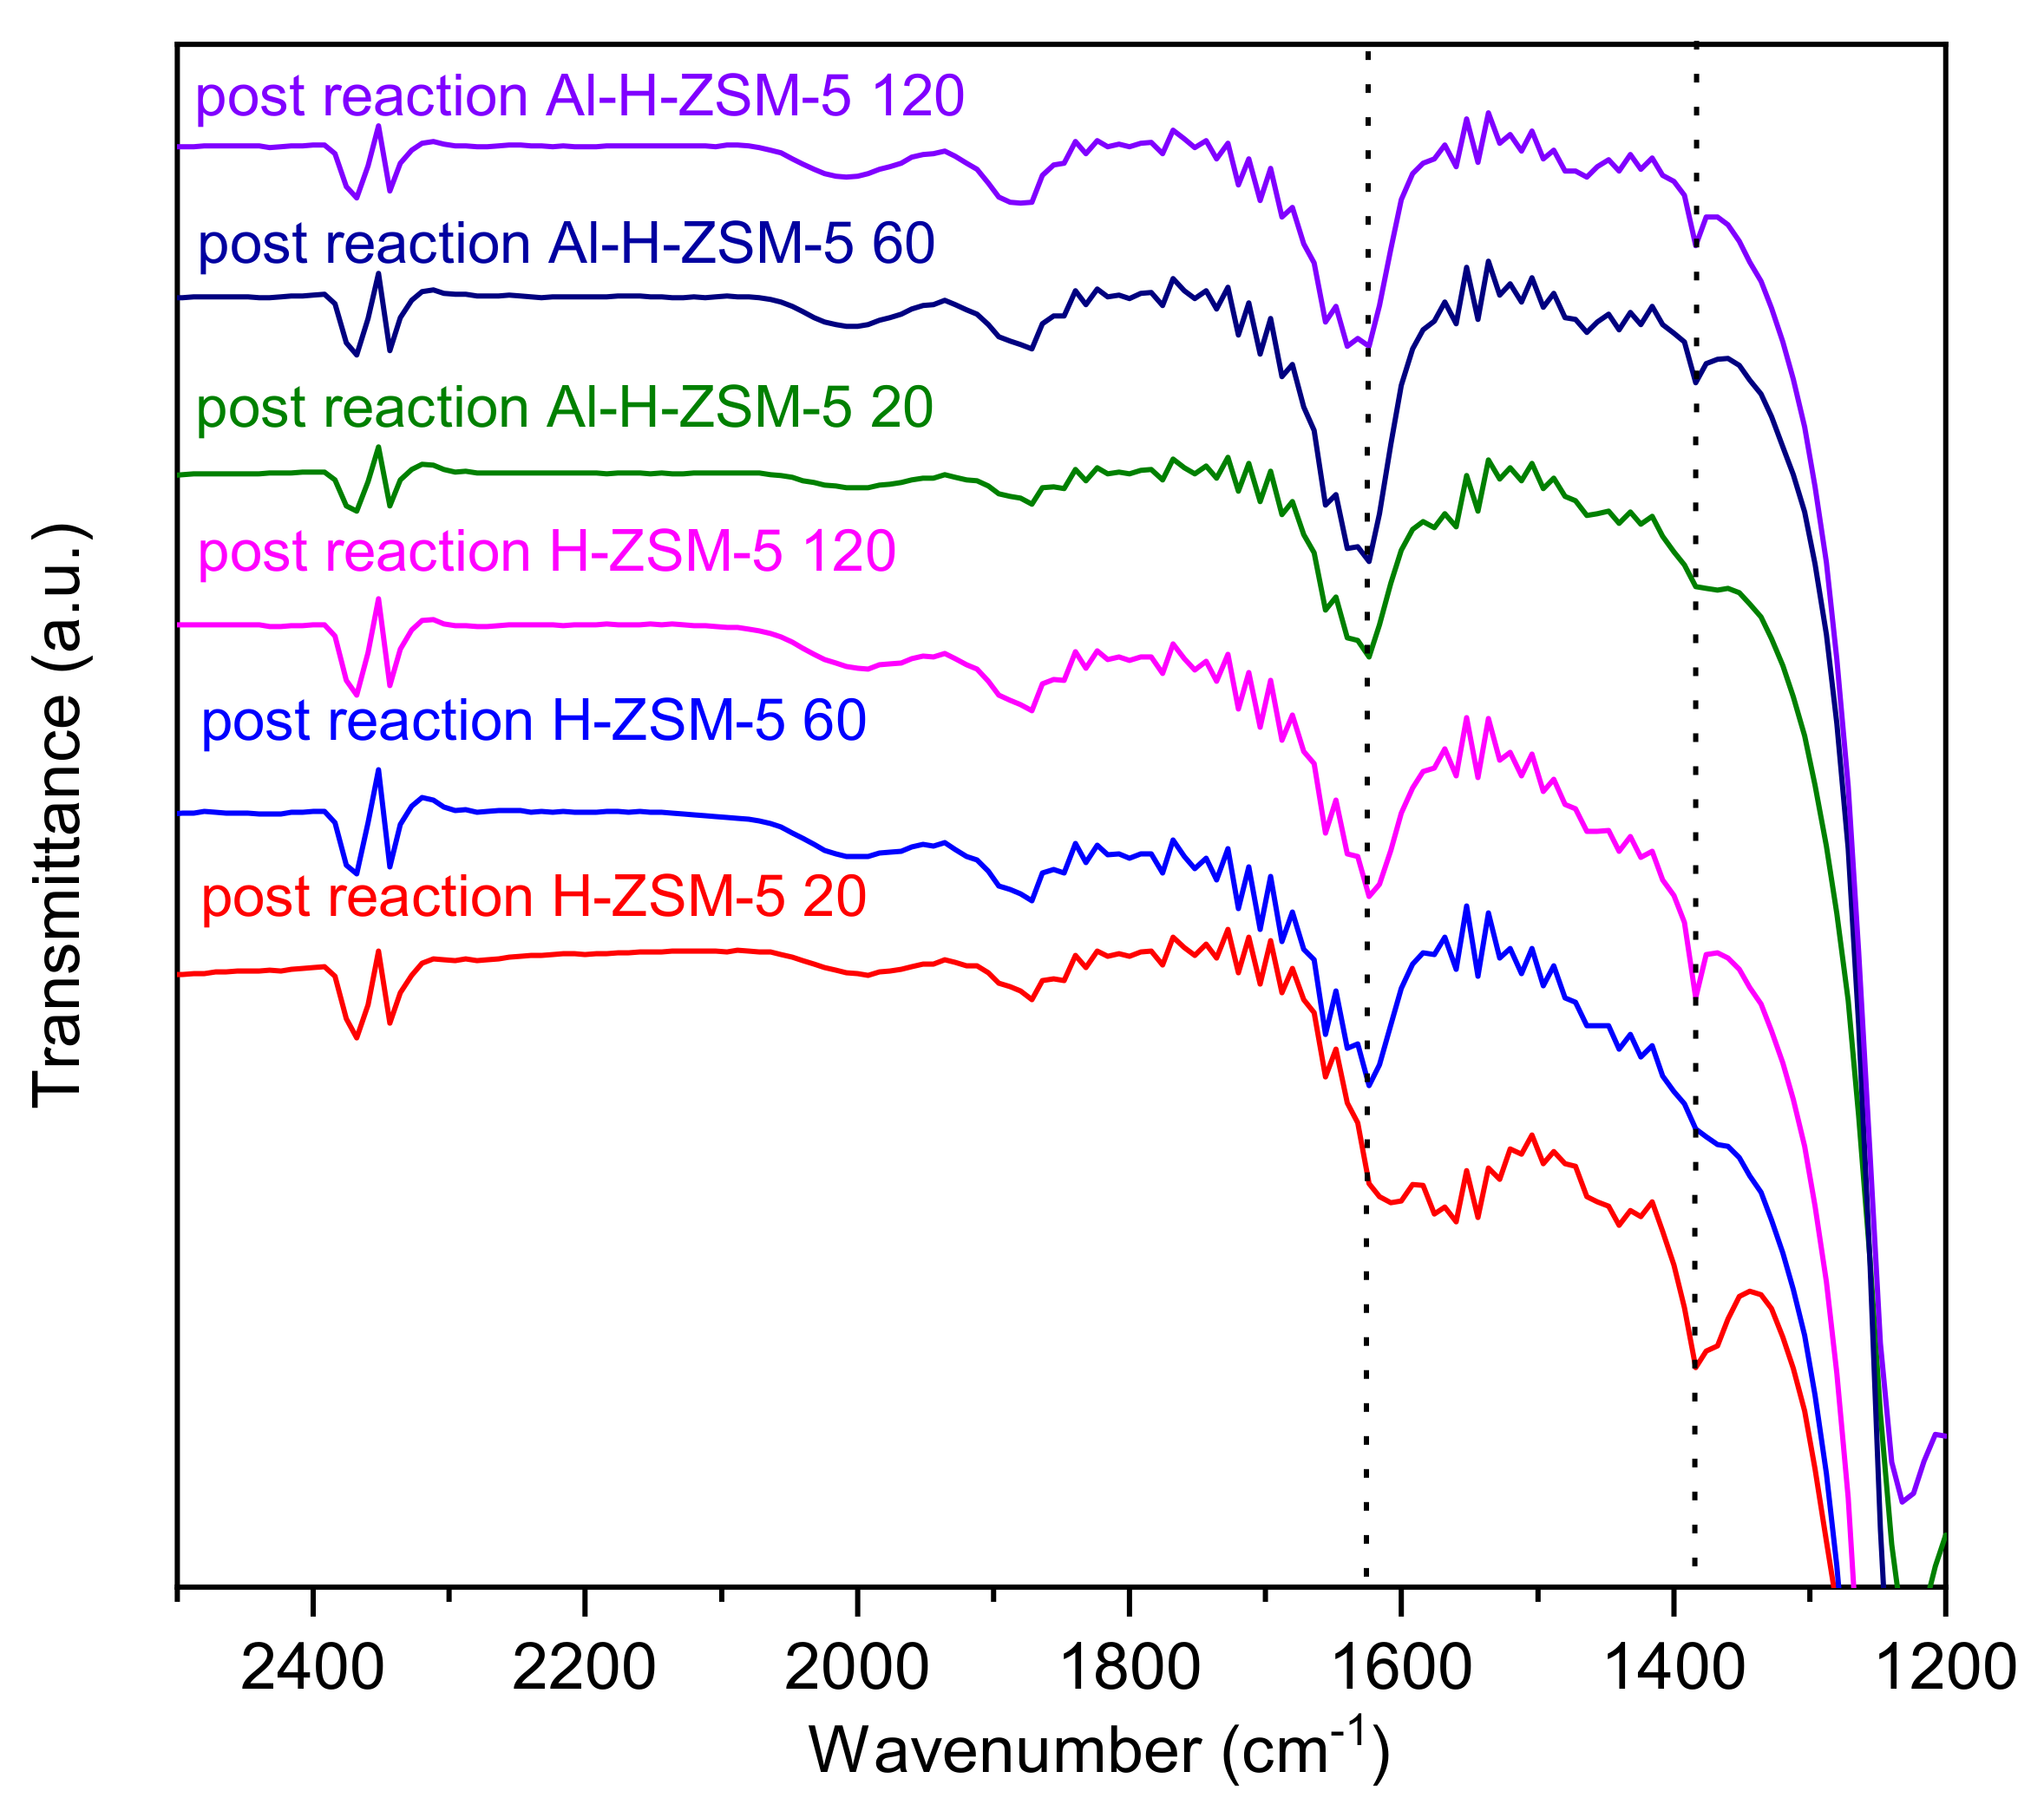
4.2. FT-IR
4.3. Laser-Raman
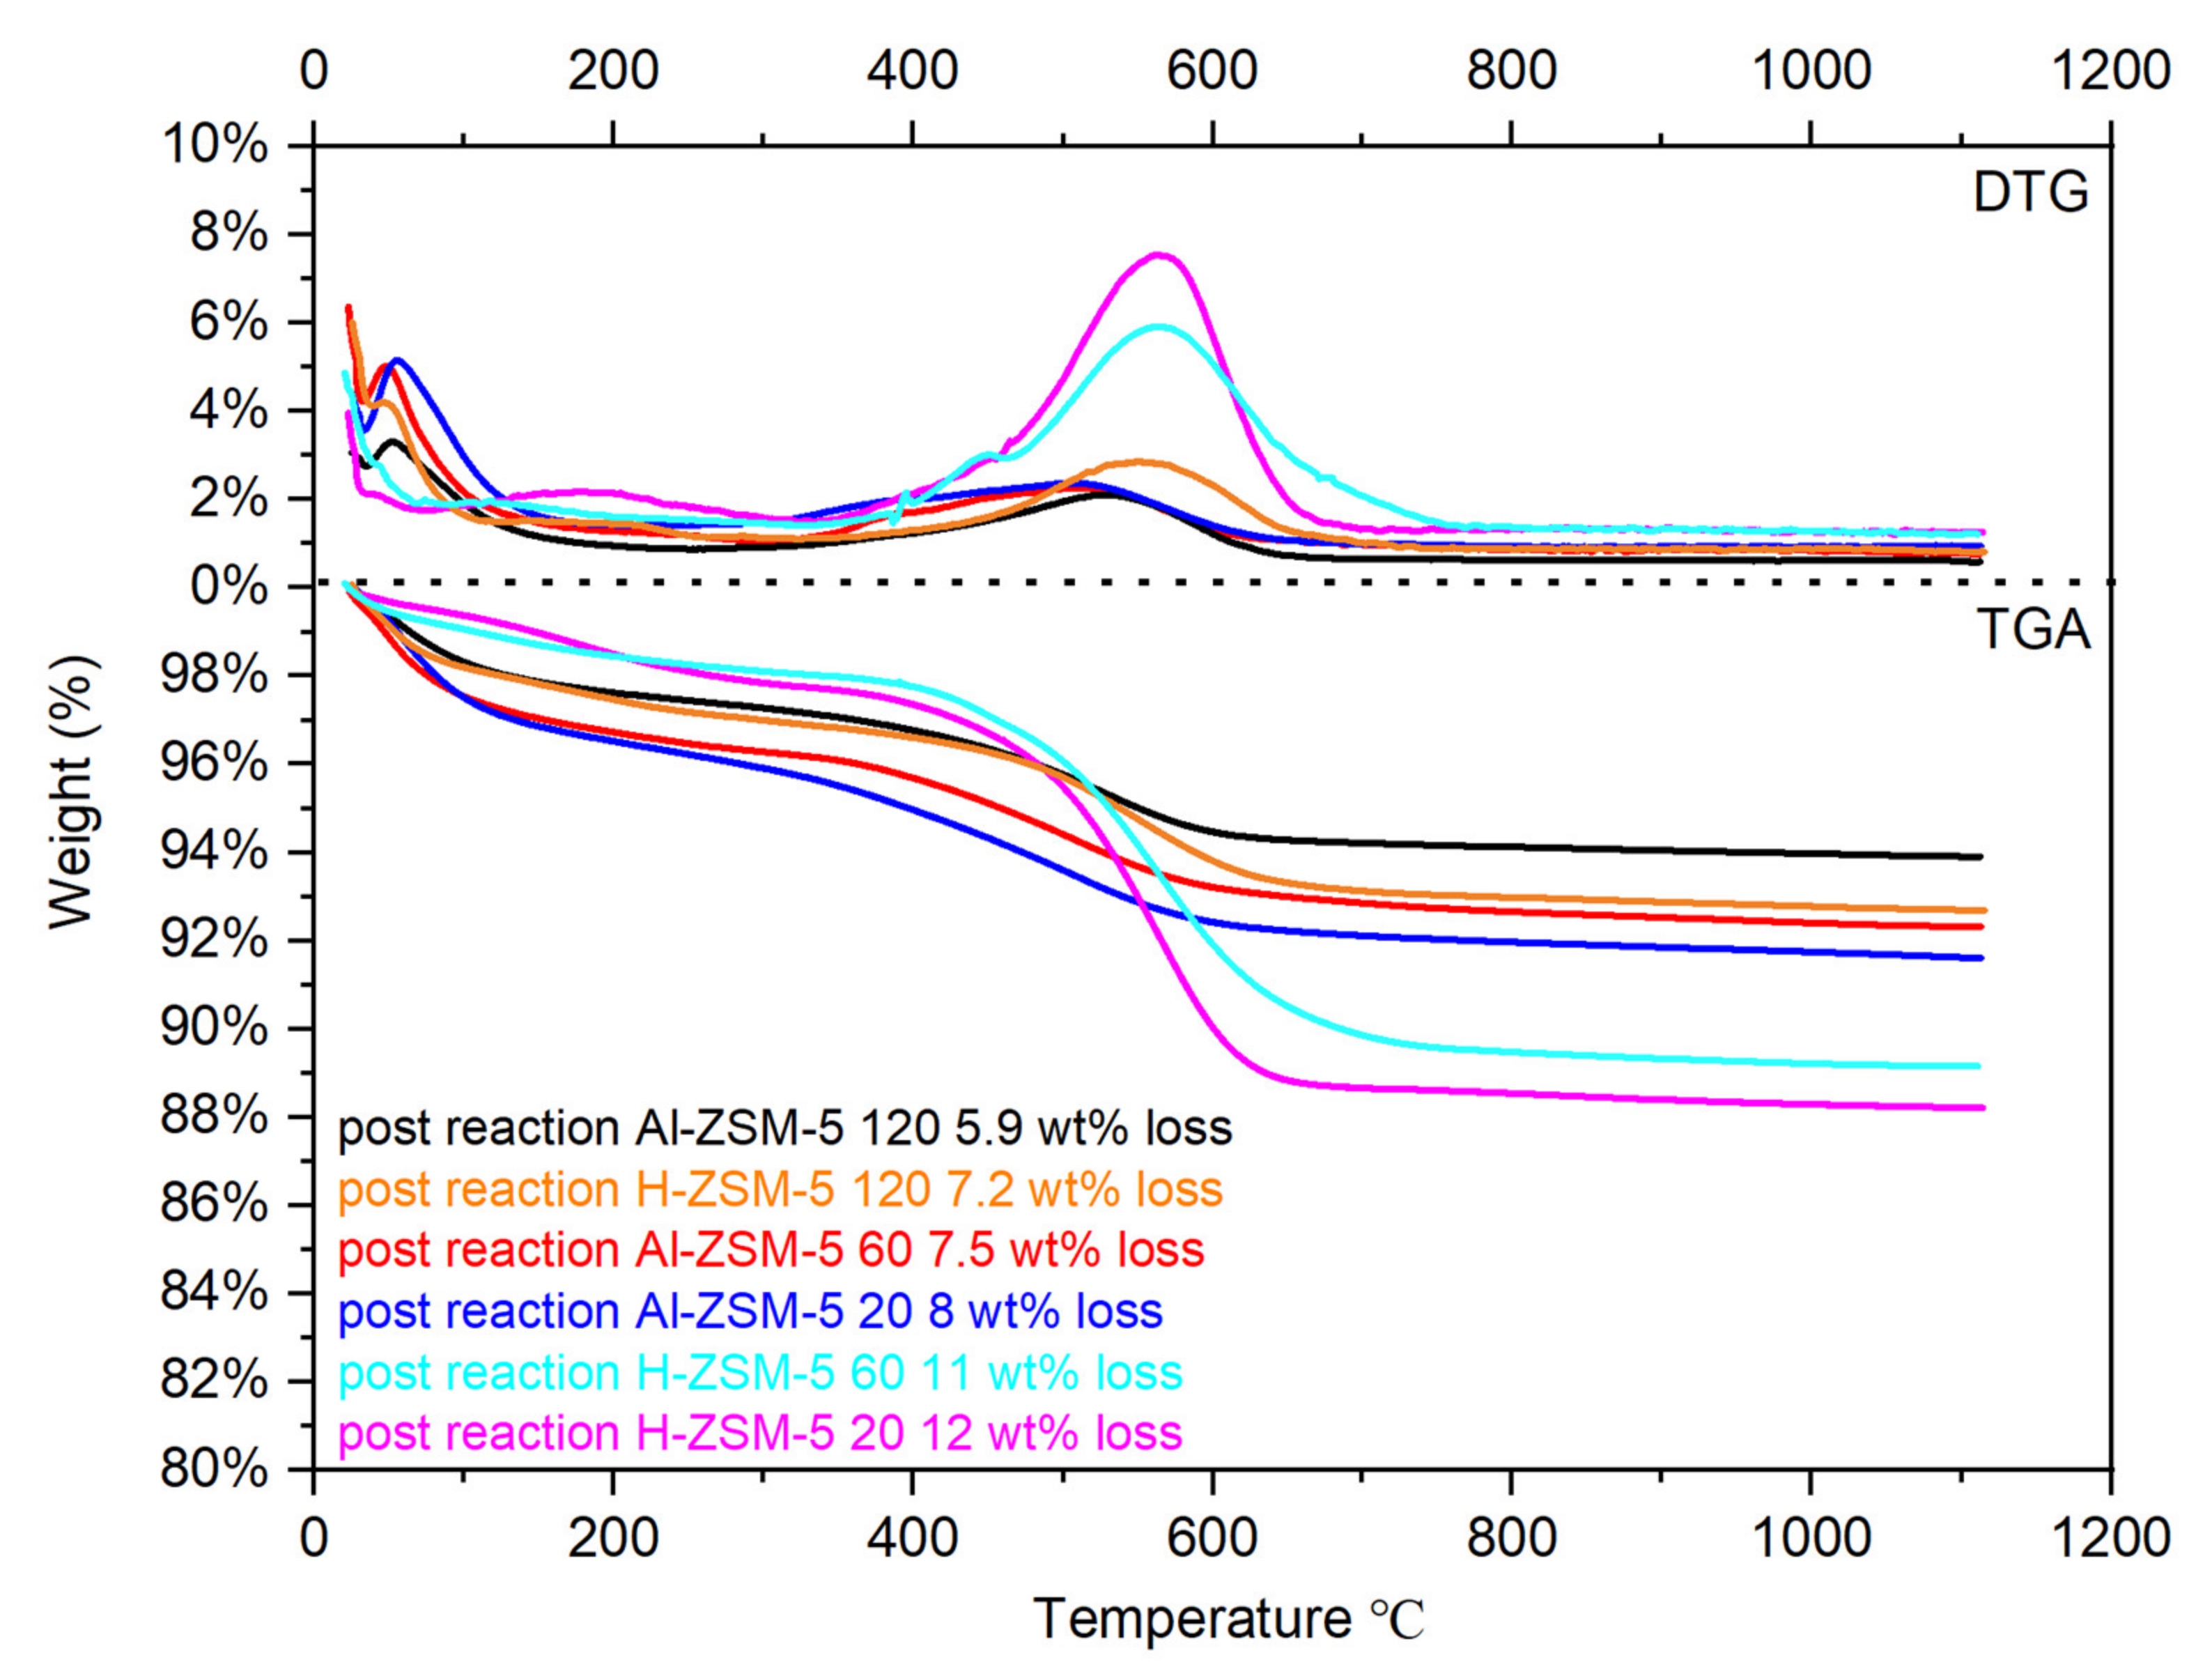
4.4. Thermogravimetric and Derivative Thermogravimetry
5. Conclusions
6. Experimental
Supplementary Materials
Author Contributions
Funding
Acknowledgments
Conflicts of Interest
References
- Liu, G.; Larson, E.D.; Williams, R.H.; Guo, X. Gasoline from Coal and/or Biomass with CO2 Capture and Storage. Process Designs and Performance Analysis. Energy Fuels 2015, 29, 1830–1844. [Google Scholar] [CrossRef]
- Yurchak, S.; Voltz, S.E.; Warner, J.P. Process Aging Studies in the Conversion of Methanol to Gasoline in a Fixed Bed Reactor. Ind. Eng. Chem. Process. Des. Dev. 1979, 18, 527–534. [Google Scholar] [CrossRef]
- Olah, G.A. Beyond Oil and Gas: The Methanol Economy. Angew. Chem. Int. Ed. 2005, 44, 2636–2639. [Google Scholar] [CrossRef] [PubMed]
- Olsbye, U.; Svelle, S.; Bjørgen, M.; Beato, P.; Janssens, T.V.; Joensen, F.; Bordiga, S.; Lillerud, K.P. Conversion of Methanol to Hydrocarbons: How Zeolite Cavity and Pore Size Controls Product Selectivity. Angew. Chem. Int. Ed. 2012, 51, 5810–5831. [Google Scholar] [CrossRef]
- Bjorgen, M.; Svelle, S.; Joensen, F.; Nerlov, J.; Kolboe, S.; Bonino, F.; Palumbo, L.; Bordiga, S.; Olsbye, U. Conversion of methanol to hydrocarbons over zeolite H-ZSM-5: On the origin of the olefinic species. J. Catal. 2007, 249, 195–207. [Google Scholar] [CrossRef]
- Dahl, I.M.; Kolboe, S. On the Reaction-Mechanism for Hydrocarbon Formation from Methanol over Sapo-34. Isotopic Labeling Studies of the Co-Reaction of Ethene and Methanol. J. Catal. 1994, 149, 458–464. [Google Scholar] [CrossRef]
- Svelle, S.; Joensen, F.; Nerlov, J.; Olsbye, U.; Lillerud, K.-P.; Kolboe, S.; Bjørgen, M. Conversion of Methanol into Hydrocarbons over Zeolite H-ZSM-5: Ethene Formation Is Mechanistically Separated from the Formation of Higher Alkenes. J. Am. Chem. Soc. 2006, 128, 14770–14771. [Google Scholar] [CrossRef]
- Hu, Z.; Zhang, H.; Wang, L.; Zhang, H.; Zhang, Y.; Xu, H.; Shen, W.; Tang, Y. Highly stable boron-modified hierarchical nanocrystalline ZSM-5 zeolite for the methanol to propylene reaction. Catal. Sci. Technol. 2014, 4, 2891–2895. [Google Scholar] [CrossRef]
- Aramburo, L.R.; Teketel, S.; Svelle, S.; Bare, S.R.; Arstad, B.; Zandbergen, H.W.; Olsbye, U.; de Groot, F.M. Interplay between nanoscale reactivity and bulk performance of H-ZSM-5 catalysts during the metha-nol-to-hydrocarbons reaction. J. Catal. 2013, 307, 185–193. [Google Scholar] [CrossRef] [Green Version]
- Ni, Y.; Sun, A.; Wu, X.; Hai, G.; Hu, J.; Li, T.; Li, G. The preparation of nano-sized H[Zn, Al]ZSM-5 zeolite and its application in the aromatization of methanol. Microporous Mesoporous Mater. 2011, 143, 435–442. [Google Scholar] [CrossRef]
- Mitchell, S.; Michels, N.-L.; Pérez-Ramírez, J. From powder to technical body: The undervalued science of catalyst scale up. Chem. Soc. Rev. 2013, 42, 6094–6112. [Google Scholar] [CrossRef]
- Pérez-Ramírez, J.; Christensen, C.H.; Egeblad, K.; Christensen, C.H.; Groen, J.C. Hierarchical zeolites: Enhanced utilisation of microporous crystals in catalysis by advances in materials design. Chem. Soc. Rev. 2008, 37, 2530–2542. [Google Scholar] [CrossRef]
- Mitchell, S.; Michels, N.-L.; Kunze, K.; Pérez-Ramírez, J. Visualization of hierarchically structured zeolite bodies from macro to nano length scales. Nat. Chem. 2012, 4, 825–831. [Google Scholar] [CrossRef]
- Michels, N.-L.; Mitchell, S.; Pérez-Ramírez, J. Effects of Binders on the Performance of Shaped Hierarchical MFI Zeolites in Methanol-to-Hydrocarbons. ACS Catal. 2014, 4, 2409–2417. [Google Scholar] [CrossRef]
- Milina, M.; Mitchell, S.; Crivelli, P.; Cooke, D.; Pérez-Ramírez, J. Mesopore quality determines the lifetime of hierarchically structured zeolite catalysts. Nat. Commun. 2014, 5, 3922. [Google Scholar] [CrossRef] [Green Version]
- Chang, C.D.; Hellring, S.D.; Miale, J.N.; Schmitt, K.D.; Brigandi, P.W.; Wu, E.L. Insertion of Aluminum into High-Silica-Content Zeolite Frameworks.Hydrothermal Transfer of Aluminum from Al2o3 into [Al]Zsm-5 and [B]Zsm-5. J. Chem. Soc. Faraday Trans. 1 Phys. Chem. Condens. Phases 1985, 81, 2215–2224. [Google Scholar]
- Shihabi, D.S.; Garwood, W.E.; Chu, P.; Miale, J.N.; Lago, R.M.; Chang, C.D. Aluminum insertion into high-silica zeolite frameworks II. Binder activation of high-silica ZSM-5. J. Catal. 1985, 93, 471–474. [Google Scholar] [CrossRef]
- Martin, A.; Berndt, H.; Lohse, U.; Wolf, U. Effect of silicon-aluminum ratio and type of binder on the catalytic properties of HZSM-5 catalysts. J. Chem. Soc. Faraday Trans. 1993, 89, 1277–1282. [Google Scholar] [CrossRef]
- Stöcker, M. Methanol-to-hydrocarbons: Catalytic materials and their behavior. Microporous Mesoporous Mater. 1999, 29, 3–48. [Google Scholar] [CrossRef]
- Trombetta, M.; Armaroli, T.; Gutierrez-Alejandre, A.; Gonzalez, H.; Solis, J.R.; Busca, G. Conversion and hydroconversion of hydrocarbons on zeolite-based catalysts: An FT-IR study. Catal. Today 2001, 65, 285–292. [Google Scholar] [CrossRef]
- Hargreaves, J.S.J.; Munnoch, A.L. A survey of the influence of binders in zeolite catalysis. Catal. Sci. Technol. 2013, 3, 1165–1171. [Google Scholar] [CrossRef]
- Wang, T.; Tang, X.; Huang, X.; Qian, W.; Cui, Y.; Hui, X.; Yang, W.; Wei, F. Conversion of methanol to aromatics in fluidized bed reactor. Catal. Today 2014, 233, 8–13. [Google Scholar] [CrossRef]
- Anonymous. New-Zealand Methanol-to-Gasoline Process Can Be Based on Coal. Oil Gas J. 1980, 78, 95–96. [Google Scholar]
- Ilias, S.; Bhan, A. Mechanism of the Catalytic Conversion of Methanol to Hydrocarbons. ACS Catal. 2012, 3, 18–31. [Google Scholar] [CrossRef]
- Tan, P.; Leung, Y.; Lai, S.Y.; Au, C.T. The effect of calcination temperature on the catalytic performance of 2 wt.% Mo/HZSM-5 in methane aromatization. Appl. Catal. A Gen. 2002, 228, 115–125. [Google Scholar] [CrossRef]
- Hunger, B. Temperature programmed desorption (TPD) on zeolites by means of non-linear temperature programmes. J. Therm. Anal. Calorim. 1989, 35, 107–112. [Google Scholar] [CrossRef]
- Guisnet, M.; Ribeiro, R.F. Deactivation and Regeneration of Zeolite Catalysts; Hutchings, G.J., Ed.; Catalytic Science Series; Imperial College Press: London, UK, 2011; Volume 9, p. 340. [Google Scholar]
- Castano, P.; Elordi, G.; Olazar, M.; Aguayo, A.T.; Pawelec, B.; Bilbao, J. Insights into the coke deposited on HZSM-5, Hβ and HY zeolites during the cracking of polyethylene. Appl. Catal. B 2011, 104, 91–100. [Google Scholar] [CrossRef]
- Li, J.; Xiong, G.; Feng, Z.; Liu, Z.; Xin, Q.; Li, C. Coke formation during the methanol conversion to olefins in zeolites studied by UV Raman spectroscopy. Microporous Mesoporous Mater. 2000, 39, 275–280. [Google Scholar] [CrossRef]
- Lange, J.-P.; Gutsze, A.; Allgeier, J.; Karge, H. Coke formation through the reaction of ethene over hydrogen mordenite: III. IR and 13C-NMR studies. Appl. Catal. 1988, 45, 345–356. [Google Scholar] [CrossRef]
- Düvel, A.; Romanova, E.; Sharifi, M.; Freude, D.; Wark, M.; Heitjans, P.; Wilkening, M. Mechanically Induced Phase Transformation of γ-Al2O3 into α-Al2OAccess to Structurally Disordered γ-Al2O3 with a Controllable Amount of Pentacoordinated Al Sites. J. Phys. Chem. C 2011, 115, 22770–22780. [Google Scholar] [CrossRef]
- Rozita, Y.; Brydson, R.; Scott, A. An investigation of commercial gamma-Al2O3nanoparticles. J. Physics: Conf. Ser. 2010, 241, 012096. [Google Scholar] [CrossRef]
- Yu, Z.; Li, S.; Wang, Q.; Zheng, A.; Jun, X.; Chen, L.; Deng, F. Brønsted/Lewis Acid Synergy in H–ZSM-5 and H–MOR Zeolites Studied by 1H and 27Al DQ-MAS Solid-State NMR Spectroscopy. J. Phys. Chem. C 2011, 115, 22320–22327. [Google Scholar] [CrossRef]
- Dědeček, J.; Sklenak, S.; Li, C.; Wichterlová, B.; Gábová, V.; Brus, J.; Sierka, M.; Sauer, J. Effect of Al−Si−Al and Al−Si−Si−Al Pairs in the ZSM-5 Zeolite Framework on the 27Al NMR Spectra. A Combined High-Resolution 27Al NMR and DFT/MM Study. J. Phys. Chem. C 2009, 113, 1447–1458. [Google Scholar] [CrossRef]
- Derouane, E.G.; Gilson, J.-P.; Nagy, J.B. In situ characterization of carbonaceous residues from zeolite-catalysed reactions using high resolution solid state 13C-n.m.r. spectroscopy. Zeolites 1982, 2, 42–46. [Google Scholar] [CrossRef]
- Barrage, M.C.; Bauer, F.; Ernst, H.; Fraissard, J.; Freude, D.; Pfeifer, H. Multinuclear NMR and catalytic investigations of deactivation of zeolite H-ZSM-5. Catal. Lett. 1990, 6, 201–207. [Google Scholar] [CrossRef]
- Li, C.L.; Novaro, O.; Bokhimi, X.; Munoz, E.; Boldú, J.L.; Wang, J.A.; Lopez, T.; Gómez, R.; Batina, N. Coke formation on an industrial reforming Pt–Sn/γ-Al2O3 catalyst. Catal. Lett. 2000, 65, 209–216. [Google Scholar] [CrossRef]
- Mukherjee, G.; Biradha, K. 1D, 2D and 3D coordination polymers of 1, 3-phenylene diisonicotinate with Cu (i)/Cu (ii): Cu 2 I 2 building block, anion influence and guest inclusions. CrystEngComm 2014, 16, 4701–4705. [Google Scholar] [CrossRef]
- Mirji, S.; Halligudi, S.; Sawant, D.P.; Patil, K.; Gaikwad, A.; Pradhan, S. Adsorption of toluene on Si(100)/SiO2 substrate and mesoporous SBA-15. Colloids Surf. A Physicochem. Eng. Asp. 2006, 272, 220–226. [Google Scholar] [CrossRef]
- Minejima, C.; Ebata, T.; Mikami, N. C-H stretching vibrations of benzene and toluene in their S1 states observed by double reso-nance vibrational spectroscopy in supersonic jets. Phys. Chem. Chem. Phys. 2002, 4, 1537–1541. [Google Scholar] [CrossRef]
- Brian, C.S. The Infrared Spectroscopy of Alkenes. Spectroscopy 2016, 31, 28–34. [Google Scholar]
- Vandenabeele, P. Practical Raman Spectroscopy—An Introduction; John Wiley & Sons: Hoboken, NJ, USA, 2013. [Google Scholar] [CrossRef]
- Chua, Y.T.; Stair, P.C. An ultraviolet Raman spectroscopic study of coke formation in methanol to hydrocarbons conversion over zeolite H-MFI. J. Catal. 2003, 213, 39–46. [Google Scholar] [CrossRef]
- Hereijgers, B.P.; Bleken, F.L.; Nilsen, M.H.; Svelle, S.; Lillerud, K.P.; Bjørgen, M.; Weckhuysen, B.M.; Olsbye, U. Product shape selectivity dominates the Methanol-to-Olefins (MTO) reaction over H-SAPO-34 catalysts. J. Catal. 2009, 264, 77–87. [Google Scholar] [CrossRef]
- Mei, C.; Wen, P.; Liu, Z.; Liu, H.; Wang, Y.; Yang, W.; Xie, Z.; Hua, W.; Gao, Z. Selective production of propylene from methanol: Mesoporosity development in high silica HZSM-5. J. Catal. 2008, 258, 243–249. [Google Scholar] [CrossRef]


| Samples | Near −106 ppm | Near −111 ppm |
|---|---|---|
| H-ZSM-5 20 | 29.8% (−108.7 ppm) | no signal |
| H-ZSM-5 60 | 20.0% (−106.8 ppm) | no signal |
| H-ZSM-5 120 | 16.9% (−107.1 ppm) | no signal |
| Al-H-ZSM-5 20 | 23.3% (−106.5 ppm) | no signal |
| Al-H-ZSM-5 60 | 18.9% (−106.2 ppm) | no signal |
| Al-H-ZSM-5 120 | 16.5% (−106.4 ppm) | no signal |
| post reaction H-ZSM-5 20 | no signal | 38.6% (−111.9 ppm) |
| post reaction H-ZSM-5 60 | no signal | 23.3% (−110.5 ppm) |
| post reaction H-ZSM-5 120 | no signal | 22.8% (−109.4 ppm) |
| post reaction Al-H-ZSM-5 20 | no signal | 32.7% (−111.9 ppm) |
| post reaction Al-H-ZSM-5 60 | 16.4% (−108.1 ppm) | no signal |
| post reaction Al-H-ZSM-5 120 | 12.0% (−107.1 ppm) | no signal |
Publisher’s Note: MDPI stays neutral with regard to jurisdictional claims in published maps and institutional affiliations. |
© 2021 by the authors. Licensee MDPI, Basel, Switzerland. This article is an open access article distributed under the terms and conditions of the Creative Commons Attribution (CC BY) license (https://creativecommons.org/licenses/by/4.0/).
Share and Cite
Liu, B.; Zhu, X.; Zhao, J.; Wang, D.; Ma, W. A Study into the γ-Al2O3 Binder Influence on Nano-H-ZSM-5 via Scaled-Up Laboratory Methanol-to-Hydrocarbon Reaction. Catalysts 2021, 11, 1140. https://doi.org/10.3390/catal11101140
Liu B, Zhu X, Zhao J, Wang D, Ma W. A Study into the γ-Al2O3 Binder Influence on Nano-H-ZSM-5 via Scaled-Up Laboratory Methanol-to-Hydrocarbon Reaction. Catalysts. 2021; 11(10):1140. https://doi.org/10.3390/catal11101140
Chicago/Turabian StyleLiu, Bonan, Xiaochun Zhu, Jun Zhao, Duanda Wang, and Wangjing Ma. 2021. "A Study into the γ-Al2O3 Binder Influence on Nano-H-ZSM-5 via Scaled-Up Laboratory Methanol-to-Hydrocarbon Reaction" Catalysts 11, no. 10: 1140. https://doi.org/10.3390/catal11101140
APA StyleLiu, B., Zhu, X., Zhao, J., Wang, D., & Ma, W. (2021). A Study into the γ-Al2O3 Binder Influence on Nano-H-ZSM-5 via Scaled-Up Laboratory Methanol-to-Hydrocarbon Reaction. Catalysts, 11(10), 1140. https://doi.org/10.3390/catal11101140