Article

Fe-TiO2/AC and Co-TiO2/AC Composites: Novel Photocatalysts Prepared from Waste Streams for the Efficient Removal and Photocatalytic Degradation of Cibacron Yellow F-4G Dye

1
Department of Chemistry, Universidad de Oriente, Patricio Lumumba s/n, Santiago de Cuba CU-90-100, Cuba
2
Research Group of Analytical and Circular Chemistry, University Hasselt, Agoralaan, Gebouw D, BE-3590 Diepenbeek, Belgium
3
Faculty of Electrical Engineering, Universidad de Oriente, Santiago de Cuba CU-90-100, Cuba
4
Naval Architecture and Ocean Engineering, Zhejiang Ocean University, Zhoushan 316022, China
*
Author to whom correspondence should be addressed.
Catalysts 2021, 11(10), 1137; https://doi.org/10.3390/catal11101137
Submission received: 1 September 2021 / Revised: 17 September 2021 / Accepted: 18 September 2021 / Published: 23 September 2021
(This article belongs to the Special Issue 10th Anniversary of Catalysts—Feature Papers in Photocatalysis)

Abstract

:
Fe-TiO2/AC and Co-TiO2/AC composites were prepared from activated carbon (AC) derived from residues of peanut hulls and TiO2 photocatalyst, electrochemically prepared from titanium scrap, and doped with Fe and Co, respectively. The adsorption capacity and photocatalytic activity of the Fe-TiO2/AC and Co-TiO2/AC composites were studied for removing and degrading Cibacron Yellow F-4G (CYF-4G) from wastewater. Doped ACs were characterized by thermogravimetry (TGA), scanning electron microscopy (SEM), X-ray diffraction (XRD), a new X-ray absorption technique (XRA), and elemental analysis (EA). Interesting relationships were found between SEM, XRA, and TGA data and the doped amount of catalyst on ACs. Optimal dye adsorption was found at a pH of 2.0. The CYF-4G adsorption kinetics are followed according to the pseudo-second order model. The experimental data revealed that the Langmuir model fits better than the Freundlich and Temkin models. A decrease in adsorption capacity was observed when the catalyst dope percentage increased. A removal and degradation efficiency of the dye close to 100% was achieved around 120 min. A synergistic adsorption and photocatalytic degradation effect of the Fe-TiO2/AC and Co-TiO2/AC composites could be observed when adsorption experiments were conducted under simulated visible radiation.

1. Introduction

There is an increasing awareness of wastewater pollution caused by growing industrialization in recent years. Industrial wastewater discharged mainly from the paper and textile industries contains a complex mixture of various organic compounds, heavy metals, and azo-dyes that are hard to remove in natural environments due to their high solubility, stability, and low bio-degradability in aqueous media [1,2]. Azo-dyes are toxic, block the passage of light, and prevent the development of flora and fauna in water bodies. In addition, certain dyes and their decomposition intermediates can be considered as possible contaminants because the azo group (N=N) is converted into aromatic amines that can be carcinogenic for humans [3]. Therefore, if these wastes are discharged directly to the receiving sources (for example, rivers and creeks) without prior treatment, this could cause serious environmental problems and directly affect human health and aquatic ecological systems [3]. As a result, the issue of sustainable environment remediation has attracted the attention of many researchers [4]. Problems of water quality are also emerging as a growing concern. United Nations action plans [5] promote the development of efficient and sustainable technologies to reduce these pollutants, which are generally of a hazardous nature. Therefore, a strong interest has emerged in the application of advanced and more efficient procedures for wastewater remediation, driven by the disadvantages of conventional technologies (i.e., reverse osmosis, ion exchange resins, and adsorption) for the treatment of difficult to remove toxic substances [2,6,7,8].
Advanced oxidation processes (AOP) could offer a cost-effective and desirable method to handle organic contaminants and subsequently convert these compounds to water, carbon dioxide, and harmless inorganic matter [9]. There is a need for intensive research to tackle the challenges of treating water and air, using an environmentally friendly solar energy process for an attractive, performant, and efficient degradation of organic pollutants [10,11,12]. Heterogeneous photocatalysis using a semiconductor is a promising advanced oxidation process for the decomposition of various organic compounds at low concentrations. The activity of the semiconductor photocatalyst depends mainly on the band gap of the material and the recombination rate of the generated electron(e)/hole(h+) pairs. These species are able to react with the organic matter through redox reactions that eventually lead to its degradation [12,13].
Nanoparticles from various semiconductors that have photocatalytic properties such as ZnO, SnO2, Bi2WO6, and TiO2 [14,15], have been researched in the photocatalytic degradation of a wide range of contaminants under natural or artificial light. TiO2 is the most widely used inorganic semiconductor in the field of heterogeneous photocatalysis because of its chemical stability, resistance to photo corrosion, safety, and low cost [9]. To develop TiO2 nanoparticles using highly pure titanium compounds, different procedures were used. Such as hydrothermal processes [1,15,16], sol-gel methods [4,17], and electrochemical processes [18,19]. Only minimal research has been conducted on the anodic oxidation of titanium scrap alloy to develop TiO2 nanoparticles [19].
Sunlight is considered to be an inexhaustible source of radiation. In Cuba, there is around 8 h of intense sunlight a day during the whole year, and the annual temperature is an average of 29.2 °C [20]. The sensitivity of TiO2 as a photocatalyst is restricted only to ultraviolet light and therefore it will exhibit minimal photoactivity under solar radiation, due to the small fraction of ultraviolet radiation contained in the solar electromagnetic spectrum (5%) [12]. In order to enhance the photocatalytic performance of TiO2 under solar light, various strategies were explored: non-metal doping (N, F, C, S), noble metal and transition metal deposition (Pt, Pd, Ag, Au, Cr, Co, Fe, V), dye sensitization, and/or coupling with other semiconductors (CdS, ZnO, Fe2O3, WO3) [21,22]. Previous studies claimed that Co and Fe doped TiO2 could be promising photocatalysts for dye degradation due to their high activity under light irradiation. Different Co loading gives Co3O4/TiO2/GO composites an enhanced stability under visible light irradiation and enhanced kinetics towards photodegradation of Congo Red [23]. The addition of Co improved the photocatalytic behavior of TiO2 in the photodegradation of Congo Red under visible light irradiation, with an photoactivity of 26% [22]. Photocatalytic degradation of reactive brilliant red K2G dye from aqueous solutions was enabled after 200 min UV light irradiation in the presence of Fe-TiO2/AC hybrid material [24]. A 60% efficiency of degradation for reactive red 198 after 5 h under visible light irradiation was possible using a Fe-TiO2/AC photocatalyst [25].
The development of composite TiO2-AC materials offers another route to enhance the photocatalytic response of TiO2, due to the textural properties of the support material and the ability of these compounds to transfer their absorption spectrum towards visible light [12]. For this reason, current studies report new methodologies in order to tackle these issues, by developing composites with materials such as graphene [26,27], metal-organic frames [28,29], hydroxyapatite [30,31], and activated carbon (AC) [32]. An important synergy between adsorption and photocatalytic degradation in water pollutant removal has been found in several studies [1,33].
Today, agricultural waste is receiving much more attention as a source of AC. The main advantage of biomass as a precursor is its low price, as it is considered a waste, in most cases without application, and regularly harvested in the same area where AC is produced, which is beneficial for direct cost and economics. This sustainable approach allows the recovery of a lignocellulosic waste product by carbonization in absence of oxygen and activation into AC, without contributing to an increase of CO2 emissions [34]. Typical agricultural waste streams as precursors for AC are: onion leaves [33], Brewers’ spent grain [35], coffee and coconut husk [36], rapeseed and raspberry seed cakes [37], peanut and rice husk [3], and hemp stem [38].
Agriculture in Cuba has been a significant activity for many years. This country has exceptionally favorable conditions for the cultivation of peanuts and to achieve sustainability in their production; however, it is necessary to increase the current volumes of production. In Santiago de Cuba, about 3000 tons of peanuts are processed per year. Around 800 tons of residual side streams are generated, as the shells of these nuts represent about 25–30% of their weight [3,39]. Moreover, because of the absence of post treatments of the milling residuals, there is an excessive accumulation in the environment, as residues are dumped under open sky.
The factory Celia Sanchez Manduley is one of the three textile factories that exist in Cuba, which has spinning, weaving, finishing, and printing plants characterized by a very complex production process. It is located in Santiago de Cuba, and large amounts of dyes are discharged to a river that flows into the local bay. In Cuba, the traditional treatment of effluents is limited to an oxidation process in the lagoons with the addition of cattle manure, which does not allow an exhaustive degradation of the colored compounds [40]. Several universities in the country are conducting research aimed at introducing biological methods for the treatment of highly colored effluents from alcohol production (sugarcane must), and from the pulping process of bagasse (black liquor) and coffee [41]. However, effluents from the textile industry, considered to be among the most polluting of all industrial sectors, have been less studied [40].
The aim of the present research is to develop two novel low-cost composites, with photocatalytic properties prepared from waste streams. To our knowledge, there are no studies regarding the photocatalytic decolorization of the CYF-4G dye in the presence of Co-TiO2/AC or Fe-TiO2/AC composites developed from residuals as peanut hulls from agricultural mini-industries, in combination with titanium scrap as a secondary residue from the Cuban metallurgical industry, demonstrating a circular economy approach. The dye studied is present in residual effluent from a textile factory in Santiago de Cuba. For determining the catalyst doping degree on AC, samples were characterized by TGA and EA. SEM, XRD, and a new X-ray absorption technique (XRA) [42] are used for studying the morphology and crystalline phases. Kinetic and adsorption studies of CYF-4G onto the Co-TiO2/AC and Fe-TiO2/AC composites were performed taking into account its pH at point of zero charge (pHPZC) and using batch and photocatalytic experimental setups under solar-simulated light.

2. Results and Discussion

2.1. Characterization of Adsorbents

2.1.1. TGA

To research whether the doped amounts of Fe-TiO2 and Co-TiO2 (target values of 5 wt.% and 10 wt.%, respectively) in the preparation of Fe-TiO2/AC and Co-TiO2/AC composites were reached, TGA was performed in the range of 25–900 °C. Figure S1 represents the TG curves for the composites and undoped AC and Table S1 displays the weight losses corresponding to moisture, volatile compounds, fixed carbon, and ash content of the samples, respectively.
The small weight loss for all three materials within the temperature range (25–150 °C) is associated with the initial evaporation of free moisture. Another minor weight loss at temperatures between 400 and 550 °C is mainly due to the volatile compounds left in the carbonaceous material and a limited degradation amount. The gas atmosphere was switched at 600 °C from nitrogen to oxygen. As a result, the weight loss is mainly due to burn off of the fixed carbon. The ash content at 600 °C could be considered as the mineral residue, including the amount of CaCO3 already present or formed in situ during the thermogravimetric measurement. In addition, the thermal degradation of CaCO3 occurs through decomposition into CaO(s) and CO2(g) in all samples, which results in increased weight loss in the temperature range of 600–700 °C. This mass loss is an indication of the carbonates present in the samples; from 800 °C, the residual mass almost remains constant.
At 900 °C, the ash content refers basically to the content of mineral oxides in the AC and includes mostly CaO from the decomposition of CaCO3 and silica, according to the XRD patterns displayed in Figure S4 and based on the FTIR spectrum of peanut hull AC (our previous research [3], and data from other researchers [43,44] that support these findings). In addition to mineral oxides present in the peanut hull AC, Fe, and TiO2 or Co and TiO2 are found in the doped AC composites.
According to the results presented in Table S1, changes in volatiles first increase and then decrease with increasing Fe-TiO2 or Co-TiO2 content and may be the result of a catalytic effect. Moisture and fixed carbon content continuously decrease in both composites from AC to ACFeTi10 or ACCoTi10. Table S1 demonstrates the rising of the ash content from AC to ACFeTi5 and ACFeTi10; the same trend was found in Co-TiO2/AC. The amounts of doped Fe-TiO2 or Co-TiO2 for the synthesized Fe-TiO2/AC or Co-TiO2/AC composites respectively were 5.36 wt.% for ACFeTi5, 9.53 wt.% for ACFeTi10, 7.06 wt.% for ACCoTi5, and 12.11 wt.% for ACCoTi10, and are obtained as the difference between the ash content at 900 °C of the composites and the ash content at 900 °C of the undoped AC. This result indicates that the amount of Fe-TiO2 impregnation in both composites was successfully deposited on the AC surface in almost the expected wt.% range. In the case of Co, this was less successful, but as it was only a target value, not that important. Most important is the realized difference in doping amount, being different enough to study its impact.

2.1.2. Elemental Analysis

The results of the elemental analysis for AC, ACFeTi5, ACFeTi10, ACCoTi5, and ACCoTi10 are displayed in Table S2. It can be observed that the carbon content for the doped composites decreases significantly compared to the undoped AC sample, in line with the fixed carbon results. A possible explanation for this decrease (apart from the dilution effect) is the catalytic effect of the Fe-TiO2 and Co-TiO2 on the AC structure during the thermal treatment at 550 °C when preparing the composites. This effect is also reflected in the hydrogen and nitrogen content, which is lower for the Fe- and Co-doped composites. The hydrogen content is the lowest for ACCoTi10, while nitrogen content is the lowest for ACCoTi5. A remarkable increase in the oxygen content is also observed for the composite adsorbents, which could be the result of catalytically induced AC oxidation reactions during the preparation.

2.1.3. pHPZC

The solution pH influences the ionization of polar pollutants and the surface charge of the ACs [3,45]. A variation of pH has an effect on the adsorption process due to the dissociation of the acid-base groups on the adsorbent surface. As a consequence, the reaction kinetics and the equilibrium of the adsorption process are affected. The pHPZC measurements of AC, the TiO2/AC, Fe-TiO2/AC, and Co-TiO2/AC composites were performed in the pH range between 2 and 10 according to Section 3.4.3 and the obtained results are displayed in Figure S2. With respect to surface chemistry, the values of the pHPZC revealed that the weak acidic nature of the carbon support (pHPZC = 5) was modified after the addition of Fe-TiO2 and Co-TiO2. Both composites display a neutral and alkaline pHPZC value between of 6.1 and 8.3, respectively. The difference in pHPZC could be caused by the shielding effect of Fe-TiO2 or Co-TiO2 on the AC support. Because of the preparation method of the composites, it is expected that no chemical bonding between the Fe-TiO2 or Co-TiO2 and the AC support occurs, but rather as a weak interaction (likely: charge transfer) [8].

2.1.4. Characterization of Crystalline Phase

The crystalline phases of the catalysts were investigated using XRD analysis. The XRD patterns of electrochemically synthesized TiO2 photocatalysts are displayed in Figure S3. The powder XRD observations are matching with the anatase profile of TiO2 (JCPDS 00-021-1272, space group I41/amd) [46], with characteristic peaks at 25.28, 37.8, 48.04, 53.86, 55.13, and 62.73, 2θ values associated with the (101), (004), (200), (105), (211) and (204) planes of the anatase crystalline phase [19,47,48].
The powder XRD diffractograms of Fe-TiO2 and Co-TiO2 (Figure S3) only show peaks assigned to the TiO2 anatase phase [49,50,51]. We could not observe any evidence of crystalline phases belonging to cobalt and iron oxides (Co3O4 and Fe3O4) [52,53,54], the most stable forms of the dopants in air [55]. Absence of dopant phases are due to the low content of dopants, as well as the dispersed distribution of the dopants in the anatase crystallites [55]. However, a careful analysis of the main reflection (101) of the anatase indicated a decrease in peak intensity, especially for Fe-TiO2, in comparison with Co-TiO2 composite and the bare TiO2 [53]. Since the ion radius values of Co3+ (0.61 Å) and Fe3+ (0.65 Å) are very similar to Ti4+ (0.68 Å) [56,57], it cannot be excluded that Ti4+ can be (partly) substituted by Fe3+ and incorporated into the TiO2 structure [25,58]. Furthermore, this incorporation can induce a perturbation in anatase crystal structure; as a result, the crystallinity decreased.
According to Figure S4, two broad, small peaks appear in the AC diffractogram at 24.6° and 43.9° associated with the presence of amorphous graphitic structures, as reported in the literature [47]. In addition to these broad peaks, two sharp peaks at 2θ values of 21° and 27°, characteristic for silica (quartz phase), and two peaks at 23° and 29°, characteristic for CaCO3 (calcite phase), can be observed. Such peaks can be assigned to the mineral matter of the undoped AC (17.19 wt.%) [59,60]. The ascending baseline at lower 2-theta angles is characteristic of ACs and is in accordance with the deformed graphene layer structure of undoped AC, as has been demonstrated in other studies [8]. Aluminum peaks are related to the sample holder material.
The diffractograms of the Fe-TiO2/AC and Co-TiO2/AC composites (Figure S4) display the main diffraction patterns belonging to the anatase phase (TiO2) mentioned above, highlighting the main peak (101) of the anatase. On the other hand, the ascending baseline at lower 2-theta angles that is characteristic of the AC is appreciable in all composite samples, and other phases that are present in the XRD of the AC can also be observed. The intensities of the main anatase peak are proportional to the TiO2 loadings (5 wt.% and 10 wt.%) in the composites. Figure S4 confirmed that no new phases appear in the composites independent of the degree of doping. [8,61].

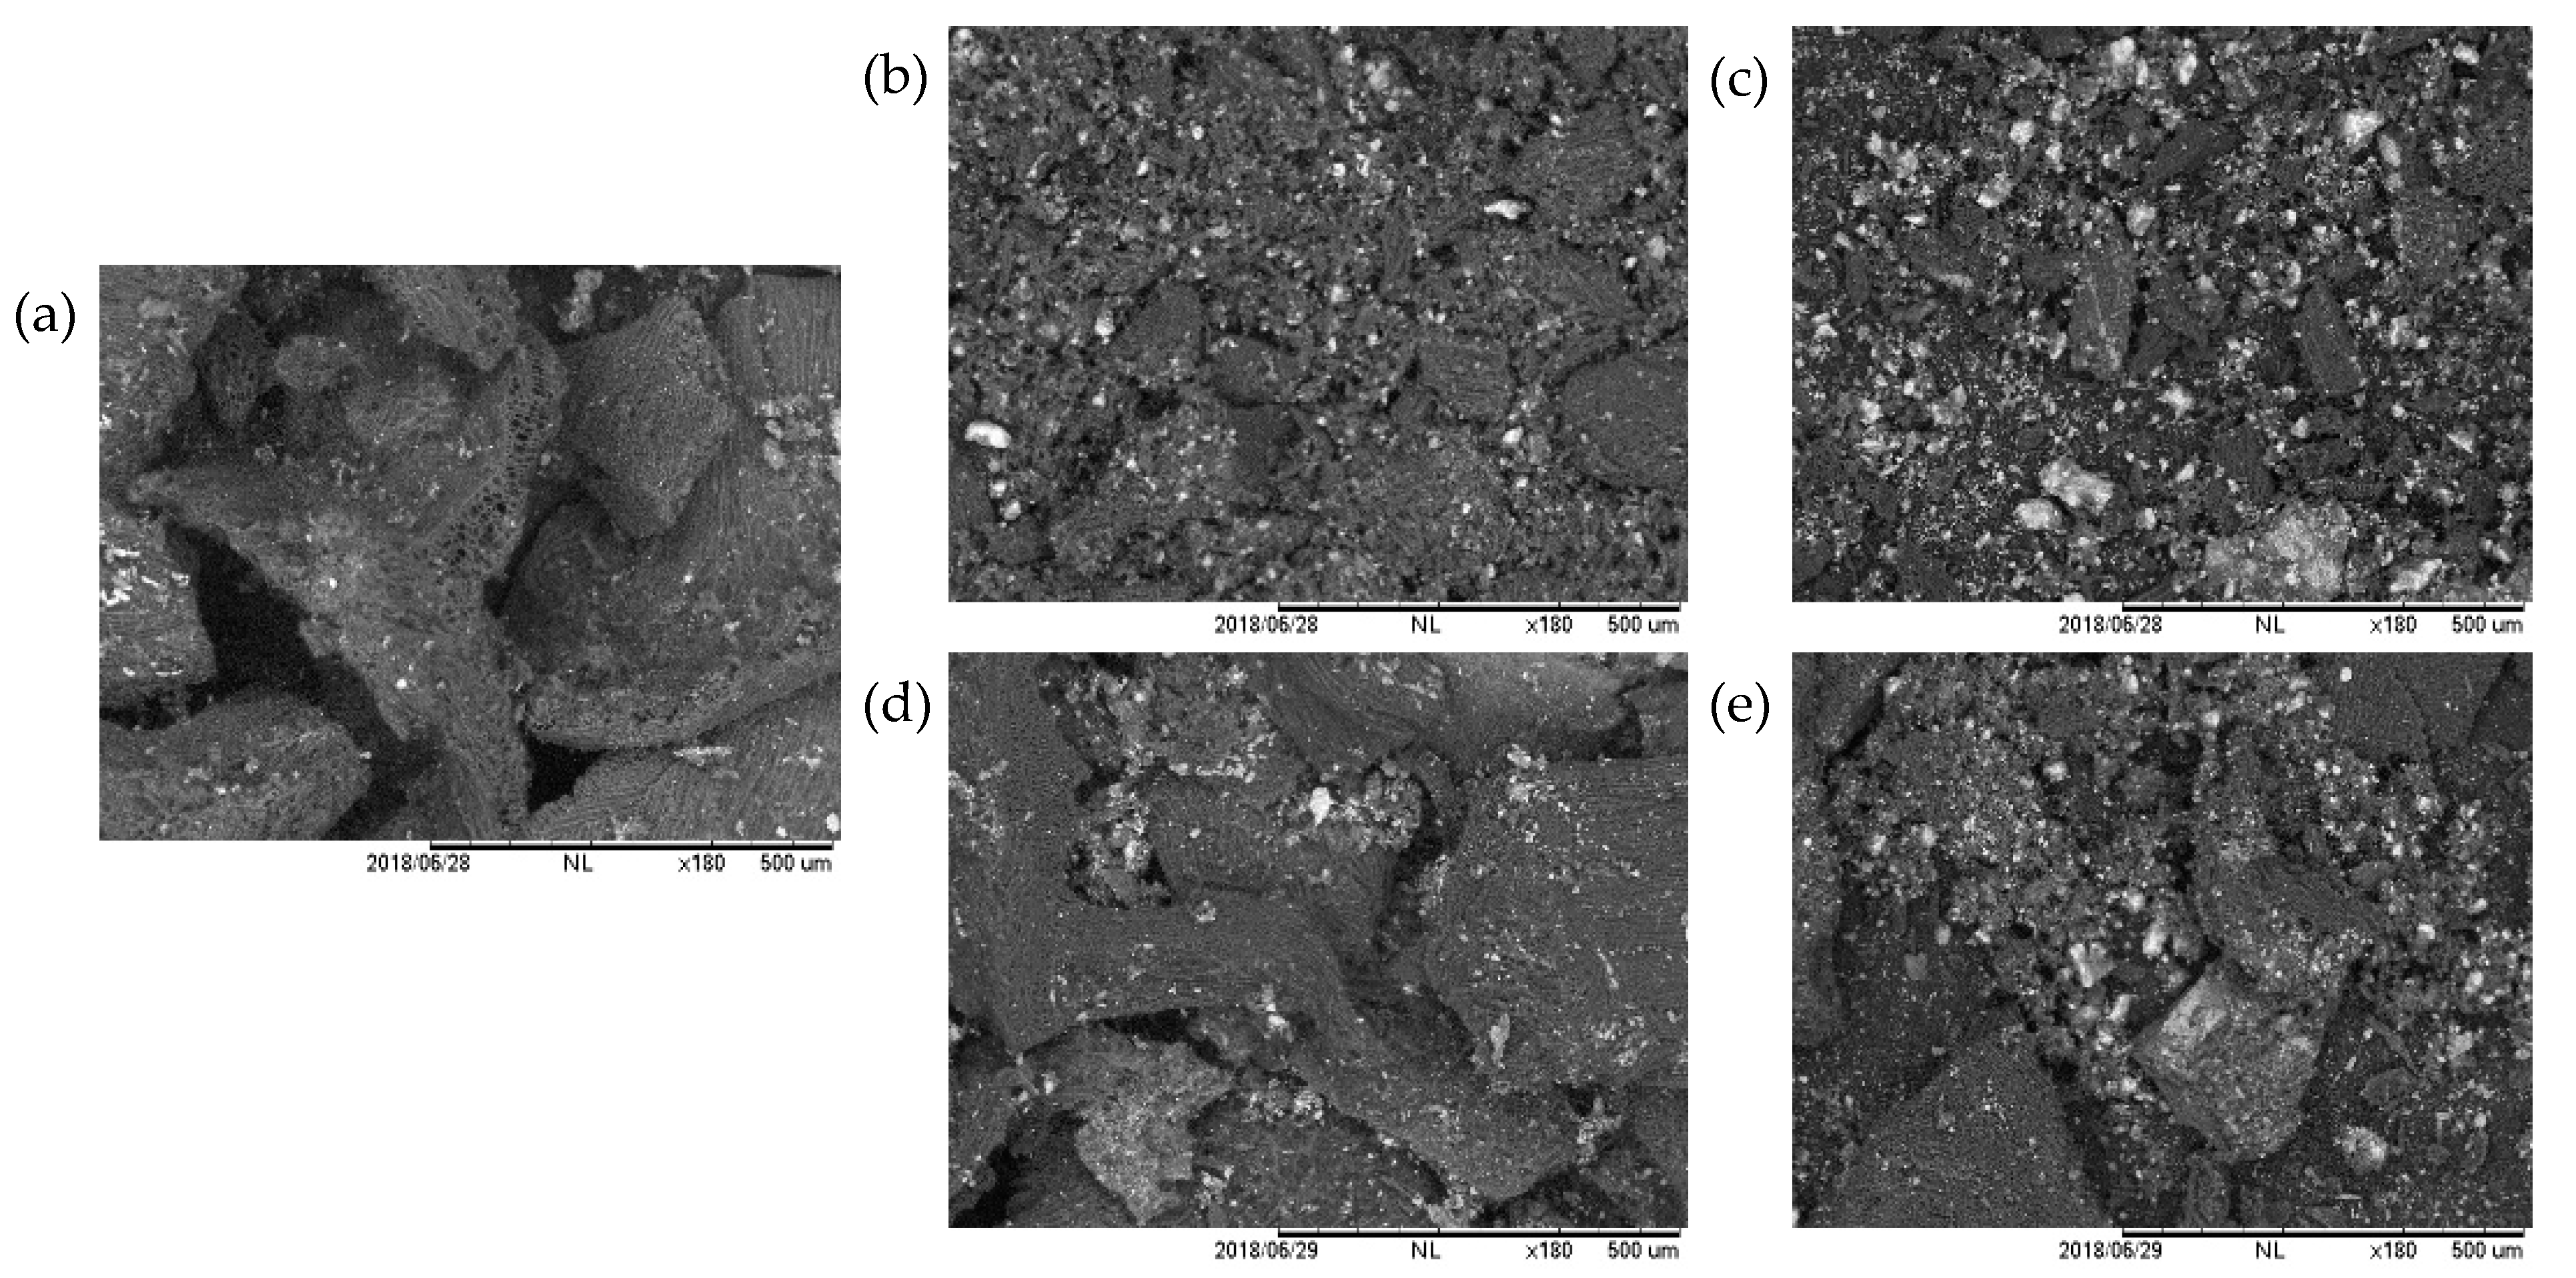
2.1.5. SEM-EDS and Binarization of SEM Images

It is known that the photocatalytic activity of Co-TiO2 or Fe-TiO2 composites depends largely on their morphological structure [62,63]. The surface morphology of TiO2, Fe-TiO2, and Co-TiO2 is displayed in Figure S5a, b, and c, respectively. As demonstrated, the TiO2, Fe-TiO2, and Co-TiO2 particles have an irregular shape and are clustered. EDS confirmed the presence of Ti, O, and Fe or Co as displayed in Figure S5d, e, and f, respectively.
The original SEM images for AC, ACCoTi5, ACCoTi10, ACFeTi5, and ACFeTi10 are displayed in Figure 1a, b, c, d, and e, respectively. In Figure 1a, this is despite a non-uniform morphology with an irregular porous surface of AC. Figure 1b–e depict SEM images for composites and reveal that TiO2 is dispersed on the surface of the AC.
The grey areas refer to the carbonaceous matrix [4] while light grey areas can be assigned to the mineral fraction (TiO2 and ash) in AC [64]. On the other hand, an increase of light grey areas from AC to the one with the highest percentage of Fe-TiO2 or Co-TiO2 doping is observed. To quantify this increase, a binarization strategy of the images is carried out to isolate the whiter fraction in the SEM images (Section 3.4.5).
Various threshold methods were applied to separate the black and white parts of the image. However, it has been verified during the development of the binarization of SEM images that the thresholds obtained using the Otsu method tend to produce an infra segmentation because it provides relatively high values in the histogram, which causes a significant number of pixels to be discarded as grey [65]. Figure S6 displays binary SEM images obtained using selected thresholds with black (total number of pixels in “0”) and white images (total number of pixels in “1”), obtained after the application of the binarization strategy, where it is possible to observe an increase in the number of pixels in “1” for analyzed composites with respect to the AC sample (Figure S6a). Composites with a higher inorganic fraction (merely Fe-TiO2 or Co-TiO2) (see Table S3) present a higher concentration of white pixels (Figure S6c,e).
Table S3 depicts the excellent correlation between the total number of pixels in “1” and the ash content at 900 °C for AC and composites samples. SEM and binary images demonstrate that the white areas increase for the composites due to an increase in the doped amount of Fe-TiO2 or Co-TiO2, coinciding with a decrease in the grey area at the surface and thus reflecting a lower carbon content. Even though the regions taken for the SEM study are limited in size with respect to the entire sample, Table S3 demonstrates that the correlation coefficient between the total number of pixels in “1” of the binary SEM images and the ash content has a value greater than 0.98. This may be because the surface of Co-TiO2/AC and Fe-TiO2/AC composites is homogeneously covered with Co-TiO2 or Fe-TiO2 particles without apparent agglomeration in a local area. Furthermore, TiO2 particles can be deposited not only on the surface but also in the mesopores and macropores of a carbonaceous matrix, which will increase the probability of receiving light and exhibiting increased photocatalytic activity [62].

2.1.6. X-ray Absorption (XRA)

The XRA method uses the different X-ray absorption levels by materials with different densities [65,66]. Evidence on the nature and amount of photocatalyst deposited on the AC surface is provided by the digital radiographic images as a grey scale display of the X-ray absorption by these materials [64,67]. The amount of absorbed radiation by the sample can be directly related with the density and atomic number/effective atomic number of ions/molecules or compounds deposited on the material [42,65,66].
The original X-ray radiographic images of AC, ACCoTi5, ACCoTi10, ACFeTi5, and ACFeTi10 samples, respectively, are found in Figure S7a, b, c, d, and e, respectively. The differences in brightness in the grey-scale radiographic images are noticeable. The ACCoTi10 and ACFeTi10 samples present more clear zones in comparison to the other layers. The brightness in the digital images decreases from those composites to the AC sample.
Considering that a whiter image corresponds to a high photonic attenuation [42,65,66], the digital radiographic images depicted in Figure S7c and e respectively confirm that ACCoTi10 and ACFeTi10 samples have a higher covering of Fe-TiO2 or Co-TiO2 on the original surface morphology and probably also in the macro (and meso) pores. The opposite is found for AC, and it could be suggested that its photon absorption is lower compared to the composites because it produces a darker image.
The brightness in the digital images, expressed as a normalized Grey Scale Intensity (GSI) value (scale “0” (black)–“1” (white)) is displayed in Figure S8 and Table S4. Figure S8c and e display GSI values of 0.2627 and 0.2314 for ACFeTi10 and ACCoTi10, respectively, which are closer to “1” in the normalized grey scale (whiter areas). On the other hand, ACFeTi5 and ACCoTi5 display GSI values of 0.2091 and 0.1901, respectively, reflecting fewer white areas (Figure S8b,d). Finally, for AC the narrow peak in the histogram (Figure S8a) appears closer to zero (GSI = 0.1373) and has the highest total number of pixels in contrast to the composite samples.
TGA also reveals significant differences between Co-TiO2/AC and Fe-TiO2/AC composites compared to AC, and a strong correlation between the ash content determined by TGA and the GSI value found with a R2 value over 0.986 (Table S4), confirming that the XRA method and binarized SEM images could be used to detect a different doping degree of photocatalyst composites, with reliable results as alternatives to traditional methods.

2.2. Adsorption Studies

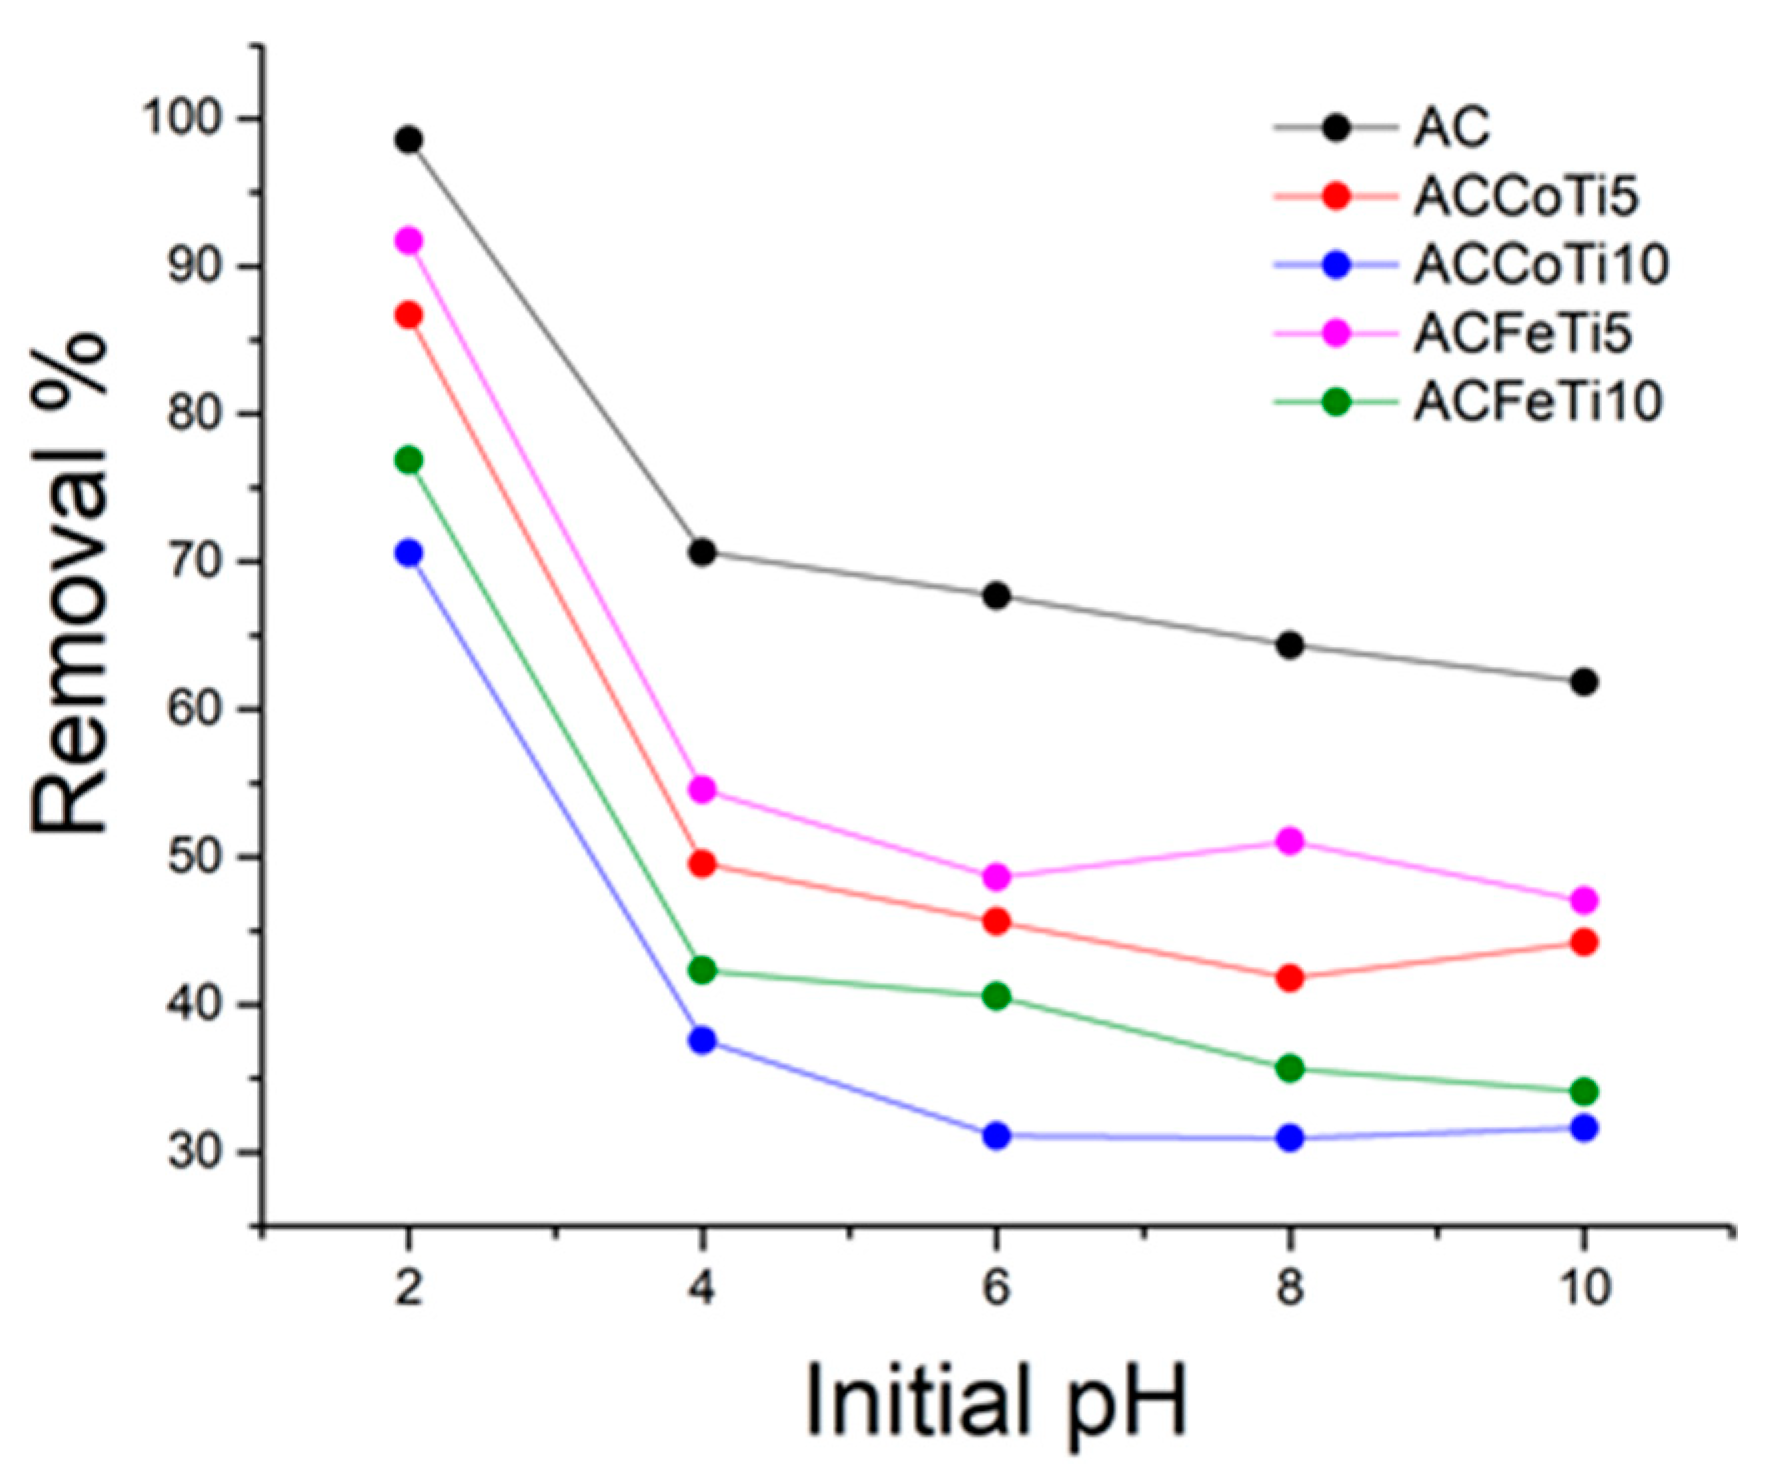
2.2.1. Effect of Initial pH

The pH of the solution is an essential factor in the adsorption process. ACs are materials with an amphoteric character. Depending on the pH of the solution, the surface of the adsorbent can be positively or negatively charged. When the pH is changed, the adsorption process is affected through dissociation of the functional groups at the active sites of the adsorbent. Anions or cations are released in the solution from ionic dyes when these are present, and the pH of the solution influences the adsorption of this anionic dye on the surface of the adsorbent [3].
The influence of pH (2–10) on the adsorption of CYF-4G on AC, ACFeTi5 and ACFeTi10, ACCoTi5, and ACCoTi10, respectively, is depicted in Figure 2. pHPZC of the adsorbents was 4.9, 6.1, 6.7, 8.0, and 8.3 for AC, ACFeTi5, ACCoTi5, ACFeTi10, and ACCoTi10, respectively (Figure S2). For a pH < pHPZC, the positive charge density at the surface of the AC increases. Therefore, the maximum percentage of color removal was observed at pH 2 for all adsorbents studied. At pH 2, a greater amount of protons is available, thus increasing the electrostatic attraction between anionic sulfonate groups from the dye molecule and the protonated functional groups, such as the carboxylic (–CO– OH 2 + ) and phenolic groups ( OH 2 + ) present onto the adsorbent [3]. Besides these electrostatic interactions, hydrogen bonds could be formed between the carboxylic and phenolic groups present on the surface of the adsorbent with the nitrogen and oxygenated groups of the dye molecule leading to an optimal adsorption of the dye CYF-4G, as displayed in Figure S9.
When the pH of the solution increased from 4 to 10, the adsorbent becomes less positive, going over a state of a neutral character to a form where the number of negatively charged sites increases, compromising the adsorption of the anionic dye due to electrostatic repulsion. In addition, it could be assumed that the excess of hydroxide ions will compete with the dye ions for the adsorption sites, causing a decrease in the adsorption at alkaline pH [68]. However, despite the fact that the dye removal decreased at alkaline pH, the adsorption of CYF-4G was still remarkable. This would indicate that when decreasing electrostatic attraction, π-π type interactions (i.e., between delocalized π electrons in the vicinity of a plane shaped by a layer of network in the adsorbent, and the aromatic π-electron cloud of dye molecule) are more and more the driving force for adsorption [3]. A similar trend in dye adsorption can be found for the composites as for the virgin AC. Therefore, the differences in dye removal by adsorption observed in Figure 2 between the AC and the Co-TiO2/AC and Fe-TiO2/AC composites can be attributed to: (1) the decreasing carbon content from the AC to the composites with higher doped photocatalyst percentage (Table S2), and (2) the increasing ash content from AC to composites with a higher doped photocatalyst percentage (Table S1).

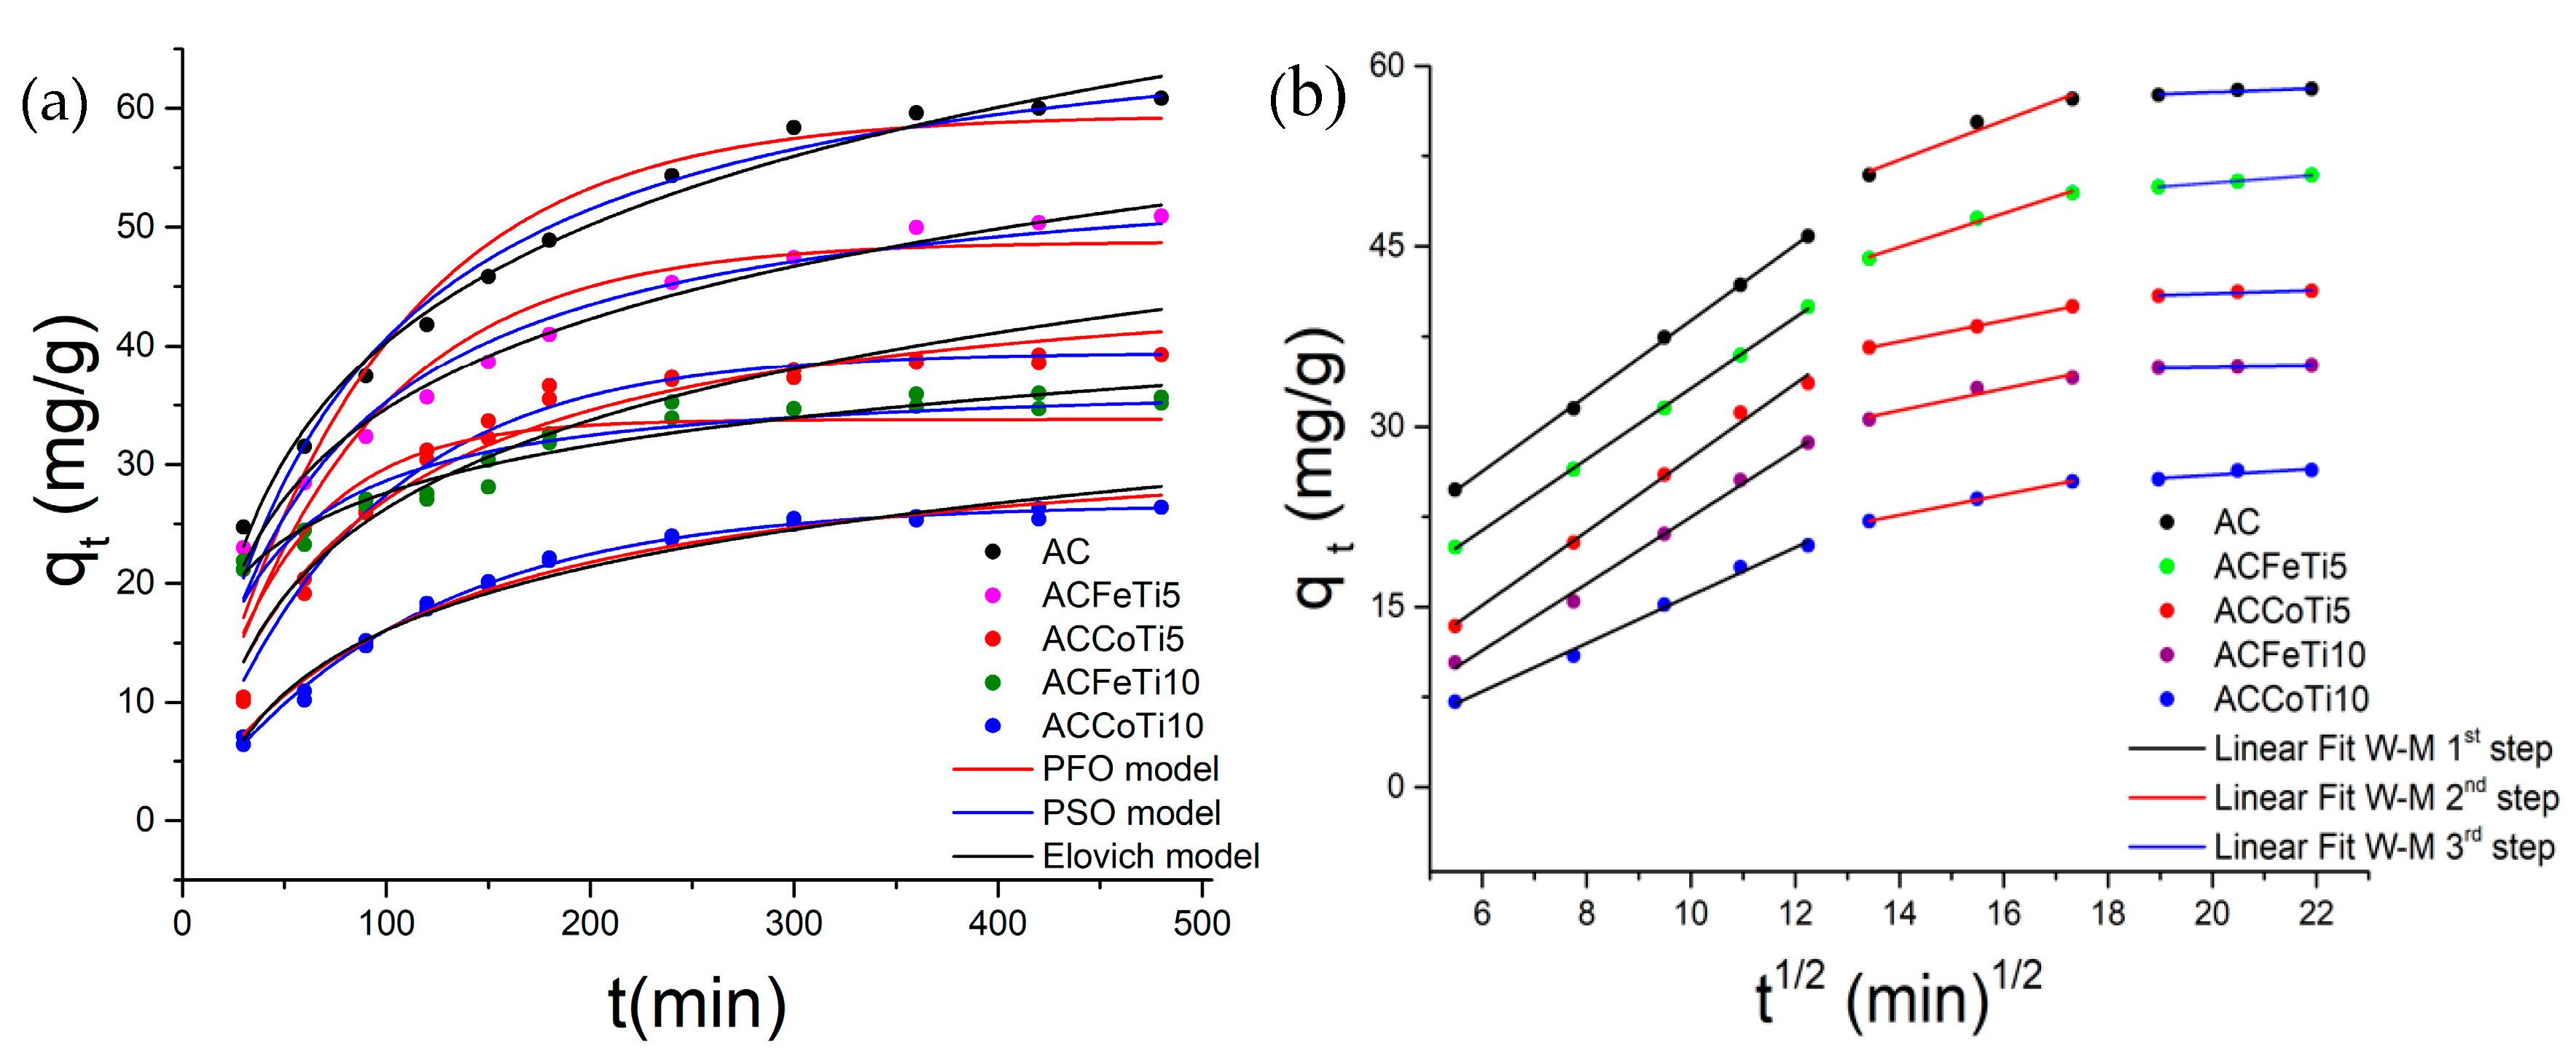
2.2.2. Adsorption Kinetics Studies

The study of adsorption kinetics is an essential parameter for the effectiveness of dye transfer from solution to the adsorbent. Figure 3 displays the effect of the contact time, and it can be observed that an equilibrium time of 4 h was required for the adsorption of the CYF-4G dye on AC, Co-TiO2/AC, and Fe-TiO2/AC composites to reach equilibrium. It can be observed that adsorption of CYF-4G is fast in the initial stage of the contact period, but gradually slows down until it reaches equilibrium [69].
When analyzing the kinetics of the CYF-4G dye adsorption onto AC, Fe-TiO2/AC, and Co-TiO2/AC composites, the mechanism in which the adsorption occurs can be elucidated using the non-linear regression of Elovich [70], PFO [71], and PSO [72] models.
Figure 3a displays the adsorption data for all the studied adsorbents fitted by the Elovich equation (Equation (9)), where β is a constant associated with the coverage of the surface, and α is in relation to the chemisorption rates. Table S5 displays that β values increased with higher doped photocatalyst amounts for both composites. On the other hand, the extent of surface coverage by CYF-4G molecules was higher for Fe-TiO2/AC at both doping levels than for Co-TiO2/AC. The chemisorption rates (α), varied with the doping percentage; the highest chemisorption rate was observed for the Fe-TiO2/AC compound. The correlation coefficient (R2) and root mean square error (RMSE) parameters suggest that the Elovich model is not the most appropriate fit to the data.
Table S5 also displays the fit of the experimental data using the PFO model. A difference between the estimated (qe) values and those obtained experimentally is observed. On the other hand, the PFO rate constant k1 increased with increasing doping percentage for Fe-TiO2/AC and decreased for Co-TiO2/AC. This trend is similar for the PSO rate constant k2, despite the fact that the R2 and RMSE values indicate that PSO is the best model.
According to Table S5, as the doping percentage increases, the adsorption capacity at equilibrium (qe) decreases, which is related to the decrease in fixed carbon and elemental carbon content, observed in Tables S1 and S2 respectively. The results in Table S5 display the best fit for the PSO model for all materials with the highest and lowest values of R2 and RMSE, respectively. Furthermore, it could be observed that the estimated qe values were in line with the experimental ones in contrast to the PFO and Elovich models. These findings suggest that one of the rate-determining steps could be chemical sorption, implying valence forces via electron exchanges or shares [73].
The Equation (11) proposed by Weber-Morris [74] allows for determination of which step limits the adsorption rate of the dye. Intraparticle diffusion will be the only rate determining step when the regression of qt versus t1/2 is linear and passes through the origin. However, as demonstrated in Figure 3b, this was not the case for the linear fitted line, and three well-defined linear regions at various t1/2 intervals were clearly observed, indicating that there are three steps in the sorption process.
The initial part of the curve from 0 to 10 min1/2 can be assigned to diffusion in macropores [75,76]. Table S6 displays that the k1p of all adsorbents has the highest value of diffusion rate, manifesting that this process is the fastest one [77,78]. The second linear range of the curve from 10 to 17 min1/2 is attributed to the diffusion in the mesopores. According to Table S6, the corresponding rate constants have the following hierarchical order: k1p > k2p> k3p.In the last linear region of the curve from 17 to 22 min1/2, it is observed that the adsorption process of the dye on all the samples studied becomes slower. This finding suggests that intraparticle diffusion occurs gradually and is associated with the diffusion of adsorbed molecules/ions to the outside of the adsorbent towards the adsorbent pores over the wall pore surfaces, or both [79].
In our previous work, a similar phenomenon was observed in the adsorption of CYF-4G onto AC, based on peanut hulls [3]. The diffusion rate decreased as the dye entered the adsorbent matrix, which was attributed to the reduction of the free route of the dye into the pores of the adsorbents and the pore sizes [80,81]. This decrease is more significant when the availability of these pores and their sizes decreases with increasing Co-TiO2/AC or Fe-TiO2/AC ratios.

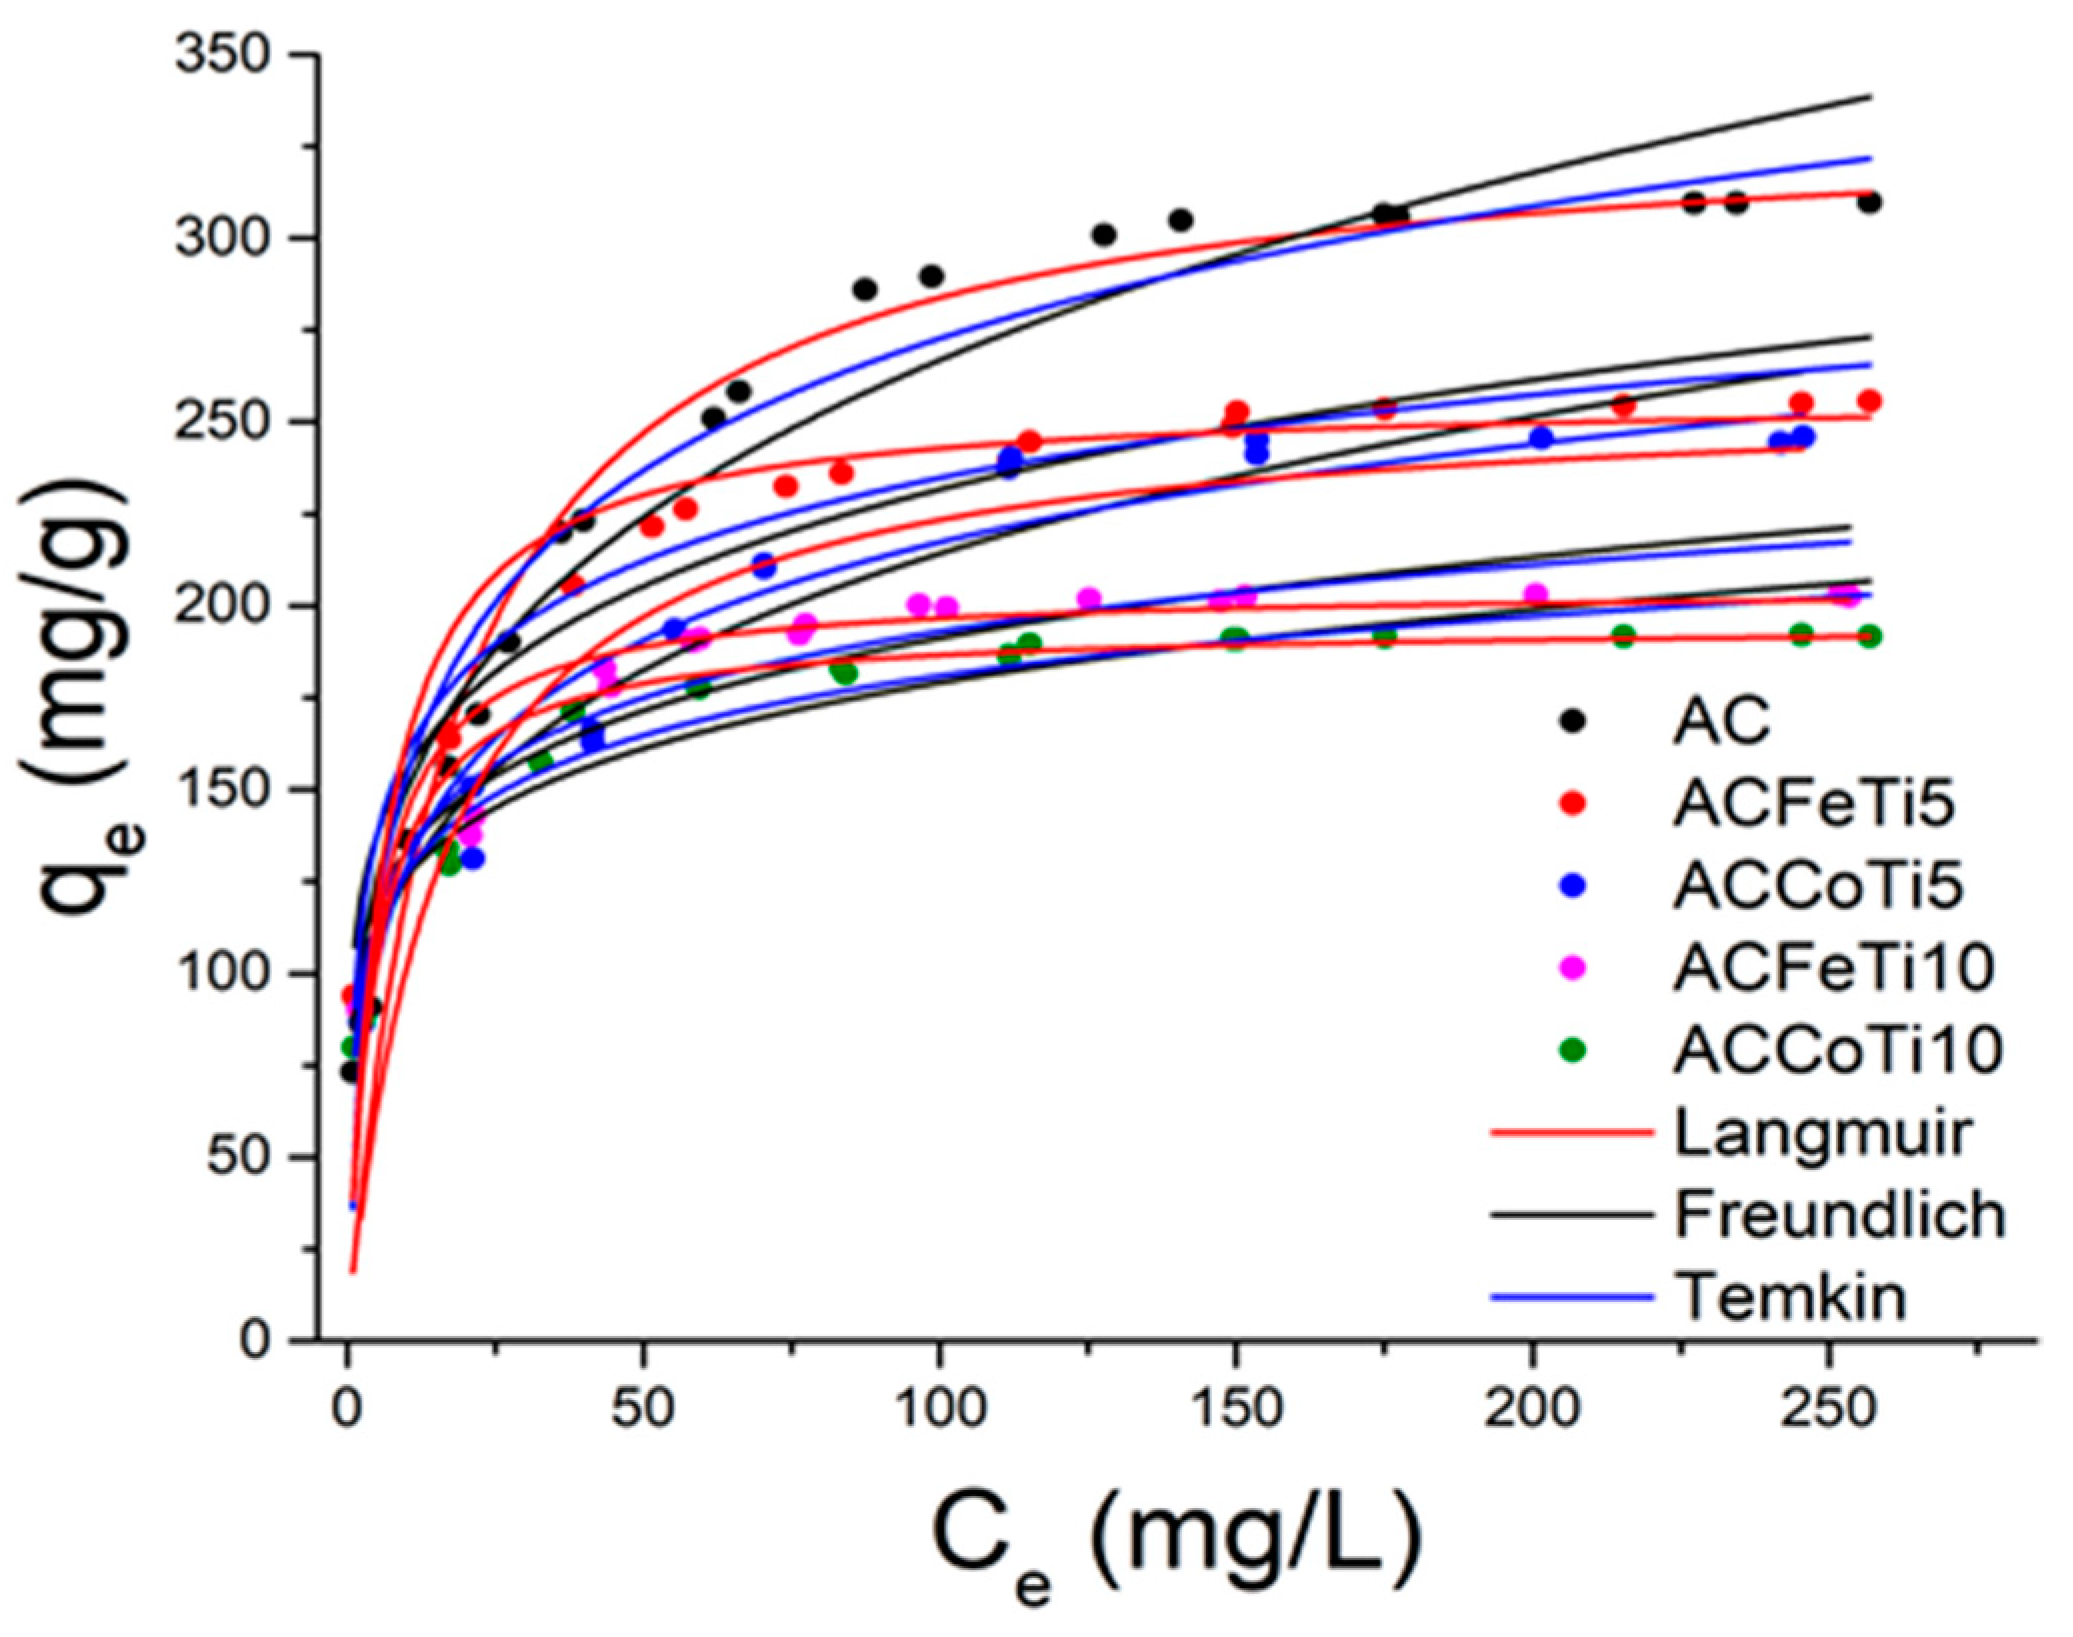
2.2.3. Adsorption Isotherms-Models

A comparison of the non-linear models of Langmuir [82], Freundlich [83], Temkin [84], and experimental data of CYF-4G dye adsorption on AC, ACCoTi5, ACCoTi10, ACFeTi5, and ACFeTi10 is displayed in Figure 4, respectively. Table S7 shows R2 and RMSE, which were analyzed in this study to evaluate the well-fitting and most appropriate model.
The generated values by the Langmuir model correspond with the plateau of the experimental data observed in Figure 4, and the comparison of R2 and RMSE between all the models suggests that the Langmuir model was the most suitable model to fit the data. Moreover, adsorption occurs on a homogeneous surface and the adsorbed layer has the thickness of an adsorption monolayer without interaction between the adsorbed ions.
From the Freundlich model, a value of 1/n less than 1 indicates a favorable adsorption process [3]. The values of 1/n displayed in Table S7 for all the samples studied are in the range of 0.152 to 0.252, which suggests a favorable adsorption of the dye on all the adsorbents studied. Nevertheless, the values of the fit parameters of the Freundlich model are lower when compared to the Langmuir model.
In the Langmuir model, the KL is a measure of the adsorption energy; when the energy values are low, there should be a higher adsorption of the dye [85]. Figure 4 and the data in Table S7 demonstrate that the highest maximum coverage capacity of the monolayer is for AC. This finding could be associated with the larger number of available adsorption sites; when the percentage of doping increases from 5 to 10 for both series (Fe-TiO2 and Co-TiO2), there will be fewer active sites for dye adsorption. Although this Q m a x 0 from composites decreases with respect to AC, it is observed that the trend is as follows ACFeTi5 > ACCoTi5 > ACFeTi10 > ACCoTi10.
The best adapted isotherm models and the adsorption capacity of some different dyes in various TiO2/AC adsorbents in aqueous solutions have been investigated by other researchers and these results are summarized in Table 1. The adsorption isotherm study of composites in this research demonstrated similar trends to those reported in the literature [9,86,87,88].
It also reveals that Fe-TiO2/AC or Co-TiO2/AC composites could be used as a potential adsorbent for dye removal, despite the decrease of adsorption capacity by increasing the doping percentage, high adsorption capacity values are still obtained in comparison to other studied composites, as displayed in Table 1. The favorable adsorption capacity of ACCoTi5, ACCoTi10, ACFeTi5, and ACFeTi10 due to AC porosity, could accelerate the decomposition process under visible radiation, through the interaction of the adsorbed CYF-4G and the photoactive catalyst [89,90,91].

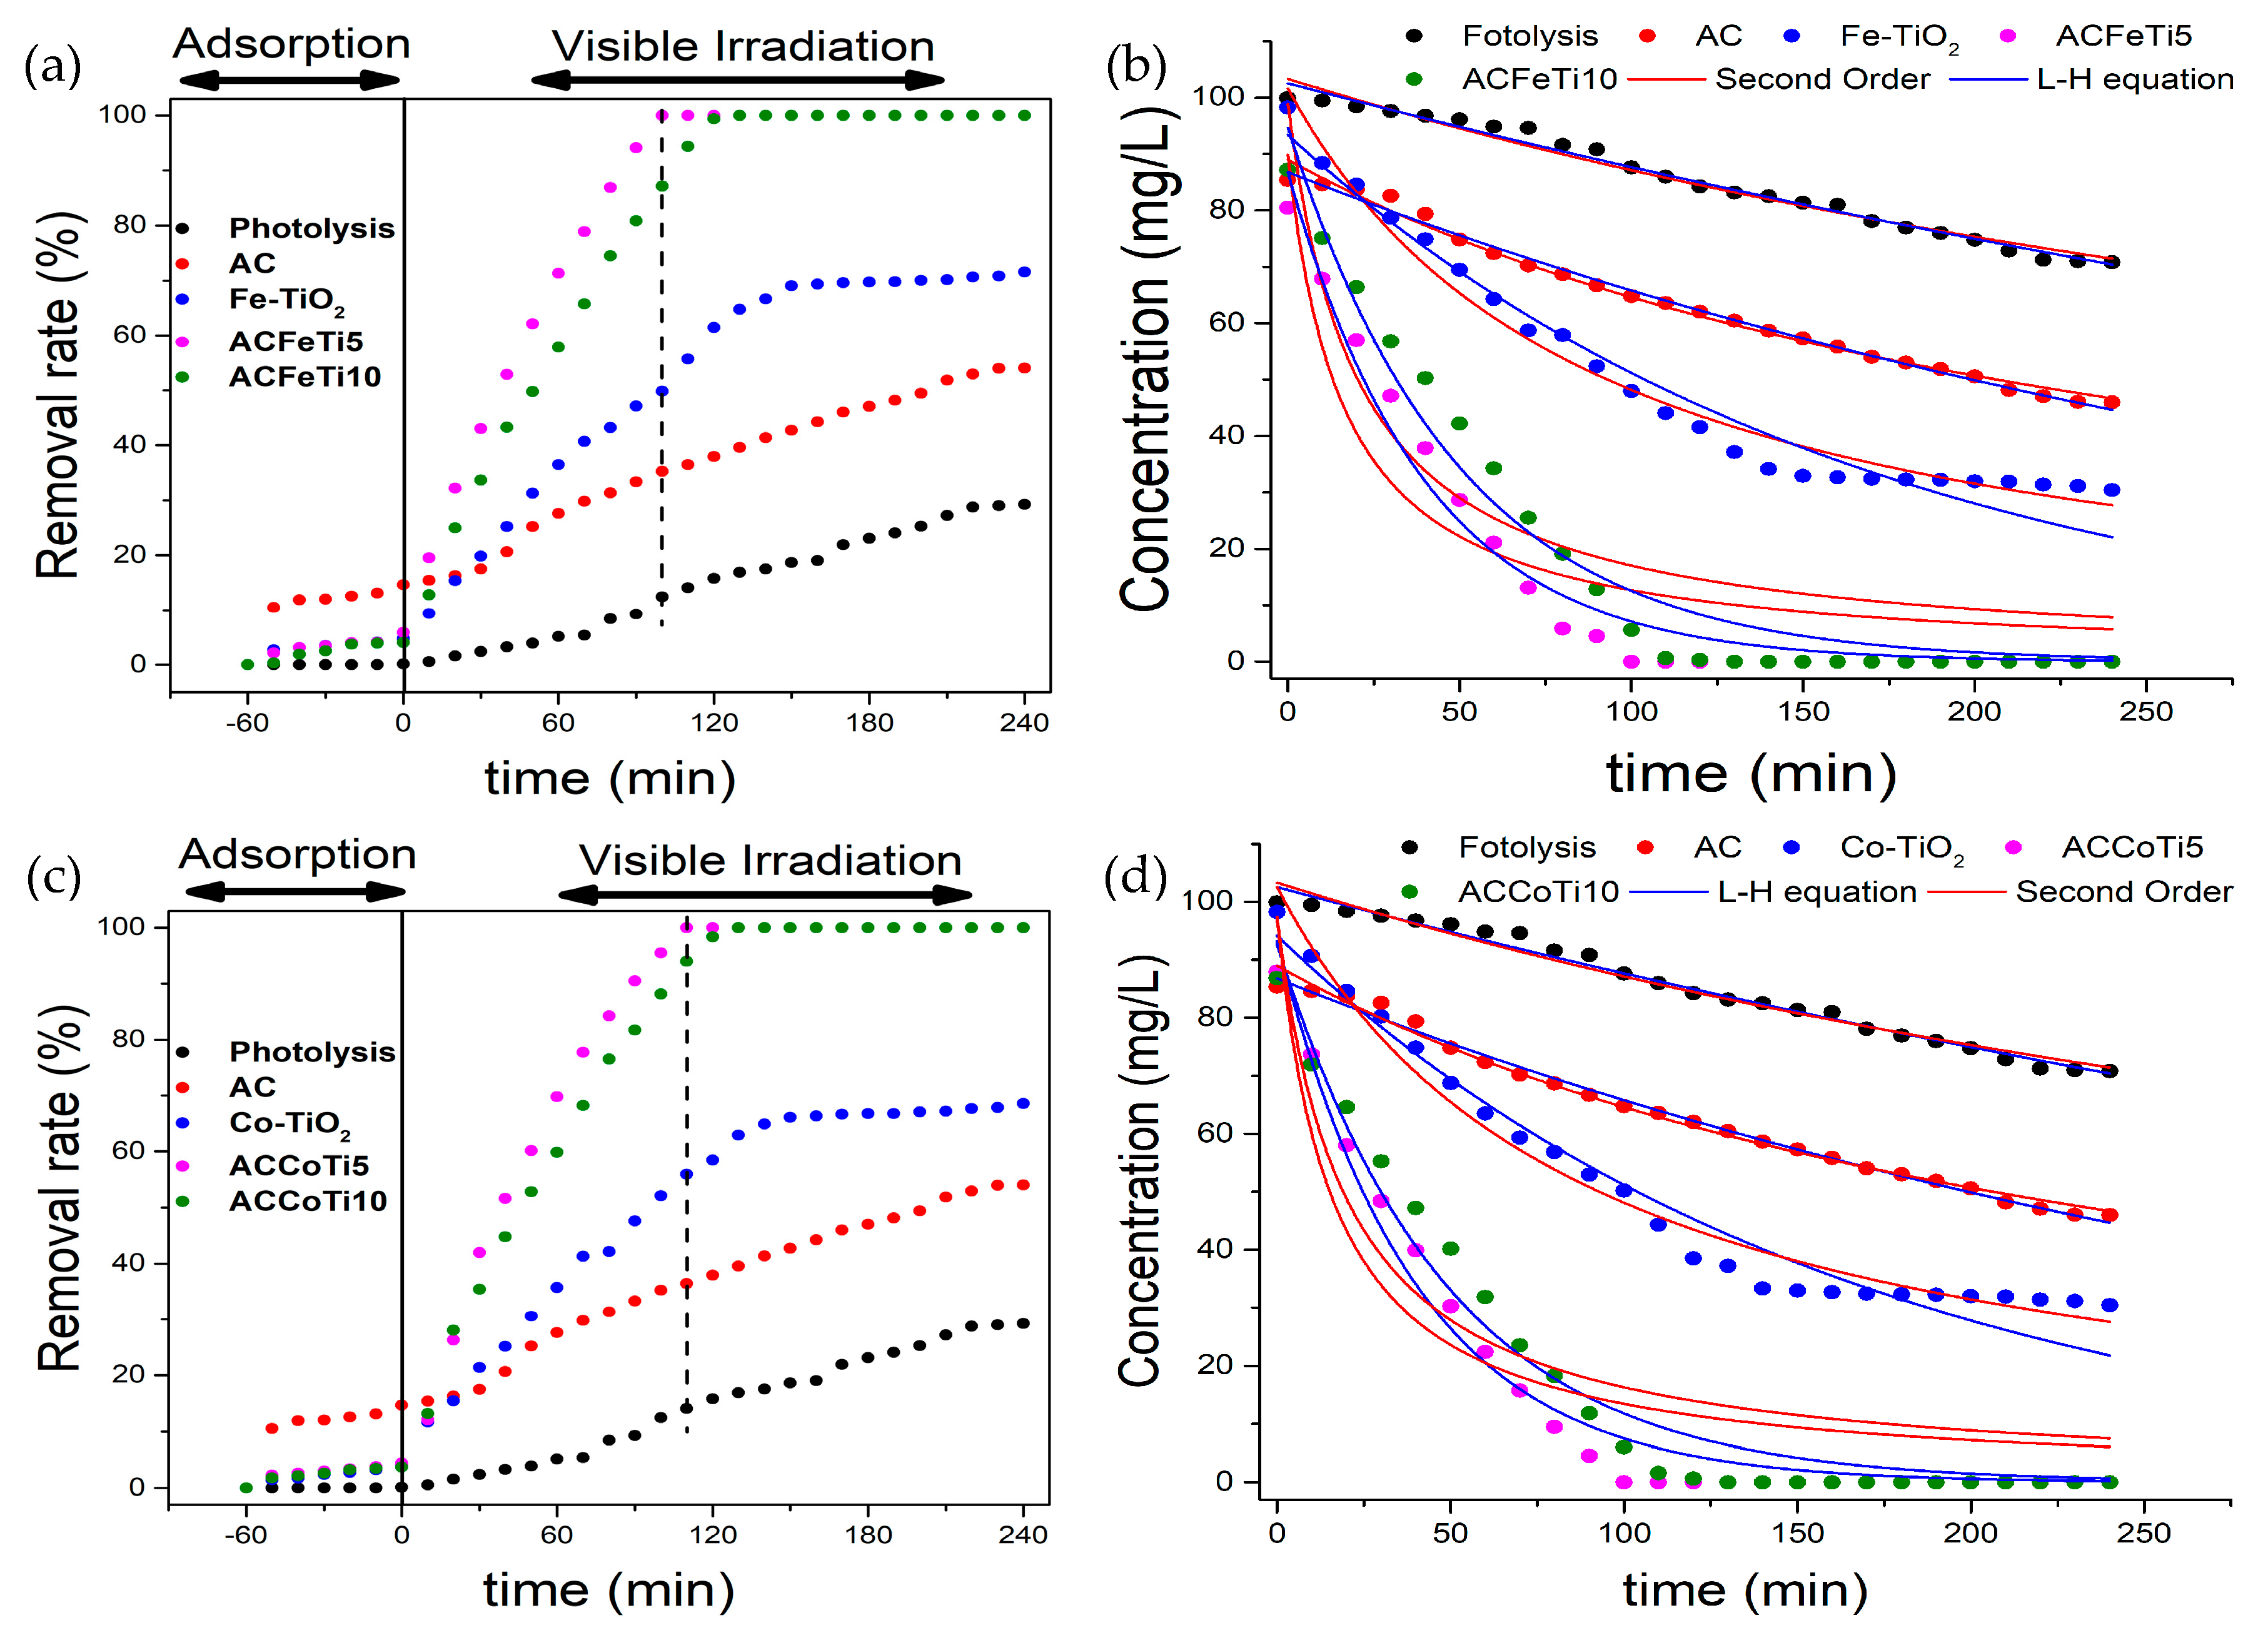
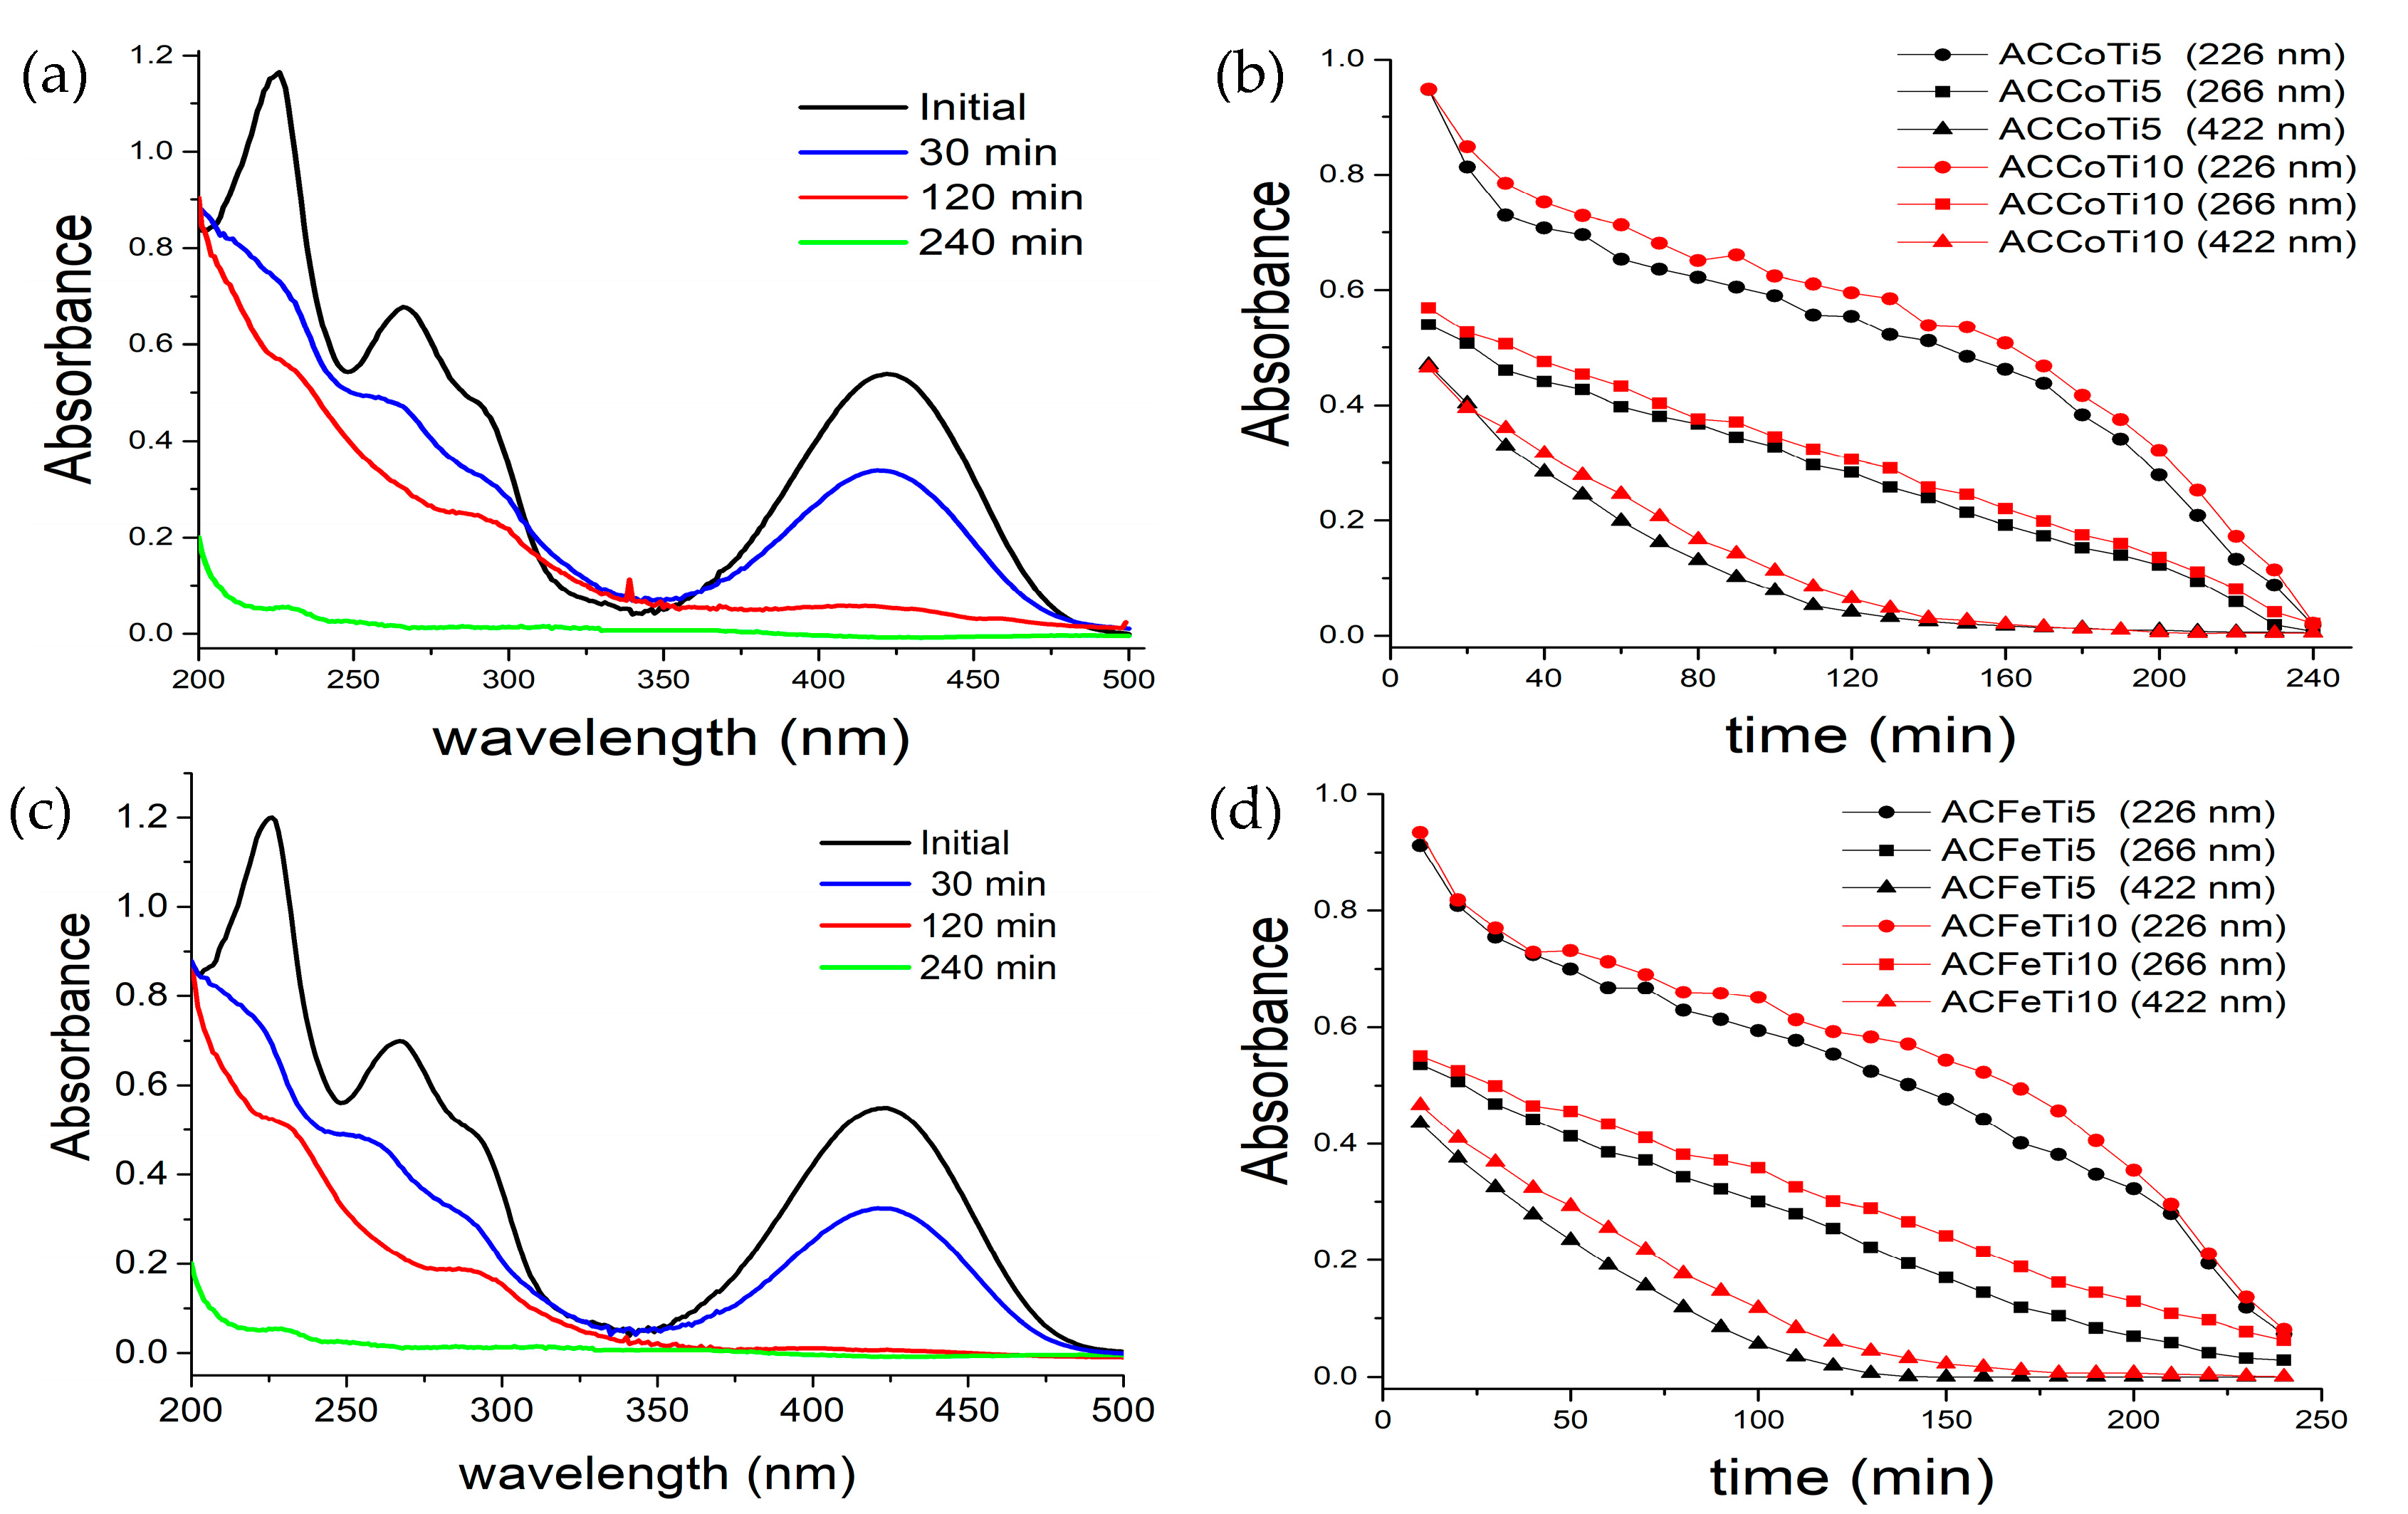
2.3. Photocatalytic Degradation of CYF-4G

The photocatalytic degradation of the dye was studied by recording full UV-Vis spectra during visible radiation on ACCoTi5 and ACFeTi5 (as target samples), as explained in Section 3.10. The absorption spectrum of CYF-4G was characterized by a broad band in the visible region, with a maximum absorption at 420 nm, and three bands in the ultraviolet spectral region located at 226 nm, 267 nm, and at around 290 nm (shoulder) (Figure 5a,c). The peaks at 226 nm, 267 nm, and 290 nm resulted from multiple π→π* transitions related to the benzene ring [92,93,94] and the n→π* transition related to heterocycle rings involving antibonding orbitals of all substituents (i.e., N, S, Cl and O) [17,95]. The absorption band at 420 nm was attributed to the absorption of the n→π* transition related to the chromophore group containing the azo linkage (–N=N–) [94,96].
The absorption bands in the visible region demonstrated a rapid decrease and totally disappeared over 120 min, as illustrated in Figure 5b,d. However, the degradation rate of chromophores related to the absorption peaks located in the ultraviolet region was much slower and the vanishing of these bands was observed at around 240 min. As displayed in Figure 5b,d, the same degradation performance was observed for both composites (Co-TiO2/AC and Fe-TiO2/AC). This finding suggests that the breakdown of benzene and heterocyclic rings progresses slowly during the oxidation process, because the absorption energy involved in the π→π* transition is higher than in the n→π* transition of the azo link (–N=N–) [94]. Therefore, the oxidizing hydroxyl (•OH) radicals and superoxide radical anions (•O2−) first attack and open the azo linkages, decreasing the length of the conjugated π systems so that decolorization of the solution takes place earlier than the total degradation of the dye and its intermediates related to the bands at 226 nm, 267 nm, and 290 nm, respectively [96].
With the aim of determining the optimal synergistic contributions of adsorption and photocatalytic phenomena to the global degradation process, different interactions were studied: (1) between dye and AC, Co-TiO2, and Fe-TiO2 photocatalyst, respectively, and (2) between dye and ACCoTi5, ACCoTi10, ACFeTi5, and ACFeTi10, respectively.
As adsorption tests in the absence of irradiation were discussed in Section 2.2.3, these experiments are referred to as dark tests. In this way, it is possible to evaluate the fraction of the dye removed due to a non-catalytic reaction (adsorption on the porous AC support), in order to counteract this contribution to the overall efficiency of dye removal and photocatalytic degradation performance. As has been discussed in Section 2.2.3, when the ratio of Co-TiO2 or Fe-TiO2 in the AC increases, the percentage of retained dye is lower (Figure 6a and c, respectively). The adsorption process in the presence of these hybrid materials will be governed by electrostatic interactions, hydrogen bonds, and by the affinity of the dye for the surface of the catalyst, as demonstrated in Figure S9. Under visible light irradiation, two processes are responsible for CYF-4G degradation: photolysis and photocatalytic degradation. Figure 6a and c illustrate both processes separately, and their synergistic effect on dye degradation for Fe-TiO2/AC and Co-TiO2/AC, respectively.
As shown in Figure 6a,c, after 2 h of irradiation, the photolysis process of the dye as such leads to a limited CYF-4G removal of 29%. In the presence of AC, Co-TiO2, and Fe-TiO2, the adsorption and photocatalytic process had a total contribution of 54, 69, and 71%, respectively. The dye removal rate was almost 100% in the presence of the composites within the same time period. The presence of Co-TiO2 and Fe-TiO2 on AC increases the rate of dye removal in the aqueous phase, confirming the synergic relationship between adsorption and photocatalytic degradation, as also reported in [97]. As illustrated in Figure 6a,c, the dye removal rate by Fe-TiO2/AC and Co-TiO2/AC composites is almost similar.
As shown in Figure 6b,d, the concentration of colorant CYF-4G decreased as such (direct photolysis) and in the presence of AC (adsorption), Co-TiO2 and Fe-TiO2 (photocatalytic degradation), ACCoTi5, ACCoTi10, ACFeTi5, and ACFeTi10 (adsorption and photocatalytic degradation), but with different kinetics. Kinetics of photocatalytic degradation was analyzed using the second-order and Langmuir-Hinshelwood (L-H) models. By fitting the non-linear expressions, Equations (12) and (13), the two rate constants k2d and kLH were determined and are summarized in Table 2.
A synergistic effect (RC) will exist when RC > 1; however, if RC < 1, the reaction will be inhibited [98]. Synergy or inhibition factors are calculated using the RC parameter, described by Equation (1):
R C = k a p p ( M TiO 2 + A C ) k a p p ( M TiO 2 )
where M = Fe or Co, kapp (M − TiO2 + AC), and kapp (M − TiO2) are the apparent rate constant for the composite and for the photocatalyst, respectively [99].
Table 2 displays that the highest R2 values and the lowest RMSE values were found for the Langmuir-Hinshelwood (L-H) model, indicating that it is the most appropriate to describe the photo(catalytic) degradation of the CYF-4G dye on the composites studied [62,100]. Equation (14) is used to calculate the half-life time t1/2 of the dye using the kLH because this is the model that best explains the degradation.
For ACFeTi5 and ACCoTi5, the degradation rate increases with respect to AC, evidenced by the increase of the kinetic constants of the two studied models k2 and kLH (Table 2). The half-life time t1/2 of the dye (adsorption and degradation) (and its intermediates) decreases with the increasing amount of catalyst onto AC support, indicating that the intermediates degrade very quickly [101,102]. The addition of Fe-TiO2 or Co-TiO2 catalysts, up to a target value of 5% on the AC support, leads to a significant RC value of 4.15 and 4.09, respectively (Table 2). However, a decrease in photoactivity is observed for samples with a higher percentage of Fe-TiO2 or Co-TiO2 (ACFeTi10 and ACCoTi10), due to the decrease in the RC values and rate constants (k2 and kLH), as well as the increase in the half-life time t1/2 of the dye, compared to those found in Table 2 for ACFeTi5 and ACCoTi5. From this observed trend, it can be suggested that there is an optimal ratio of Fe-TiO2 or Co-TiO2 that provides the best conditions for synergy between AC and composites. Nevertheless, a positive synergistic effect exists for all composites; but, from a practical point of view, the composites with a lower catalyst percentage could be used in order to use less catalyst and achieve a fast degradation of the dye.
The potential to improve photocatalytic degradation efficiency is provided through the combination of Co-TiO2 or Fe-TiO2 photocatalyst and AC, since porosity leads to a high adsorption of the dye and direct availability for photocatalytic degradation. Additionally, this could increase the rate of degradation of the dye and improve the absorption of visible light [103]. Thus, water molecules are available as electron donors; they react with the migrated charge carriers (electron(e)/hole(h+) pairs), producing highly reactive and strongly oxidizing hydroxyl radicals (•OH). The constant concentration of oxygen has a profound effect and is often presented as a powerful oxidant that removes the electrons from the conduction band, forming superoxide radical anions (•O2−), which could provide an additional pathway capable of fully mineralizing the dye molecules, as illustrated in Figure S9. It is important to note that the results indicate the beneficial role of AC in the photocatalytic degradation of the dye CYF-4G, where AC first acts as an adsorbent for the dye nearby Co-TiO2 or Fe-TiO2 sites, making the photocatalytic degradation more efficient. Hence, Co-TiO2/AC or Fe-TiO2/AC composites exhibit clearly the synergistic effect of adsorption and photocatalysis, resulting in a very efficient removal and degradation of the dye and in-situ regeneration of the composites.

3. Materials and Methods

3.1. Materials

AC was prepared from local available peanut hulls, discarded from food processing industry in Santiago de Cuba, as described in our previous work [3]. In short, peanut hulls were first pyrolyzed at 450 °C, followed by an isothermal period of 60 min. For activation, an adapted horizontal reactor oven was used; peanut char was heated in an inert atmosphere at 10 °C/min to 850 °C and was kept at this temperature for 30 min in a steam atmosphere [3,104]. The obtained AC displays a specific area of 616 m2/g and a total pore volume of 0.348 cm3/g [3].
Analytical grade reagents were used. The sodium salt of CYF-4G, Figure S10 in supplementary information, was obtained from Kremer Pigments (Aichstetten, Germany). This anionic dye, used in a textile factory from Santiago de Cuba, was selected as the adsorbate, with a molecular weight of 728.03 and stoichiometric formula of C24H21ClFN9Na2O8S2. A stock solution of 1000 mg/L CYF-4G was prepared using Milli-Q water. Ammonium chloride (NH4Cl, 99.5%) and sodium dodecyl sulphate (SDS) (CH3(CH2)11SO4Na, 99%), were purchased from Sigma-Aldrich (Overijse, Belgium). Ethanol (CH3CH2OH, 95.5 v/v%) was purchased from J.T. Baker (J.T. Baker-Fisher Scientific, Merelbeke, Belgium). A 1.000 g/L of Fe and 1.000 g/L of Co standard solution for spectroscopy were purchased from UNI-CHEM (Belgrade, Serbia).

3.2. Electrochemical Preparation of Nanosized TiO2

The nanosized TiO2 powder was prepared by electrochemical method [19]. The anode was a 50 cm2 square plate, hand-cut from a sample of titanium scrap positioned in the rotational center of the cylindrical stainless-steel cathode, which also has the function of being the external body of the electrolytic cell, as displayed in Figure S11, and 250 mL of working solution consisting of 60 v/v% ethanol, 0.15 M NH4Cl, and 0.01 M SDS were added to the cylindrical electrochemical cell.
A current density between 4–8 mA/cm2 was passed through the anode to produce nanosized TiO2 with continuous rotation of the anode. After 60 min., the potentiostatic oxidation of the titanium scrap is stopped and the suspension is separated from the solution. The TiO2 solid is washed several times with small portions of Milli-Q water until no chloride ions are detected, dried in an oven at 110 °C for 24 h, and finally heat treated at 550 °C for 3 h prior to characterization.

3.3. Preparation of Fe-TiO2/AC or Co-TiO2/AC Composites

The electrochemically synthetized TiO2 was doped with 0.5 wt.% of Co and 1 wt.% of Fe to prepare the 0.5-Co-TiO2 and 1-Fe-TiO2 composites, respectively, by an impregnation method [105]. For preparation of the 1-Fe-TiO2 composite, an amount of 4.95 g of TiO2 is added to 50 mL of solution of 1.000 g/L of Fe (present as nitrate). Meanwhile, to prepare the 0.5-Co-TiO2 composite, it was necessary to take 4.975 g and add to 25 mL of solution of 1.000 g/L of Co (present as nitrate). The slurry was stirred for 1 h at room temperature and the suspension was dried at 50 °C for 24 h. The photocatalysts were calcined at 550 °C for 5 h with a ramp rate of 100 °C/h. The synthesis of Co-TiO2/AC or Fe-TiO2/AC composites was carried out by vacuum impregnation in a rotary evaporator, using ethanol as solvent. Four composites with an AC: M-TiO2 mass ratio of 95:5 and 90:10 was prepared and are noted as ACCoTi5, ACFeTi5, ACCoTi10, and ACFeTi10, respectively. Next, and in order to remove the excess ethanol, the samples were dried in an oven at 110 °C for 24 h. Finally, the composite obtained is heat treated at 550 °C for 3 h in an inert atmosphere prior to characterization. TGA analysis of ACs in an inert atmosphere indicated a limited mass loss (3.3%); therefore, AC was used as such without thermal treatment at 550 °C.

3.4. Characterisation Techniques

3.4.1. Proximate Analysis

Proximate analysis experiments were performed according to [3]. In a TA Hi-Res 2950 Thermogravimetric Analyzer (TA Instruments, Zellik, Belgium), the sample is heated at 20 °C/min from room temperature to 600 °C in a N2 atmosphere, then the gas is switched from N2 to O2 and heating is prolonged to 900 °C at the same heating rate.

3.4.2. Elemental Analysis (EA)

EA was performed according to [3], in a Thermo Electron FlashEA 1112 elemental analyzer (Thermo Electro, Waltham, MA, USA). The CHNS-content is given as a result of the analysis and the oxygen content was calculated by difference according to: O% = 100% − (C% + H% + N% + S% + ash%).

3.4.3. pH at the Point of Zero Charge (pHPZC)

The procedure for the pHPZC determination is described in [106] and in supplementary information.

3.4.4. X-ray Diffraction (XRD)

XRD experiments were performed according to [65] on a Bruker D8 Discover XRD spectrometer (Bruker, Karlsruhe, Germany). X-rays are sensed by a 1D lynx eye detector using 192 separate channels (Si strips), each one acting as a single detector. A step size of 0.04° (2theta) and 3s of counting time are used for all measurements.

3.4.5. Scanning Electron Microscopy (SEM)—Energy Dispersive X-ray Spectroscopy (EDS)

SEM-EDS measurements were performed on a FEI Quanta 250 FEG microscope (FEI, Eindhoven, The Netherlands). Morphological characteristics of analyzed samples were observed using an Hitachi TM3000 electron microscope (Hitachi, Krefeld, Germany). Standard experimental conditions and magnification are applied according to [65]. The obtained SEM image is represented as a grey-scale image, where each pixel represents brightness variations. Once the grey-scale image is obtained, a binarization strategy was applied in order to isolate the whiter parts in the original image (representing the inorganic fraction of analyzed AC, ACCoTi5, ACCoTi10, ACFeTi5, and ACFeTi10 samples). Several thresholding methods can be applied for this purpose [107]. In this work, threshold selection for the black and white binarization was done considering the threshold that produced the best similarity between original images and black and white images. A numerical value of 0.5 was selected as a threshold to perform the binarization of the image. Quantification of the number of white pixels is done using the image histogram and a devoted algorithm implemented in MATLAB, specifically for this application.

3.4.6. X-ray Absorption (XRA)

A new characterization method (XRA) was conducted as described in [65] in order to study the distribution of Fe-TiO2 and Co-TiO2 within the composites. The XRA method uses digital image processing on digital X-ray radiography in order to identify characteristic grey scale intensity (GSI) values for each analyzed sample [65,66]. XRA measurements were conducted according to [65].

3.5. Batch Equilibrium Studies

The adsorption equilibrium tests (in batch) were performed according to our previous work [3] and in the supplementary information. The amount of CYF-4G adsorbed at equilibrium, qe (mg/g), was found in accordance with Equation (2):
q e = ( C o C e ) V m
where Co (mg/L) and Ce (mg/L) are the initial and equilibrium adsorbate concentration in solution, respectively; m (g) is the dried mass of adsorbent; V (L) is the volume of the adsorbate solution.
The same procedure was followed for batch kinetic studies [3], but the samples were taken at pre-set time intervals. The dye uptake at any time, qt (mg/g), was found in accordance with Equation (3):
q t = ( C o C t ) V m
where Ct is the CYF-4G dye concentration (mg/L) at a pre-determined time t (min). The percentage removal of CYF-4G dye was calculated by the Equation (4):
P e r c e n t a g e   r e m o v a l   ( % ) = C o C e C o * 100

3.6. Effect of Solution pH

The experiments to evaluate the initial pH effect on the CYF-4G dye adsorption process were conducted according to [3]. The initial pH of the solution in a range from 2 to 10 was measured using a Knick 764 Multi-Calimatic pH meter (Knick, Berlin, Germany).

3.7. Adsorption Equilibrium Isotherms

The relationship between the amount of CYF-4G dye adsorbed on a certain amount of adsorbent (AC, ACCoTi5, ACCoTi10, ACFeTi5, and ACFeTi10) at constant temperature when the equilibrium is reached, is defined as an adsorption isotherm. The experimental data corresponding to equilibrium were analyzed using the Langmuir [82], Freundlich [83], and Temkin [108] models.
Adsorption at a homogeneous surface by a monolayer without interaction between the adsorbed ions is described by the Langmuir model [82]. The non-linear form of the Langmuir model can be depicted by Equation (5):
q e = Q m a x 0 K L C e 1 + K L C e
where Q m a x 0 (mg/g) is the monolayer capacity of the adsorbent, C e (mg/L) is the adsorbate concentration at equilibrium, q e (mg/g) is the amount of adsorbate uptake at equilibrium, and K L (L/mg) is a mass transfer coefficient [82].
The Freundlich isotherm describes the adsorption involving heterogeneous and multi-layer adsorption. This empirical isotherm can be depicted by Equation (6):
q e = K F C e 1 n    
were KF and 1/n, correspond to the adsorption capacity and the adsorption intensity [83].
The adsorption heat and adsorbate-adsorbate interaction in adsorption isotherms are studied by Temkin and Pyzhev [84]. Temkin isotherm equation is presented by Equation (7):
q e = R T b ln ( K T C e )
where R is the ideal gas constant (8.314 J/mol K), T is the absolute temperature (K), b is the variation of the adsorption energy (kJ/mol), and K T is the equilibrium binding constant (L/g).

3.8. Adsorption Kinetic Models

In an attempt to describe the kinetics of CYF-4G dye adsorption onto AC, ACCoTi5, ACCoTi10, ACFeTi5, and ACFeTi10, pseudo-first order (PFO) [71], pseudo-second order (PSO) [72], and Elovich [70] models, based on the adsorption rate law, and Weber-Morris, based on intraparticle diffusion kinetic, were used [74].
PFO model can be fit to the adsorption kinetic data by the Equation (8):
q t = q e ( 1 e k 1 t )
where q e and q t are the amounts of adsorbate uptake per mass of adsorbent at equilibrium and at any time t (min), respectively, and k1 (1/min) is the rate constant of the PFO model [71].
The adsorption kinetic can also be described by the PSO, and the linear equation is generally given by Equation (9):
q t = q e 2 k 2 t 1 + k 2 q e t      
where k2 (g/mg.min) is the rate constant of the PSO model [72].
The Elovich equation [70] has been widely used in the sorption studies of dyes in aqueous solution [109] and is generally expressed by Equation (10):
q t = 1 β ln ( 1 + α β t )
where α is the initial chemisorption rate constant (mg/g min) and β is the desorption constant (g/mg).
The intraparticle diffusion model is commonly used for identifying the adsorption mechanism and is given as [74]:
q t = k i p   t 1 2 + C i
where kip is the intraparticle diffusion rate constant (mg/g min1/2). When intraparticle diffusion is the rate limiting step, then the curve of qt vs. t1/2 passes through the origin. When film diffusion is also taking place, then the intercept is Ci, which gives an idea on the thickness of the boundary layer. Nevertheless, if various process steps dominate the adsorption kinetics, this may be due to the fact that there are various linear trends in the adsorption process. [74,75,78]. Therefore, they must be analyzed as independent processes [75].

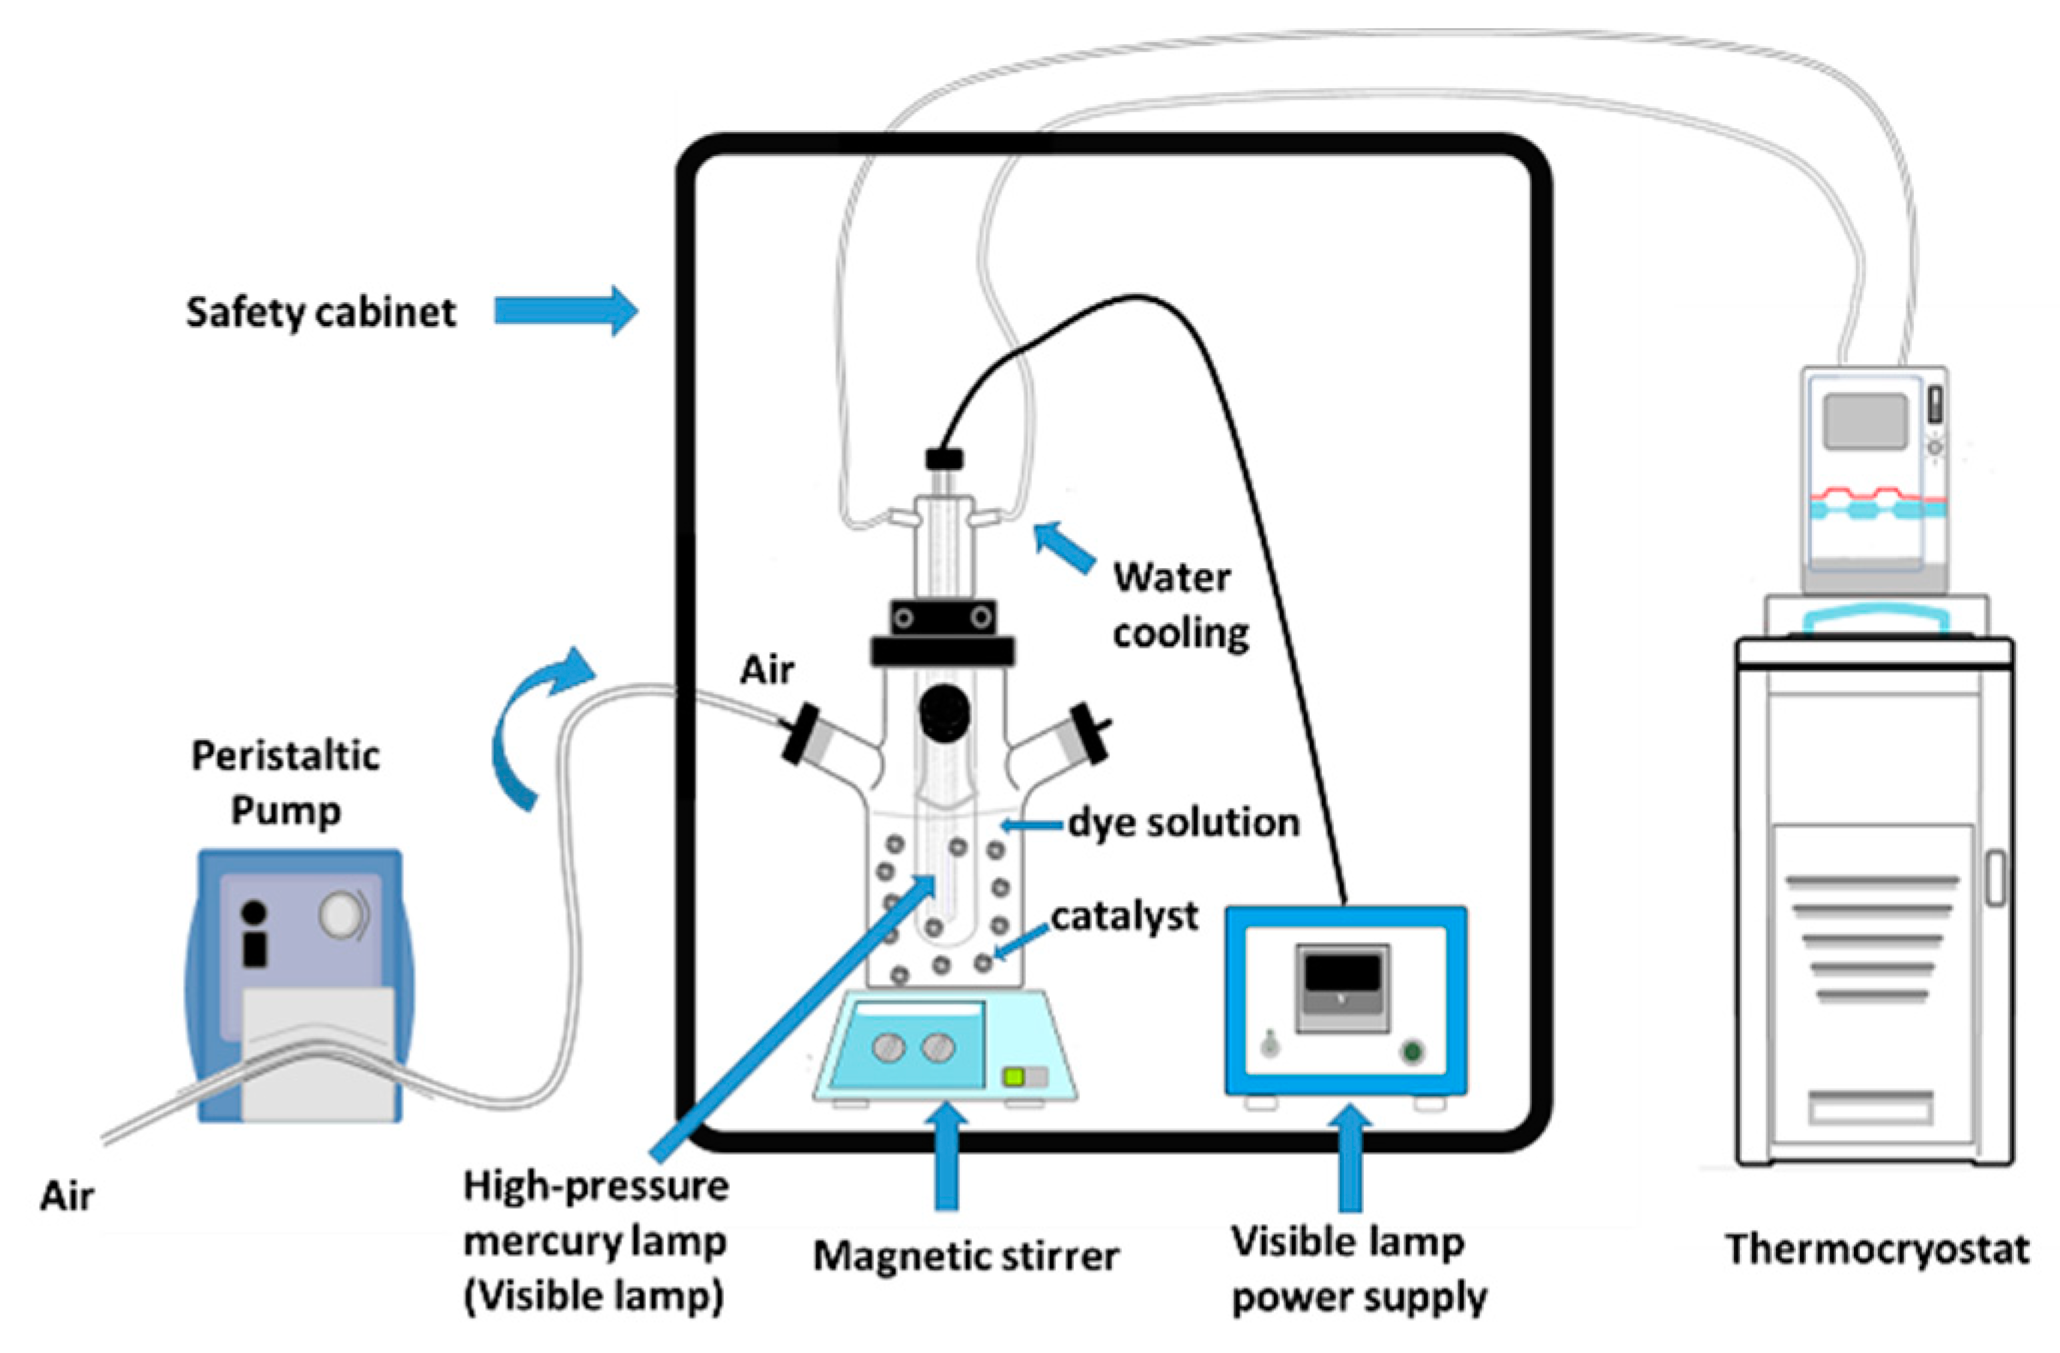
3.9. Photocatalytic Degradation Experiment

The photodegradation of the CYF-4G dye on Fe-TiO2/AC and Co-TiO2/AC composites was conducted using visible light irradiation at 15 °C, in the reactor shown in Figure 7. The light source (250 W high-pressure mercury lamp (Techinstro)) (Techinstro, Nagpur, India), emits visible light and covers the range from 360 nm to 579 nm, with peaks at 365 nm, 420 nm, and 520 nm. During the photocatalytic experiments, 50 mg of Fe-TiO2, Co-TiO2, AC, ACCoTi5, ACCoTi10, ACFeTi5, or ACFeTi10 was added to 650 mL of a solution of CYF-4G dye (100 mg/L) at pH = 2 under magnetic stirring at 250 rpm, keeping it in the dark using a safety cabinet for 60 min to reach equilibrium of the adsorption, and then the suspension was irradiated with visible light. Under this radiation, 1 mL of sample was taken every 10 min and centrifuged to separate the solid. The photocatalytic degradation of CYF-4G dye was monitored by measuring absorbance at 420 nm on a Biochrom Ultrospec 9000 UV-Vis Spectrophotometer (Fisher Scientific, Merelbeke, Belgium).

3.10. Kinetic Equations of CYF-4G Dye Degradation

The degradation kinetics were studied by fitting the experimental data to the second-order (SO) and Langmuir-Hinshelwood (LH) models. The SO model [110] is described by Equation (12):
C t = C 0 1 + k 2 d C 0 t
where k 2 d (mg/g.min) is the SO rate constant and Co and Ct (mg/L) are the dye concentration at initial and at time ‘t’, respectively. The LH model [110] is described by Equation (13),
l n ( C t C 0 ) = k L H t
where k L H (1/min) is the LH model rate constant, and from this parameter it is possible to determine the half-life time of the reaction by Equation (14):
t 1 2 = 0.693 k L H  

4. Conclusions

Co-TiO2/AC and Fe-TiO2/AC composites were prepared from agricultural waste residues and remelted titanium scrap. X-ray diffractograms display that the presence of AC does not alter the crystalline phase (anatase) in the Co-TiO2 or Fe-TiO2 photocatalyst. TGA and SEM-EDS confirmed that the Co-TiO2 or Fe-TiO2 photocatalyst was homogeneously distributed on the AC surface and in the expected concentration range. The intraparticle diffusion model demonstrates that the adsorption of CYF-4G on these carbonaceous materials starts with a fast adsorption of the CYF-4G on the outer surface, and then an intraparticle diffusion inside the adsorbent. The pseudo-second order is the kinetic model which best describes the adsorption process of the CYF-4G dye. Adsorption obeys the Langmuir isotherm for AC, ACCoTi5, ACCoTi10, ACFeTi5, and ACFeTi10. As the proportion of Co-TiO2 or Fe-TiO2 in the AC substrate increased, a lower adsorption of dye on the composite is found. For composites with 5 and 10% doping of the photocatalyst, removal efficiencies were close to 100% after visible irradiation for 2h. This enhanced efficiency of the new composites could be related to the increased adsorption of the dye on the surface, coinciding with a photocatalytic degradation process under visible light irradiation. Co-TiO2/AC or Fe-TiO2/AC composites facilitate the complete removal of CYF-4G, when combined with adsorption, by maintaining a fast and high photocatalytic degradation capacity and desorption process of formed products. The prepared Co-TiO2/AC or Fe-TiO2/AC composites display high potential as an alternative for recalcitrant dye removal and its degradation from industrial wastewater. Finally, the synergy between adsorption and photodegradation of CYF-4G contributes to the in-situ regeneration of these new composites, prolonging their lifetime and use, demonstrating the overall sustainability and favorable economy of this approach.

Supplementary Materials

The following are available online at https://www.mdpi.com/article/10.3390/catal11101137/s1, Figure S1. TG curves of AC, ACCoTi5, ACCoTi10, ACFeTi5 and ACFeTi10; Figure S2. Point of zero charge measurements for AC, ACCoTi5, ACCoTi10, ACFeTi5 and ACFeTi10; Figure S3. X-ray diffraction patterns of TiO2, 0.5 wt.% Co-doped and 1 wt.% Fe-doped TiO2; Figure S4. X-ray diffraction patterns of AC, TiO2, ACCoTi5, ACCoTi10, ACFeTi5 and ACFeTi10. Peak labelling corresponds to the following: ■ AC; ▲ Anatase and ● Al peaks (from sample holder); Figure S5. Scanning electron microscopy images of: (a) TiO2, (b) Fe-TiO2 and (c) Co-TiO2 and EDS spectra of (d) TiO2, (e) Fe-TiO2 and (f) Co-TiO2; Figure S6. Black and white binary images (a) AC, (b) ACFeTi5, (c) ACFeTi10, (d) ACCoTi5 and (e) ACCoTi10; Figure S7. Digital radiographic images of (a) AC, (b) ACFeTi5, (c) ACFeTi10, (d) ACCoTi5 and (e) ACCoTi10; Figure S8. Image histograms of: (a) AC, (b) ACFeTi5, (c) ACFeTi10, (d) ACCoTi5 and (e) ACCoTi10; Figure S9. Schematic illustration of visible light photocatalytic degradation mechanism using M-TiO2/AC photocatalyst. M = Co or Fe. [1] after modification; Figure S10. Structure of CYF-4G sodium salt; Figure S11. Experimental cell for the electrolytic preparation of nanosized TiO2; Table S1. Proximate analysis of AC, Fe-TiO2/AC and Co-TiO2/AC composites; Table S2. Elemental analysis; Table S3. Ash content (wt.%) and total number of pixels (TOP) in ¨1¨ binarized SEM images; Table S4. Thermally stable inorganic fraction (ash) in wt.(%) and GSI values of attenuated photons; Table S5. Kinetic parameters for the adsorption of CYF-4G on AC, ACFeTi5, ACFeTi10, ACCoTi5 and ACCoTi10; Table S6. Kinetic parameters for intraparticle diffusion model. Table S7. Comparison of the coefficient isotherm parameters for CYF-4G adsorption.

Author Contributions

Conceptualization, R.M.G.; methodology, R.M.G. and Y.G.; validation, R.M.G., M.A.P., R.C. and J.Y.; formal analysis, R.M.G.; investigation, R.M.G., J.P.T. and P.S.; resources, J.Y.; data curation, R.M.G.; writing—original draft preparation, R.M.G.; writing—review and editing, R.M.G., M.A.P., R.C. and J.Y.; visualization, R.M.G.; supervision, M.A.P., R.C. and J.Y.; project administration, J.Y.; funding acquisition, R.C. and J.Y. All authors have read and agreed to the published version of the manuscript.

Funding

This research received no external funding.

Data Availability Statement

The study did not report any data.

Acknowledgments

The authors want to thank the VLIR-UOS project (Flemish Inter University Council Cooperation for Development) in the context of the Institutional University Cooperation Program with Universidad de Oriente, especially by means of the P-5 project “Energy, Biofuel and Clean Technologies for sustainable development in the eastern of Cuba”. Tom Haeldermans, Guy Reggers, Jan D’Haen, and Rafael Mendoza Meroño are acknowledged for elemental analysis, TGA, XRD, and SEM-EDS experiments, respectively.

Conflicts of Interest

The authors declare no conflict of interest.

References

  1. Nguyen, C.H.; Tran, H.N.; Fu, C.-C.; Lu, Y.-T.; Juang, R.-S. Roles of adsorption and photocatalysis in removing organic pollutants from water by activated carbon–supported titania composites: Kinetic aspects. J. Taiwan Inst. Chem. Eng. 2020, 109, 51–61. [Google Scholar] [CrossRef]
  2. Galán, J.; Rodríguez, A.; Gómez, J.; Allen, S.; Walker, G. Reactive dye adsorption onto a novel mesoporous carbon. Chem. Eng. J. 2013, 219, 62–68. [Google Scholar] [CrossRef]
  3. Machado Garcia, R.; Carleer, R.; Arada Pérez, M.; Gryglewicz, G.; Maggen, J.; Haeldermans, T.; Yperman, J. Adsorption of Cibacron Yellow F-4G dye onto activated carbons obtained from peanut hull and rice husk: Kinetics and equilibrium studies. Biomass Convers. Biorefin. 2020, 1–17. [Google Scholar] [CrossRef]
  4. Gu, Y.; Yperman, J.; Carleer, R.; D’Haen, J.; Maggen, J.; Vanderheyden, S.; Vanreppelen, K.; Garcia, R.M. Adsorption and photocatalytic removal of Ibuprofen by activated carbon impregnated with TiO2 by UV–Vis monitoring. Chemosphere 2019, 217, 724–731. [Google Scholar] [CrossRef]
  5. GA, U. Transforming our World: The 2030 Agenda for Sustainable Development; Division for Sustainable Development Goals: New York, NY, USA, 2015. [Google Scholar]
  6. Murillo-Acevedo, Y.; Giraldo, L.; Moreno-Piraján, J.C. Nanoparticles size distribution and phenol photodegradation with TiO2/C support obtained by phosphoric acid activation of palm kernel shell. Microporous Mesoporous Mater. 2020, 304, 109325. [Google Scholar] [CrossRef]
  7. Asiltürk, M.; Şener, Ş. TiO2-activated carbon photocatalysts: Preparation, characterization and photocatalytic activities. Chem. Eng. J. 2012, 180, 354–363. [Google Scholar] [CrossRef]
  8. Velasco, L.F.; Parra, J.B.; Ania, C.O. Phenol adsorption and photo-oxidation on porous carbon/titania composites. Adsorpt. Sci. Technol. 2010, 28, 727–738. [Google Scholar] [CrossRef] [Green Version]
  9. Zhang, J.; Liu, F.; Gao, J.; Chen, Y.; Hao, X. Ordered mesoporous TiO2/activated carbon for adsorption and photocatalysis of acid red 18 solution. Bioresources 2017, 12, 9086–9102. [Google Scholar] [CrossRef]
  10. Liu, Y.; Shen, S.; Zhang, J.; Zhong, W.; Huang, X. Cu2−xSe/CdS composite photocatalyst with enhanced visible light photocatalysis activity. Appl. Surf. Sci. 2019, 478, 762–769. [Google Scholar] [CrossRef]
  11. Helali, S.; Polo-López, M.I.; Fernández-Ibáñez, P.; Ohtani, B.; Amano, F.; Malato, S.; Guillard, C. Solar photocatalysis: A green technology for E. coli contaminated water disinfection. Effect of concentration and different types of suspended catalyst. J. Photochem. Photobiol. A Chem. 2014, 276, 31–40. [Google Scholar] [CrossRef]
  12. Ribeiro, E.; Plantard, G.; Teyssandier, F.; Maury, F.; Sadiki, N.; Chaumont, D.; Goetz, V. Activated-carbon/TiO2 composites preparation: An original grafting by milling approach for solar water treatment applications. J. Environ. Chem. Eng. 2020, 8, 104115. [Google Scholar] [CrossRef]
  13. Tsang, C.H.A.; Li, K.; Zeng, Y.; Zhao, W.; Zhang, T.; Zhan, Y.; Xie, R.; Leung, D.Y.C.; Huang, H. Titanium oxide based photocatalytic materials development and their role of in the air pollutants degradation: Overview and forecast. Environ. Int. 2019, 125, 200–228. [Google Scholar] [CrossRef] [PubMed]
  14. Ahmadpour, N.; Sayadi, M.H.; Sobhani, S.; Hajiani, M. A potential natural solar light active photocatalyst using magnetic ZnFe2O4 TiO2/Cu nanocomposite as a high performance and recyclable platform for degradation of naproxen from aqueous solution. J. Clean. Prod. 2020, 268, 122023. [Google Scholar] [CrossRef]
  15. Vernardou, D.; Vlachou, K.; Spanakis, E.; Stratakis, E.; Katsarakis, N.; Kymakis, E.; Koudoumas, E. Influence of solution chemistry on the properties of hydrothermally grown TiO2 for advanced applications. Catal. Today 2009, 144, 172–176. [Google Scholar] [CrossRef]
  16. Zhou, J.; Zhu, B.; Wang, L.; Li, Y.; Qiao, Q. Enhanced photocatalytic activity of Fe-doped TiO2 coated on N-doped activated carbon composites for photocatalytic degradation of dyeing wastewater. AIP Conf. Proc. 2017, 1890, 020009. [Google Scholar] [CrossRef] [Green Version]
  17. Turkten, N.; Cinar, Z. Photocatalytic decolorization of azo dyes on TiO2: Prediction of mechanism via conceptual DFT. Catal. Today 2017, 287, 169–175. [Google Scholar] [CrossRef]
  18. Bezares, I.; del Campo, A.; Herrasti, P.; Muñoz-Bonilla, A. A simple aqueous electrochemical method to synthesize TiO2 nanoparticles. Phys. Chem. Chem. Phys. 2015, 17, 29319–29326. [Google Scholar] [CrossRef] [PubMed]
  19. Ortega-Díaz, D.; Fernández, D.; Sepúlveda, S.; Lindeke, R.; Pérez-Bueno, J.; Peláez-Abellán, E.; Manríquez, J. Preparation of nanoparticulate TiO2 containing nanocrystalline phases of anatase and brookite by electrochemical dissolution of remelted titanium components. Arab. J. Chem. 2018, 13, 2858–2864. [Google Scholar] [CrossRef]
  20. Almaguer, M.; Aira, M.-J.; Rodríguez-Rajo, F.J.; Rojas, T.I. Temporal dynamics of airborne fungi in Havana (Cuba) during dry and rainy seasons: Influence of meteorological parameters. Int. J. Biometeorol. 2014, 58, 1459–1470. [Google Scholar] [CrossRef]
  21. Rosu, M.-C.; Coros, M.; Pogacean, F.; Magerusan, L.; Socaci, C.; Turza, A.; Pruneanu, S. Azo dyes degradation using TiO2-Pt/graphene oxide and TiO2-Pt/reduced graphene oxide photocatalysts under UV and natural sunlight irradiation. Solid State Sci. 2017, 70, 13–20. [Google Scholar] [CrossRef]
  22. Koh, P.W.; Yuliati, L.; Lee, S.L. Effect of transition metal oxide doping (Cr, Co, V) in the photocatalytic activity of TiO2 for congo red degradation under visible light. J. Teknol. 2014, 69, 45–50. [Google Scholar] [CrossRef] [Green Version]
  23. Jo, W.-K.; Kumar, S.; Isaacs, M.A.; Lee, A.F.; Karthikeyan, S. Cobalt promoted TiO2/GO for the photocatalytic degradation of oxytetracycline and Congo Red. Appl. Catal. B Environ. 2017, 201, 159–168. [Google Scholar] [CrossRef] [Green Version]
  24. Li, Y.; Li, J.; Ma, M.; Ouyang, Y.; Yan, W. Preparation of TiO2/activated carbon with Fe ions doping photocatalyst and its application to photocatalytic degradation of reactive brilliant red K2G. Sci. China Ser. B Chem. 2009, 52, 1113–1119. [Google Scholar] [CrossRef]
  25. Eshaghi, A.; Moradi, H. Optical and photocatalytic properties of the Fe-doped TiO2 nanoparticles loaded on the activated carbon. Adv. Powder Technol. 2018, 29, 1879–1885. [Google Scholar] [CrossRef]
  26. Sadeghian, Z.; Hadidi, M.R.; Salehzadeh, D.; Nemati, A. Hydrophobic octadecylamine-functionalized graphene/TiO2 hybrid coating for corrosion protection of copper bipolar plates in simulated proton exchange membrane fuel cell environment. Int. J. Hydrogen Energy 2020, 45, 15380–15389. [Google Scholar] [CrossRef]
  27. Rouzafzay, F.; Shidpour, R.; Al-Abri, M.Z.; Qaderi, F.; Ahmadi, A.; Myint, M.T.Z. Graphene@ ZnO nanocompound for short-time water treatment under sun-simulated irradiation: Effect of shear exfoliation of graphene using kitchen blender. J. Alloys Compd. 2020, 829, 154614. [Google Scholar] [CrossRef]
  28. Cui, W.; Bai, H.; Shang, J.; Wang, F.; Xu, D.; Ding, J.; Fan, W.; Shi, W. Organic-inorganic hybrid-photoanode built from NiFe-MOF and TiO2 for efficient PEC water splitting. Electrochim. Acta 2020, 349, 136383. [Google Scholar] [CrossRef]
  29. Cui, W.; Kang, X.; Zhang, X.; Cui, X. Gel-like ZnO/Zr-MOF (bpy) nanocomposite for highly efficient adsorption of Rhodamine B dye from aqueous solution. J. Phys. Chem. Solids 2019, 134, 165–175. [Google Scholar] [CrossRef]
  30. El Bekkali, C.; Bouyarmane, H.; El Karbane, M.; Masse, S.; Saoiabi, A.; Coradin, T.; Laghzizil, A. Zinc oxide-hydroxyapatite nanocomposite photocatalysts for the degradation of ciprofloxacin and ofloxacin antibiotics. Colloids Surf. A Physicochem. Eng. Asp. 2018, 539, 364–370. [Google Scholar] [CrossRef] [Green Version]
  31. Chong, R.; Fan, Y.; Du, Y.; Liu, L.; Chang, Z.; Li, D. Hydroxyapatite decorated TiO2 as efficient photocatalyst for selective reduction of CO2 with H2O into CH4. Int. J. Hydrogen Energy 2018, 43, 22329–22339. [Google Scholar] [CrossRef]
  32. Ali, S.; Li, Z.; Chen, S.; Zada, A.; Khan, I.; Khan, I.; Ali, W.; Shaheen, S.; Qu, Y.; Jing, L. Synthesis of activated carbon-supported TiO2-based nano-photocatalysts with well recycling for efficiently degrading high-concentration pollutants. Catal. Today 2019, 335, 557–564. [Google Scholar] [CrossRef]
  33. Hernández-Barreto, D.F.; Rodriguez-Estupiñán, J.P.; Moreno-Piraján, J.C.; Sierra Ramírez, R.; Giraldo, L. Adsorption and Photocatalytic Study of Phenol Using Composites of Activated Carbon Prepared from Onion Leaves (Allium fistulosum) and Metallic Oxides (ZnO and TiO2). Catalysts 2020, 10, 574. [Google Scholar] [CrossRef]
  34. Yahya, M.A.; Al-Qodah, Z.; Ngah, C.W.Z. Agricultural bio-waste materials as potential sustainable precursors used for activated carbon production: A review. Open Access Libr. J. 2015, 46, 218–235. [Google Scholar] [CrossRef]
  35. Vanderheyden, S.R.H.; Vanreppelen, K.; Yperman, J.; Carleer, R.; Schreurs, S. Chromium(VI) removal using in-situ nitrogenized activated carbon prepared from Brewers’ spent grain. Adsorption 2018, 24, 147–156. [Google Scholar] [CrossRef]
  36. Rodiguez, M.H.; Yperman, J.; Carleer, R.; Maggen, J.; Dadi, D.; Gryglewicz, G.; Van der Bruggen, B.; Hernández, J.F.; Calvis, A.O. Adsorption of Ni (II) on spent coffee and coffee husk based activated carbon. J. Environ. Chem. Eng. 2018, 6, 1161–1170. [Google Scholar] [CrossRef]
  37. Smets, K.; De Jong, M.; Lupul, I.; Gryglewicz, G.; Schreurs, S.; Carleer, R.; Yperman, J. Rapeseed and raspberry seed cakes as inexpensive raw materials in the production of activated carbon by physical activation: Effect of activation conditions on textural and phenol adsorption characteristics. Materials 2016, 9, 565. [Google Scholar] [CrossRef] [PubMed] [Green Version]
  38. Lupul, I.; Yperman, J.; Carleer, R.; Gryglewicz, G. Adsorption of atrazine on hemp stem-based activated carbons with different surface chemistry. Adsorption 2015, 21, 489–498. [Google Scholar] [CrossRef] [Green Version]
  39. Hamm, W.; Hamilton, R.J.; Calliauw, G. (Eds.) Edible Oil Processing, 2nd ed.; Wiley-Blackwell: Hoboken, NJ, USA, 2013; p. 342. [Google Scholar]
  40. López Sánchez, I. Biodegradación de Colorantes Textiles Industriales por las Enzimas Ligninolíticas de Trametes Maxima MUCL44155 Obtenidas en Medios con Bagazo de Caña de Azúcar. Ph.D. Thesis, Universidad de La Habana, La Habana, Cuba, 2011. [Google Scholar]
  41. Pérez, S.R.; Oduardo, N.G.; Savón, R.C.B.; Boizán, M.F.; Augur, C. Decolourisation of mushroom farm wastewater by Pleurotus ostreatus. Biodegradation 2008, 19, 519–526. [Google Scholar] [CrossRef]
  42. Puente Torres, J.; Crespo Sariol, H.; Yperman, J.; Brito Sauvanell, Á.; Carleer, R.; Navarro Campa, J. A novel X-ray radiography approach for the characterization of granular activated carbons used in the rum production. J. Anal. Sci. Technol. 2018, 9, 1. [Google Scholar] [CrossRef]
  43. Rizzo, L.; Meric, S.; Kassinos, D.; Guida, M.; Russo, F.; Belgiorno, V. Degradation of diclofenac by TiO2 photocatalysis: UV absorbance kinetics and process evaluation through a set of toxicity bioassays. Water Res. 2009, 43, 979–988. [Google Scholar] [CrossRef]
  44. Picard, M.; Thakur, S.; Misra, M.; Mielewski, D.F.; Mohanty, A.K. Biocarbon from peanut hulls and their green composites with biobased poly(trimethylene terephthalate) (PTT). Sci. Rep. 2020, 10, 3310. [Google Scholar] [CrossRef] [PubMed]
  45. Hilal, N.M.; Ahmed, I.A.; El-Sayed, R.E. Activated and Nonactivated Date Pits Adsorbents for the Removal of Copper(II) and Cadmium(II) from Aqueous Solutions. ISRN Phys. Chem. 2012, 2012, 985853. [Google Scholar] [CrossRef] [Green Version]
  46. Sayed, M.; Gul, M.; Shah, N.S.; Khan, J.A.; Khan, Z.U.H.; Rehman, F.; Khan, A.R.; Rauf, S.; Arandiyan, H.; Yang, C.P. In-situ dual applications of ionic liquid coated Co2+ and Fe3+ co-doped TiO2: Superior photocatalytic degradation of ofloxacin at pilot scale level and enhanced peroxidase like activity for calorimetric biosensing. J. Mol. Liq. 2019, 282, 275–285. [Google Scholar] [CrossRef]
  47. Xing, B.; Shi, C.; Zhang, C.; Yi, G.; Chen, L.; Guo, H.; Huang, G.; Cao, J. Preparation of TiO2/Activated Carbon Composites for Photocatalytic Degradation of RhB under UV Light Irradiation. J. Nanomater. 2016, 2016, 8393648. [Google Scholar] [CrossRef] [Green Version]
  48. Sayed, M.; Khan, J.A.; Shah, L.A.; Shah, N.S.; Shah, F.; Khan, H.M.; Zhang, P.; Arandiyan, H. Solar Light Responsive Poly(vinyl alcohol)-Assisted Hydrothermal Synthesis of Immobilized TiO2/Ti Film with the Addition of Peroxymonosulfate for Photocatalytic Degradation of Ciprofloxacin in Aqueous Media: A Mechanistic Approach. J. Phys. Chem. C 2018, 122, 406–421. [Google Scholar] [CrossRef]
  49. Isari, A.A.; Payan, A.; Fattahi, M.; Jorfi, S.; Kakavandi, B. Photocatalytic degradation of rhodamine B and real textile wastewater using Fe-doped TiO2 anchored on reduced graphene oxide (Fe-TiO2/rGO): Characterization and feasibility, mechanism and pathway studies. Appl. Surf. Sci. 2018, 462, 549–564. [Google Scholar] [CrossRef]
  50. Kapridaki, C.; Xynidis, N.; Vazgiouraki, E.; Kallithrakas-Kontos, N.; Maravelaki-Kalaitzaki, P. Characterization of Photoactive Fe-TiO2 Lime Coatings for Building Protection: The Role of Iron Content. Materials 2019, 12, 1847. [Google Scholar] [CrossRef] [Green Version]
  51. Ghorbanpour, M.; Feizi, A. Iron-doped TiO2 Catalysts with Photocatalytic Activity. J. Water Environ. Nanotechnol. 2019, 4, 60–66. [Google Scholar] [CrossRef]
  52. Ahadi, S.; Moalej, N.S.; Sheibani, S. Characteristics and photocatalytic behavior of Fe and Cu doped TiO2 prepared by combined sol-gel and mechanical alloying. Solid State Sci. 2019, 96, 105975. [Google Scholar] [CrossRef]
  53. El Mragui, A.; Logvina, Y.; Pinto da Silva, L.; Zegaoui, O.; Esteves da Silva, J.C.G. Synthesis of Fe- and Co-Doped TiO2 with Improved Photocatalytic Activity Under Visible Irradiation Toward Carbamazepine Degradation. Materials 2019, 12, 3874. [Google Scholar] [CrossRef] [Green Version]
  54. El Mragui, A.; Zegaoui, O.; Daou, I.; Esteves da Silva, J.C.G. Preparation, characterization, and photocatalytic activity under UV and visible light of Co, Mn, and Ni mono-doped and (P,Mo) and (P,W) co-doped TiO2 nanoparticles: A comparative study. Environ. Sci. Pollut. Res. 2021, 28, 25130–25145. [Google Scholar] [CrossRef]
  55. Sreethawong, T.; Yamada, Y.; Kobayashi, T.; Yoshikawa, S. Catalysis of nanocrystalline mesoporous TiO2 on cyclohexene epoxidation with H2O2: Effects of mesoporosity and metal oxide additives. J. Mol. Catal. A Chem. 2005, 241, 23–32. [Google Scholar] [CrossRef]
  56. Majeed Khan, M.A.; Siwach, R.; Kumar, S.; Alhazaa, A.N. Role of Fe doping in tuning photocatalytic and photoelectrochemical properties of TiO2 for photodegradation of methylene blue. Opt. Laser Technol. 2019, 118, 170–178. [Google Scholar] [CrossRef]
  57. Kashale, A.A.; Rasal, A.S.; Kamble, G.P.; Ingole, V.H.; Dwivedi, P.K.; Rajoba, S.J.; Jadhav, L.D.; Ling, Y.-C.; Chang, J.-Y.; Ghule, A.V. Biosynthesized Co-doped TiO2 nanoparticles based anode for lithium-ion battery application and investigating the influence of dopant concentrations on its performance. Compos. Part B Eng. 2019, 167, 44–50. [Google Scholar] [CrossRef]
  58. Gaur, L.K.; Kumar, P.; Kushavah, D.; Khiangte, K.R.; Mathpal, M.C.; Agrahari, V.; Gairola, S.P.; Soler, M.A.G.; Swart, H.C.; Agarwal, A. Laser induced phase transformation influenced by Co doping in TiO2 nanoparticles. J. Alloys Compd. 2019, 780, 25–34. [Google Scholar] [CrossRef]
  59. Zhao, J.; Yang, L.; Li, F.; Yu, R.; Jin, C. Structural evolution in the graphitization process of activated carbon by high-pressure sintering. Carbon 2009, 47, 744–751. [Google Scholar] [CrossRef]
  60. Marsh, H.; Reinoso, F.R. Activated Carbon; Elsevier Science: Amsterdam, The Netherlands, 2006. [Google Scholar]
  61. Chekem, C.T.; Richardson, Y.; Plantard, G.; Blin, J.; Goetz, V. From Biomass Residues to Titania Coated Carbonaceous Photocatalysts: A Comparative Analysis of Different Preparation Routes for Water Treatment Application. Waste Biomass Valoriz. 2017, 8, 2721–2733. [Google Scholar] [CrossRef]
  62. Xu, Y.-J.; Zhuang, Y.; Fu, X. New Insight for Enhanced Photocatalytic Activity of TiO2 by Doping Carbon Nanotubes: A Case Study on Degradation of Benzene and Methyl Orange. J. Phys. Chem. C 2010, 114, 2669–2676. [Google Scholar] [CrossRef]
  63. Kumar, S.G.; Devi, L.G. Review on modified TiO2 photocatalysis under UV/visible light: Selected results and related mechanisms on interfacial charge carrier transfer dynamics. J. Phys. Chem. A 2011, 115, 13211–13241. [Google Scholar] [CrossRef]
  64. El Mouchtari, E.M.; Daou, C.; Rafqah, S.; Najjar, F.; Anane, H.; Piram, A.; Hamade, A.; Briche, S.; Wong-Wah-Chung, P. TiO2 and activated carbon of Argania Spinosa tree nutshells composites for the adsorption photocatalysis removal of pharmaceuticals from aqueous solution. J. Photochem. Photobiol. A Chem. 2020, 388, 112183. [Google Scholar] [CrossRef]
  65. Puente Torres, J.; Crespo Sariol, H.; Yperman, J.; Adriaensens, P.; Carleer, R.; Mariño Peacok, T.; Brito Sauvanell, Á.; Thijssen, E.; Reggers, G.; Haeldermans, T.; et al. X-ray absorption as an alternative method to determine the exhausting degree of activated carbon layers in water treatment system for medical services. Talanta 2019, 205, 120058. [Google Scholar] [CrossRef] [PubMed]
  66. Puente Torres, J.; Crespo Sariol, H.; Mariño Peacok, T.; Yperman, J.; Adriaensens, P.; Carleer, R.; Brito Sauvanell, Á. X-ray Absorption (XRA): A New Technique for the Characterization of Granular Activated Carbons. Materials 2021, 14, 91. [Google Scholar] [CrossRef] [PubMed]
  67. Torres, J.P.; Codorniu, R.T.; Baracaldo, R.L.; Sariol, H.C.; Peacok, T.M.; Yperman, J.; Adriaensens, P.; Carleer, R.; Sauvanell, Á.B. A convolutional neural networks approach using X-Ray absorption images for studying granular activated carbon. SN Appl. Sci. 2020, 2, 2088. [Google Scholar] [CrossRef]
  68. Acevedo, B.; Barriocanal, C. Simultaneous adsorption of Cd2+ and reactive dye on mesoporous nanocarbons. RSC Adv. 2015, 5, 95247–95255. [Google Scholar] [CrossRef] [Green Version]
  69. Din, A.T.M.; Hameed, B.; Ahmad, A.L. Batch adsorption of phenol onto physiochemical-activated coconut shell. J. Hazard. Mater. 2009, 161, 1522–1529. [Google Scholar] [CrossRef]
  70. Elovich, S.Y.; Larinov, O. Theory of adsorption from solutions of non electrolytes on solid (I) equation adsorption from solutions and the analysis of its simplest form,(II) verification of the equation of adsorption isotherm from solutions. Izvestiya Akademii Nauk. SSSR Otd. Khimicheskikh Nauk. 1962, 2, 209–216. [Google Scholar]
  71. Lagergren, S. Zur theorie der sogenannten adsorption geloster stoffe. K. Sven. Vetensk. Handl. 1898, 24, 1–39. [Google Scholar]
  72. Ho, Y.S.; McKay, G. Pseudo-second order model for sorption processes. Process Biochem. 1999, 34, 451–465. [Google Scholar] [CrossRef]
  73. Pei, Z.; Kaiqiang, Z.; Yu, D.; Bo, B.; Weisheng, G.; Yourui, S. Adsorption of Organic Dyes by TiO2 @Yeast-Carbon Composite Microspheres and Their In Situ Regeneration Evaluation. J. Nanomater. 2015, 2015, 498304. [Google Scholar] [CrossRef]
  74. Weber Walter, J.; Morris, J.C. Kinetics of Adsorption on Carbon from Solution. J. Sanit. Eng. Div. 1963, 89, 31–59. [Google Scholar] [CrossRef]
  75. Doğan, M.; Alkan, M. Adsorption kinetics of methyl violet onto perlite. Chemosphere 2003, 50, 517–528. [Google Scholar] [CrossRef]
  76. Kumar, K.V.; Porkodi, K. Mass transfer, kinetics and equilibrium studies for the biosorption of methylene blue using Paspalum notatum. J. Hazard. Mater. 2007, 146, 214–226. [Google Scholar] [CrossRef] [PubMed]
  77. Salman, J.; Njoku, V.; Hameed, B. Bentazon and carbofuran adsorption onto date seed activated carbon: Kinetics and equilibrium. Chem. Eng. J. 2011, 173, 361–368. [Google Scholar] [CrossRef]
  78. Cheung, W.; Szeto, Y.; McKay, G. Intraparticle diffusion processes during acid dye adsorption onto chitosan. Bioresour. Technol. 2007, 98, 2897–2904. [Google Scholar] [CrossRef]
  79. Tran, H.N.; You, S.-J.; Hosseini-Bandegharaei, A.; Chao, H.-P. Mistakes and inconsistencies regarding adsorption of contaminants from aqueous solutions: A critical review. Water Res. 2017, 120, 88–116. [Google Scholar] [CrossRef]
  80. Mahmoud, D.K.; Salleh, M.A.M.; Karim, W.A.W.A.; Idris, A.; Abidin, Z.Z. Batch adsorption of basic dye using acid treated kenaf fibre char: Equilibrium, kinetic and thermodynamic studies. Chem. Eng. J. 2012, 181, 449–457. [Google Scholar] [CrossRef]
  81. Chen, L.; Bai, B. Equilibrium, Kinetic, Thermodynamic, and in Situ Regeneration Studies about Methylene Blue Adsorption by the Raspberry-like TiO2@yeast Microspheres. Ind. Eng. Chem. Res. 2013, 52, 15568–15577. [Google Scholar] [CrossRef]
  82. Langmuir, I. The Adsorption of Gases on Plane Surfaces of Glass, Mica and Platinum. J. Am. Chem. Soc. 1918, 40, 1361–1403. [Google Scholar] [CrossRef] [Green Version]
  83. Freundlich, H. Über die Adsorption in Lösungen. Z. Phys. Chem. 1907, 57, 385–470. [Google Scholar] [CrossRef]
  84. Temkin, M.; Pyzhev, V. Recent modifications to Langmuir isotherms. Acta Phys.-Chim. Sin. 1940, 12, 217–222. [Google Scholar]
  85. Popa, N.; Visa, M. New hydrothermal charcoal TiO2 composite for sustainable treatment of wastewater with dyes and cadmium cations load. Mater. Chem. Phys. 2021, 258, 123927. [Google Scholar] [CrossRef]
  86. Andriantsiferana, C.; Mohamed, E.F.; Delmas, H. Photocatalytic degradation of an azo-dye on TiO2/activated carbon composite material. Environ. Technol. 2014, 35, 355–363. [Google Scholar] [CrossRef] [PubMed] [Green Version]
  87. Atout, H.; Bouguettoucha, A.; Chebli, D.; Gatica, J.M.; Vidal, H.; Yeste, M.P.; Amrane, A. Integration of Adsorption and Photocatalytic Degradation of Methylene Blue Using TiO2 Supported on Granular Activated Carbon. Arab. J. Sci. Eng. 2017, 42, 1475–1486. [Google Scholar] [CrossRef]
  88. Shah, J.A.; Ashfaq, T.; Khan, M.S.; Riaz, N.; Shah, K.H.; Arshad, M.; Shah, S.H.; Amin, B.A.Z.; Arfan, M.; Zhang, Y.; et al. Melia azedarach Activated Carbon and its novel TiO2 Nanocomposite for Chemisorption and Photodecoloration of Reactive Orange 16: Isotherm and Kinetic Modeling. Curr. Anal. Chem. 2021, 17, 107–119. [Google Scholar] [CrossRef]
  89. Peñas-Garzón, M.; Gómez-Avilés, A.; Belver, C.; Rodriguez, J.J.; Bedia, J. Degradation pathways of emerging contaminants using TiO2-activated carbon heterostructures in aqueous solution under simulated solar light. Chem. Eng. J. 2020, 392, 124867. [Google Scholar] [CrossRef]
  90. Martins, A.C.; Cazetta, A.L.; Pezoti, O.; Souza, J.R.B.; Zhang, T.; Pilau, E.J.; Asefa, T.; Almeida, V.C. Sol-gel synthesis of new TiO2/activated carbon photocatalyst and its application for degradation of tetracycline. Ceram. Int. 2017, 43, 4411–4418. [Google Scholar] [CrossRef]
  91. Zhang, J.; Yuan, W.; Xia, T.; Ao, C.; Zhao, J.; Huang, B.; Wang, Q.; Zhang, W.; Lu, C. A TiO2 Coated Carbon Aerogel Derived from Bamboo Pulp Fibers for Enhanced Visible Light Photo-Catalytic Degradation of Methylene Blue. Nanomaterials 2021, 11, 239. [Google Scholar] [CrossRef]
  92. Bansal, P.; Singh, D.; Sud, D. Photocatalytic degradation of azo dye in aqueous TiO2 suspension: Reaction pathway and identification of intermediates products by LC/MS. Sep. Purif. Technol. 2010, 72, 357–365. [Google Scholar] [CrossRef]
  93. Dong, X.; Ding, W.; Zhang, X.; Liang, X. Mechanism and kinetics model of degradation of synthetic dyes by UV–vis/H2O2/Ferrioxalate complexes. Dyes Pigment. 2007, 74, 470–476. [Google Scholar] [CrossRef]
  94. Tunç, S.; Duman, O.; Gürkan, T. Monitoring the Decolorization of Acid Orange 8 and Acid Red 44 from Aqueous Solution Using Fenton’s Reagents by Online Spectrophotometric Method: Effect of Operation Parameters and Kinetic Study. Ind. Eng. Chem. Res. 2013, 52, 1414–1425. [Google Scholar] [CrossRef]
  95. Kudelko, A.; Olesiejuk, M.; Luczynski, M.; Swiatkowski, M.; Sieranski, T.; Kruszynski, R. 1,3,4-Thiadiazole-Containing Azo Dyes: Synthesis, Spectroscopic Properties and Molecular Structure. Molecules 2020, 25, 2822. [Google Scholar] [CrossRef]
  96. Sun, J.-H.; Sun, S.-P.; Wang, G.-L.; Qiao, L.-P. Degradation of azo dye Amido black 10B in aqueous solution by Fenton oxidation process. Dyes Pigment. 2007, 74, 647–652. [Google Scholar] [CrossRef]
  97. Herrmann, J.-M.; Matos, J.; Disdier, J.; Guillard, C.; Laine, J.; Malato, S.; Blanco, J. Solar photocatalytic degradation of 4-chlorophenol using the synergistic effect between titania and activated carbon in aqueous suspension. Catal. Today 1999, 54, 255–265. [Google Scholar] [CrossRef]
  98. Lim, T.-T.; Yap, P.-S.; Srinivasan, M.; Fane, A.G. TiO2/AC Composites for Synergistic Adsorption-Photocatalysis Processes: Present Challenges and Further Developments for Water Treatment and Reclamation. Crit. Rev. Environ. Sci. Technol. 2011, 41, 1173–1230. [Google Scholar] [CrossRef]
  99. Matos, J.; Laine, J.; Herrmann, J.-M. Synergy effect in the photocatalytic degradation of phenol on a suspended mixture of titania and activated carbon. Appl. Catal. B Environ. 1998, 18, 281–291. [Google Scholar] [CrossRef]
  100. Kangwansupamonkon, W.; Jitbunpot, W.; Kiatkamjornwong, S. Photocatalytic efficiency of TiO2/poly[acrylamide-co-(acrylic acid)] composite for textile dye degradation. Polym. Degrad. Stab. 2010, 95, 1894–1902. [Google Scholar] [CrossRef]
  101. Parilti, N.B.; Demirel, C.S.U.; Bekbolet, M. Response surface methodological approach for the assessment of the photocatalytic degradation of NOM. J. Photochem. Photobiol. A Chem. 2011, 225, 26–35. [Google Scholar] [CrossRef]
  102. Cho, I.-H.; Zoh, K.-D. Photocatalytic degradation of azo dye (Reactive Red 120) in TiO2/UV system: Optimization and modeling using a response surface methodology (RSM) based on the central composite design. Dyes Pigment. 2007, 75, 533–543. [Google Scholar] [CrossRef]
  103. Khalid, N.R.; Majid, A.; Tahir, M.B.; Niaz, N.A.; Khalid, S. Carbonaceous-TiO2 nanomaterials for photocatalytic degradation of pollutants: A review. Ceram. Int. 2017, 43, 14552–14571. [Google Scholar] [CrossRef]
  104. Vanreppelen, K.; Vanderheyden, S.; Kuppens, T.; Schreurs, S.; Yperman, J.; Carleer, R. Activated carbon from pyrolysis of brewer’s spent grain: Production and adsorption properties. Waste Manag. Res. 2014, 32, 634–645. [Google Scholar] [CrossRef]
  105. Belekbir, S.; El Azzouzi, M.; El Hamidi, A.; Rodríguez-Lorenzo, L.; Santaballa, J.A.; Canle, M. Improved Photocatalyzed Degradation of Phenol, as a Model Pollutant, over Metal-Impregnated Nanosized TiO2. Nanomaterials 2020, 10, 996. [Google Scholar] [CrossRef] [PubMed]
  106. Kumar, R.V.; Basumatary, A.K.; Ghoshal, A.K.; Pugazhenthi, G. Performance assessment of an analcime-C zeolite–ceramic composite membrane by removal of Cr (VI) from aqueous solution. RSC Adv. 2015, 5, 6246–6254. [Google Scholar] [CrossRef]
  107. Chaki, N.; Shaikh, S.H.; Saeed, K. A comprehensive survey on image binarization techniques. Explor. Image Bin. Tech. 2014, 560, 5–15. [Google Scholar] [CrossRef]
  108. Temkin, M.I. Adsorption equilibrium and the kinetics of processes on nonhomogeneous surfaces and in the interaction between adsorbed molecules. Zhurnal Fiz. Khimii 1941, 15, 296–332. [Google Scholar]
  109. Plazinski, W.; Rudzinski, W.; Plazinska, A. Theoretical models of sorption kinetics including a surface reaction mechanism: A review. Adv. Colloid Interface Sci. 2009, 152, 2–13. [Google Scholar] [CrossRef] [PubMed]
  110. Debnath, S.; Ballav, N.; Nyoni, H.; Maity, A.; Pillay, K. Optimization and mechanism elucidation of the catalytic photo-degradation of the dyes Eosin Yellow (EY) and Naphthol blue black (NBB) by a polyaniline-coated titanium dioxide nanocomposite. Appl. Catal. B Environ. 2015, 163, 330–342. [Google Scholar] [CrossRef]
Figure 1. SEM images of: (a) AC, (b) ACCoTi5, (c) ACCoTi10, (d) ACFeTi5, and (e) ACFeTi10.
Catalysts 11 01137 g001
Figure 2. The effect of pH variation on the adsorption of CYF-4G on AC, ACFeTi5 and ACFeTi10, ACCoTi5 and ACCoTi10 (conditions: 1.2 g/L of adsorbent dosage; concentration of (CYF-4G) = 100 mg/L, 120 rpm, 4 h agitation time, and temperature 25 °C).
Catalysts 11 01137 g002
Figure 3. (a) Regression analysis and (b) intraparticle diffusion model of the adsorption kinetics process of CYF-4G on AC, ACFeTi5, ACFeTi10, ACCoTi5, and ACCoTi10 (conditions: 1.2 g/L of adsorbent dosage, concentration of (CYF-4G) = 100 mg/L, 120 rpm, T: 25 °C, and pH = 2).
Catalysts 11 01137 g003
Figure 4. Regression analysis of adsorption isotherms of CYF-4G on AC, ACFeTi5, ACFeTi10, ACCoTi5, and ACCoTi5 using Langmuir, Freundlich, and Temkin (conditions: 1.2 g/L of adsorbent dosage, 120 rpm and 4 h agitation time, pH = 2, and T: 25 °C).
Catalysts 11 01137 g004
Figure 5. UV–Vis spectral changes of the CYF-4G as function of time under visible irradiation for (a) ACCoTi5, and (c) ACFeTi5. Absorbance changes at 226 nm, 267 nm, and 420 nm for (b) ACCoTi5 and ACCoTi10, and (d) ACFeTi5 and ACFeTi10.
Catalysts 11 01137 g005
Figure 6. Removal rate and kinetics of photocatalytic degradation curves for CYF-4G dye in solution in presence of: (a) Co-TiO2/AC and (c) Fe-TiO2/AC. (b) Co-TiO2/AC and (d) Fe-TiO2/AC after irradiation with visible light.
Catalysts 11 01137 g006
Figure 7. Schematic photocatalytic-reactor set-up.
Catalysts 11 01137 g007
Table 1. Isotherm models for adsorption of dyes on different TiO2 composites.
Adsorbent.Azo-DyeIsotherm Q m a x 0 (mg/g)Reference
AC-DSD-TiO2Reactive orange 16Langmuir92.84[88]
TiO2/ACYellow 5Langmuir107.1[86]
M-TiO2/ACAcid Red 18Langmuir161.3[9]
TiO2/C-500Methylene blueLangmuir49.64[87]
TiO2/ACAcid Red 18Langmuir158.7[9]
ACFeTi5CYF-4GLangmuir243.2This study
ACFeTi10CYF-4GLangmuir189.2This study
ACCoTi5CYF-4GLangmuir258.4This study
ACCoTi10CYF-4GLangmuir201.1This study
Table 2. Kinetic parameters on the rate of degradation of CYF-4G without and with AC, Fe-TiO2, Co-TiO2, Fe-TiO2/AC, and Co-TiO2/AC composites.
ParameterCYF-4G *AC **Co-TiO2AC-
CoTi5
AC-
CoTi10
Fe-TiO2AC-
FeTi5
AC-
FeTi10
Second-order
Co (mg/L)99.3688.9799.5797.4197.2899.7789.8798.85
k2 (mg/g.min)·10−51.814.2410.5648.8941.2111.4453.3139.35
R20.9760.9910.9760.8320.8330.9690.8320.819
RMSE1.541.263.2312.3912.663.9111.8513.35
Langmuir-Hinshelwood
Co (mg/L)102.586.7792.2493.1992.6094.5186.7194.59
kLH (1/min)·10−30.371.076.1525.1920.626.0124.9620.19
R20.9860.9930.9550.9750.9710.9680.9730.965
RMSE1.181.024.404.785.263.984.805.96
t1/2 (min)186863611328.533.611527.834.3
RC---4.093.29-4.153.35
* As such, ** Adsorption.
Publisher’s Note: MDPI stays neutral with regard to jurisdictional claims in published maps and institutional affiliations.

