Article

Energetic Characterization of Faujasite Zeolites Using a Sensor Gas Calorimeter

1
Chair of Thermal Process Engineering, University of Duisburg-Essen, Lotharstraße 1, 47057 Duisburg, Germany
2
Institute of Energy and Environmental Technology e.V. (IUTA), Bliersheimer Straße 60, 47229 Duisburg, Germany
*
Author to whom correspondence should be addressed.
Catalysts 2021, 11(1), 98; https://doi.org/10.3390/catal11010098
Submission received: 18 December 2020 / Revised: 8 January 2021 / Accepted: 8 January 2021 / Published: 12 January 2021
(This article belongs to the Special Issue Design of Heterogeneous Catalysts and Adsorbents)

Abstract

:
In addition to the adsorption mechanism, the heat released during exothermic adsorption influences the chemical reactions that follow during heterogeneous catalysis. Both steps depend on the structure and surface chemistry of the catalyst. An example of a typical catalyst is the faujasite zeolite. For faujasite zeolites, the influence of the Si/Al ratio and the number of Na+ and Ca2+ cations on the heat of adsorption was therefore investigated in a systematic study. A comparison between a NaX (Sodium type X faujasite) and a NaY (Sodium type Y faujasite) zeolite reveals that a higher Si/Al ratio and therefore a smaller number of the cations in faujasite zeolites leads to lower loadings and heats. The exchange of Na+ cations for Ca2+ cations also has an influence on the adsorption process. Loadings and heats first decrease slightly at a low degree of exchange and increase significantly with higher calcium contents. If stronger interactions are required for heterogeneous catalysis, then the CaNaX zeolites must have a degree of exchange above 53%. The energetic contributions show that the highest-quality adsorption sites III and III’ make a contribution to the load-dependent heat of adsorption, which is about 1.4 times (site III) and about 1.8 times (site III’) larger than that of adsorption site II.

Graphical Abstract

1. Introduction

Adsorption is the first step in heterogeneous catalysis. The heat release due to the interactions between the catalyst (adsorbent) and the bonded reactant (adsorpt molecule) influences the progress of the heterogeneously catalyzed reaction. Both steps depend on the structure and surface chemistry of the catalyst. For zeolites as typical catalyst materials, the framework structure, which is characterized by the Si/Al ratio, and the type and number of cations as primary adsorption sites play a significant role. Therefore, the number and energetic valence of the respective binding sites on the adsorbent surface is important for material development [1,2,3,4].
To quantify the influence of the Si/Al ratio and the type and number of cations in faujasite zeolites on the binding sites and thus on heterogeneous catalysis, an energetic characterization was carried out. For this purpose, the heat released during the adsorption of methane was investigated. Due to its small size and spherical geometry, methane is a useful probe molecule for the energetic characterization of a catalyst surface. The heat of adsorption is a measure of the strength of the interactions between the solid surface and the adsorbed molecules as well as between the molecules in the adsorbed phase. The heat of adsorption can be determined by thermodynamic models such as the isosteric method according to Clausius-Clapeyron [5,6,7], the method using the van’t-Hoff equation [8,9,10], the potential theory of Polanyi [11,12], or by using calorimetric measuring principles and devices such as temperature-programmed desorption [13,14,15], the Tian-Calvet microcalorimeter [16,17,18,19,20,21], and the sensor gas calorimeter [22,23].
Dunne et al. used a Tian-Calvet microcalorimeter to measure the heat of adsorption of CH4 on an NaX zeolite [24]. They report a constant heat of adsorption over the entire loading range of 19 kJ/mol.
Further heats of adsorption of methane on pure NaX zeolites, measured calorimetrically or calculated by the isosteric method, have been summarized by Loughlin et al. in a table [25].
Mentasty et al. investigated the adsorption of methane on a NaX and a NaY zeolite with different Si/Al ratios at temperatures between 258–298 K and pressures between 0 MPa and 50 MPa [26]. Both the loadings and the heats were found to be lower on the NaY zeolite with a higher Si/Al ratio compared to the NaX zeolite. Constant heats of adsorption were published in a range of 17–21 kJ/mol.
Zhang et al. examined the adsorption of methane on a NaX and a NaY zeolite by using Grand Canonical Monte Carlo simulations in a temperature range from 288 K to 308 K [27]. The results show a higher affinity of the NaX zeolite for methane compared to the NaY zeolite.
Talu et al. investigated the influence of the cation type with NaY, MgY, CaY, SrY, and BaY zeolites on the adsorption of methane between 298.15 K and 343.15 K up to pressures of 6760 kPa [28]. They report a great influence of the cations on the adsorption process even at high loadings. The zeolite CaY was found to have the highest adsorption capacity. In contrast, the methane pore density decreases at high loadings in reverse order of the ionic radii. This is explained by the different packing of the molecules in the zeolite cage.
Triebe et al. investigated the adsorption of methane on a NaX and a CaX zeolite in the temperature range between 323 K and 473 K [29]. The values for the heat of adsorption calculated according to the van’t-Hoff equation are higher for the CaX zeolite compared to the NaX zeolite.
Habgood et al. studied the adsorption of methane on zeolites with alkaline cations and on MgX, CaX, and BaX zeolites in the temperature range between 298.15 K and 673.15 K [30]. They report that the electric field generated by the cations increases with a decreasing ionic radii. Also, the shielding of smaller cations is greater at locations near the six-membered oxygen ring. The divalent cations generate a stronger electric field but are located at less exposed sites due to their proximity to the zeolite framework. For methane, the largest heat of adsorption of 30.12 kJ/mol was found on zeolite CaX.
Sethia et al. examined the adsorption of methane on NaX, MgNaX, CaNaX, SrNaX, and BaNaX zeolites at 303 K in a pressure range up to 101.13 kPa [31]. The loading at 101.13 kPa is highest for the CaNaX zeolite. The SrNaX and BaNaX zeolites also show a higher loading compared to the NaX zeolite. The loading of the MgNaX zeolite is lower than the loading of the NaX zeolite. This is explained by the arrangement of the magnesium cations within the sodalite cages due to the smaller ionic radius. Consequently, interactions with adsorptive molecules are not possible.
Zhang et al. investigated the adsorption of methane on NaX, MgNaX, CaNaX, SrNaX, and BaNaX zeolites in a temperature range between 298.15 K and 343.15 K up to pressures of 6900 kPa [32]. The highest loading and heat of adsorption in the first loading step was found for the CaNaX zeolite. Furthermore, the effects of activation conditions on the adsorption process were studied. The results show that the heating rate has no influence on the adsorption capacity. The final temperature of the activation process is essential, with higher temperatures leading to higher loadings. Temperatures of 673.15 K should not be exceeded, otherwise the zeolite structure may be destroyed.
Further studies on modified zeolites can also be found in combination with other adsorptives or with zeolites containing monovalent alkaline cations [33,34,35]. However, experimental work on faujasite zeolites with defined and systematically varied degrees of cation exchange is completely missing.
The heat of adsorption is a measure of the strength of the interactions between the solid surface and the adsorbed molecules, as well as between the molecules in the adsorbed phase. Using the load-dependent heat of adsorption, molecular adsorption processes can be characterized energetically by identifying the adsorption mechanisms and assigning energetic contributions to the prevailing interactions. Today, these contributions are not known for most adsorption systems. Up to now, the slope and curvature of adsorption isotherms can only be used to make qualitative statements about the energetic homogeneity or heterogeneity of the inner surface and to make assumptions about the mechanistic processes during adsorption [36]. An assignment of energetic contributions to adsorbent-adsorptive interactions has so far only been investigated by a few research groups.
So far, only Yang et al. have provided a mathematical approach to the calculation of the energetic contributions of interactions [37]. The authors report three basic types of contributions (dispersion interactions, electrostatic interactions, and chemical bonding) to the interactions between the adsorbent surface and the adsorptive molecule. For the potential of physical adsorption, the sum of all intermolecular interactions is used. It is also assumed that the dispersion interactions of the adsorptive molecules with the cations can be neglected, since the induction interactions are the dominant interaction mechanism. In contrast, dispersion interactions play a decisive role in the interactions with the Si–O–Si or Si–O–Al regions of the zeolite structure.
Xu et al. take up the approach of Yang and also compare the interactions of CO2, N2 and CH4 on an Hβ (Hydrogen type β) and an Naβ (Sodium type β) zeolite [38]. They report that CO2 and N2 develop stronger interactions with the cations due to their higher quadrupole moments. CH4 has no quadrupole moment and mainly interacts with the zeolite framework. Therefore, the cations of the zeolite only have a small influence on the heat of adsorption of methane.
In addition to the simple approach of Yang, more complex descriptions of interactions on zeolites can be found in the literature [39,40,41,42]. The adsorption equilibria are mainly calculated using Monte Carlo simulations, while the interactions occurring are described using semi-empirical force fields.
In summary, it can be said that in the literature, some studies on the heat of adsorption on modified zeolites have been published. However, these are mostly focused on completely exchanged zeolites. Systematic studies with defined exchange series are completely missing. It should be pointed out that a comparison of the available studies themselves is only possible to a limited extent. The reasons for this are differences in production processes, degrees of exchange, and activation conditions before the adsorption experiments [43]. An assignment of energetic contributions to individual interactions cannot be found. For this reason, we investigated the heat of adsorption on modified zeolites. The adsorbents and adsorptives are varied in a targeted way so that by systematically comparing the simultaneously measured adsorption isotherms and heats of adsorption, individual types of interactions can be identified and energetic contributions can be assigned to them. In this study, experimental data of methane adsorption on faujasite zeolites are presented. In addition to two faujasite zeolites which only have Na+ cations, modified faujasite type X zeolites based on these materials are used. In these modified materials, some of the Na+ cations were replaced by Ca2+ cations in a systematic exchange series. Modified type Y zeolites have fewer interactive cations. Therefore, an investigation of the energetic value of the different bonding sites is only possible to a very limited extent.

2. Results and Discussion

The experiments were performed in a pressure range from high vacuum (<10−7 Pa) to ambient pressure (101.3 kPa) at a temperature of 298.15 K. The experimental results are presented as adsorption isotherms and load-dependent heats of adsorption. The isotherms are plotted as loading in molecules per unit cell as a function of the absolute pressure in kPa. The load-dependent heat of adsorption is plotted in kJ per mol versus the loading in molecules per unit cell. Since adsorption is studied in this work, the zeolites used are named as adsorbents and not as catalysts. For reasons of clarity, the error bars are not shown in all diagrams. The measurement data are given in the supplementary material in Tables S1–S4.
Equation (1) is used to convert the adsorbed volume V a in cm3/g into the loading in molecules per unit cell.
X [ M o l e c u l e s U C ] = V a [ cm 3 g ] · m U C [ g U C ] · N A [ M o l e c u l e s mol ] V N [ cm 3 mol ]
Here, the adsorbed volume V a is multiplied by the mass of a unit cell m U C and the Avogadro constant N A and then divided by the molar volume under standard conditions V N . According to Equation (2), the mass of a unit cell is calculated from the sum of the masses of all elements occurring in a unit cell. For this, the number of atoms N X is multiplied by the relative atomic mass A U , X and the atomic mass unit u .
m U C [ g U C ] = N N a + [ 1 U C ] · A N a + [ ] · u   [ g ] + N C a 2 + [ 1 U C ] · A C a 2 + [ ] · u   [ g ] + N H 2 O [ 1 U C ] · A H 2 O [ ] · u   [ g ] + N A l [ 1 U C ] · A A l [ ] · u   [ g ] + N S i [ 1 U C ] · A S i [ ] · u   [ g ]
In an isothermal field, the measured data are presented as symbols and the isotherms fitted with the Freundlich equation (Equation (3)) as dashed lines [44].
X E q = k F   ( T ) · p A n ( T )
The Freundlich parameters were determined by fitting the experimental data by non-linear regression. The experimental isotherms can be described with a very high accuracy ( R 2 > 0.992 ). The fitted parameters k F   ( T ) and n   ( T ) are shown in Table 1.

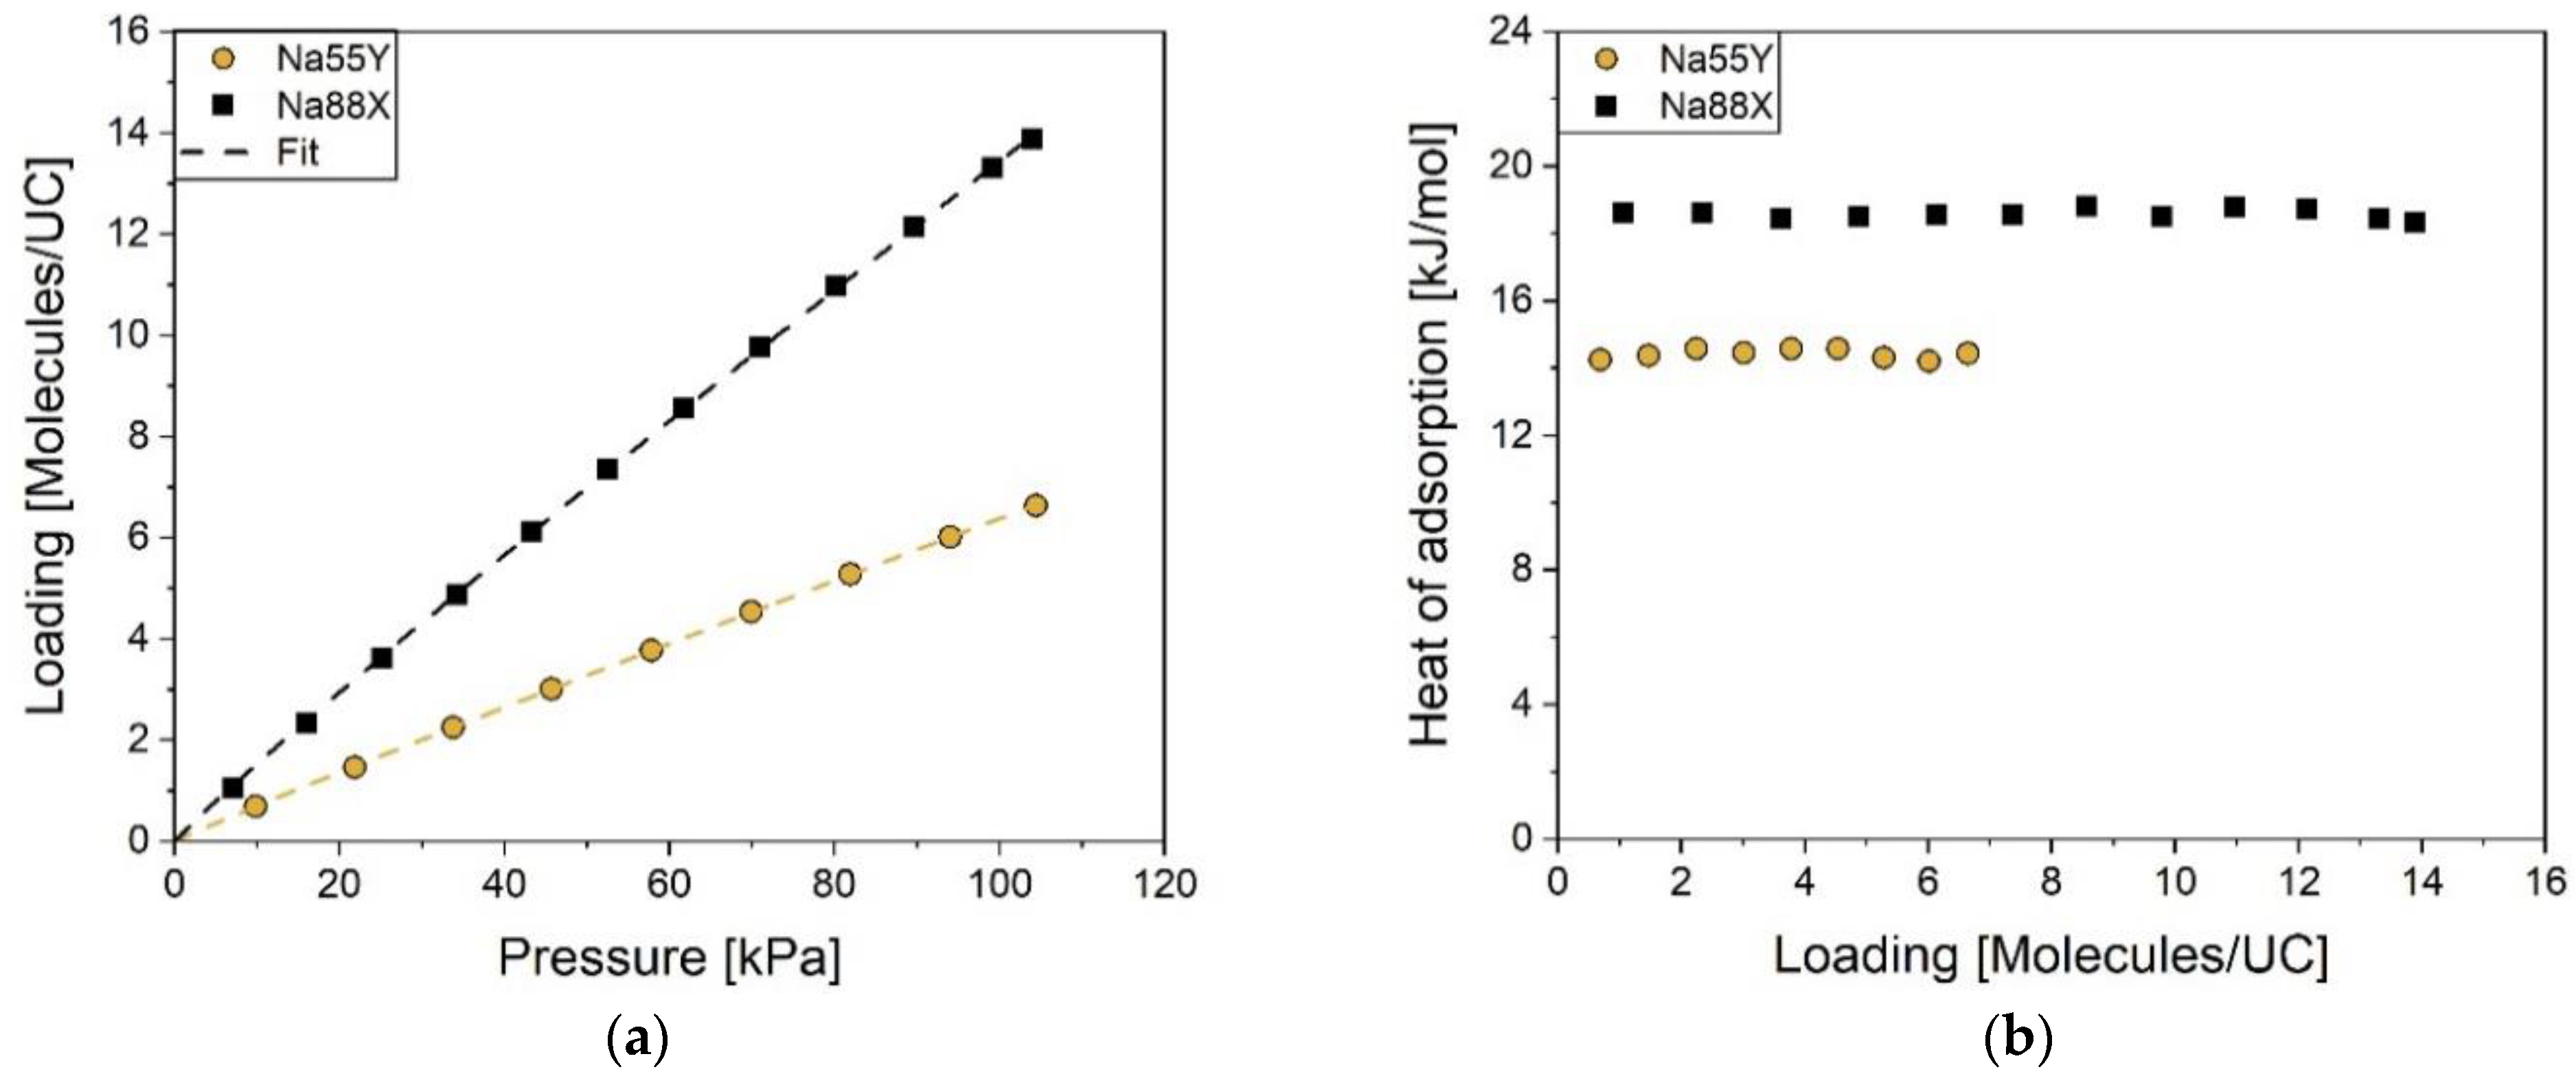
2.1. Adsorption on NaX and NaY Zeolites

Figure 1 shows the adsorption isotherms (left) and the load-dependent heats of adsorption (right) of methane adsorption on a Na88X and a Na55Y zeolite.
The isotherms show an almost linear increase over the entire pressure range, similar to a Henry isotherm. This is reflected in the Freundlich parameter n   ( T ) , which is also called the heterogeneity parameter. Values of the heterogeneity parameter n   ( T ) close to one indicate an almost energetically homogeneous adsorbent surface. For both the Na88X and the Na55Y zeolite, the parameter n   ( T ) is close to one and the Freundlich isotherm is nearly a straight line. The loading of methane on the Na55Y zeolite is lower than the loading on the Na88X zeolite. The 88 cations of the Na88X zeolite are located on the non-interactive sites I and I’ which are not accessible for adsorption and on the interactive sites II, III and III’ which are accessible for adsorption. Due to the higher energetic value of the sites III and III’ compared to site II, the methane molecules will probably adsorb preferentially on these sites. In addition to the interactions with the cation, the methane molecule will simultaneously form interactions with the zeolite structure (Si–O–Si or Si–O–Al regions). As a result of the higher Si/Al ratio, the Na55Y zeolite has a smaller number of cations, which are located on the non-interactive sites I and I’ and on the interactive site II. However, there are no cations on the energetically higher-valued interactive sites III and III’. Furthermore, the zeolite framework of the Na55Y zeolite has a smaller number of aluminum atoms due to the higher Si/Al ratio. Thus, more Si–O–Si regions are formed, which have a lower electronegativity difference compared to the Si–O–Al regions. There are also less negative charges in the zeolite framework. Therefore, the methane molecule will form weaker interactions with the zeolite framework of the Na55Y zeolite. The reduced number of interacting binding sites for the adsorptive molecules combined with the lower energetic value of the occupied cation sites and the weaker interactions with the zeolite framework result in a lower loading of methane on the Na55Y zeolite.
The heats of adsorption during the adsorption of methane show constant values of 18.5 kJ/mol (Na88X zeolite) and 14.5 kJ/mol (Na55Y zeolite). The constant heat of adsorption indicates interactions with only one cation position for all adsorbed molecules over the examined concentration range. All sites of this cation position are energetically equivalent. As described above, the Na88X zeolite has cations on site II, as well as on sites III and III’. Interactions with cations on position III and III’ are energetically more valuable than interactions with cations on position II. Following the distribution rule of Kulprathipanja, the Na88X zeolite has 24 cations on positions III and III’ [45]. According to Buttefey et al., in pure sodium faujasite zeolites, most cations are located at site III’ and not at site III [46,47,48,49]. Assuming that a methane molecule only interacts with one cation, we can conclude from the length of the plateau that there is a high loading of at least 13 molecules per unit cell at a constant heat value. Moreover, place III’ is the most distant from the zeolite framework and thus has the best accessibility for adsorptive molecules [46]. Methane molecules can form stronger interactions with cations at this site compared to cations on place III. Therefore, it is presumed that during adsorption on the Na88X zeolite, in addition to the interactions with the zeolite structure, only interactions with cations on the high-energy site III’ are formed. Since the cations on the III and III’ sites are not present in the Na55Y zeolite, adsorption on the Na55Y zeolite will only form interactions with the lower-energy sites II. Since the interactions with the zeolite framework are weaker when methane is adsorbed on the Na55Y zeolite, the corresponding energetic contribution is also lower. Consequently, the heat of adsorption on the Na55Y zeolite is lower than on the Na88X zeolite.

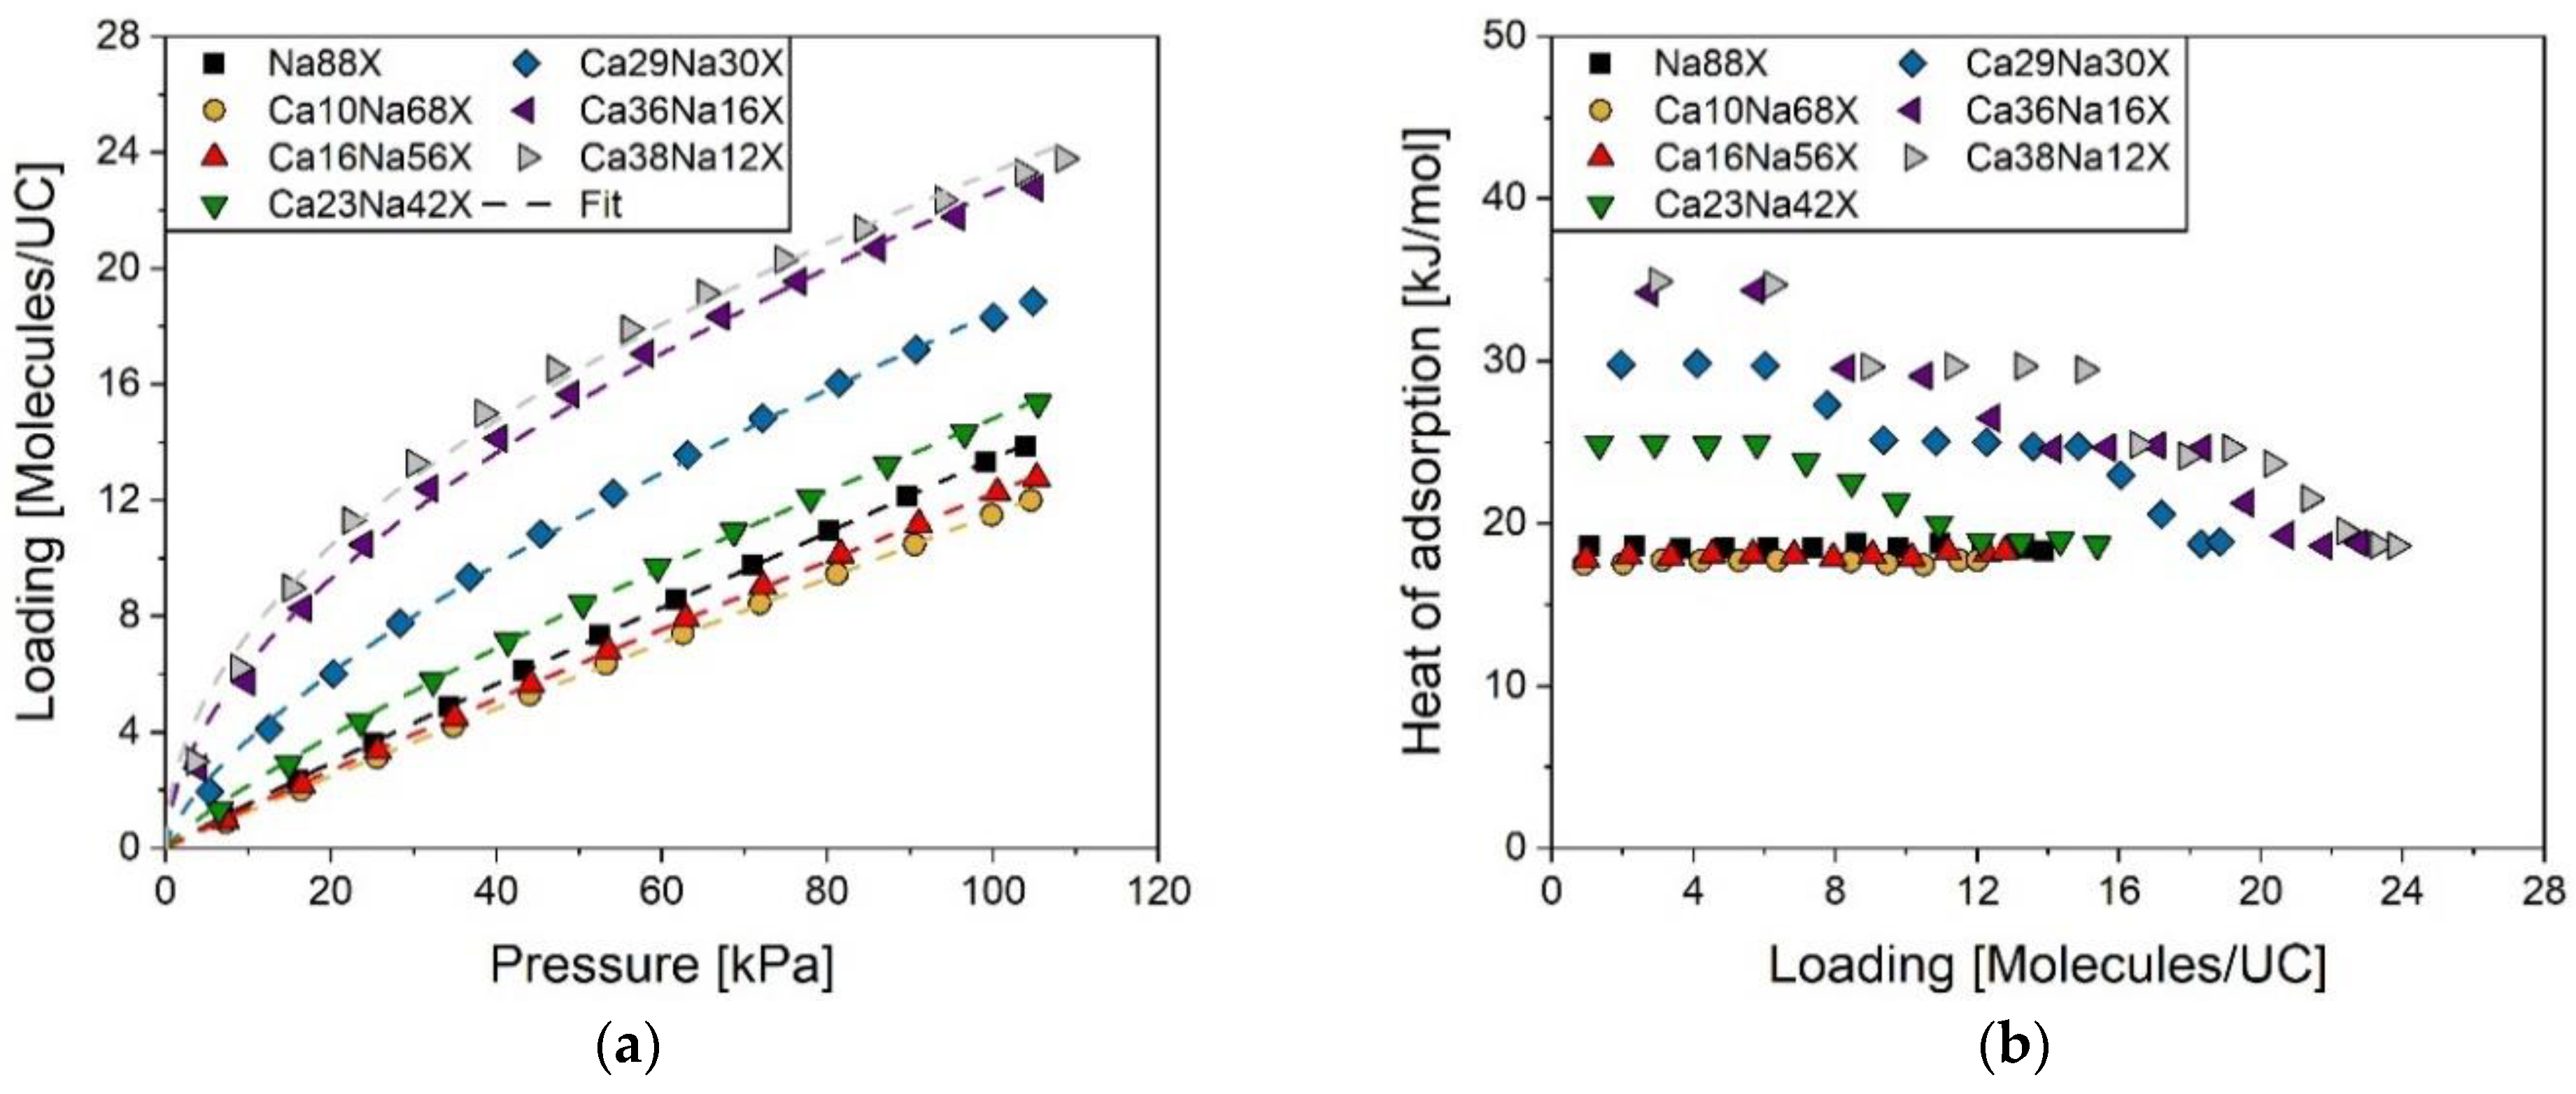
2.2. Adsorption on NaX and CaNaX Zeolites

Figure 2 shows the adsorption isotherms (left) and the load-dependent heats of adsorption (right) of methane adsorption on a Na88X and different CaNaX zeolites.
The adsorption isotherms of the zeolites Ca10Na68X and Ca16Na56X show, comparable to the base material, an approximately linear behavior similar to a Henry isotherm and Freundlich parameters n   ( T ) close to one. The isotherms of the CaNaX faujasite zeolites with exchange degrees of more than 52.9% have a curved shape and follow the typical behavior of a Freundlich isotherm. The fitted Freundlich parameters n   ( T ) decrease with increasing degree of exchange. This indicates an energetically heterogeneous adsorbent surface. The slope in the low pressure range as well as the curvature of the isotherms increase with an increasing exchange degree. Both indicate an increasing energetic heterogeneity of the adsorption sites. With the exception of the two low-exchanged zeolites Ca10Na68X and Ca16Na56X, the loading also increases with an increasing degree of exchange. Probably, this is due to the overlapping of two effects. With an increasing degree of exchange, the number of cations decreases, because monovalent Na+ cations are replaced by divalent Ca2+ cations. Probably, at the cation exchange, the first Na+ cations are removed from the cation sites III and III’. The Ca2+ cations, on the other hand, are placed first on the cation sites I, I’, or II’. At these sites, the Ca2+ cations cannot interact with the methane molecules. As a result of the reduced number of energetically high-quality binding sites, the loadings on the low-exchanged Ca10Na68X and Ca16Na56X zeolites consequently drop below the loading on the base material Na88X. The loading on the Ca16Na56X zeolite shows slightly higher values compared to the Ca10Na68X zeolite. From a degree of exchange of 52.9%, the Ca2+ cations are additionally located on the cation sites II. This results in an increased loading of the Ca23Na42X zeolite compared to the base material Na88X. With a further increase in the degree of exchange, positions III and III’ are also occupied by Ca2+ cations. As a result, the loading shows a further increase.
The load-dependent heats of adsorption on the faujasite zeolites with Na+ cations and Ca2+ cations exhibit different profiles with different characteristic plateaus (see Figure 2 right). The heats of adsorption on Na88X and on the low exchanged zeolites Ca10Na68X and Ca16Na56X show a constant value over the whole loading range. The heats of adsorption on the low-exchanged Ca10Na68X zeolite (17.5 kJ/mol) and the Ca16Na56X zeolite (18 kJ/mol) are below the base material Na88X. All other faujasite zeolites show a stepwise decreasing profile with pronounced plateaus. At high loadings, the heats of all examined zeolites reach the energetic level of the base material Na88X at 18.5 kJ/mol.
A plateau represents a number of energetically equivalent sites. The step-shaped profile occurs because the number of adsorbed molecules exceeds the number of sites on a plateau. Assuming that only one methane molecule is attached to a cation, the plateau length shows how many sites with the corresponding energetic value are available. In this paper, we make a first attempt to estimate energetic values of adsorption interactions on the zeolites. For reasons of simplicity, we neglect the Boltzmann distribution that would lead to simultaneous occupation of energetically different sites with similar energies. The value of the heat of adsorption would result then from weighting of different contributions. Instead, we assume a simple stepwise occupation of different sites. Then the heat of adsorption reflects the interaction energy of one adsorption site and we can read the value from the plateau in the heat diagram. According to this simple approach, the energetically most valuable sites are first occupied (first plateau). After the adsorption sites of this energetic level are saturated, adsorption takes place at the sites of the energetically next lower value (next plateau).
The methane molecule has three different attainable binding partners for adsorption on faujasite zeolites with purely Na+ cations (positions II, III, and III’). With an increasing amount of Ca2+ cations, the number of different attainable binding partners increases to six, as there are three cation sites which can be occupied either by Na+ cations or by Ca2+ cations. In the highly exchanged CaNaX zeolites, the amount of Na+ cations decreases. Thus, the number of cation sites occupied by Na+ cations is also reduced. In addition to the interaction with one of these cation sites, interactions with the zeolite framework occur simultaneously. The strength of these interactions and thus their energetic contribution to the heat of adsorption are approximately the same for the Na88X and all modified faujasite zeolites due to the identical Si/Al ratio. Therefore, in the following discussion, the focus will be on the interactions with the different cation positions.
As described in Section 2.1, in the adsorption of methane on the faujasite zeolite Na88X, the molecules probably adsorb on Na+ cations on the III’ site.
The lower heats of adsorption on the low-exchanged Ca10Na68X and Ca16Na56X zeolites indicate that these zeolites do not have Na+ cations on positions III and III’. This is likely because the Na+ cations on place III or III’ are first exchanged for Ca2+ and are not available for adsorption. Since the Ca2+ cations probably occupy the inaccessible positions I, I’, or II’ first to minimize the potential energy, they do not have any influence on the adsorption on Ca10Na68X and Ca16Na56X. Consequently, the methane molecules can only interact with the less energetically valuable Na+ cations on positions II and the zeolite framework. Due to the weaker interactions with Na+ cations on the sites II, a lower heat of adsorption is released. This heat is below the heat of adsorption on the zeolite Na88X.
The higher heat of adsorption on Ca23Na42X compared to the base material Na88X shows that at an exchange rate of 52.9%, there are enough Ca2+ cations to fill the first interactive sites. Therefore, the plateau at 25 kJ/mol could be assigned to interactions of the methane molecule with Ca2+ cations on positions II, III, or III’. In order to make a clear assignment, the measurement data on the highly exchanged zeolites are also considered. The heat of adsorption on the Ca29Na30X, Ca36Na16X, and Ca38Na12X form further plateaus with higher heats between 30 kJ/mol and 35 kJ/mol. This means that there are additional energetically more valuable sites. Since cations on positions III and III’ represent energetically higher-value adsorption sites than cations on position II, the plateaus with higher heats can be assigned to positions III and III’. Since in the Ca23Na42X zeolite only 52.9% of the Na+ were exchanged for Ca2+ cations, the positions III and III’ are probably not occupied. Thus, interactions with Ca2+ cations on site II can be assigned to the plateau at 25 kJ/mol.
The plateaus at 30 kJ/mol and 35 kJ/mol for the zeolite Ca29Na30X and the two highly exchanged zeolites Ca36Na16X and Ca38Na12X are probably due to the interactions with the energetically most valuable sites III and III’. The plateau at 30 kJ/mol can be attributed to interactions with site III and the plateau at 35 kJ/mol to interactions with site III’. As already discussed, the assumption that the energetically most valuable sites correspond to the cations at site III’ is based on the exposed position of site III’, which results in strong interactions [46]. However, in the literature it is reported that the divalent alkaline earth cations are preferably located at positions at a shorter distance from the zeolite framework [37]. Thus, more Ca2+ cations probably arrange on position III than on position III’. This is confirmed by the shorter plateau length with 6–7 molecules per unit cell at 35 kJ/mol (III’) compared to the plateau at 30 kJ/mol (III). Both highly exchanged zeolites Ca36Na16X and Ca38Na12X show four plateaus over the entire loading range with identical adsorption heats but with different lengths. This means that with an exchange degree of more than 67.2%, on all materials the same sites are occupied by the cations, but these are distributed to the sites with a different number.
For clarity, all described results are summarized graphically in Figure 3.
Since the same characteristic heat plateaus were found in all measurements, it can be concluded that there are defined adsorption sites. Depending on the cation position and the type of cation, these sites have different energy values. The load-dependent heat of adsorption represents a suitable method for the energetic characterization. Not only the energetic value of the adsorption sites, but also the number of the respective adsorption sites can be determined.

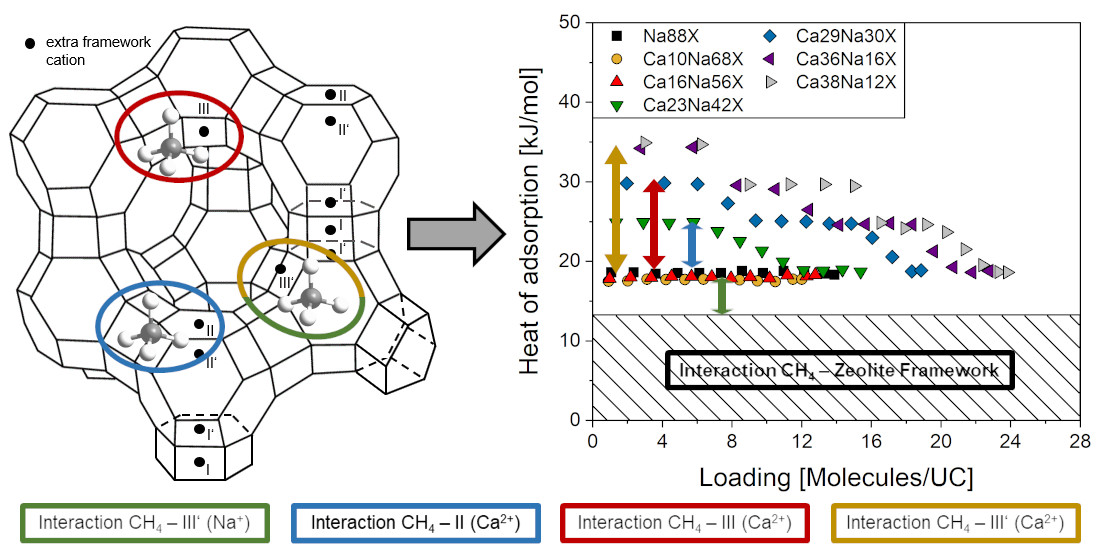
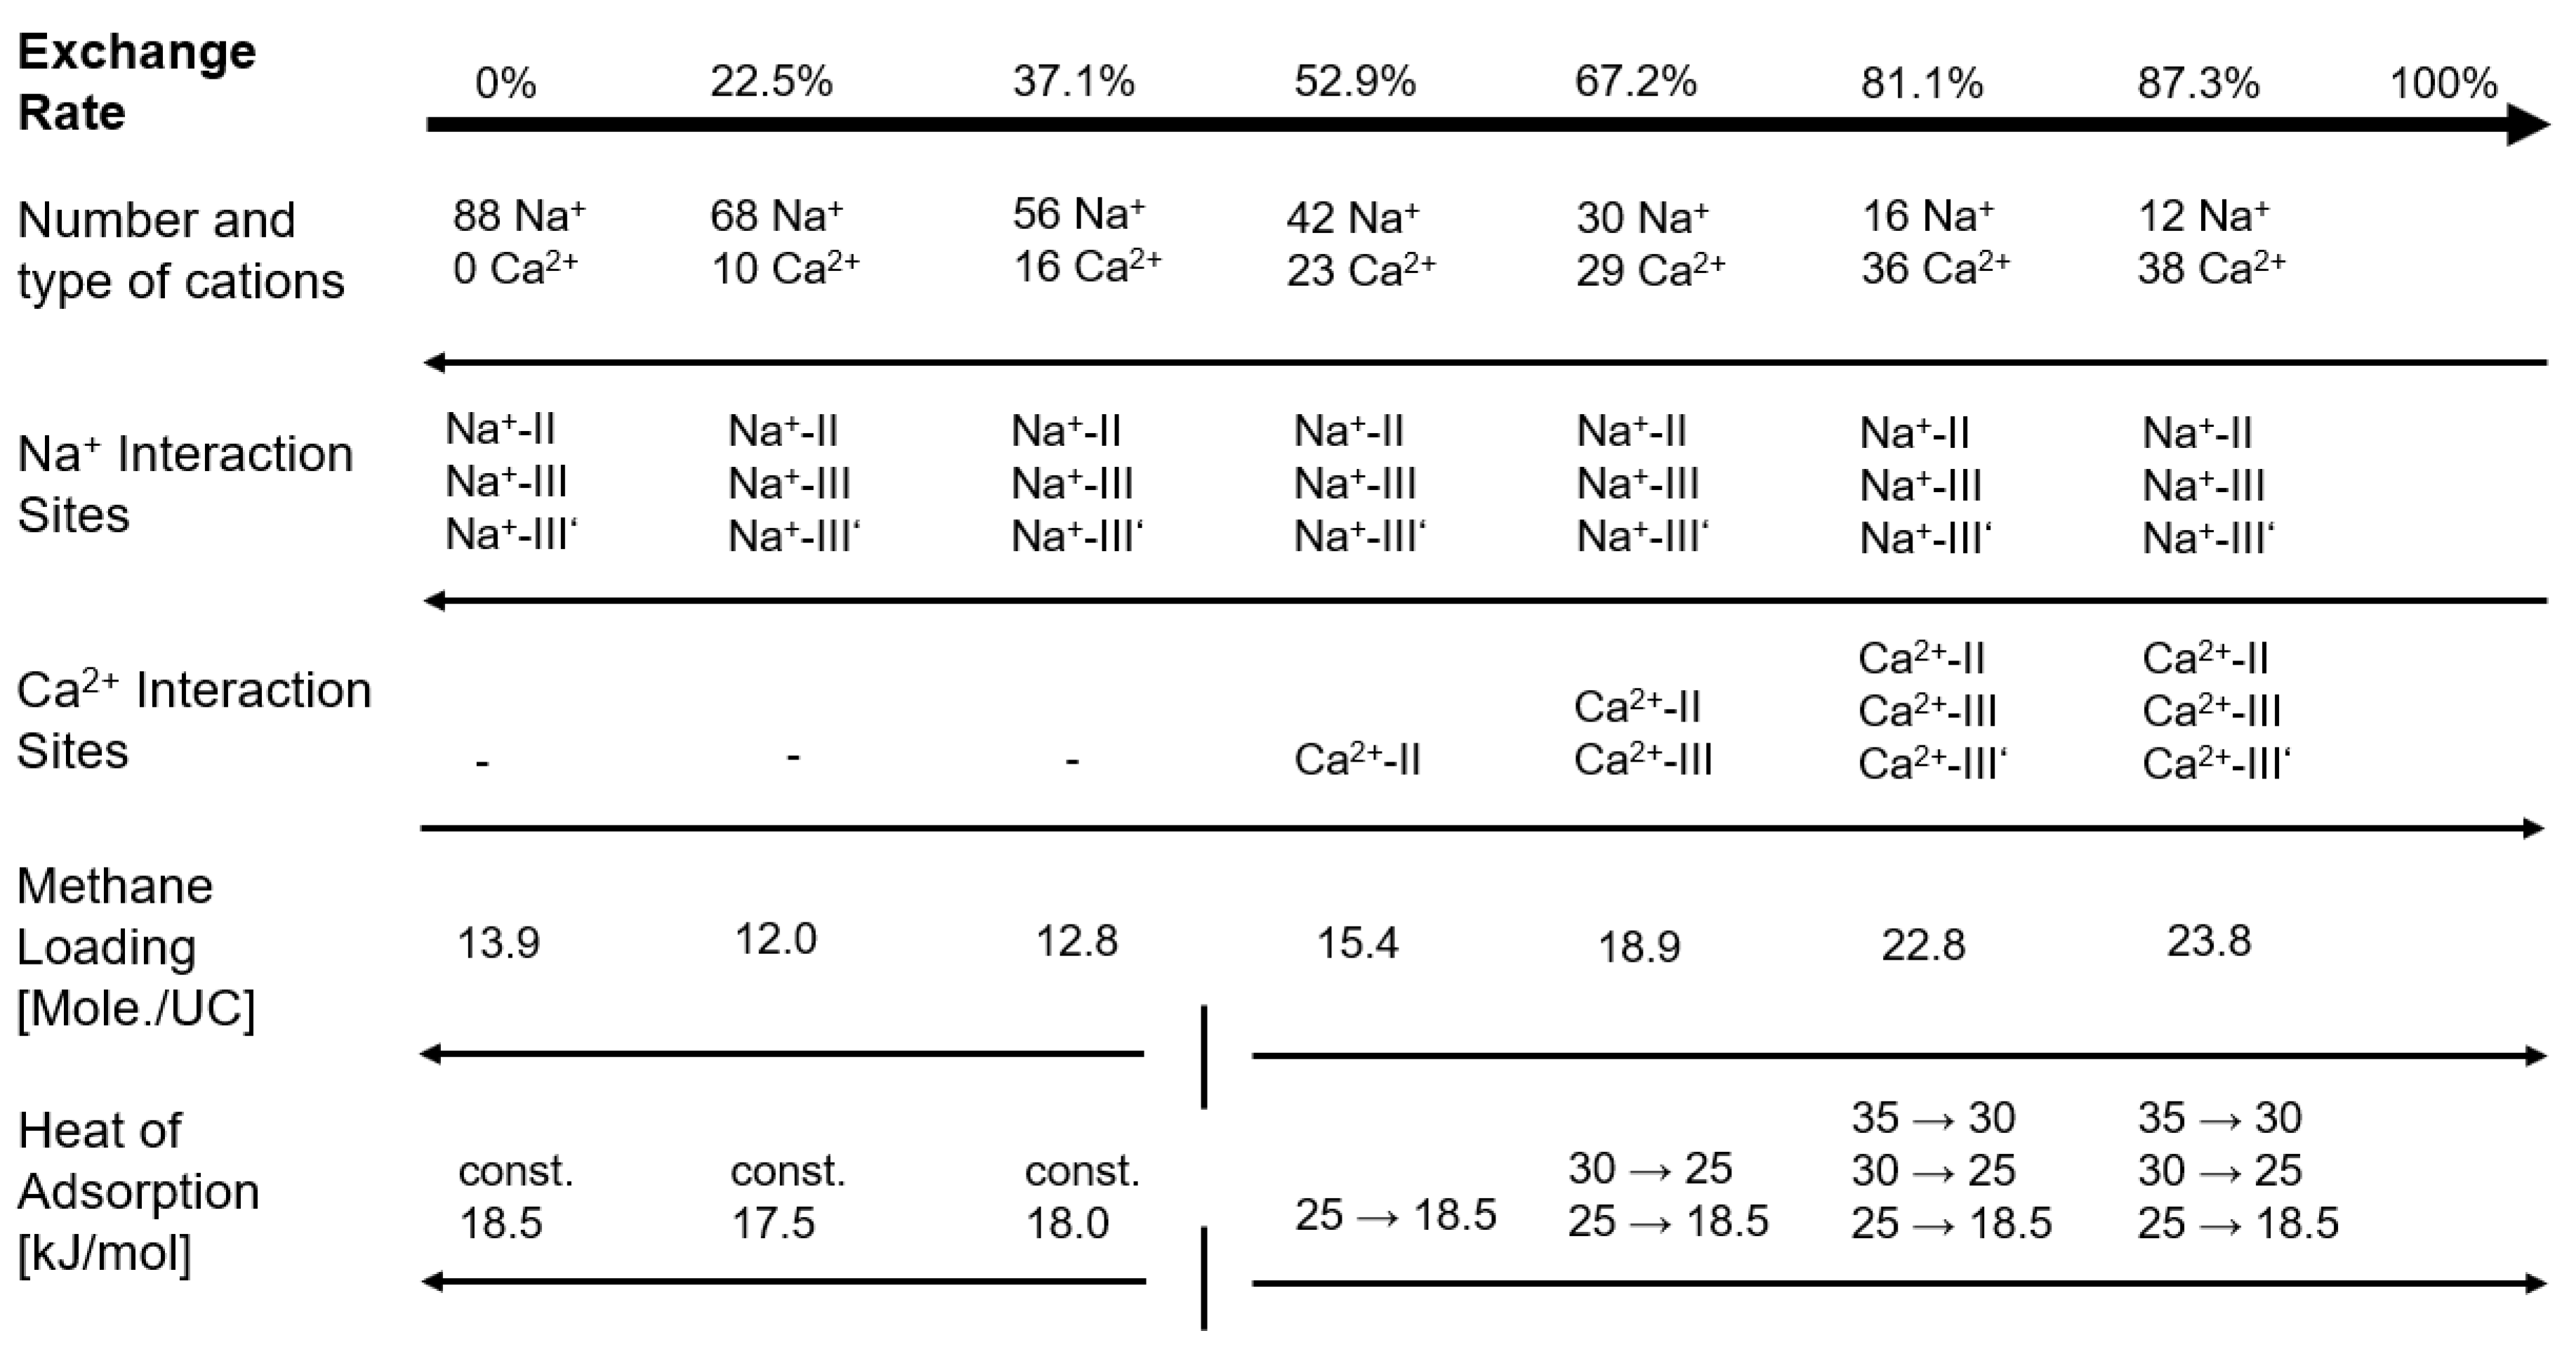
2.3. Estimation of Energetic Contributions

The load-dependent heats of adsorption shown in Figure 2 are a direct measure of the strength of the interactions of methane with the faujasite zeolites. In particular, induction interactions with the cations and induction and dispersion interactions with the zeolite framework occur. The heat of adsorption results from the sum of the energetic contributions of the three interactions. The energetic contributions of the interactions with the zeolite framework cannot be separated and therefore are summarized in Equation (4) to a sum parameter Δ q F r a m e w o r k .
Δ q A d s = Δ q I n d C a t i o n + Δ q F r a m e w o r k
To calculate the thermally averaged energetic contribution of induction interactions, Equation (5) can be used [37].
Φ I n d = q 2 · α 2 · 4 π ε 0 · r 4
Here, q represents the electric charge, α the polarizability, and r the distance between the adsorptive molecule and the cation or zeolite framework. In the following equation, the thermally averaged induction interaction energy is written for the interactions of methane with Na+ cations (Equation (6)) and Ca2+ cations (Equation (7)).
Φ I n d N a + = q N a + 2 · α C H 4 2 · 4 π ε 0 · r N a + C H 4 4
Φ I n d C a 2 + = q C a 2 + 2 · α C H 4 2 · 4 π ε 0 · r C a 2 + C H 4 4
Considering that calcium has twice the charge of sodium and assuming that the polarizability of methane is the same in both terms, that the ionic radii of sodium and calcium are identical, and therefore that the distance between the methane molecule and both cations is the same, Equation (8) is obtained by equating Equations (6) and (7).
Δ q I n d C a 2 + = 4 · Δ q I n d N a +
According to this estimation, the energetic contribution of the interactions of methane with Ca2+ cations is four times stronger than the corresponding contribution of the interactions with Na+ cations. As explained in Section 2.2, we assume that the occupancy of the energetically different cation sites is not in accordance to the Boltzmann distribution but simply in order of decreasing interaction energy. Then, Equation (4) can be transformed to Equations (9)–(12) to estimate the interaction energies between the methane molecule with the zeolite framework and the cations.
Δ q N a + I I I + Δ q F r a m e w o r k = 18.5   kJ / mol
Δ q C a 2 + I I + Δ q F r a m e w o r k = 25.0   kJ / mol
Δ q C a 2 + I I I + Δ q F r a m e w o r k = 30.0   kJ / mol
Δ q C a 2 + I I I + Δ q F r a m e w o r k = 35.0   kJ / mol
The result is a system of five Equations (8)–(12) and five unknowns. By substituting Equation (8) into Equation (9) and subtracting Equation (12), Equation (13) is obtained. From Equation (13) the contribution of the zeolite framework can be estimated.
3 · Δ q F r a m e w o r k = 39   kJ / mol
Then, the interaction energies of methane and the cations are obtained. All energetic contributions are shown in Table 2.
It can be seen that under the assumptions made, the interactions with the zeolite framework have a significant influence on the load-dependent heat of adsorption. This is not surprising as methane has no dipole and no quadrupole moment (Table 4), and only induced interactions but no strong permanent polar interactions with the cations are possible. The exchange of Na+ cations for Ca2+ cations has a positive effect on the energetic value of the adsorption sites. Stronger interactions can be formed with the Ca2+ cations, whereby the loading and the heat of adsorption increases. The different occupation of the cation positions also has an additional influence. The adsorption sites at cation positions III and III’, which are of the highest energy quality, make a 1.4 times (position III) and 1.8 times (position III’) larger contribution to the load-dependent heat of adsorption compared to the sites at position II.
The method presented here allows us to identify interactions with different adsorption sites, to calculate the number of the respective adsorption sites, and additionally to estimate the energetic contribution of the interactions quantitatively by using the load-dependent heat of adsorption.

3. Materials and Methods

3.1. Materials

Selected faujasite zeolites (FAU) were used for the adsorption experiments. They consist out of aluminum (Al) and silicon (Si) atoms, which are linked via oxygen (O) atoms to SiO4- and AlO4-tetrahedra. Only Si–O–Si and Si–O–Al links are possible. The Löwenstein rule does not allow Al–O–Al links [50]. From SiO4- and AlO4-tetrahedra, the sodalite cage (β-cage) is formed. By linking several sodalite cages via double six rings (D6R), the faujasitic zeolite structure is obtained (Figure 4) [51]. The cavity enclosed by the sodalite cages is called a super cage and has a diameter of 1.37 nm. It is accessible through four 12-ring windows with an effective pore diameter of 0.74 nm [52]. The specific inner surface of a faujasite zeolite is in the range of 500–800 m2/g [37].
Faujasite zeolites with an Si/Al ratio of 1–1.5 are called type X and those with an Si/Al ratio >1.5 are called type Y. A unit cell can be described by the following chemical formula
M x / m ,   A l x ,   S i 192 x ,   O 384
where M represents the cation of charge n and x the number of cations.
Since the AlO4-tetrahedra introduce a negative charge into the zeolite structure, this is compensated for by using positively charged cations. In each unit cell of a faujasite zeolite, a maximum of 96 cations (Si/Al = 1) can be introduced. The cations are on defined positions, on which the free energy of the zeolites is minimized in the best possible way. In Figure 4 the theoretical cation positions of a faujasite-zeolite are illustrated by black dots.
Cations on positions I are located in the center of the double six rings, while cations on positions I’ are located in the sodalite cage at the interface to the double six ring. Positions II are in the super cage at the single six-ring (S6R) to the sodalite cage and positions II’ in the sodalite cage at the single six-ring to the super cage. Cation site III is the position in the super cage at the four-ring to the sodalite cage. In addition, Olsen et al. postulate two III’-places, which are located in the 12 ring window, at the edge of a four ring [43,46,47]. The distribution of the cations to the corresponding positions depends on the Si/Al ratio and directly affects the physical and chemical properties of the zeolites. If less than 48 cations are included in the zeolite, then positions I and II are preferred. If there are between 48 and 64 cations in the zeolite, position I’ is preferred over position I. For zeolites with an Si/Al ratio < 2 (more than 64 cations), the positions III and III’ are occupied additionally [45,53,54,55]. While alkaline cations (e.g., sodium) occupy positions II as well as positions III and III’, alkaline earth cations (e.g., calcium or magnesium) tend to occupy positions II preferentially. These positions are closer to the zeolite framework and therefore the free energy of the system can be better minimized [37]. The cation sites I, I’, and II’ are located inside the zeolite framework and are therefore not available for interactions with adsorptive molecules. Cation at sites II, III, and III’ are located on the surface of the pores and can therefore interact with the adsorptive molecules. Each of these cation positions has a specific distance between the cation and the oxygen or the T-atoms (Si- or Al-atoms). The smaller the distance, the greater the minimization of the free energy of the system and the affinity of the cations to occupy the respective position. Conversely, those cations are particularly interesting for adsorption at sites that have a larger distance to the atoms of the zeolite framework. This is due to a better spatial arrangement of the adsorptive molecules at these sites, which allows stronger interactions to take place. The different cation sites therefore represent adsorption sites with different energetic values. For that reason, faujasite zeolites should be regarded as energetically heterogeneous adsorbents. According to Maurin et al., cation site III has the highest energetic value for adsorption [39]. Buttefey et al. report a higher energetic value of the III and III’ sites compared to the I, I’, and II sites [56].
Non-polar adsorptive molecules interact with the cations mainly by induced interactions. The cation induces a short-time dipole in the nonpolar molecule, which leads to a mutual attraction. In addition to the induction interactions between the non-polar molecule and the cations, induction and dispersion interactions can occur between the adsorptives and the Si–O–Si and Si–O–Al regions in the zeolite framework. The oxygen atoms in the tetrahedral framework are directed towards the inside of the cage, while Al and Si are oriented away from the inner surface. As a result, the surface in the cage consists of oxygen atoms while the Al atoms are shielded by the oxygen tetrahedra and are not accessible to adsorptive molecules [37]. The negative charges in the zeolite are probably delocalized on the oxygen atoms, which therefore carry a negative partial charge. Therefore, in general, dipole-type interactions with the located and fully accessible cations are more energetically valuable than interactions with the Si–O–Si and Si–O–Al regions [57,58,59].
For the adsorption experiments, binder-free type X and type Y faujasite zeolites from Chemiewerk Bad Köstritz GmbH (CWK), Bad Köstritz, Germany were used. A zeolite NaX with a Si/Al ratio of 1.175 was investigated as type X zeolite. The formula of the unit cell results from the Si/Al ratio to Na88Al88Si104O384. In the following, the term Na88X is used for the zeolite NaX. The type Y zeolite with a Si/Al ratio of 2.5 has the formula Na55Al55Si137O384 and is therefore named zeolite Na55Y. The zeolite sources are sodium silicate, sodium aluminate, and sodium hydroxide. The zeolites in the sodium form are synthesized in the liquid phase according to typical synthesis routes proposed in the literature [37,47]. The primary crystals size is about 2.0–5.0 µm.
In addition to these two pure sodium faujasite zeolites, further faujasite zeolites were investigated. Starting from the zeolite Na88X, a part of the Na+ cations were exchanged for Ca2+ cations in ion exchange columns by liquid exchange. The sodium form of the granular zeolites is continuously flown through by the solvent. As solvent, a solution of water and calcium chloride of 0.1–0.5 mol/l molarity at 298.15 K is used. The following activation of the zeolites takes place at temperatures of approx. 723.15–798.15 K. The ratio of the number of exchanged Na+ cations to the total number of cations is called the degree of exchange. The degree of exchange corresponds to the ratio of the weight of CaO over the molar mass of CaO (MCaO = 56.08 mol/kg) and the weight of Al2O3 over the molar mass of Al2O3 (MAl2O3 = 101.96 mol/kg). In the present study, mixed zeolites with a degree of exchange between 22.5% and 87.3% were investigated. The sum formula of the zeolites can be calculated from the Si/Al ratio and the respective degree of exchange. For a degree of exchange of 22.5% the formula is Ca10Na68Al88Si104O384. The name of mixed zeolites is based on the nomenclature of pure sodium zeolites and is Ca10Na68X for the type X zeolite with an exchange degree of 22.5%. All zeolites were provided as spherical granules with a particle size of 1.6–2.5 mm. Table 3 gives an overview of the most important material properties of the zeolites.
In order to eliminate possible pre-loadings and residual moisture of the zeolites, all zeolites are preheated under vacuum (<10−7 Pa) before the adsorption experiments. A temperature ramp of 2 K/min is used for heating, which is interrupted by two temperature plateaus at 353.15 K and 393.15 K for 30 min each. The final temperature of 573.15 K is then held for 6 h. The preheating process is stopped as soon as the pressure increase is less than 3 Pa/min after the 6 h at 573.15 K.
In order to ensure an identical bed height in all experiments, 0.5–0.6 g zeolite is used, depending on the bulk density of the adsorbent.
Methane (CH4) with a purity of ≥99.9995% (Air Liquide Deutschland GmbH, Düsseldorf, Germany) was used as adsorptive. In Table 4, properties of methane are listed which are relevant for adsorption.
Methane is an alkane and is supercritical at ambient conditions (p = 101.3 kPa, T = 298.15 K). It is non-polar and has no molecular dipole and quadrupole moment. During adsorption on zeolites, induction interactions with the cations and induction and dispersion interactions with the zeolite framework mainly occur. With a critical diameter of 0.4 nm, methane has a smaller critical diameter than the pore diameters of zeolites (0.74 nm). Steric hindrance can therefore be excluded.

3.2. Experimental Approach

3.2.1. Apparatus and Methods

To determine the load-dependent heat of adsorption, a commercially available volumetric measuring device (autosorb iQ3, Quantachrome Instruments, Boynton Beach, FL, USA) was coupled with the sample vessel developed by Bläker et al. [23]. The sensor gas calorimeter is symmetrically constructed from a measuring cell and a reference cell and allows a simultaneous measurement of the adsorption capacity and the heat of adsorption. The inner volumes of the two cells are connected to each other and to the volumetric measuring device. At the beginning of each adsorption step, the entire sample vessel is in thermal equilibrium. The adsorbent is located in the measuring cell, while the reference cell is filled with inert glass beads. Within an adsorption step, adsorption only occurs in the measuring cell. The calorimetric measurement takes place in the two outer volumes of the cells. The cells are filled with a sensor gas and connected to a pressure sensor each. To limit external disturbances and to ensure a constant measuring temperature, the entire sample vessel is immersed in a water bath during the adsorption measurement (see Figure 5).
With the volumetric measuring instrument, pure compound isotherms can be measured between a high vacuum (<10−7 Pa) and ambient conditions (101.3 kPa). For this purpose, the measuring device doses a defined amount of adsorptive into the sample vessel. As a result of the adsorption, a part of the molecules from the gas phase adsorbs on the adsorbent. This leads to a decrease of the pressure in the gas phase. After reaching equilibrium between adsorptive concentration in the gas phase and loading of the adsorbent, the measuring device sets a measuring point at which the equilibrium pressure is measured. An equilibrium is assumed if the change in pressure over a period of 30 min does not exceed a specified threshold. By stepwise increasing the adsorptive concentration, an adsorption isotherm is assumed up to an absolute pressure of 101.3 kPa. The loading results cumulatively from the sum of the loading differences of all preceding adsorption steps.
During exothermic adsorption, heat is released in the measuring cell. This results in a heat flow from the measuring cell through the surrounding sample gas volume into the water bath. The heat flow leads to a temperature and pressure change in the sensor gas volume of the measuring cell. Since there is no adsorption on the inert glass beads in the reference cell, the temperature and pressure in this sensor gas volume do not change. There is a time-dependent pressure difference between the two sensor gas volumes, which decreases back to the initial value at the end of each adsorption step. According to the calculation of a standard deviation, an equilibrium is assumed if 68% of 500 measured values of the pressure difference are within the standard deviation of the output value. For the i-th adsorption step, the released heat of adsorption can then be calculated from the area under the resulting time-dependent difference curve. A detailed description of the experimental procedure and the calculations can be found in Bläker et al. [23].
According to the Thermodynamic evaluation of the sensor gas calorimeter (see Appendix A), the measured quantity with the sensor gas calorimeter is the heat of adsorption.

3.2.2. Experimental Error

All experimentally determined measurement data are subject to systematic and random errors. These lead to uncertainties in the heat of adsorption and the equilibrium loading.
The measurement error of the equilibrium loading depends on the individual errors of the balance for the determination of the adsorbent mass, the volume of the sample vessel, the temperature sensors, as well as the pressure sensors of the volumetric measuring device. Since the equilibrium loading is measured cumulatively, the measurement error in the i-th adsorption step is the sum of the current error and all errors of the previous equilibrium points. The absolute error of the equilibrium loading therefore depends on the number of equilibrium points and increases with an increasing number of equilibrium steps. The relative error remains almost constant, since the loading of the adsorbent also increases with an increasing number of equilibrium steps. Using Gaussian error propagation, the relative error of the equilibrium loading is 7.5%.
The measurement error of the heat of adsorption results from the individual errors in the calibration of the sample vessel, the sample vessel volume, the temperature sensors, the pressure sensors of the volumetric measuring device, and the calorimetric pressure difference measurement. The error of the calorimetric pressure difference measurement is calculated by multiplying the standard deviation of the pressure difference measurement by the number of measuring points and increases with an increasing equilibrium time. By using Gaussian error propagation, an absolute error of the heat of adsorption of 1.5 kJ/mol is estimated.
The deviations determined from five experimental reproducibility measurements are in the range of the calculated absolute error in the load-dependent heat of adsorption. The equilibrium loadings of the sorption measurements show a very good agreement over the entire measuring range. The maximum deviations are in the range of 2.5% and therefore are lower by a factor of three compared to the error calculation using Gaussian error propagation.

4. Conclusions

In this work, the influence of the type and number of cations on adsorption on faujasite zeolites, which are commonly used as catalysts, was investigated. In order to assess the effects on the following chemical reaction in heterogeneous catalysis, the interactions between adsorptive and adsorbent surface were determined. For this purpose, adsorption isotherms and heats of adsorption were measured simultaneously using a sensor gas calorimeter. The results show significant differences in the loadings as well as the load-dependent heats of adsorption as a function of the type and number of cations introduced. Lower loadings and heats were found in case of the NaY zeolite with higher Si/Al ratio and less cations than the NaX zeolite. For the CaNaX zeolites, with the exception of the low-exchanged materials, an increasing loading and heat of adsorption with increasing degree of exchange was observed. The measured heats exhibit a stepwise decreasing pattern with identical plateaus values for the different materials. Interactions of methane with cations at different positions could be assigned to the respective heat plateaus. Energetic contributions for the interactions of the methane molecule with the zeolite framework and with the cations could be estimated using a simple mechanistic approach. The cation position (III’ > III > II) and the cation type (Ca2+ > Na+) have significant influence on the strength of interaction. Interactions with the zeolite framework turned out to be in the same order of magnitude as interactions with the calcium ions. If stronger interactions between an adsorbent surface and adsorpt molecule are necessary for heterogeneous catalysis, then the modified zeolite with calcium cations must have a degree of exchange above 53%. Both the stronger interactions and the higher heats of adsorption influence the heterogeneous catalysis and therefore have to be considered.
In future work, other adsorptives such as ethane and ethylene will be investigated and systematically compared on modified faujasite and Linde type A zeolites. The calculation of the energetic contributions will be optimized and the pattern of the heat of adsorption will be modeled. Finally, based on the heats of adsorption, a proposal for the cation distribution in faujasite zeolites will be developed.

Supplementary Materials

The following materials are available online at https://www.mdpi.com/2073-4344/11/1/98/s1, Table S1: Adsorption isotherms of methane on NaX and NaY (measuring data), Table S2: Heats of Adsorption of methane on NaX and NaY (measuring data), Table S3: Adsorption isotherms of methane on CaNaX (measuring data), Table S4: Heats of Adsorption of methane on CaNaX (measuring data).

Author Contributions

Conceptualization, D.B.; methodology, V.M. and C.B.; validation, V.M.; formal analysis, V.M.; investigation, V.M.; writing—original draft preparation, V.M., C.B., and C.P.; visualization, V.M.; supervision, D.B.; project administration, C.B. and C.P.; funding acquisition, D.B. All authors have read and agreed to the published version of the manuscript.

Funding

This research was funded by the German Research Foundation (DFG), BA 2012/12-1.

Institutional Review Board Statement

Not applicable.

Informed Consent Statement

Not applicable.

Data Availability Statement

The data presented in this study are available in supplementary material.

Acknowledgments

The Chair of Thermal Process Engineering would like to thank the Chemiewerk Bad Köstritz (CWK) for providing the adsorbents.

Conflicts of Interest

The authors declare no conflict of interest.

Appendix A. Thermodynamic Evaluation of the Sensor Gas Calorimeter

A thermodynamic analysis of the sensor gas calorimeter was carried out to evaluate whether the caloric quantity corresponds to the enthalpy of adsorption Δ H a d s , the heat of adsorption Q A d s or an internal energy difference U 2 U 1 . The enclosed volume of the measuring cell is considered, neglecting any heat transport processes in the vessel walls.
The enclosed volume V of the measuring cell in state one (start of adsorption) can be completely described by the thermodynamic state variables temperature T 1 , pressure p 1 , amount of substance n in the gas phase n 1 G and in the adsorbate phase n 1 S , the amount of substance of the unloaded adsorbent n S o l i d and the loading b 1 . Analogously, the system in state two (equilibrium after adsorption) can be described by the state variables T 2 , p 2 , n 2 G , n 2 S , n S o l i d and b 2 . Due to the constant tempering of the sample vessel by a water bath, the temperatures T 1 and T 2 are identical in both states ( T 1 = T 2 = T , isothermal process).
The total internal energy in the measuring cell consists out of the sum of all internal energies of the three phases (gas phase, adsorbate phase, (unloaded) adsorbent). For the states one and two, the following Equations (A1) and (A2) result.
U 1 = n 1 G u G ( T ) + n 1 S u 1 S ( T , b 1 ( p 1 ) ) + n S o l i d u S o l i d ( T )
U 2 = n 2 G u G ( T ) + n 2 S u 2 S ( T , b 2 ( p 2 ) ) + n S o l i d u S o l i d ( T ) = ( n 1 G Δ n G ) u G ( T ) + ( n 1 S Δ n G ) u 2 S ( T , b 2 ( p 2 ) ) + n S o l i d u S o l i d ( T )
The internal energies of the individual phases result from the multiplication of the respective amounts of substances with the specific internal energies of the individual phases. By subtracting Equation (A2) from Equations (A1) and (A3) follows.
U 2 U 1 = Δ n G u G ( T ) + ( n 1 S Δ n G ) u 2 S ( T , b 2 ( p 2 ) ) n 1 S u 1 S ( T , b 1 ( p 1 ) )
Assuming that due to small pressure or loading steps the specific internal energy in the adsorbate phase does not change in states one and two ( u 2 S ( T , b 2 ( p 2 ) ) = u 1 S ( T , b 1 ( p 1 ) ) u S ( T ) ), Equation (A3) can be transformed into Equation (A4).
U 2 U 1 = Δ n G ( u S ( T ) u G ( T ) ) = Q A d s
The change of the internal energy in the measuring cell corresponds to the difference of the specific internal energies of the adsorbate and the gas phase, multiplied by the adsorbed amount of substance ( n 1 G n 2 G = Δ n G = n 2 S n 1 S = Δ n A d s ). In addition, the change in internal energy in the measuring cell is equal to the heat of adsorption Q A d s released in an adsorption step i.
The total enthalpy of the measuring cell is, analogous to the total internal energy, composed out of the sum of all internal energies of the three phases (see Equations (A1) and (A2)). In addition, there is a further pressure-volume term for each phase. This is due to the pressure change caused by the adsorption of the molecules on the adsorbent.
H 1 = n 1 G u G ( T ) + p 1 V G + n 1 S u 1 S ( T , b 1 ( p 1 ) ) + p 1 V S + n S o l i d u S o l i d ( T ) + p 1 V S o l i d
H 2 = ( n 1 G Δ n G ) u G ( T ) + p 2 V G + ( n 1 S Δ n G ) u 2 S ( T , b 2 ( p 2 ) ) + p 2 V G + n S o l i d u S o l i d ( T ) + p 2 V S o l i d
By subtracting Equation (A6) from Equation (A5), Equation (A7) is obtained for the total enthalpy in the measuring cell.
H 2 H 1 = U 2 U 1 + ( p 2 p 1 ) V G + ( p 2 p 1 ) V S + ( p 2 p 1 ) V S o l i d = U 2 U 1 Δ p V G Δ p ( V S + V S o l i d )
Assuming that the volume of the gas phase is several times larger than the volume of the adsorbate phase and the unloaded adsorbent ( V G V S , V S o l i d ), Equation (A7) can be simplified to Equation (A8).
H 2 H 1 U 2 U 1 Δ p V G
With the ideal gas law ( Δ p V G = Δ n G R T   mit   Δ p = p 1 p 2 ) follows:
Δ H a d s = H 2 H 1 U 2 U 1 Δ n G R T
The change of the enthalpy is therefore not equal to the change of the internal energy in the measuring cell, but has additionally a pressure-volume term Δ p V G . In the calorimeter, however, it is the heat which is transferred by heat conduction and convection from the measuring cell into the surrounding sensor gas and then into the water bath. The heat flow leads to a temperature and pressure change in the sensor gas volume. Since the calculation of the heat of adsorption uses this pressure change of the sensor gas volumes, the measured quantity is actually heat of adsorption. To be able to specify the measurement data as enthalpy of adsorption, the heat of adsorption must be converted with a correction factor. For this purpose, Equation (A9) is first written as molar equation (Equation (A10)) by division by Δ n G .
Δ h a d s = H a d s Δ n G U 2 U 1 Δ n G Δ n G R T Δ n G Q A d s Δ n G Δ n G R T Δ n G q A d s R T
From Equation (A10) it can be seen that to calculate the enthalpy of adsorption, a R T term must be subtracted from the transmitted heat flow. For the measured data recorded at 298.15 K, this corresponds to a value of 2.48 kJ/mol.

References

  1. Schwab, G.-M.; Beebe, R.A.; Fricke, R.; Griffith, R.H.; Hunsmann, W.; Kohlschütter, H.W.; Straumanis, M.; Zimens, K.-E. (Eds.) Handbuch der Katalyse. Vierter Band: Heterogene Katalyse I; Springer: Vienna, Austria, 1943; ISBN 978-3-7091-7992-5. [Google Scholar]
  2. Schwab, G.-M.; Block, J.; Brovetto, P.; Constable, F.H.; Nasini, A.G.; Natta, G.; Noller, H.; Rigamonti, R.; Saini, G. (Eds.) Handbuch der Katalyse. Fünfter Band: Heterogene Katalyse II; Springer: Vienna, Austria, 1957; ISBN 978-3-7091-8040-2. [Google Scholar]
  3. Reschetilowski, W. Einführung in die heterogene Katalyse; Springer Spektrum: Berlin, Germany, 2015; ISBN 978-3-662-46983-5. [Google Scholar]
  4. Gregg, S.; Sing, K.S.W. Adsorption, Surface Area and Porosity; Academic Press: London, UK, 1982; ISBN 0-12-300956-1. [Google Scholar]
  5. Himeno, S.; Komatsu, T.; Fujita, S. High-Pressure Adsorption Equilibria of Methane and Carbon Dioxide on Several Activated Carbons. J. Chem. Eng. Data 2005, 50, 369–376. [Google Scholar] [CrossRef]
  6. Manca, C.; Martin, C.; Roubin, P. Comparative Study of Gas Adsorption on Amorphous Ice: Thermodynamic and Spectroscopic Features of the Adlayer and the Surface. J. Phys. Chem. B 2003, 107, 8929–8934. [Google Scholar] [CrossRef]
  7. Rouquerol, F. Adsorption by Powders and Porous Solids: Principles, Methodology and Applications, 2nd ed.; Elsevier/Academic Press: Amsterdam, The Netherlands, 2014; ISBN 978-0-08-097035-6. [Google Scholar]
  8. Srivastava, V.C.; Mall, I.D.; Mishra, I.M. Adsorption thermodynamics and isosteric heat of adsorption of toxic metal ions onto bagasse fly ash (BFA) and rice husk ash (RHA). Chem. Eng. J. 2007, 132, 267–278. [Google Scholar] [CrossRef]
  9. Horn, J.R.; Russell, D.; Lewis, E.A.; Murphy, K.P. Van’t Hoff and calorimetric enthalpies from isothermal titration calorimetry: Are there significant discrepancies? Biochemistry 2001, 40, 1774–1778. [Google Scholar] [CrossRef] [PubMed]
  10. Chiang, Y.-C.; Chiang, P.-C.; Huang, C.-P. Effects of pore structure and temperature on VOC adsorption on activated carbon. Carbon 2001, 39, 523–534. [Google Scholar] [CrossRef]
  11. Askalany, A.A.; Saha, B.B. Towards an accurate estimation of the isosteric heat of adsorption—A correlation with the potential theory. J. Colloid Interface Sci. 2017, 490, 59–63. [Google Scholar] [CrossRef]
  12. Dubinin, M.M. The Potential Theory of Adsorption of Gases and Vapors for Adsorbents with Energetically Nonuniform Surfaces. Chem. Rev. 1960, 60, 235–241. [Google Scholar] [CrossRef]
  13. Makowski, W. Quasi-equilibrated temperature programmed desorption and adsorption: A new method for determination of the isosteric adsorption heat. Thermochim. Acta 2007, 454, 26–32. [Google Scholar] [CrossRef]
  14. King, D.A. Thermal desorption from metal surfaces: A review. Surf. Sci. 1975, 47, 384–402. [Google Scholar] [CrossRef]
  15. Auroux, A. (Ed.) Calorimetry and Thermal Methods in Catalysis; Springer: Heidelberg/Berlin, Germany, 2013; ISBN 3642119530. [Google Scholar]
  16. Calvet, E.; Prat, H.; Skinner, H.A. Recent Progress in Microcalorimetry; Elsevier Science: Burlington, NY, USA, 1963; ISBN 9781483280134. [Google Scholar]
  17. Handy, B.E.; Sharma, S.B.; Spiewak, B.E.; Dumesic, J.A. A Tian-Calvet heat-flux microcalorimeter for measurement of differential heats of adsorption. Meas. Sci. Technol. 1993, 4, 1350–1356. [Google Scholar] [CrossRef]
  18. Dunne, J.A.; Mariwala, R.; Rao, M.; Sircar, S.; Gorte, R.J.; Myers, A.L. Calorimetric Heats of Adsorption and Adsorption Isotherms. 1. O2, N2, Ar, CO2, CH4, C2H6, and SF6 on Silicalite. Langmuir 1996, 12, 5888–5895. [Google Scholar] [CrossRef]
  19. Llewellyn, P.L.; Maurin, G. Gas adsorption microcalorimetry and modelling to characterise zeolites and related materials. C. R. Chim. 2005, 8, 283–302. [Google Scholar] [CrossRef]
  20. Garcia-Cuello, V.; Moreno-Piraján, J.C.; Giraldo-Gutiérrez, L.; Sapag, K.; Zgrablich, G. Determination of Differential Enthalpy and Isotherm by Adsorption Calorimetry. Res. Lett. Phys. Chem. 2008, 2008, 1–4. [Google Scholar] [CrossRef] [Green Version]
  21. García-Cuello, V.; Moreno-Piraján, J.C.; Giraldo-Gutiérrez, L.; Sapag, K.; Zgrablich, G. Design, Calibration, and Testing of a New Tian-Calvet Heat-Flow Microcalorimeter for Measurement of Differential Heats of Adsorption. Instrum. Sci. Technol. 2008, 36, 455–475. [Google Scholar] [CrossRef]
  22. Zimmermann, W.; Keller, J. A new calorimeter for simultaneous measurement of isotherms and heats of adsorption. Thermochim. Acta 2003, 405, 31–41. [Google Scholar] [CrossRef]
  23. Bläker, C.; Luckas, M.; Pasel, C.; Dreisbach, F.; Bathen, D. Entwicklung eines Messgeräts zur Kopplung von kalorimetrischen und volumetrischen Sorptionsmessungen. Chem. Ing. Tech. 2016, 88, 282–290. [Google Scholar] [CrossRef]
  24. Dunne, J.A.; Rao, M.; Sircar, S.; Gorte, R.J.; Myers, A.L. Calorimetric Heats of Adsorption and Adsorption Isotherms. 2. O2, N2, Ar, CO2, C4, C2H6, and S6 on NaX, H-ZSM-5, and Na-ZSM-5 Zeolites. Langmuir 1996, 12, 5896–5904. [Google Scholar] [CrossRef]
  25. Loughlin, K.F.; Hasanain, M.A.; Abdul-Rehman, H.B. Quaternary, ternary, binary, and pure component sorption on zeolites. 2. Light alkanes on Linde 5A and 13X zeolites at moderate to high pressures. Ind. Eng. Chem. Res. 1990, 29, 1535–1546. [Google Scholar] [CrossRef]
  26. Mentasty, L.; Woestyn, A.M.; Basaldella, E.; Kikot, A.; Zgrablich, G. High-Pressure Methane Adsorption on NaX and NaY Zeolites with Different Si/Al Ratios. Adsorpt. Sci. Technol. 1994, 11, 209–216. [Google Scholar] [CrossRef]
  27. Zhang, J.; Burke, N.; Zhang, S.; Liu, K.; Pervukhina, M. Thermodynamic analysis of molecular simulations of CO2 and CH4 adsorption in FAU zeolites. Chem. Eng. Sci. 2014, 113, 54–61. [Google Scholar] [CrossRef]
  28. Talu, O.; Zhang, S.Y.; Hayhurst, D.T. Effect of cations on methane adsorption by NaY, MgY, CaY, SrY, and BaY zeolites. J. Phys. Chem. 1993, 97, 12894–12898. [Google Scholar] [CrossRef]
  29. Triebe, R.W.; Tezel, F.H.; Khulbe, K.C. Adsorption of methane, ethane and ethylene on molecular sieve zeolites. Gas. Sep. Purif. 1996, 10, 81–84. [Google Scholar] [CrossRef]
  30. Habgood, H.W. Adsorptive and Gas Chromatographic Properties of Various Cationic Forms of Zeolite X. Can. J. Chem. 1964, 42, 2340–2350. [Google Scholar] [CrossRef]
  31. Sethia, G.; Somani, R.S.; Chand Bajaj, H. Adsorption of carbon monoxide, methane and nitrogen on alkaline earth metal ion exchanged zeolite-X: Structure, cation position and adsorption relationship. RSC Adv. 2015, 5, 12773–12781. [Google Scholar] [CrossRef]
  32. Zhang, S.Y.; Talu, O.; Hayhurst, D.T. High-pressure adsorption of methane in zeolites NaX, MgX, CaX, SrX and BaX. J. Phys. Chem. 1991, 95, 1722–1726. [Google Scholar] [CrossRef]
  33. Bezus, A.G.; Kiselev, A.V.; Sedlaček, Z.; Du, P.Q. Adsorption of ethane and ethylene on X-zeolites containing Li+, Na+, K+, Rb+ and Cs+ cations. Trans. Faraday Soc. 1971, 67, 468–482. [Google Scholar] [CrossRef]
  34. Maurin, G.; Llewellyn, P.; Poyet, T.; Kuchta, B. Influence of extra-framework cations on the adsorption properties of X-faujasite systems: Microcalorimetry and molecular simulations. J. Phys. Chem. B 2005, 109, 125–129. [Google Scholar] [CrossRef] [PubMed]
  35. Zhang, J.; Burke, N.; Yang, Y. Molecular Simulation of Propane Adsorption in FAU Zeolites. J. Phys. Chem. C 2012, 116, 9666–9674. [Google Scholar] [CrossRef]
  36. Ritter, J.A.; Kapoor, A.; Yang, R.T. Localized Adsorption with Lateral Interaction on Random and Patchwise Heterogeneous Surfaces. J. Phys. Chem. 1990, 94, 6785–6791. [Google Scholar] [CrossRef]
  37. Yang, R.T. Adsorbents. Fundamentals and Applications; Wiley-Interscience: Hoboken, NJ, USA, 2003; ISBN 0-471-29741-0. [Google Scholar]
  38. Xu, X.; Zhao, X.; Sun, L.; Liu, X. Adsorption separation of carbon dioxide, methane, and nitrogen on Hβ and Na-exchanged β-zeolite. J. Nat. Gas. Chem. 2008, 17, 391–396. [Google Scholar] [CrossRef]
  39. Maurin, G.; Bourrelly, S.; Llewellyn, P.L.; Bell, R.G. Simulation of the adsorption properties of CH4 in faujasites up to high pressure: Comparison with microcalorimetry. Microporous Mesoporous Mater. 2006, 89, 96–102. [Google Scholar] [CrossRef]
  40. Pillai, R.S.; Sethia, G.; Jasra, R.V. Sorption of CO, CH4, and N2 in Alkali Metal Ion Exchanged Zeolite-X: Grand Canonical Monte Carlo Simulation and Volumetric Measurements. Ind. Eng. Chem. Res. 2010, 49, 5816–5825. [Google Scholar] [CrossRef]
  41. Wender, A.; Barreau, A.; Lefebvre, C.; Di Lella, A.; Boutin, A.; Ungerer, P.; Fuchs, A.H. Adsorption of n-alkanes in faujasite zeolites: Molecular simulation study and experimental measurements. Adsorption 2007, 13, 439–451. [Google Scholar] [CrossRef]
  42. Fuchs, A.H.; Cheetham, A.K. Adsorption of Guest Molecules in Zeolitic Materials: Computational Aspects. J. Phys. Chem. B 2001, 105, 7375–7383. [Google Scholar] [CrossRef]
  43. Zhu, L.; Seff, K. Reinvestigation of the Crystal Structure of Dehydrated Sodium Zeolite X. J. Phys. Chem. B 1999, 103, 9512–9518. [Google Scholar] [CrossRef]
  44. Do, D.D. Adsorption Analysis. Equilibria and Kinetics; Imperial College Press: London, UK, 1998; ISBN 1-86094-130-3. [Google Scholar]
  45. Kulprathipanja, S. (Ed.) Zeolites in Industrial Separation and Catalysis; Wiley-VCH: Weinheim, Germany, 2010; ISBN 978-3-527-32505-4. [Google Scholar]
  46. Olson, D.H. The crystal structure of dehydrated NaX. Zeolites 1995, 15, 439–443. [Google Scholar] [CrossRef]
  47. Vitale, G.; Mellot, C.F.; Bull, L.M.; Cheetham, A.K. Neutron Diffraction and Computational Study of Zeolite NaX: Influence of SIII‘ Cations on Its Complex with Benzene. J. Phys. Chem. B 1997, 101, 4559–4564. [Google Scholar] [CrossRef]
  48. Buttefey, S.; Boutin, A.; Mellot-Draznieks, C.; Fuchs, A.H. A Simple Model for Predicting the Na+ Distribution in Anhydrous NaY and NaX Zeolites. J. Phys. Chem. B 2001, 105, 9569–9575. [Google Scholar] [CrossRef]
  49. Jaramillo, E.; Auerbach, S.M. New Force Field for Na Cations in Faujasite-Type Zeolites. J. Phys. Chem. B 1999, 103, 9589–9594. [Google Scholar] [CrossRef]
  50. Löwenstein, W. The Distribution of Aluminum in the Tetrahedra of Silicates and Aluminates. Am. Mineral. 1954, 39, 92–96. [Google Scholar]
  51. Xu, R. Chemistry of Zeolites and Related Porous Materials. Synthesis and Structure; Wiley: Chichester, UK, 2007; ISBN 978-0-470-82233-3. [Google Scholar]
  52. Baerlocher, C.; McCusker, L.B.; Olson, D.H. Atlas of Zeolite Framework Types, 6th ed.; Elsevier: Amsterdam, The Netherlands, 2007; ISBN 978-0-444-53064-6. [Google Scholar]
  53. Abrioux, C.; Coasne, B.; Maurin, G.; Henn, F.; Boutin, A.; Di Lella, A.; Nieto-Draghi, C.; Fuchs, A.H. A molecular simulation study of the distribution of cation in zeolites. Adsorption 2008, 14, 743–754. [Google Scholar] [CrossRef]
  54. Beauvais, C.; Guerrault, X.; Coudert, F.-X.; Boutin, A.; Fuchs, A.H. Distribution of Sodium Cations in Faujasite-Type Zeolite: A Canonical Parallel Tempering Simulation Study. J. Phys. Chem. B 2004, 108, 399–404. [Google Scholar] [CrossRef] [Green Version]
  55. Di Lella, A.; Desbiens, N.; Boutin, A.; Demachy, I.; Ungerer, P.; Bellat, J.-P.; Fuchs, A.H. Molecular simulation studies of water physisorption in zeolites. Phys. Chem. Chem. Phys. 2006, 8, 5396–5406. [Google Scholar] [CrossRef] [PubMed]
  56. Buttefey, S.; Boutin, A.; Fuchs, A.H. Cation distribution in faujasite-type zeolites: A test of semi-empirical force fields for Na cations. Mol. Simul. 2002, 28, 1049–1062. [Google Scholar] [CrossRef]
  57. Bläker, C.; Pasel, C.; Luckas, M.; Dreisbach, F.; Bathen, D. Investigation of load-dependent heat of adsorption of alkanes and alkenes on zeolites and activated carbon. Microporous Mesoporous Mater. 2017, 241, 1–10. [Google Scholar] [CrossRef]
  58. Bläker, C.; Pasel, C.; Luckas, M.; Dreisbach, F.; Bathen, D. A study on the load-dependent enthalpy of adsorption and interactions in adsorption of C5 and C6 hydrocarbons on zeolites 13X and ZSM-5 and an activated carbon. Microporous Mesoporous Mater. 2020, 302, 110205. [Google Scholar] [CrossRef]
  59. Atkins, P.W.; De Paula, J. Physikalische Chemie, 4th ed.; Wiley-VCH: Weinheim, Germany, 2006; ISBN 3-527-31546-2. [Google Scholar]
  60. Haynes, W.M. (Ed.) CRC Handbook of Chemistry and Physics. A Ready-Reference Book of Chemical and Physical Data, 97th ed.; CRC Press: Boca Raton, FL, USA, 2017; ISBN 978-1-4987-5429-3. [Google Scholar]
  61. Kast, W. Adsorption aus der Gasphase. In Ingenieurwissenschaftliche Grundlagen und Technische Verfahren; VCH: Weinheim, Germany, 1988; ISBN 3-527-26719-0. [Google Scholar]
Figure 1. (a) Adsorption isotherms of methane on Na88X and Na55Y zeolites at 298.15 K; (b) Load-dependent heats of adsorption of methane on Na88X and Na55Y zeolites at 298.15 K.
Catalysts 11 00098 g001
Figure 2. (a) Adsorption isotherms of methane on Na88X and CaNaX zeolites at 298.15 K; (b) Load-dependent heats of adsorption of methane on Na88X and CaNaX zeolites at 298.15 K.
Catalysts 11 00098 g002
Figure 3. Graphical compilation of results.
Catalysts 11 00098 g003
Figure 4. (a) Double 6-ring (D6R) and sodalite cage (β-cage); (b) Structure of faujasite zeolite with extra framework cations (I–III).
Catalysts 11 00098 g004
Figure 5. Schematic view of experimental setup [57].
Catalysts 11 00098 g005
Table 1. Fitted Freundlich parameters.
Zeolite k F   ( T ) n   ( T ) R 2
Na88X0.22060.94260.9999
Na55Y0.10130.95890.9999
Ca10Na68X0.18170.95200.9999
Ca16Na56X0.20170.94270.9999
Ca23Na42X0.40600.83300.9996
Ca29Na30X0.96540.69310.9986
Ca36Na16X2.27000.55200.9950
Ca38Na12X2.99130.49890.9927
Table 2. Estimated energetic contributions of the cation sites and the zeolite framework in methane adsorption on zeolite type X at 298.15 K.
Energetic Contribution.kJ/mol
Zeolite framework≈13.0
Na+ on site III’≈5.5
Ca2+ on site II≈12.0
Ca2+ on site III≈17.0
Ca2+ on site III’≈22.0
Table 3. Chemical properties of zeolite materials (Determined by XRF (X-ray fluorescence spectroscopy)).
Chemical Composition (wt%)
ZeoliteSi/Al RatioAl2O3SiO2Na2OCaOSodium Exchange [%]Abbreviation
Na88Al88Si104O3841.17528.0036.9017.700.030.0Na88X
Na55Al55Si137O3842.50018.9056.5011.800.060.0Na55Y
Ca10Na68Al88Si104O3841.17528.3037.2013.603.5022.5Ca10Na68X
Ca16Na56Al88Si104O3841.17528.2037.0010.905.7637.1Ca16Na56X
Ca23Na42Al88Si104O3841.17528.1036.708.048.1752.9Ca23Na42X
Ca29Na30Al88Si104O3841.17527.6036.205.3010.2067.2Ca29Na30X
Ca36Na16Al88Si104O3841.17527.8036.502.9312.4081.1Ca36Na16X
Ca38Na12Al88Si104O3841.17528.1036.901.8213.5087.3Ca38Na12X
Table 4. Thermodynamic and structural properties of methane [60,61].
Property
Molar mass [g mol−1]16.04
Critical molecular diameter [nm]0.4
Polarizability [10−30 m3]2.59
Dipole moment [10−30 C m]0
Quadrupole moment [10−40 C m2]0
Publisher’s Note: MDPI stays neutral with regard to jurisdictional claims in published maps and institutional affiliations.

