Kinetics Study of the Hydrodeoxygenation of Xylitol over a ReOx-Pd/CeO2 Catalyst

 ,
, 
 , and
, and
Abstract
1. Introduction
2. Results and Discussion
2.1. Catalyst Characterization
2.1.1. XRF
2.1.2. ICP-OES
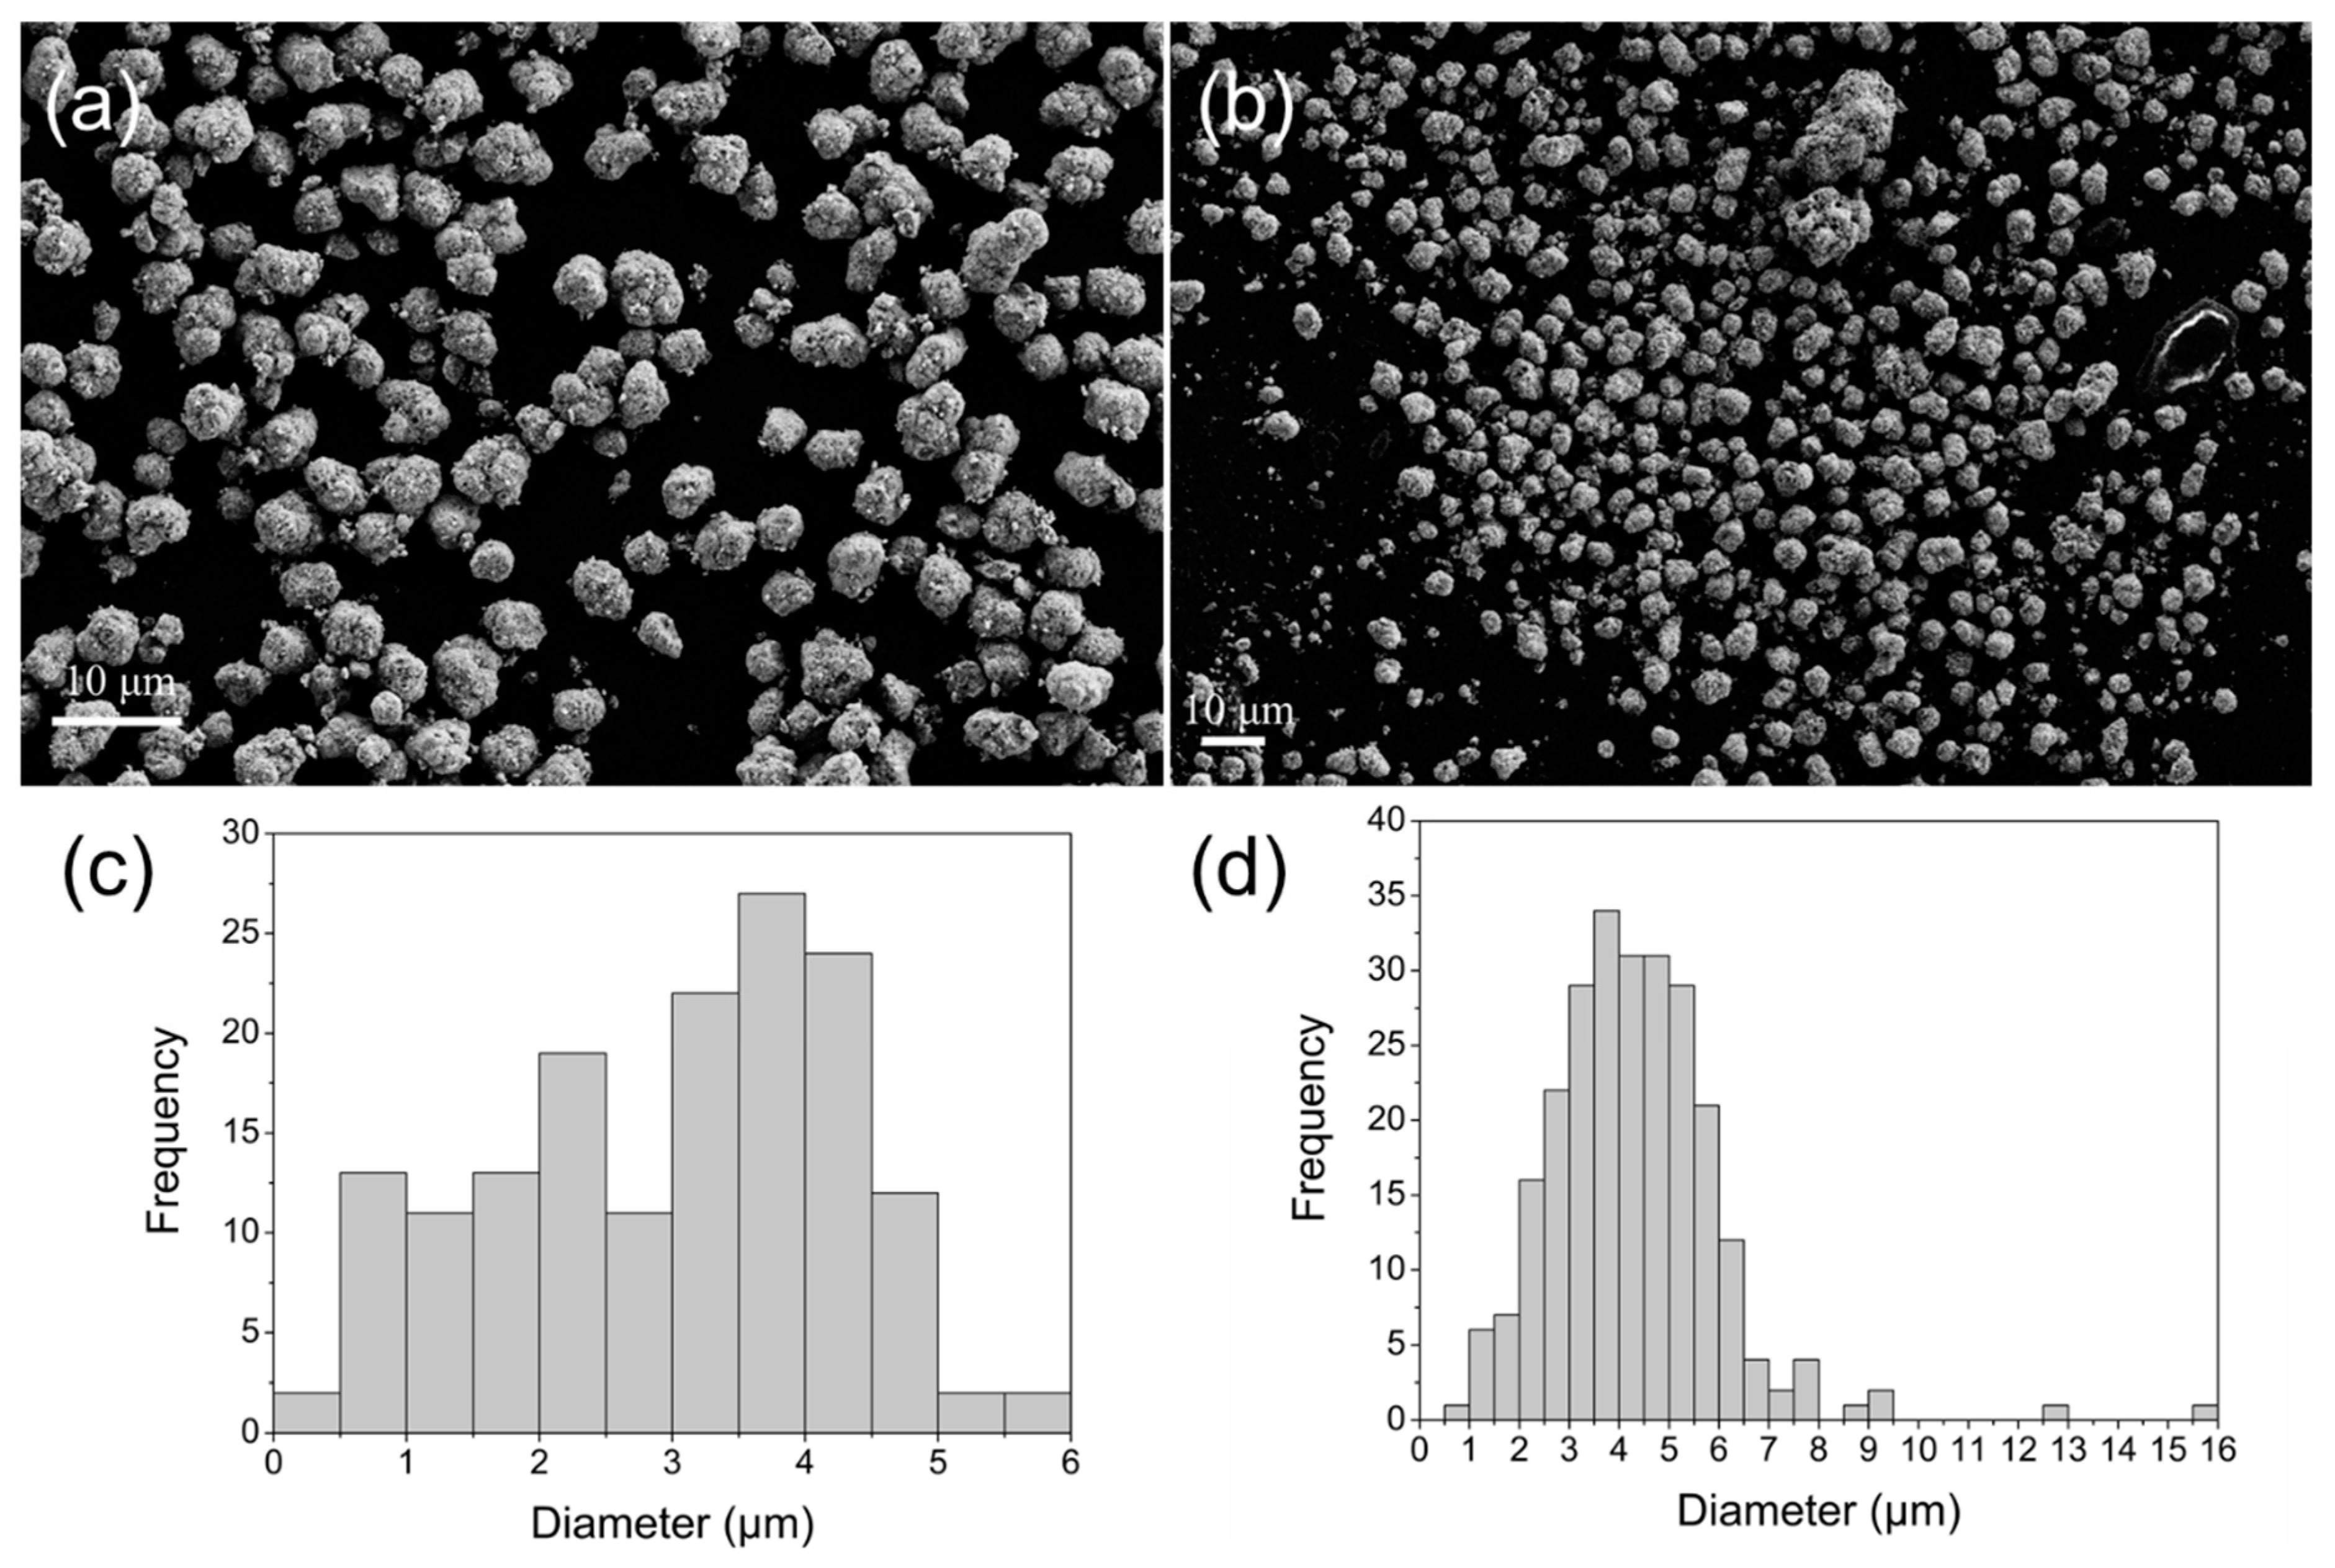
2.1.3. SEM
2.1.4. TPR
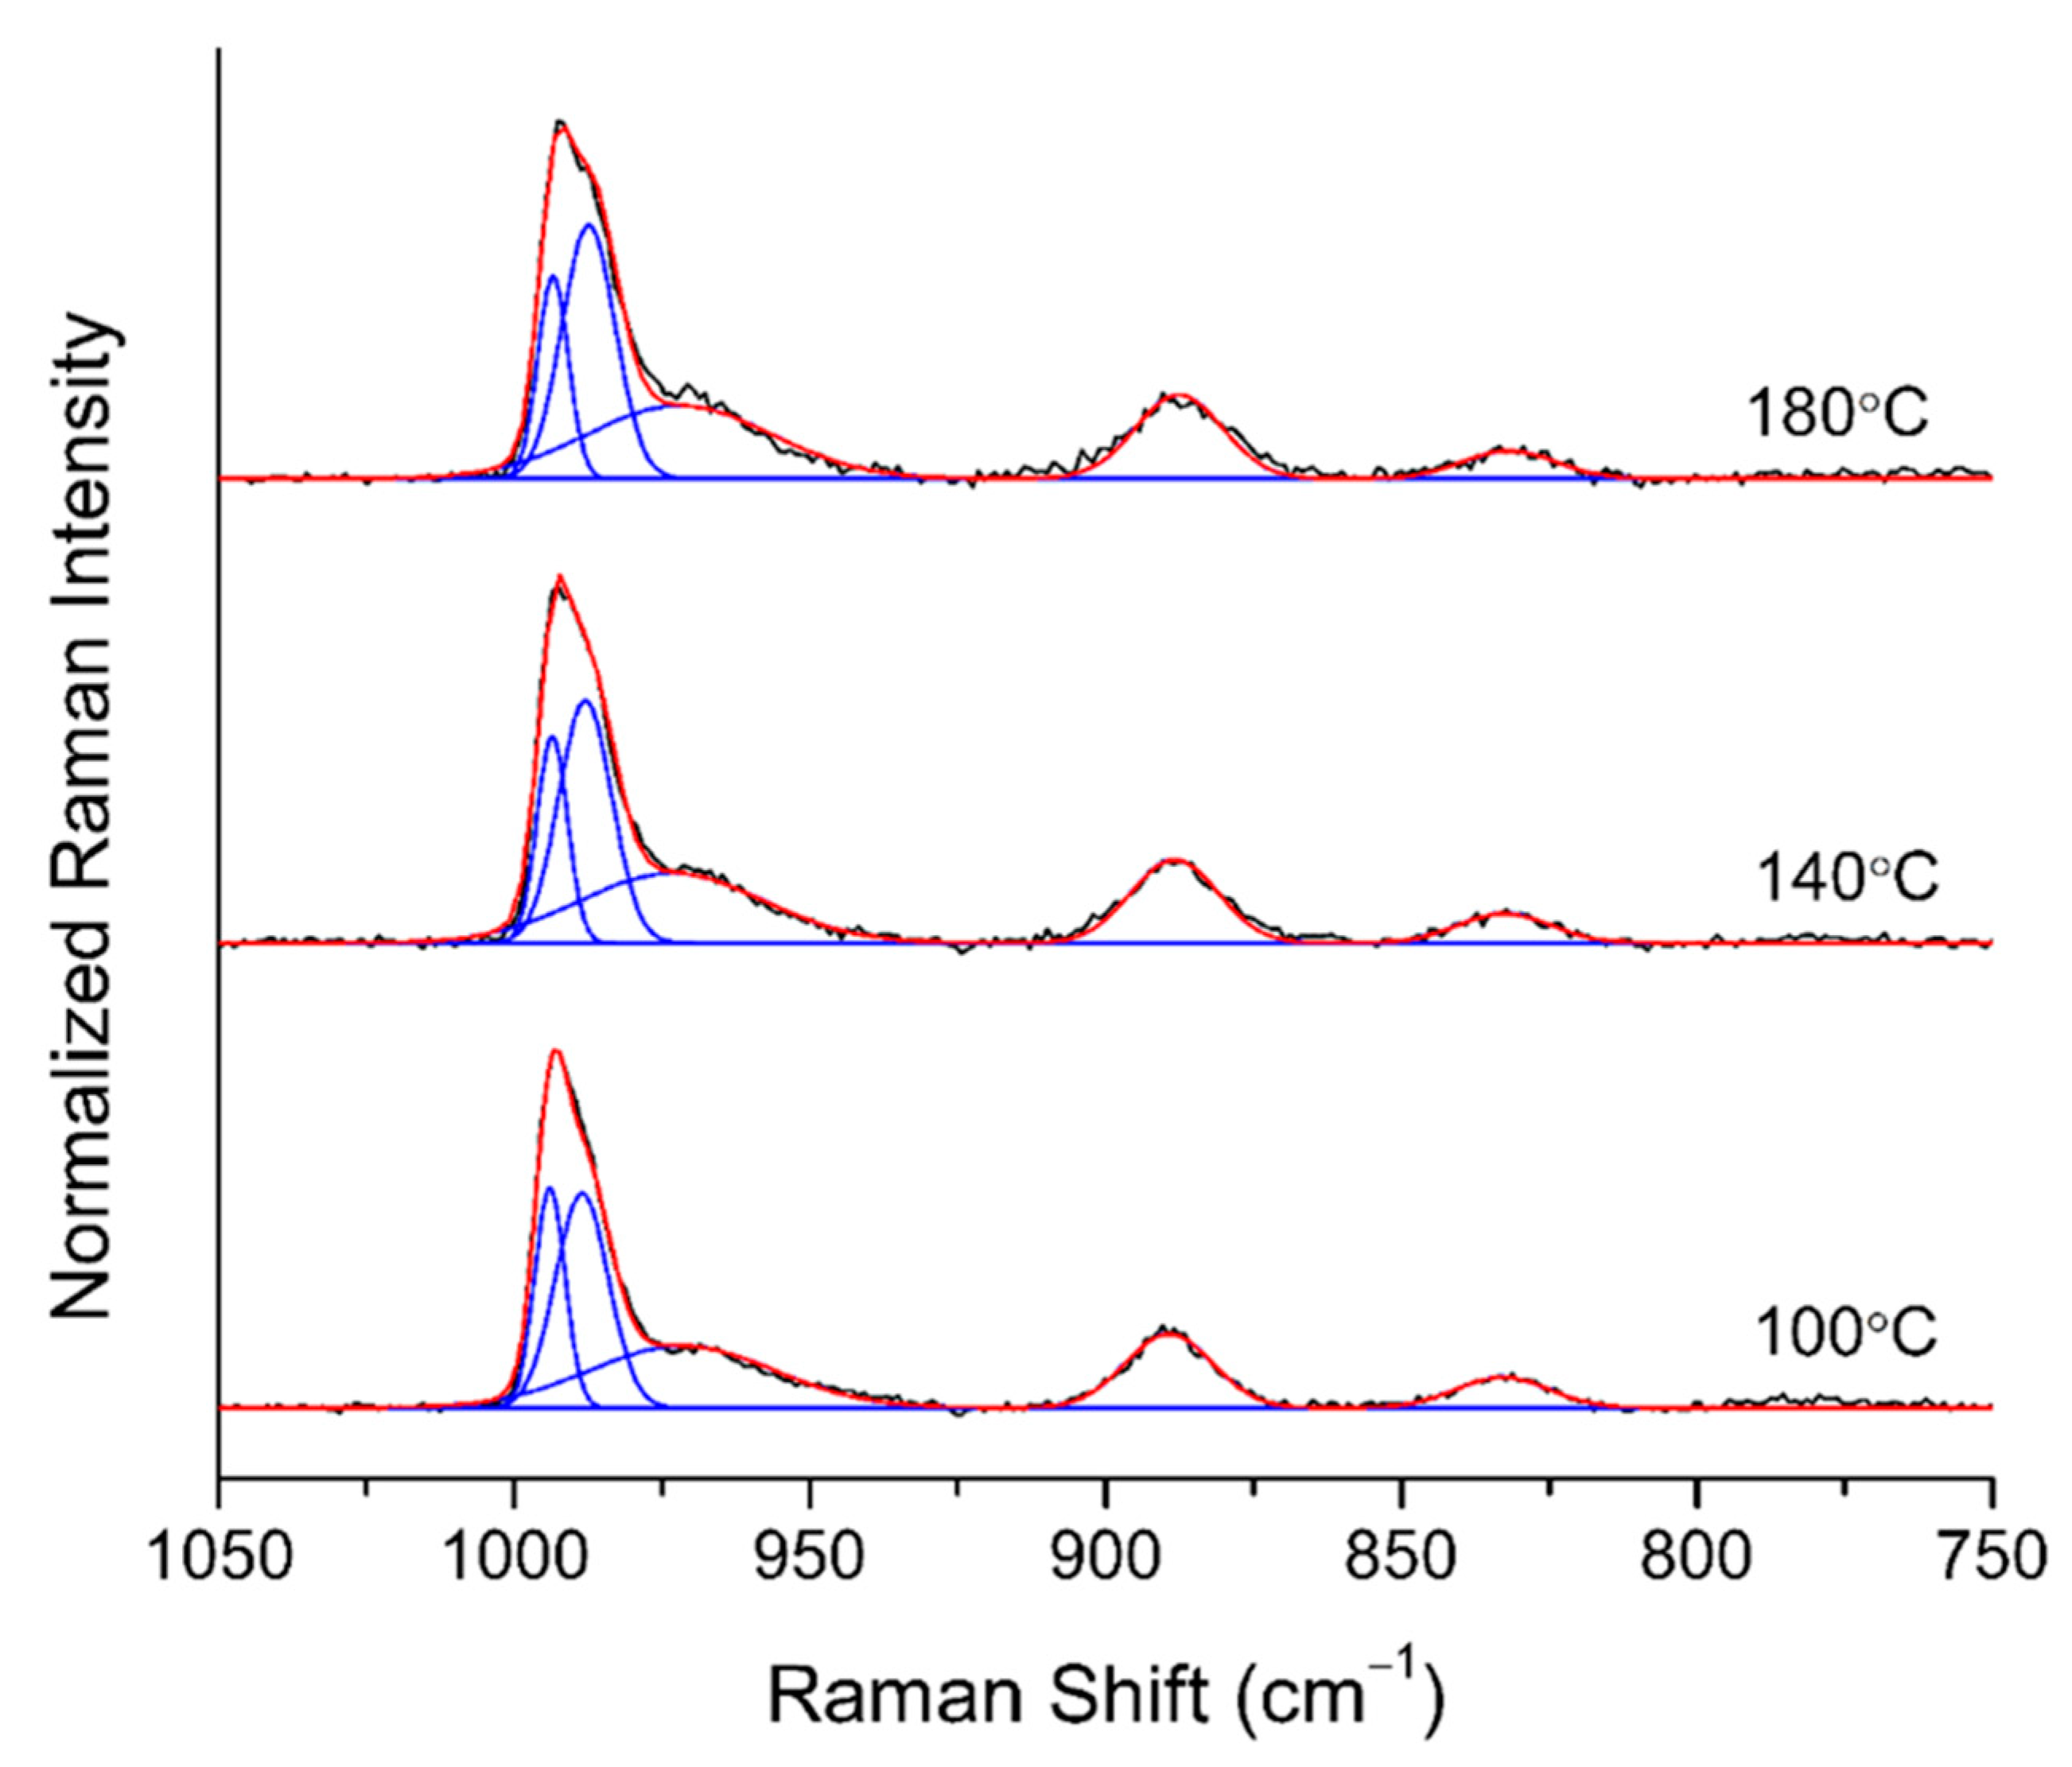
2.1.5. In-Situ Raman
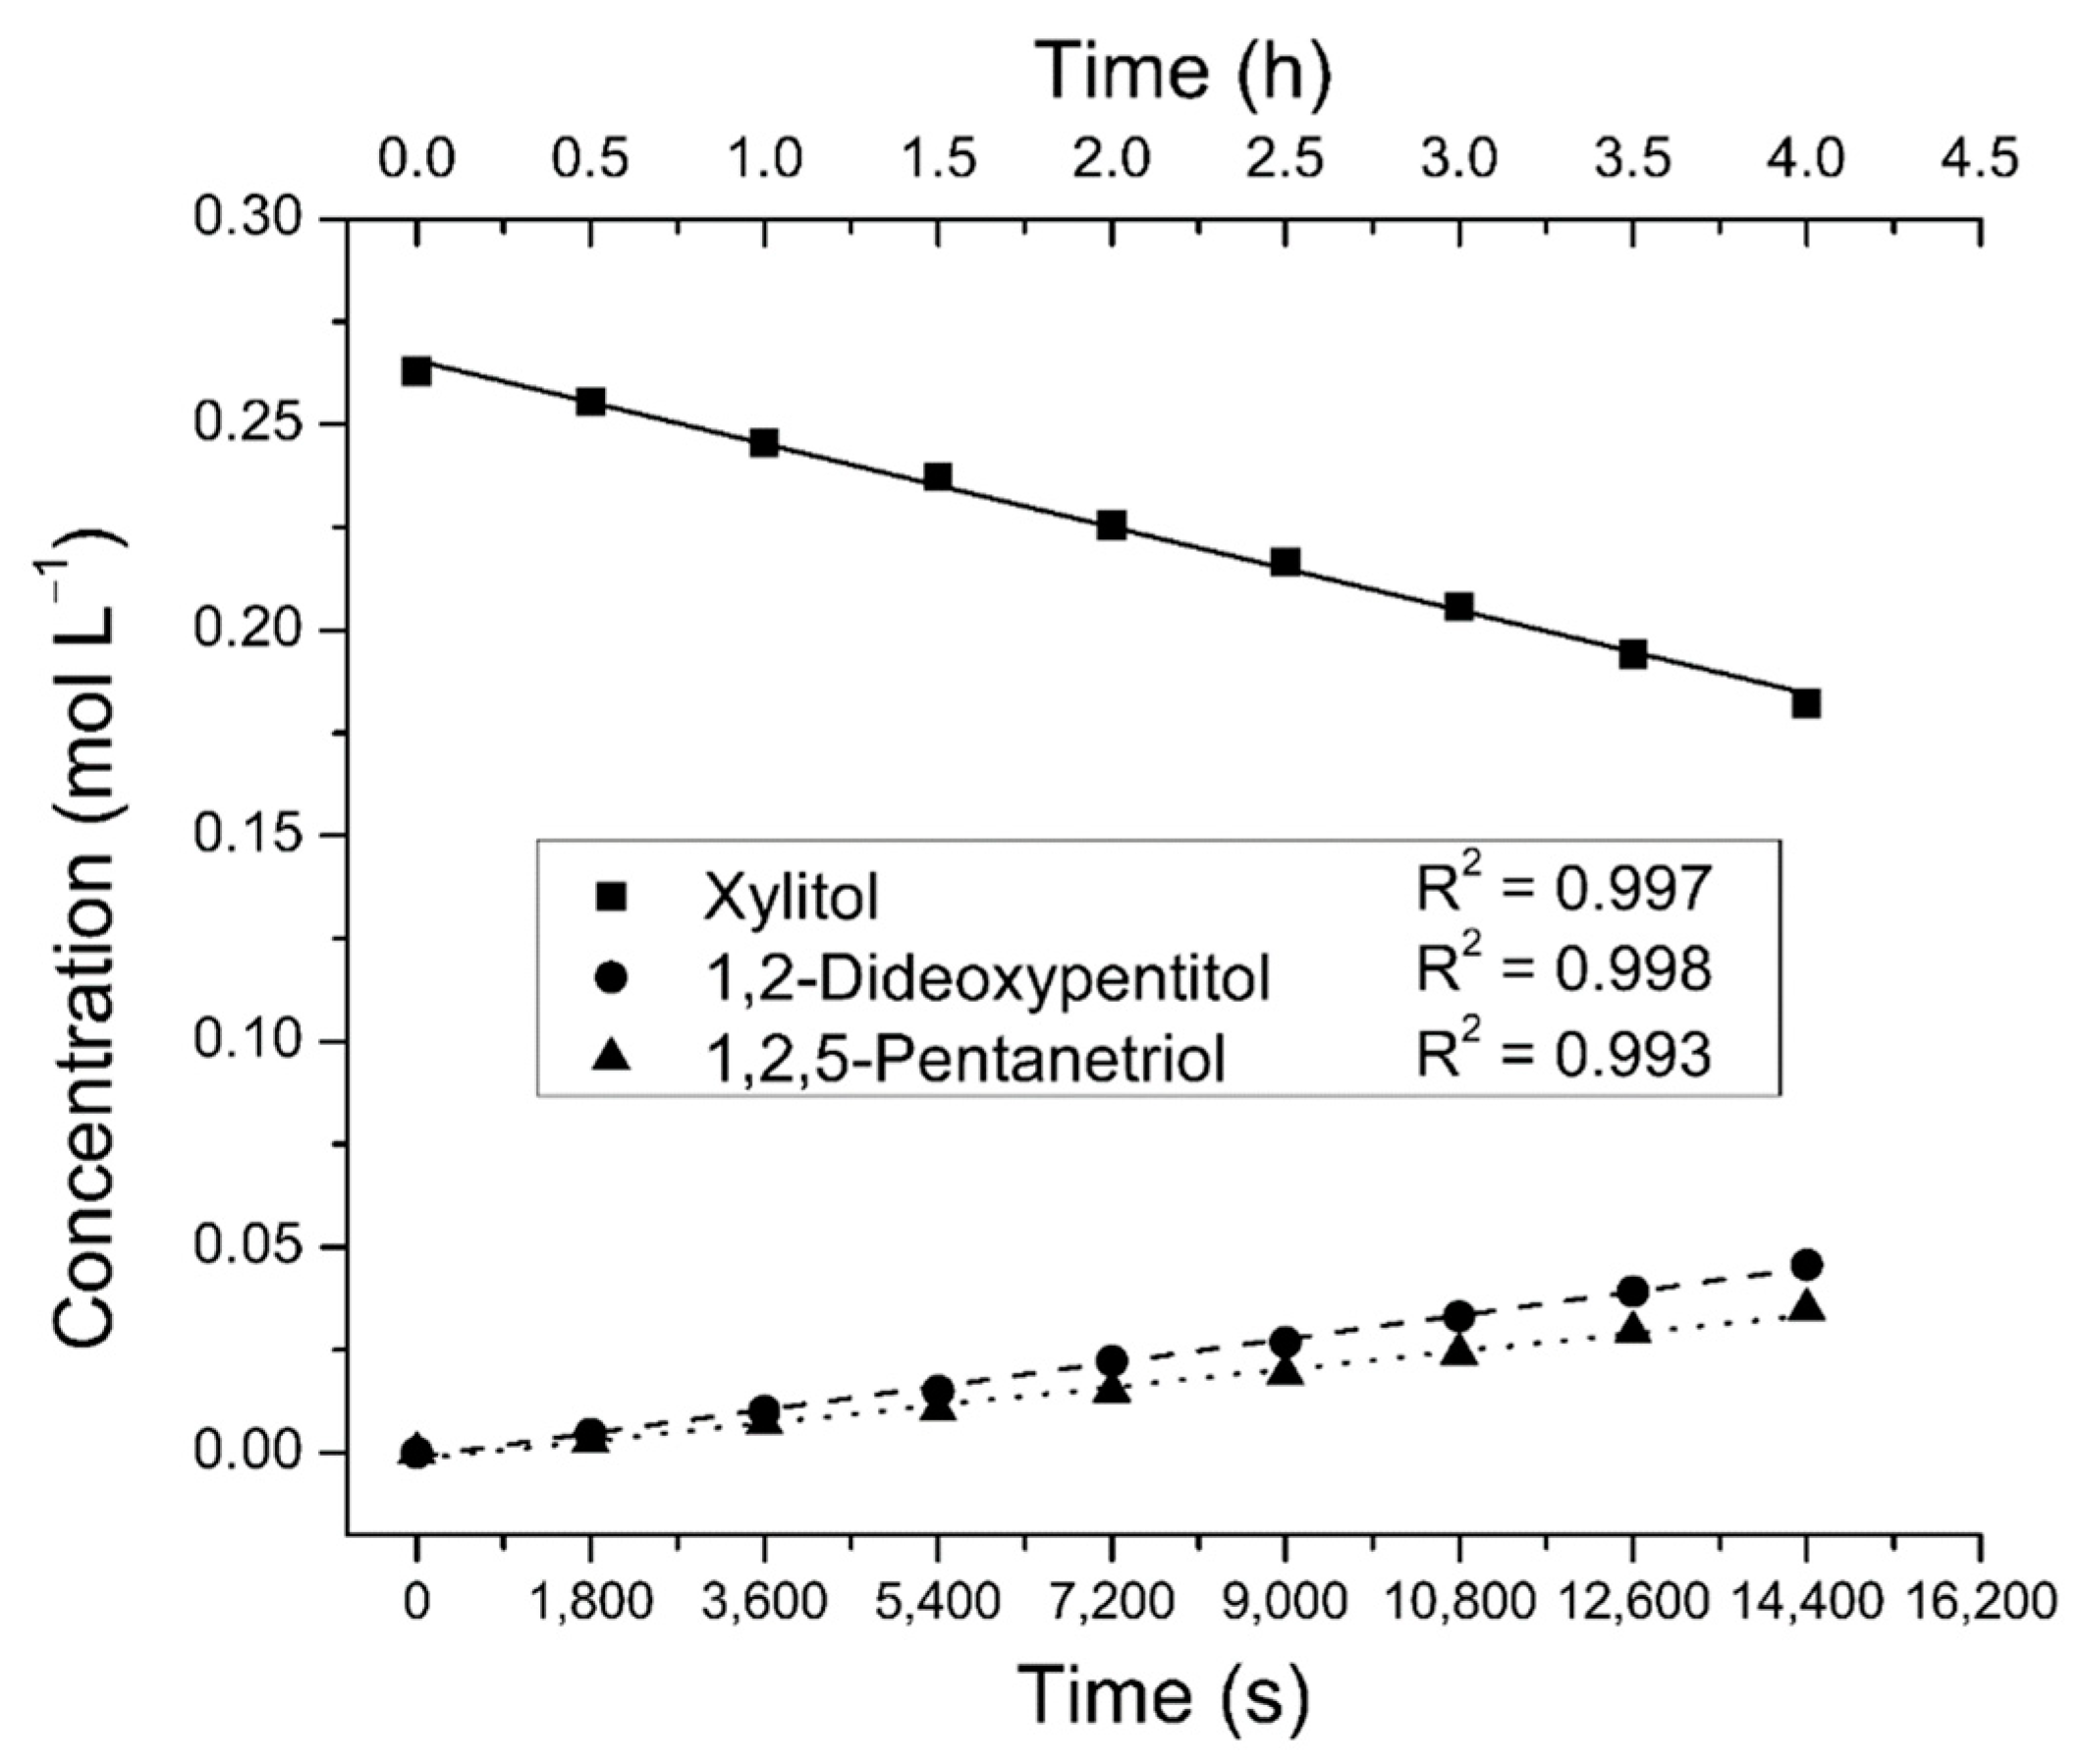
2.2. Reaction Order Determination
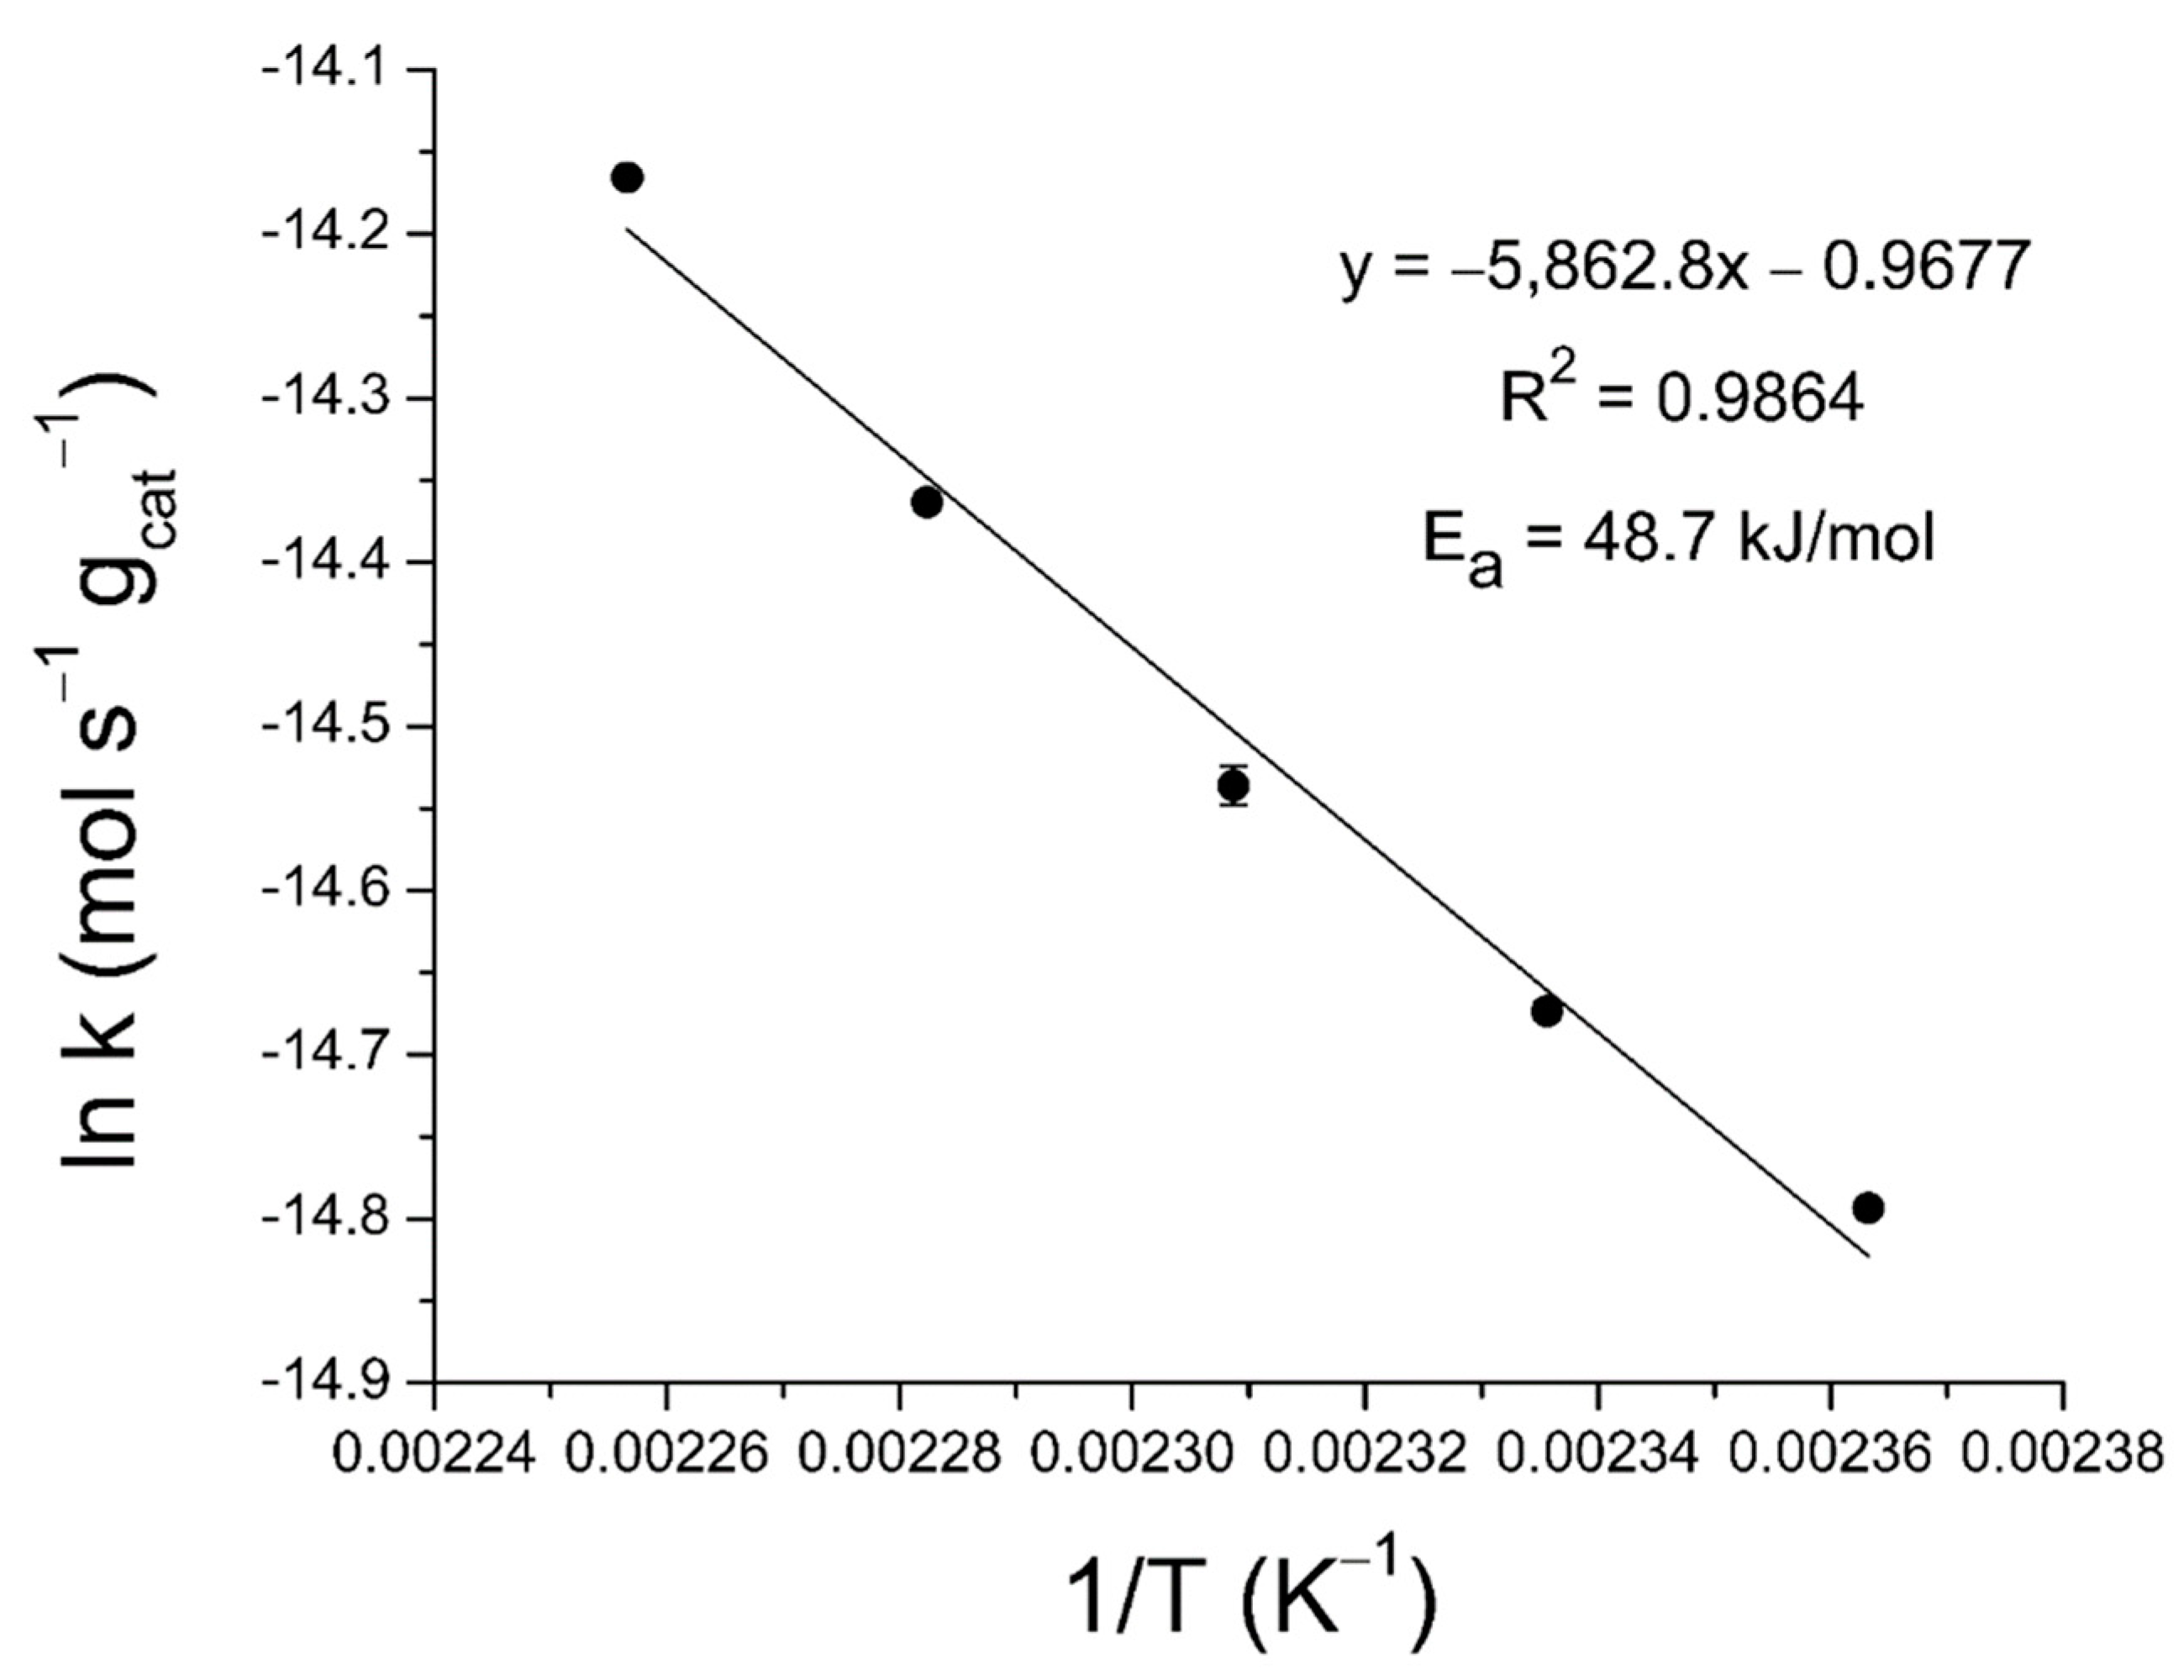
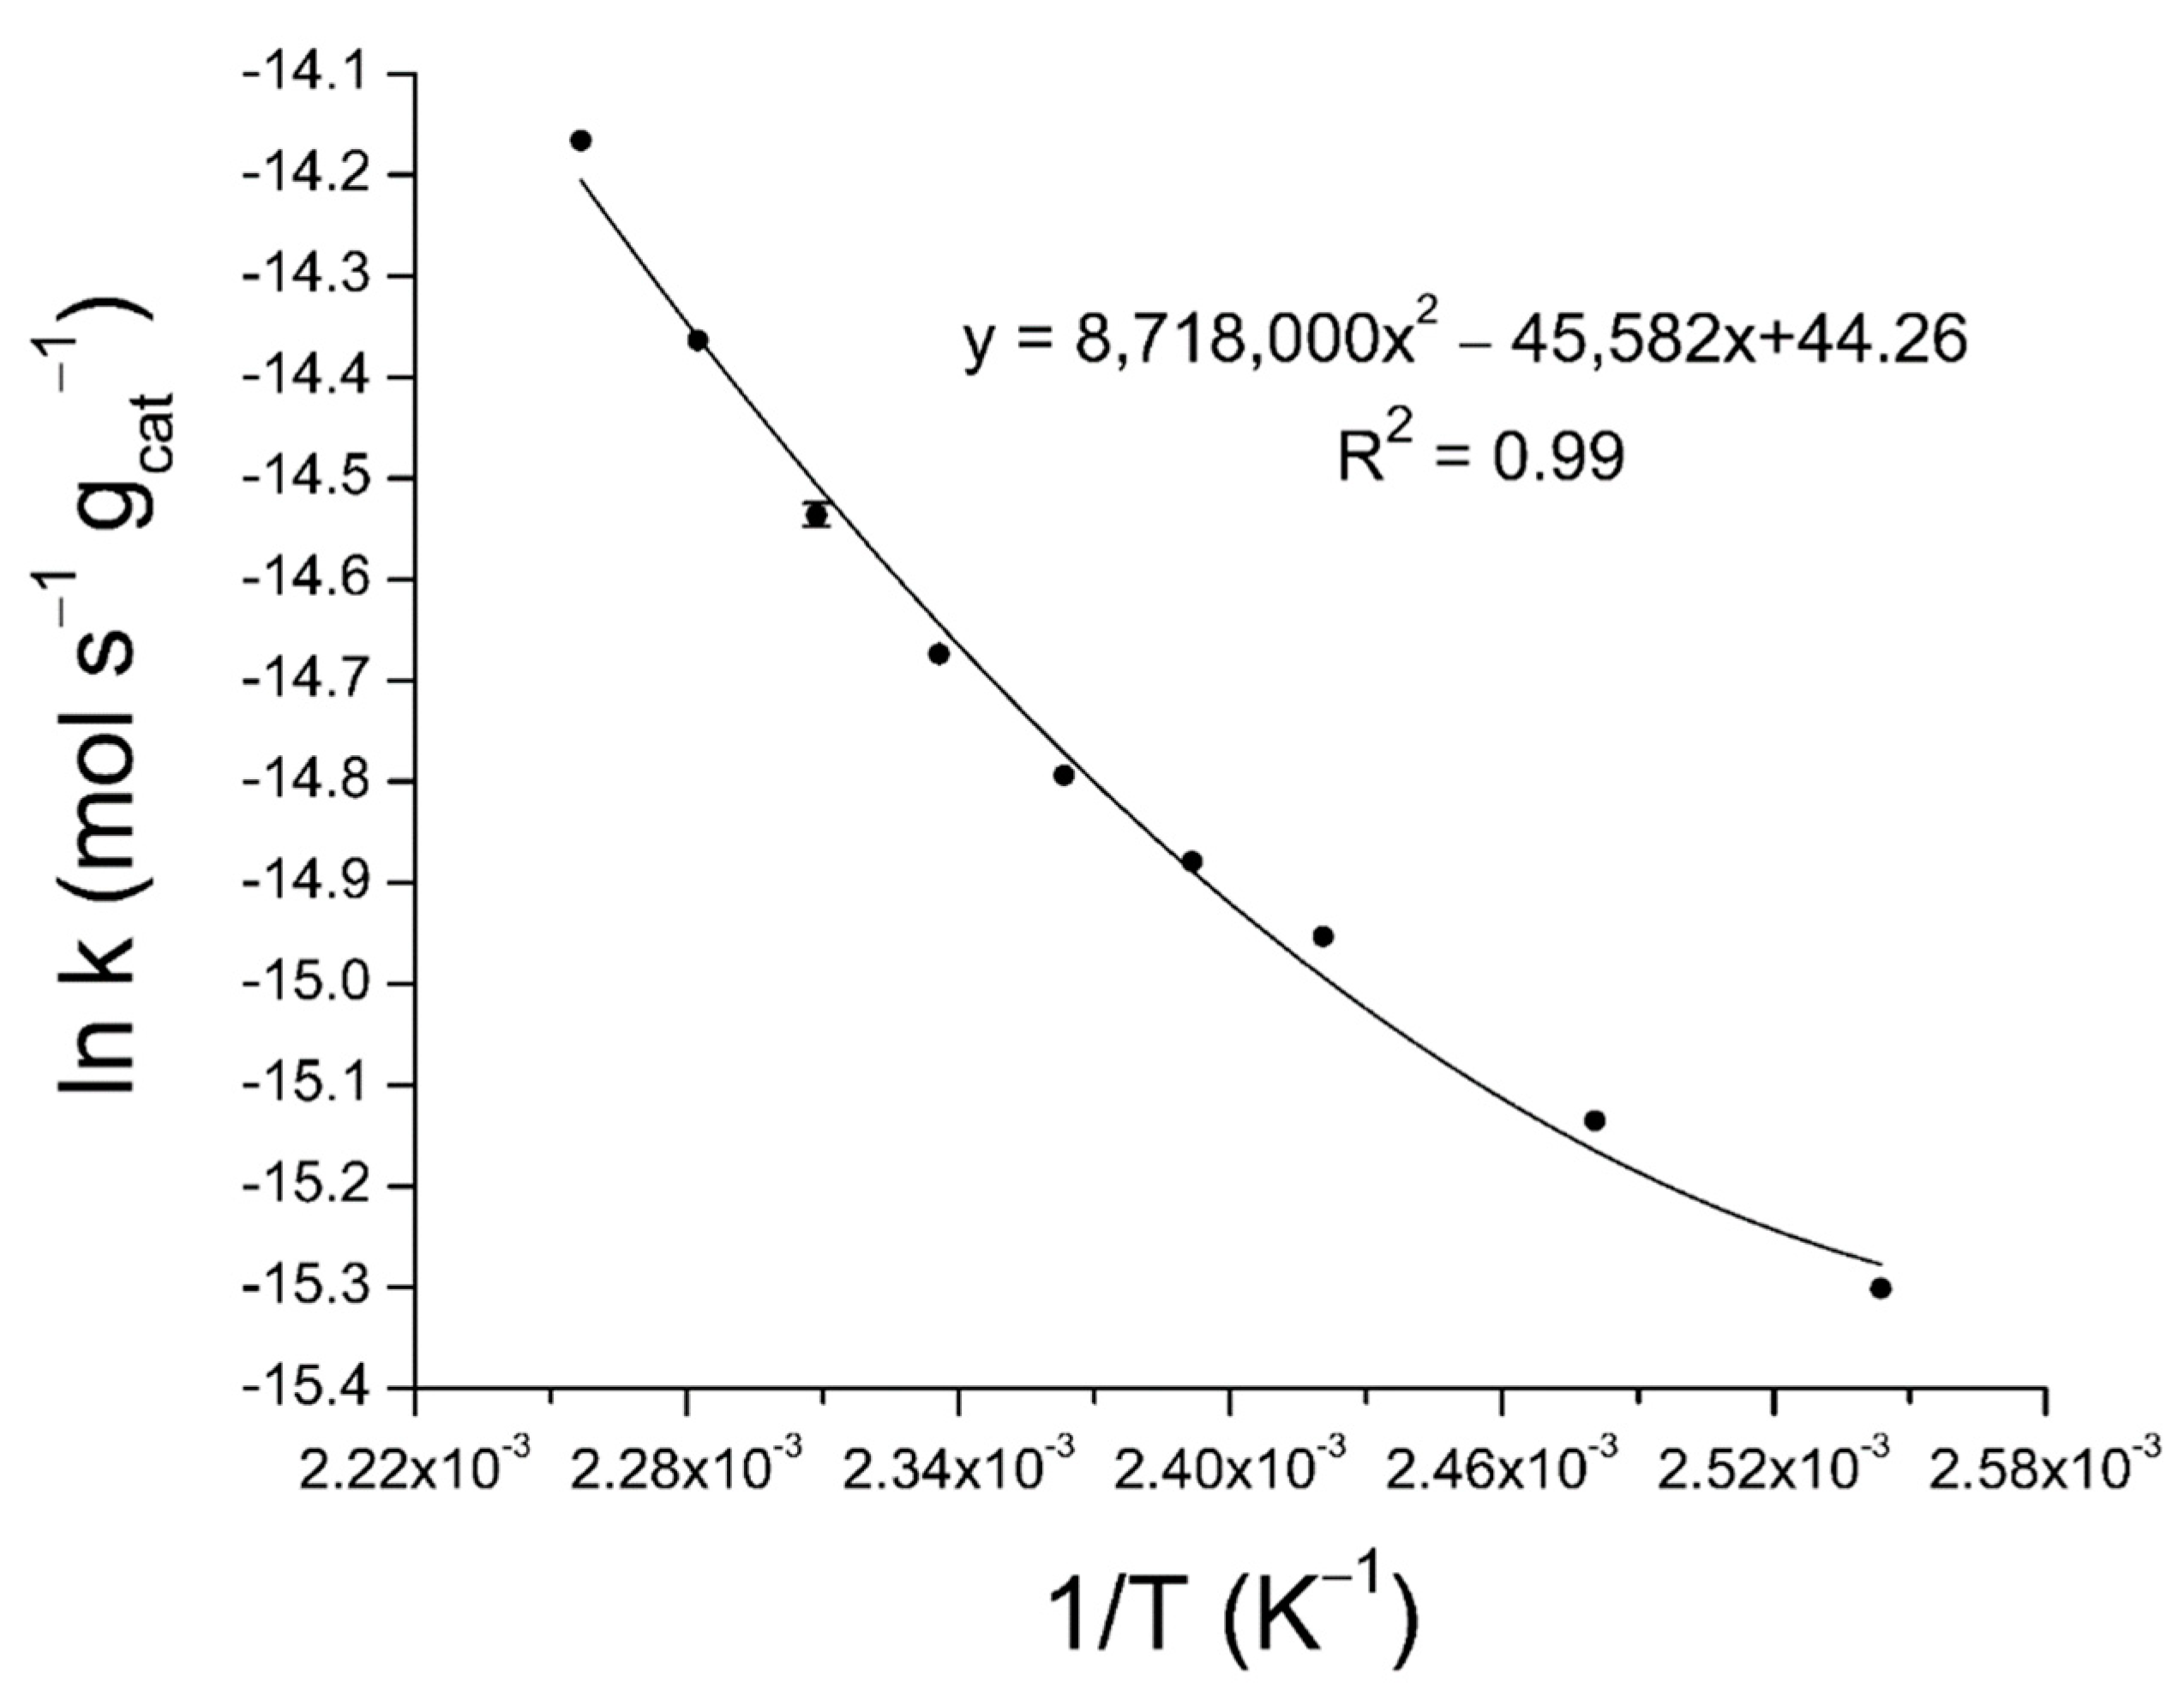
2.3. Activation Energy Determination
2.4. Mass Transfer Evaluations
2.4.1. Weisz–Prater Criterion
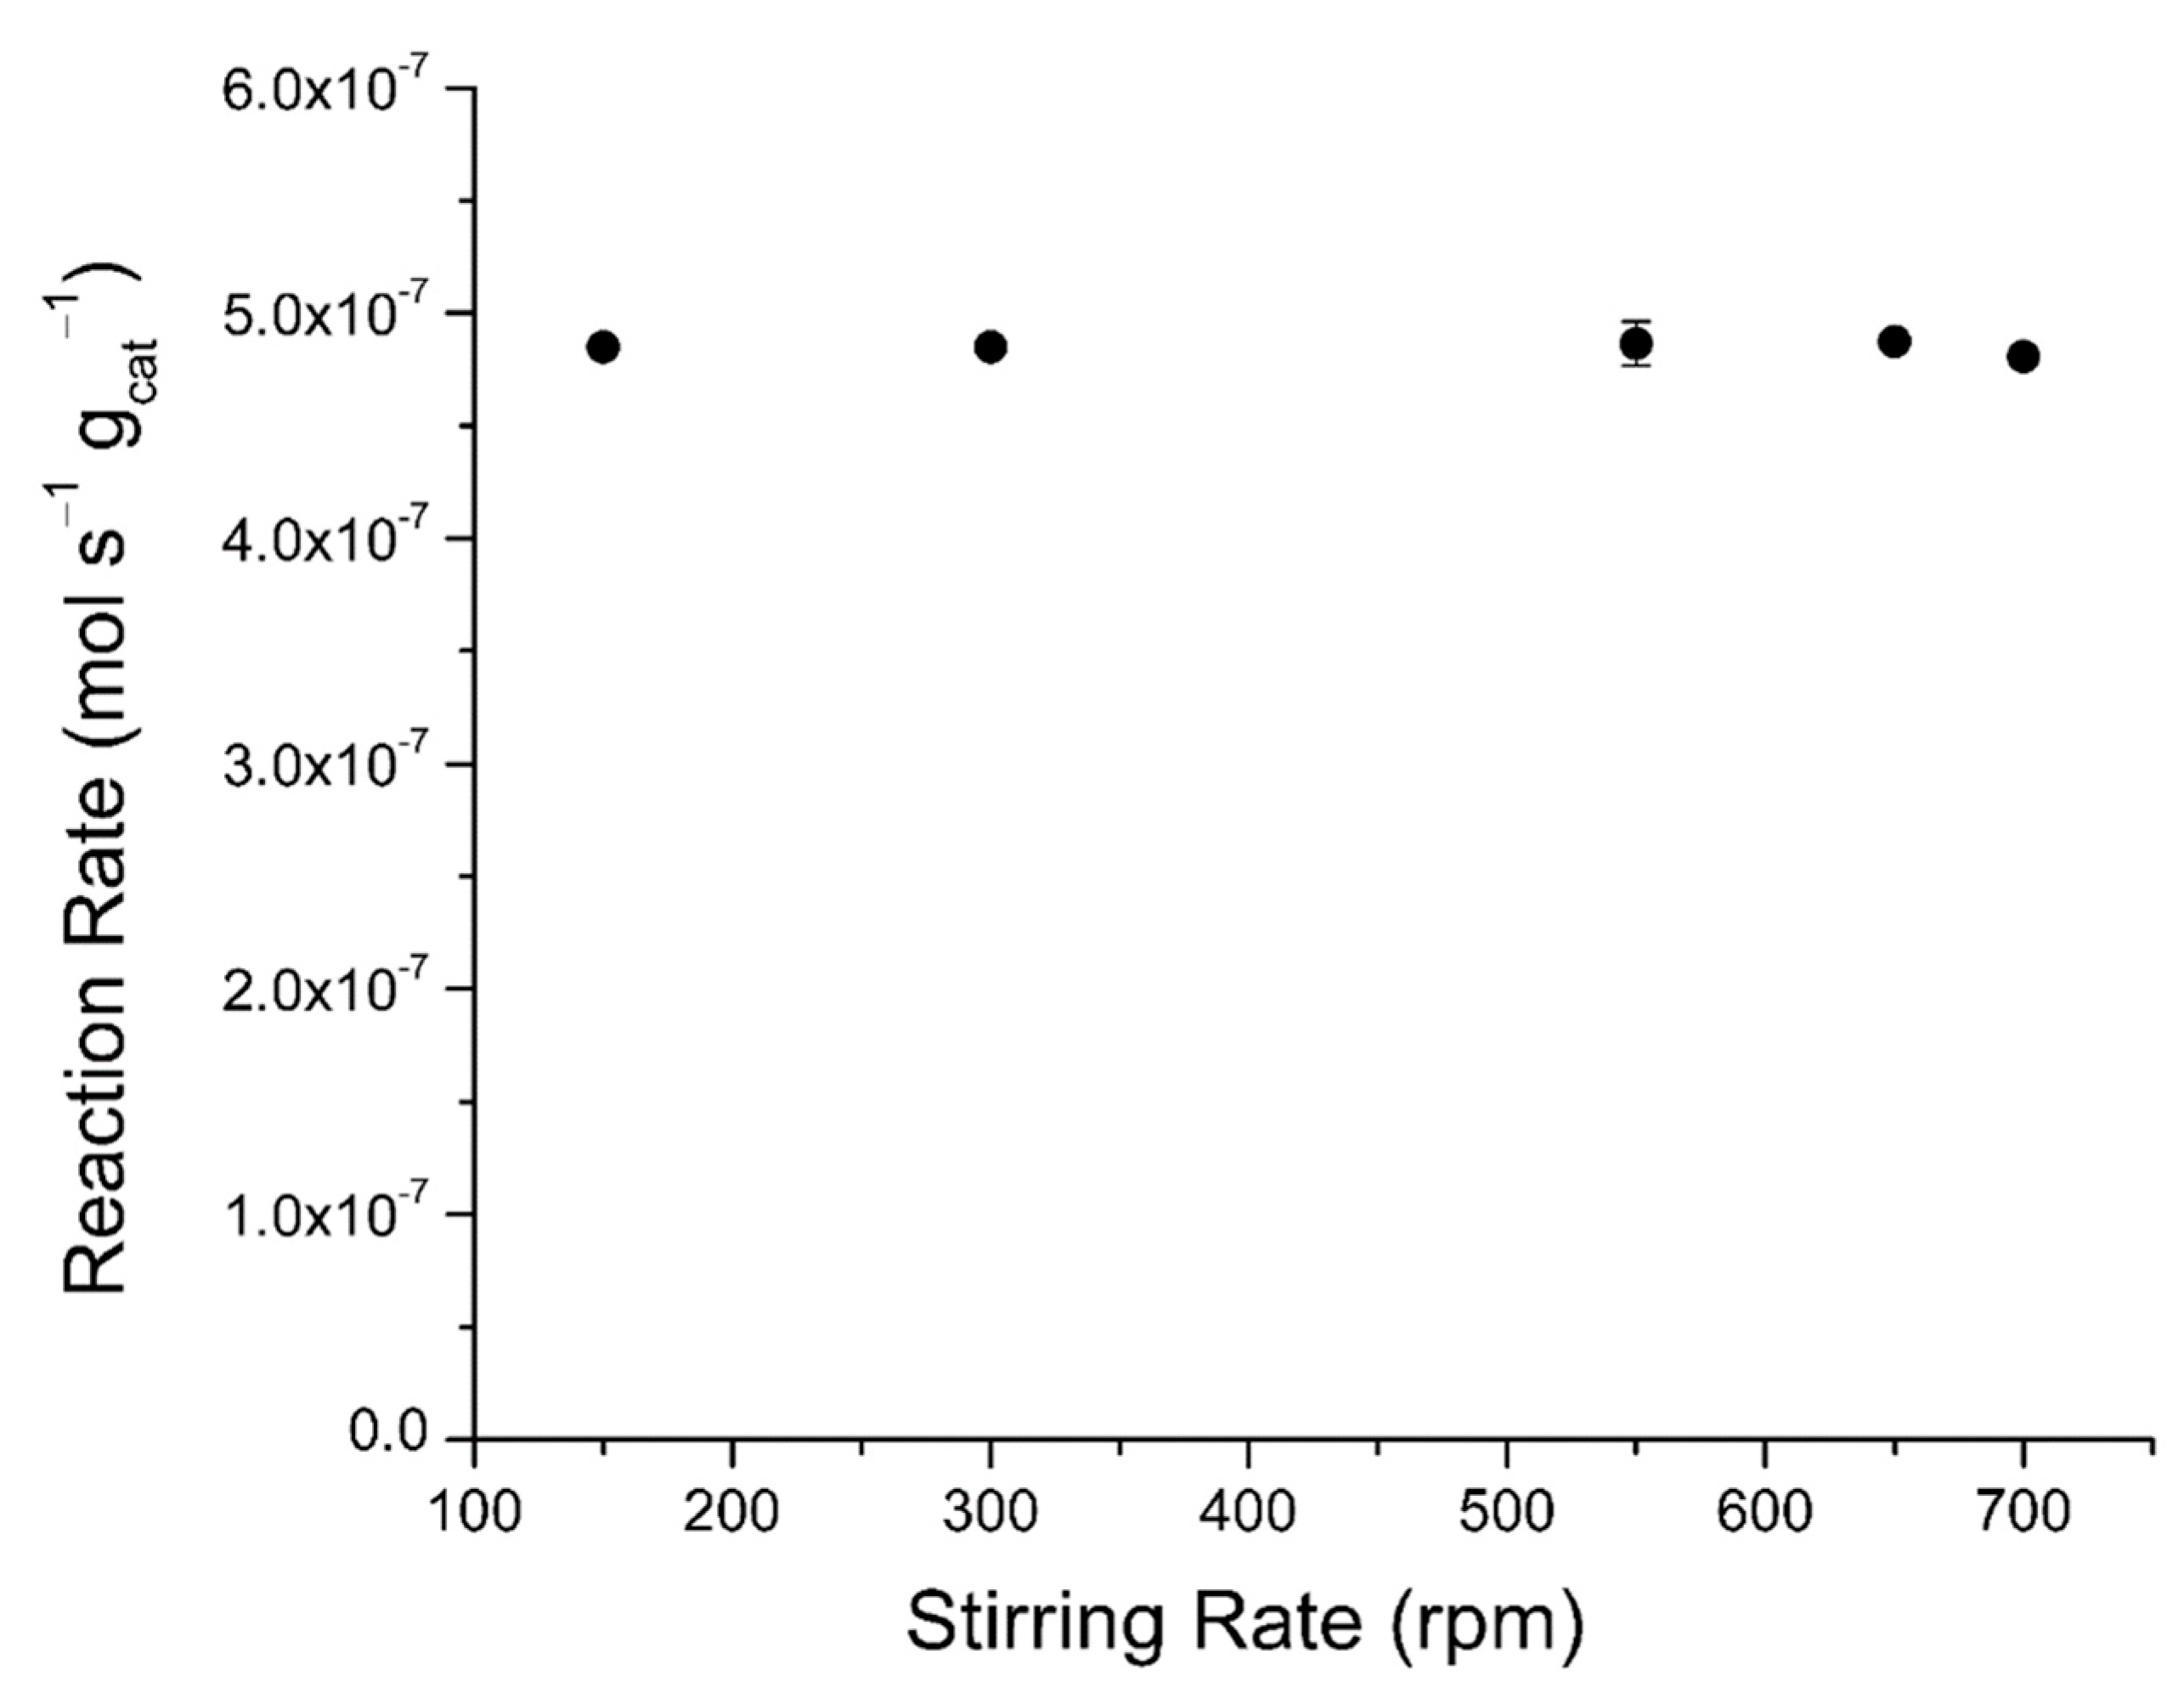
2.4.2. External Mass Transfer
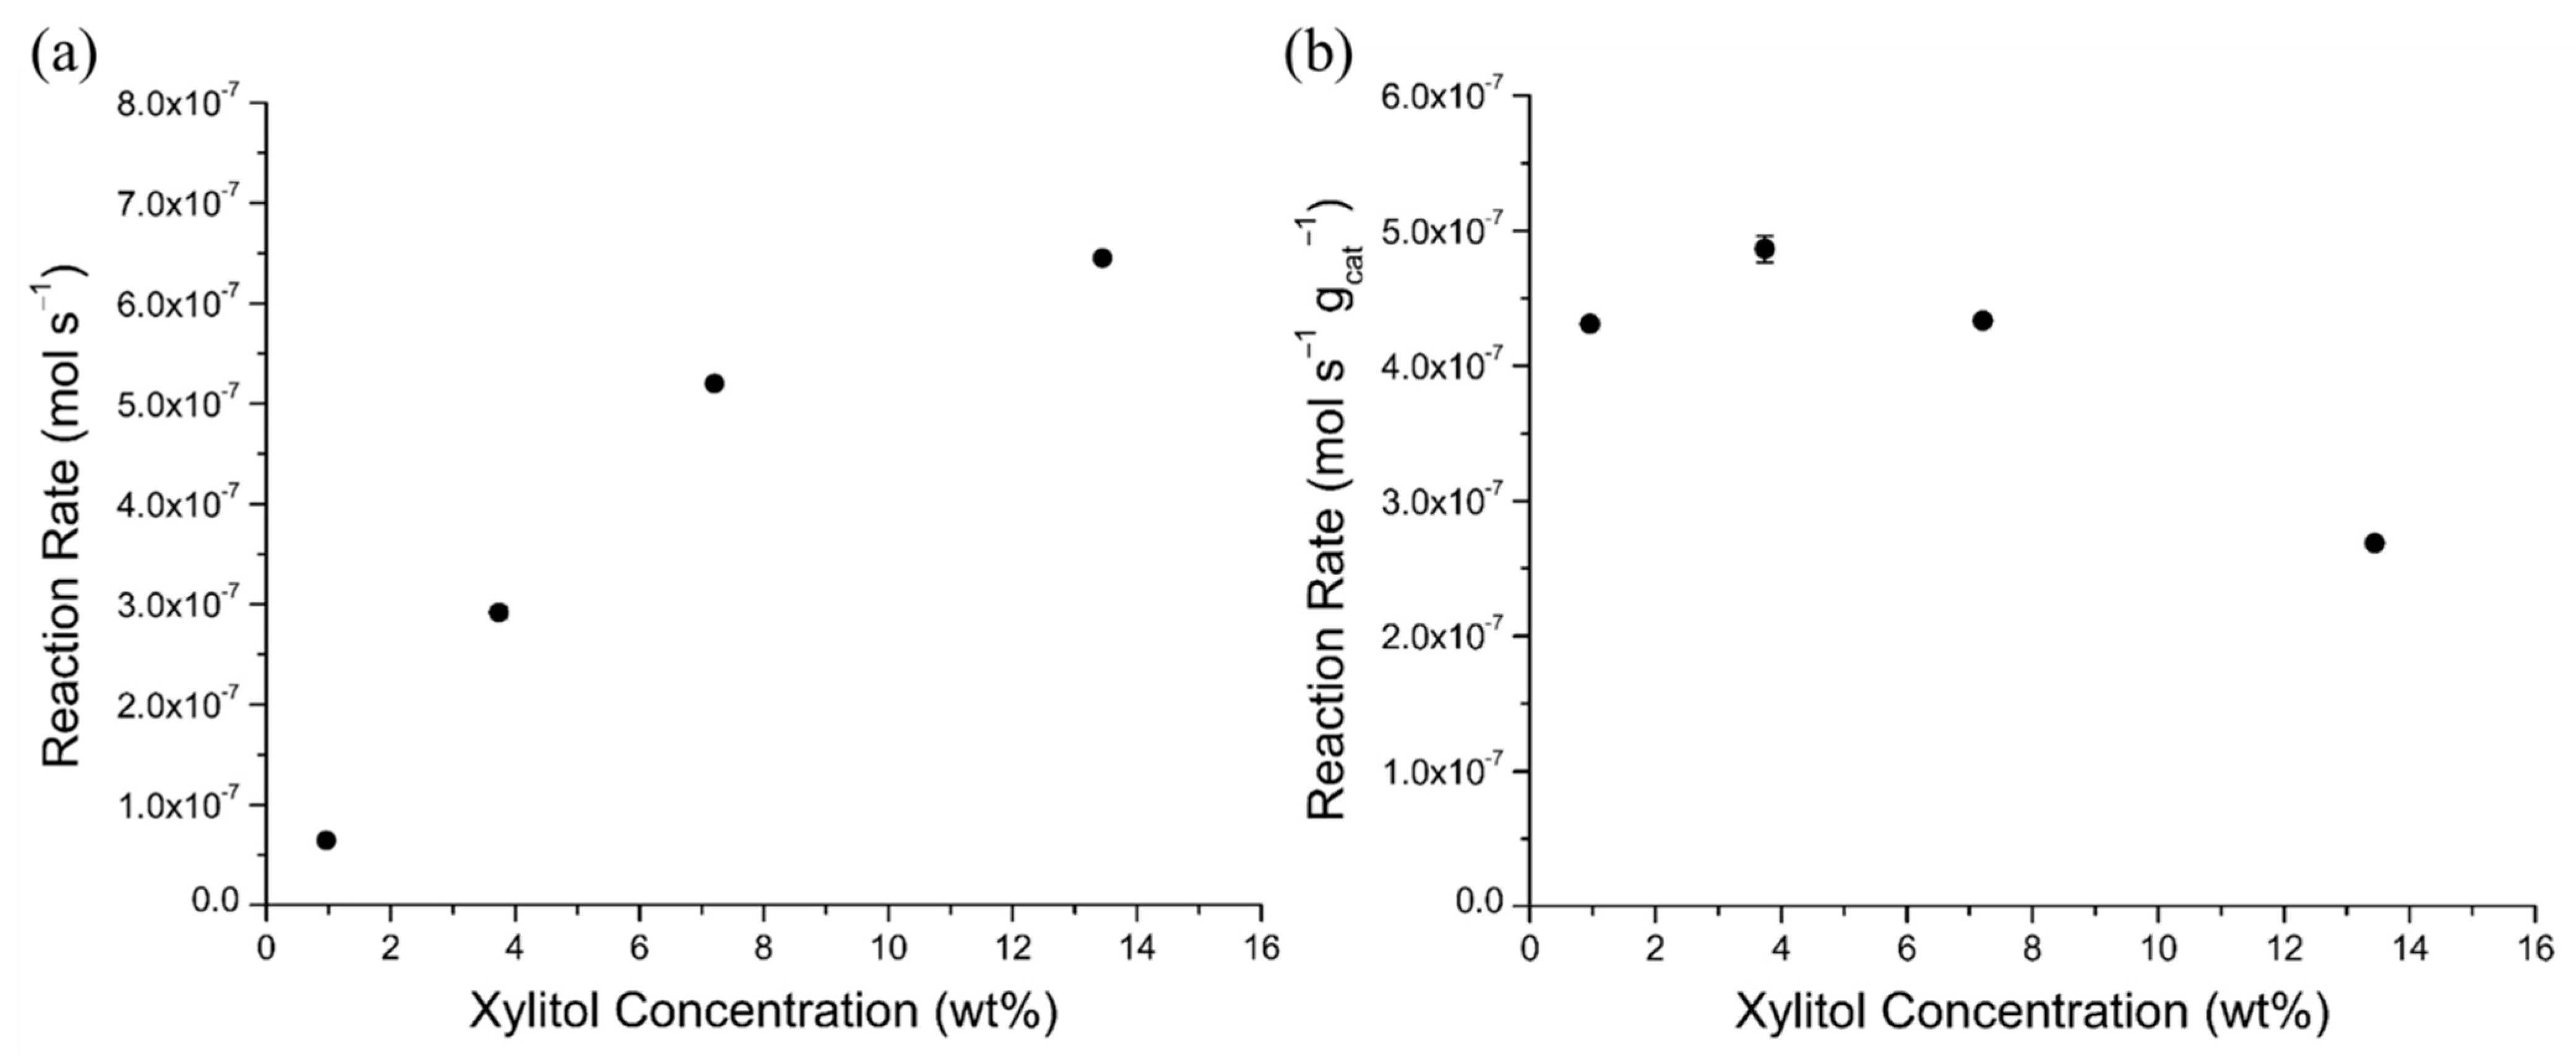
2.4.3. Xylitol Concentration Effects
3. Experimental
3.1. Chemicals
3.2. Catalyst Preparation
3.3. Catalyst Characterization
3.3.1. XRF
3.3.2. ICP-OES
3.3.3. SEM
3.3.4. XRD
3.3.5. TPR
3.3.6. In-Situ Raman
3.4. Reactor Setup
3.5. Kinetic Measurements
4. Conclusions
Supplementary Materials
Author Contributions
Funding
Data Availability Statement
Acknowledgments
Conflicts of Interest
Abbreviations
References
- Alonso, D.M.; Wettstein, S.G.; Dumesic, J.A. Bimetallic Catalysts for Upgrading of Biomass to Fuels and Chemicals. Chem. Soc. Rev. 2012, 41, 8075–8098. [Google Scholar] [CrossRef]
- Melin, K.; Hurme, M. Evaluation of Lignocellulosic Biomass Upgrading Routes to Fuels and Chemicals. Cellul. Chem. Technol. 2010, 44, 117–137. [Google Scholar]
- Luterbacher, J.S.; Martin Alonso, D.; Dumesic, J.A. Targeted Chemical Upgrading of Lignocellulosic Biomass to Platform Molecules. Green Chem. 2014, 16, 4816–4838. [Google Scholar] [CrossRef]
- Stalpaert, M.; De Vos, D. Stabilizing Effect of Bulky β-Diketones on Homogeneous Mo Catalysts for Deoxydehydration. ACS Sustain. Chem. Eng. 2018, 6, 12197–12204. [Google Scholar] [CrossRef]
- Venkateswar Rao, L.; Goli, J.K.; Gentela, J.; Koti, S. Bioconversion of Lignocellulosic Biomass to Xylitol: An Overview. Bioresour. Technol. 2016, 213, 299–310. [Google Scholar] [CrossRef] [PubMed]
- Sena, L.M.F.; Morais, C.G.; Lopes, M.R.; Santos, R.O.; Uetanabaro, A.P.T.; Morais, P.B.; Vital, M.J.S.; de Morais, M.A.; Lachance, M.A.; Rosa, C.A. D-Xylose Fermentation, Xylitol Production and Xylanase Activities by Seven New Species of Sugiyamaella. Antonie van Leeuwenhoek 2017, 110, 53–67. [Google Scholar] [CrossRef]
- Rao, R.S.; Prakasham, R.S.; Prasad, K.K.; Rajesham, S.; Sarma, P.N.; Rao, L.V. Xylitol Production by Candida Sp.: Parameter Optimization Using Taguchi Approach. Process Biochem. 2004, 39, 951–956. [Google Scholar] [CrossRef]
- Granström, T.B.; Izumori, K.; Leisola, M. A Rare Sugar Xylitol. Part II: Biotechnological Production and Future Applications of Xylitol. Appl. Microbiol. Biotechnol. 2007, 74, 273–276. [Google Scholar] [CrossRef]
- MacQueen, B.; Barrow, E.; Rivera Castro, G.; Pagan-Torres, Y.; Heyden, A.; Lauterbach, J. Optimum Reaction Conditions for 1,4-Anhydroerythritol and Xylitol Hydrodeoxygenation over a ReOx-Pd/Ceo2 Catalyst via Design of Experiments. Ind. Eng. Chem. Res. 2019, 58, 8681–8689. [Google Scholar] [CrossRef]
- Ota, N.; Tamura, M.; Nakagawa, Y.; Okumura, K.; Tomishige, K. Hydrodeoxygenation of Vicinal OH Groups over Heterogeneous Rhenium Catalyst Promoted by Palladium and Ceria Support. Angew. Chem. Int. Ed. 2015, 54, 1897–1900. [Google Scholar] [CrossRef]
- Ota, N.; Tamura, M.; Nakagawa, Y.; Okumura, K.; Tomishige, K. Performance, Structure, and Mechanism of ReOX–Pd/CeO2 Catalyst for Simultaneous Removal of Vicinal OH Groups with H2. ACS Catal. 2016, 6, 3213–3226. [Google Scholar] [CrossRef]
- Yamaguchi, A.; Hiyoshi, N.; Sato, O.; Bando, K.K.; Shirai, M. Enhancement of Cyclic Ether Formation from Polyalcohol Compounds in High Temperature Liquid Water by High Pressure Carbon Dioxide. Green Chem. 2009, 11, 48–52. [Google Scholar] [CrossRef]
- Yamaguchi, A.; Hiyoshi, N.; Sato, O.; Shirai, M. Sorbitol Dehydration in High Temperature Liquid Water. Green Chem. 2011, 13, 873–881. [Google Scholar] [CrossRef]
- Tamura, M.; Yuasa, N.; Cao, J.; Nakagawa, Y.; Tomishige, K. Transformation of Sugars into Chiral Polyols over a Heterogeneous Catalyst. Angew. Chem. Int. Ed. 2018, 57, 8058–8062. [Google Scholar] [CrossRef] [PubMed]
- Xi, Y.; Yang, W.; Ammal, S.C.; Lauterbach, J.; Pagan-Torres, Y.; Heyden, A. Mechanistic Study of the Ceria Supported, Re-Catalyzed Deoxydehydration of Vicinal OH Groups. Catal. Sci. Technol. 2018, 8, 5740–5752. [Google Scholar] [CrossRef]
- Wu, D.; Zhang, Y.; Su, H. Mechanistic Study on Oxorhenium-Catalyzed Deoxydehydration and Allylic Alcohol Isomerization. Chem. Asian J. 2016, 11, 1565–1571. [Google Scholar] [CrossRef]
- Cao, J.; Tamura, M.; Hosaka, R.; Nakayama, A.; Hasegawa, J.; Nakagawa, Y.; Tomishige, K. Mechanistic Study on Deoxydehydration and Hydrogenation of Mechanistic Study on Deoxydehydration and Hydrogenation of Me- Thyl Glycosides to Dideoxy Sugars over ReOX–Pd/CeO2 Catalyst. ACS Catal. 2020, 10, 12040–12051. [Google Scholar] [CrossRef]
- Xi, Y.; Lauterbach, J.; Pagan-Torres, Y.; Heyden, A. Deoxydehydration of 1,4-Anhydroerythritol over Anatase TiO2(101)-Supported ReOxand MoOx. Catal. Sci. Technol. 2020, 10, 3731–3738. [Google Scholar] [CrossRef]
- MacQueen, B.; Ruiz-Yi, B.; Royko, M.; Heyden, A.; Pagan-Torres, Y.J.; Williams, C.; Lauterbach, J. In-situ Oxygen Isotopic Exchange Vibrational Spectroscopy of Rhenium Oxide Surface Structures on Cerium Oxide. J. Phys. Chem. C 2020, 124, 7174–7181. [Google Scholar] [CrossRef]
- Shirbhate, S.; Yadav, A.K.; Acharya, S. Investigation of in-situ Oxygen Vacancies Dissociation Mechanism and Associated Atomic Scale Reshuffling during Oxy-Ion Migration in Nanostructured Co-Doped Ceria. Solid State Ion. 2020, 345, 115157. [Google Scholar] [CrossRef]
- Cordatos, H.; Bunluesin, T.; Stubenrauch, J.; Vohs, J.M.; Gorte, R.J. Effect of Ceria Structure on Oxygen Migration for Rh/Ceria Catalysts. J. Phys. Chem. 1996, 100, 785–789. [Google Scholar] [CrossRef]
- Varalda, J.; Dartora, C.A.; De Camargo, P.C.; De Oliveira, A.J.A.; Mosca, D.H. Oxygen Diffusion and Vacancy Migration Thermally-Activated Govern High-Temperature Magnetism in Ceria. Sci. Rep. 2019, 9, 1–9. [Google Scholar] [CrossRef] [PubMed]
- Balducci, G.; Islam, M.S.; Kaspar, J.; Fornasiero, P.; Graziani, M. Bulk Reduction Oxygen Migration in the Ceria-Based Oxides. Chem. Mater. 2000, 12, 677–681. [Google Scholar] [CrossRef]
- Nolan, M.; Fearon, J.E.; Watson, G.W. Oxygen Vacancy Formation and Migration in Ceria. Solid State Ion. 2006, 177, 3069–3074. [Google Scholar] [CrossRef]
- Silva, V.H.C.; Aquilanti, V.; De Oliveira, H.C.B.; Mundim, K.C. Uniform Description of Non-Arrhenius Temperature Dependence of Reaction Rates, and a Heuristic Criterion for Quantum Tunneling vs. Classical Non-Extensive Distribution. Chem. Phys. Lett. 2013, 590, 201–207. [Google Scholar] [CrossRef]
- Gregório, A.P.H.; Borsato, D.; Moreira, I.; Silva, E.T.; Romagnoli, É.S.; Spacino, K.R. Apparent Activation Energy and Relative Protection Factor of Natural Antioxidants in Mixture with Biodiesel. Biofuels 2019, 10, 607–614. [Google Scholar] [CrossRef]
- Nishiyama, M.; Kleijn, S.; Aquilanti, V.; Kasai, T. Temperature Dependence of Respiration Rates of Leaves, 18O-Experiments and Super-Arrhenius Kinetics. Chem. Phys. Lett. 2009, 482, 325–329. [Google Scholar] [CrossRef]
- Truhlar, D.G.; Kohen, A. Convex Arrhenius Plots and Their Interpretation. Proc. Natl. Acad. Sci. USA 2001, 98, 848–851. [Google Scholar] [CrossRef]
- Coutinho, N.D.; Silva, V.H.C.; De Oliveira, H.C.B.; Camargo, A.J.; Mundim, K.C.; Aquilanti, V. Stereodynamical Origin of Anti-Arrhenius Kinetics: Negative Activation Energy and Roaming for a Four-Atom Reaction. J. Phys. Chem. Lett. 2015, 6, 1553–1558. [Google Scholar] [CrossRef]
- Coutinho, N.D.; Sanches-Neto, F.O.; Carvalho-Silva, V.H.; de Oliveira, H.C.B.; Ribeiro, L.A.; Aquilanti, V. Kinetics of the OH+HCl→H2O+Cl Reaction: Rate Determining Roles of Stereodynamics and Roaming and of Quantum Tunneling. J. Comput. Chem. 2018, 39, 2508–2516. [Google Scholar] [CrossRef]
- Berglin, T.; Schöön, N.H. Selectivity Aspects of the Hydrogenation Stage of the Anthraquinone Process for Hydrogen Peroxide Production. Ind. Eng. Chem. Process Des. Dev. 1983, 22, 150–153. [Google Scholar] [CrossRef]
- Santacesaria, E.; Di Serio, M.; Velotti, R.; Leone, U. Kinetics, Mass Transfer, and Palladium Catalyst Deactivation in the Hydrogenation Step of the Hydrogen Peroxide Synthesis via Anthraquinone. Ind. Eng. Chem. Res. 1994, 33, 277–284. [Google Scholar] [CrossRef]
- Lari, G.M.; Grçninger, O.G.; Li, Q.; Mondelli, C.; Javier, P.Ø. Catalyst and Process Design for the Continuous Manufacture of Rare Sugar Alcohols by Epimerization—Hydrogenation of Aldoses. ChemSusChem 2016, 9, 3407–3418. [Google Scholar] [CrossRef]
- Ruppert, A.M.; Weinberg, K.; Palkovits, R. Hydrogenolysis Goes Bio: From Carbohydrates and Sugar Alcohols to Platform Chemicals. Angew. Chem. Int. Ed. 2012, 51, 2564–2601. [Google Scholar] [CrossRef] [PubMed]
- Vilcocq, L.; Cabiac, A.; Especel, C.; Guillon, E.; Duprez, D. Transformation of Sorbitol to Biofuels by Heterogeneous Catalysis: Chemical and Industrial Considerations. Oil Gas Sci. Technol. Rev. d’IFP Energ. Nouv. 2013, 68, 841–860. [Google Scholar] [CrossRef]
- Peng, B.; Zhao, C.; Mejía-centeno, I.; Fuentes, G.A.; Jentys, A.; Lercher, J.A. Comparison of Kinetics and Reaction Pathways for Hydrodeoxygenation of C3 Alcohols on Pt/Al2O3. Catal. Today 2012, 183, 3–9. [Google Scholar] [CrossRef]
- Sievers, C.; Scott, S.L.; Noda, Y.; Qi, L.; Albuquerque, E.M.; Rioux, R.M. Phenomena Affecting Catalytic Reactions at solid−Liquid Interfaces. ACS Catal. 2016, 6, 8286–8307. [Google Scholar] [CrossRef]
- Harju, H.; Pipitone, G.; Lefferts, L. Influence of the Catalyst Particle Size on the Aqueous Phase Reforming of N-Butanol Over Rh/ZrO2. Front. Chem. 2020, 8, 17. [Google Scholar] [CrossRef]
- Fu, J.; Lu, X.; Savage, P.E. Catalytic Hydrothermal Deoxygenation of Palmitic Acid. Energy Environ. Sci. 2010, 13, 253. [Google Scholar] [CrossRef]
- Mukherjee, S.; Vannice, M.A. Solvent Effects in Liquid-Phase Reactions. I. Activity and Selectivity during Citral Hydrogenation on Pt/SiO2 and Evaluation of Mass Transfer Effects. J. Catal. 2006, 243, 108–130. [Google Scholar] [CrossRef]
- Brunner, E. Solubility of Hydrogen in 10 Organic Solvents at 298.15, 323.15, and 373.15 K. J. Chem. Eng. Data 1985, 30, 269–273. [Google Scholar] [CrossRef]


| Reaction/Catalyst | Activation Energy | Method | Reference |
|---|---|---|---|
| DODH of 1,4-anhydroerythritol over ReO2/CeO2 | 153 kJ/mol | DFT | Ota et al., 2016 [11] |
| DODH of 1,4-anhydroerythritol over ReO/CeO2 | 109 kJ/mol | DFT | Xi et al., 2018 [15] |
| DODH of 1,4-anhydroerythritol over ReO-Pd/CeO2 | 111 kJ/mol | DFT | Xi et al., 2018 [15] |
| DODH of 1,4-anhydroerythritol over ReO2(2O)/TiO2(101) | 71.4 kJ/mol | DFT | Xi et al., 2020 [18] |
| DODH 1,4-anhydroerythritol over MoO2(2O)/TiO2(101) | 160.2 kJ/mol | DFT | Xi et al., 2020 [18] |
| DODH of 3-Butene-1,2-diol over CH3ReO2 | 118.8 kJ/mol | DFT | Wu et al., 2016 [16] |
| DODH of 3-Butene-1,2-diol over CH3ReO(OH)2 | 79.9 kJ/mol | DFT | Wu et al., 2016 [16] |
| DODH of methyl α-l-rhamnopyranoside over ReOx-Pd/CeO2 | 65, 63 kJ/mol | DFT, Arrhenius | Cao et al., 2020 [17] |
| DODH of methyl α-l-fucopyranoside over ReOx-Pd/CeO2 | 77, 73 kJ/mol | DFT, Arrhenius | Cao et al., 2020 [17] |
| Kinetic Parameter | Value | 95% CI |
|---|---|---|
| A | 44 mol s−1 gcat−1 | (23, 65) |
| B | −3.79 × 10⁵ J mol−1 | (−5.76 × 10⁵, −2.34 × 10⁻⁵) |
| C | 6.03 × 10⁸ J2 mol−2 | (3.52 × 10⁸, 8.53 × 10⁸) |
| Temperature (K) | Activation Energy (kJ/mol) |
|---|---|
| 393.15 | 10.2 |
| 403.15 | 19.4 |
| 413.15 | 28.1 |
| 418.15 | 32.3 |
| 423.15 | 36.4 |
| 428.15 | 40.4 |
| 433.15 | 44.3 |
| 438.15 | 48.1 |
| 443.15 | 51.8 |
Publisher’s Note: MDPI stays neutral with regard to jurisdictional claims in published maps and institutional affiliations. |
© 2021 by the authors. Licensee MDPI, Basel, Switzerland. This article is an open access article distributed under the terms and conditions of the Creative Commons Attribution (CC BY) license (http://creativecommons.org/licenses/by/4.0/).
Share and Cite
MacQueen, B.; Royko, M.; Crandall, B.S.; Heyden, A.; Pagán-Torres, Y.J.; Lauterbach, J. Kinetics Study of the Hydrodeoxygenation of Xylitol over a ReOx-Pd/CeO2 Catalyst. Catalysts 2021, 11, 108. https://doi.org/10.3390/catal11010108
MacQueen B, Royko M, Crandall BS, Heyden A, Pagán-Torres YJ, Lauterbach J. Kinetics Study of the Hydrodeoxygenation of Xylitol over a ReOx-Pd/CeO2 Catalyst. Catalysts. 2021; 11(1):108. https://doi.org/10.3390/catal11010108
Chicago/Turabian StyleMacQueen, Blake, Michael Royko, Bradie S. Crandall, Andreas Heyden, Yomaira J. Pagán-Torres, and Jochen Lauterbach. 2021. "Kinetics Study of the Hydrodeoxygenation of Xylitol over a ReOx-Pd/CeO2 Catalyst" Catalysts 11, no. 1: 108. https://doi.org/10.3390/catal11010108
APA StyleMacQueen, B., Royko, M., Crandall, B. S., Heyden, A., Pagán-Torres, Y. J., & Lauterbach, J. (2021). Kinetics Study of the Hydrodeoxygenation of Xylitol over a ReOx-Pd/CeO2 Catalyst. Catalysts, 11(1), 108. https://doi.org/10.3390/catal11010108