Influence of Biochar Composition and Source Material on Catalytic Performance: The Carboxylation of Glycerol with CO2 as a Case Study


Abstract
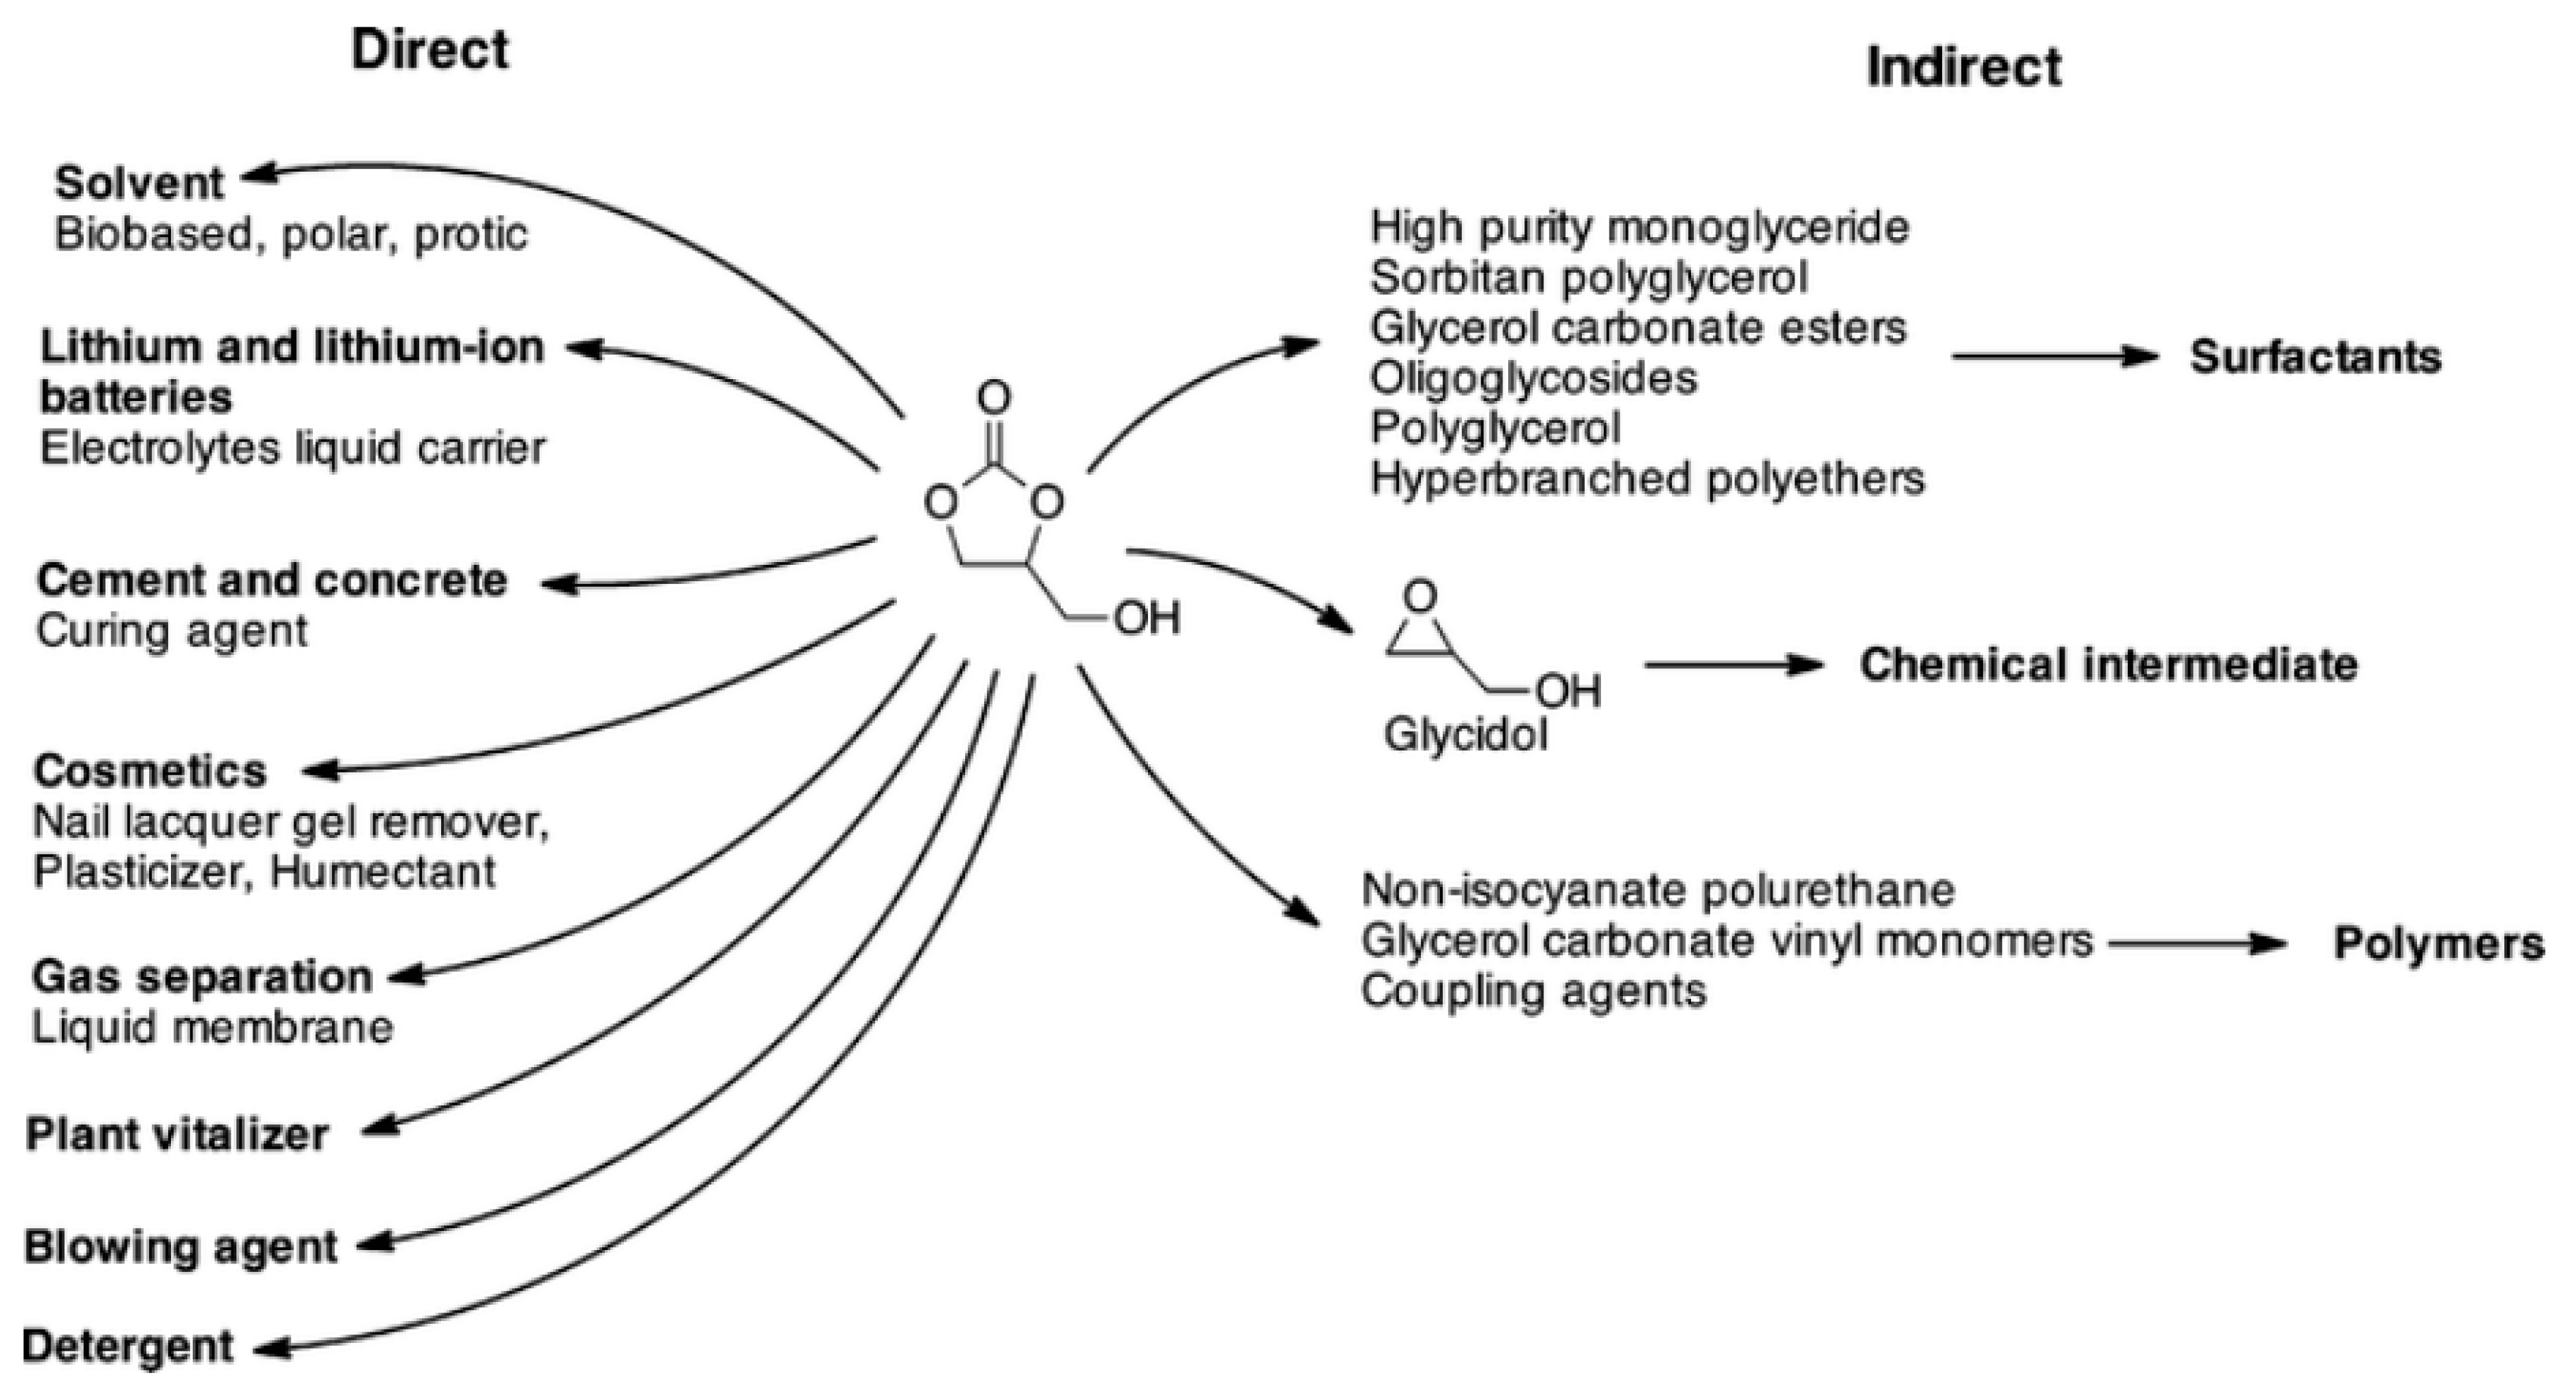
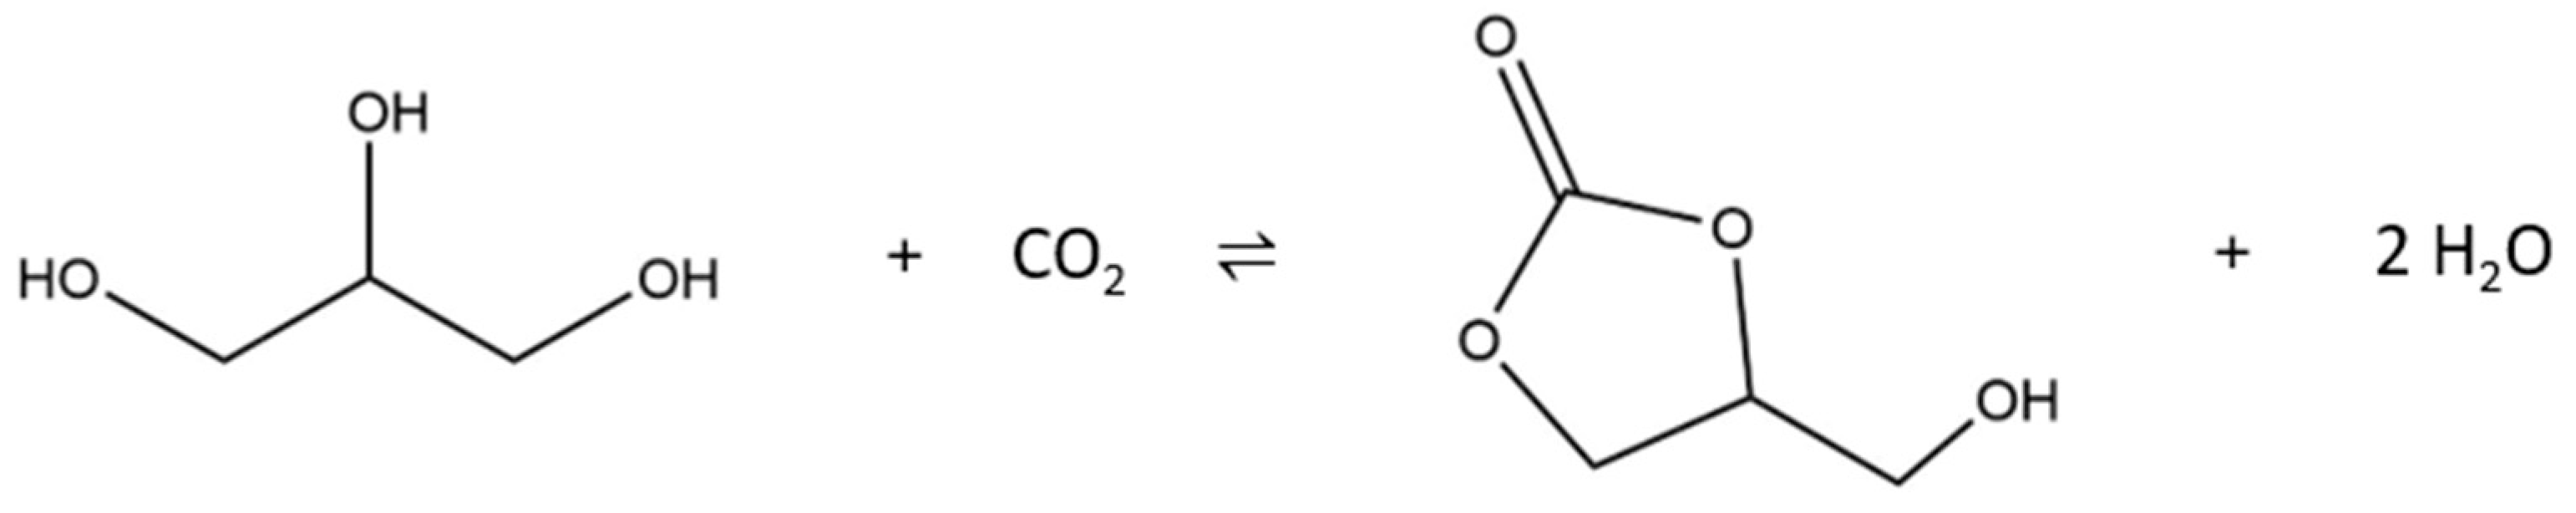
1. Introduction
2. Results
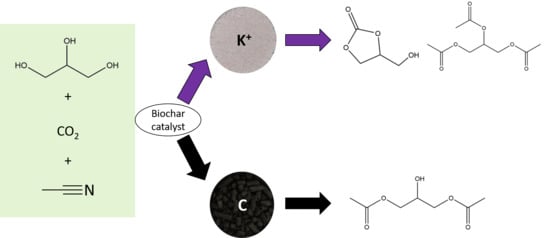
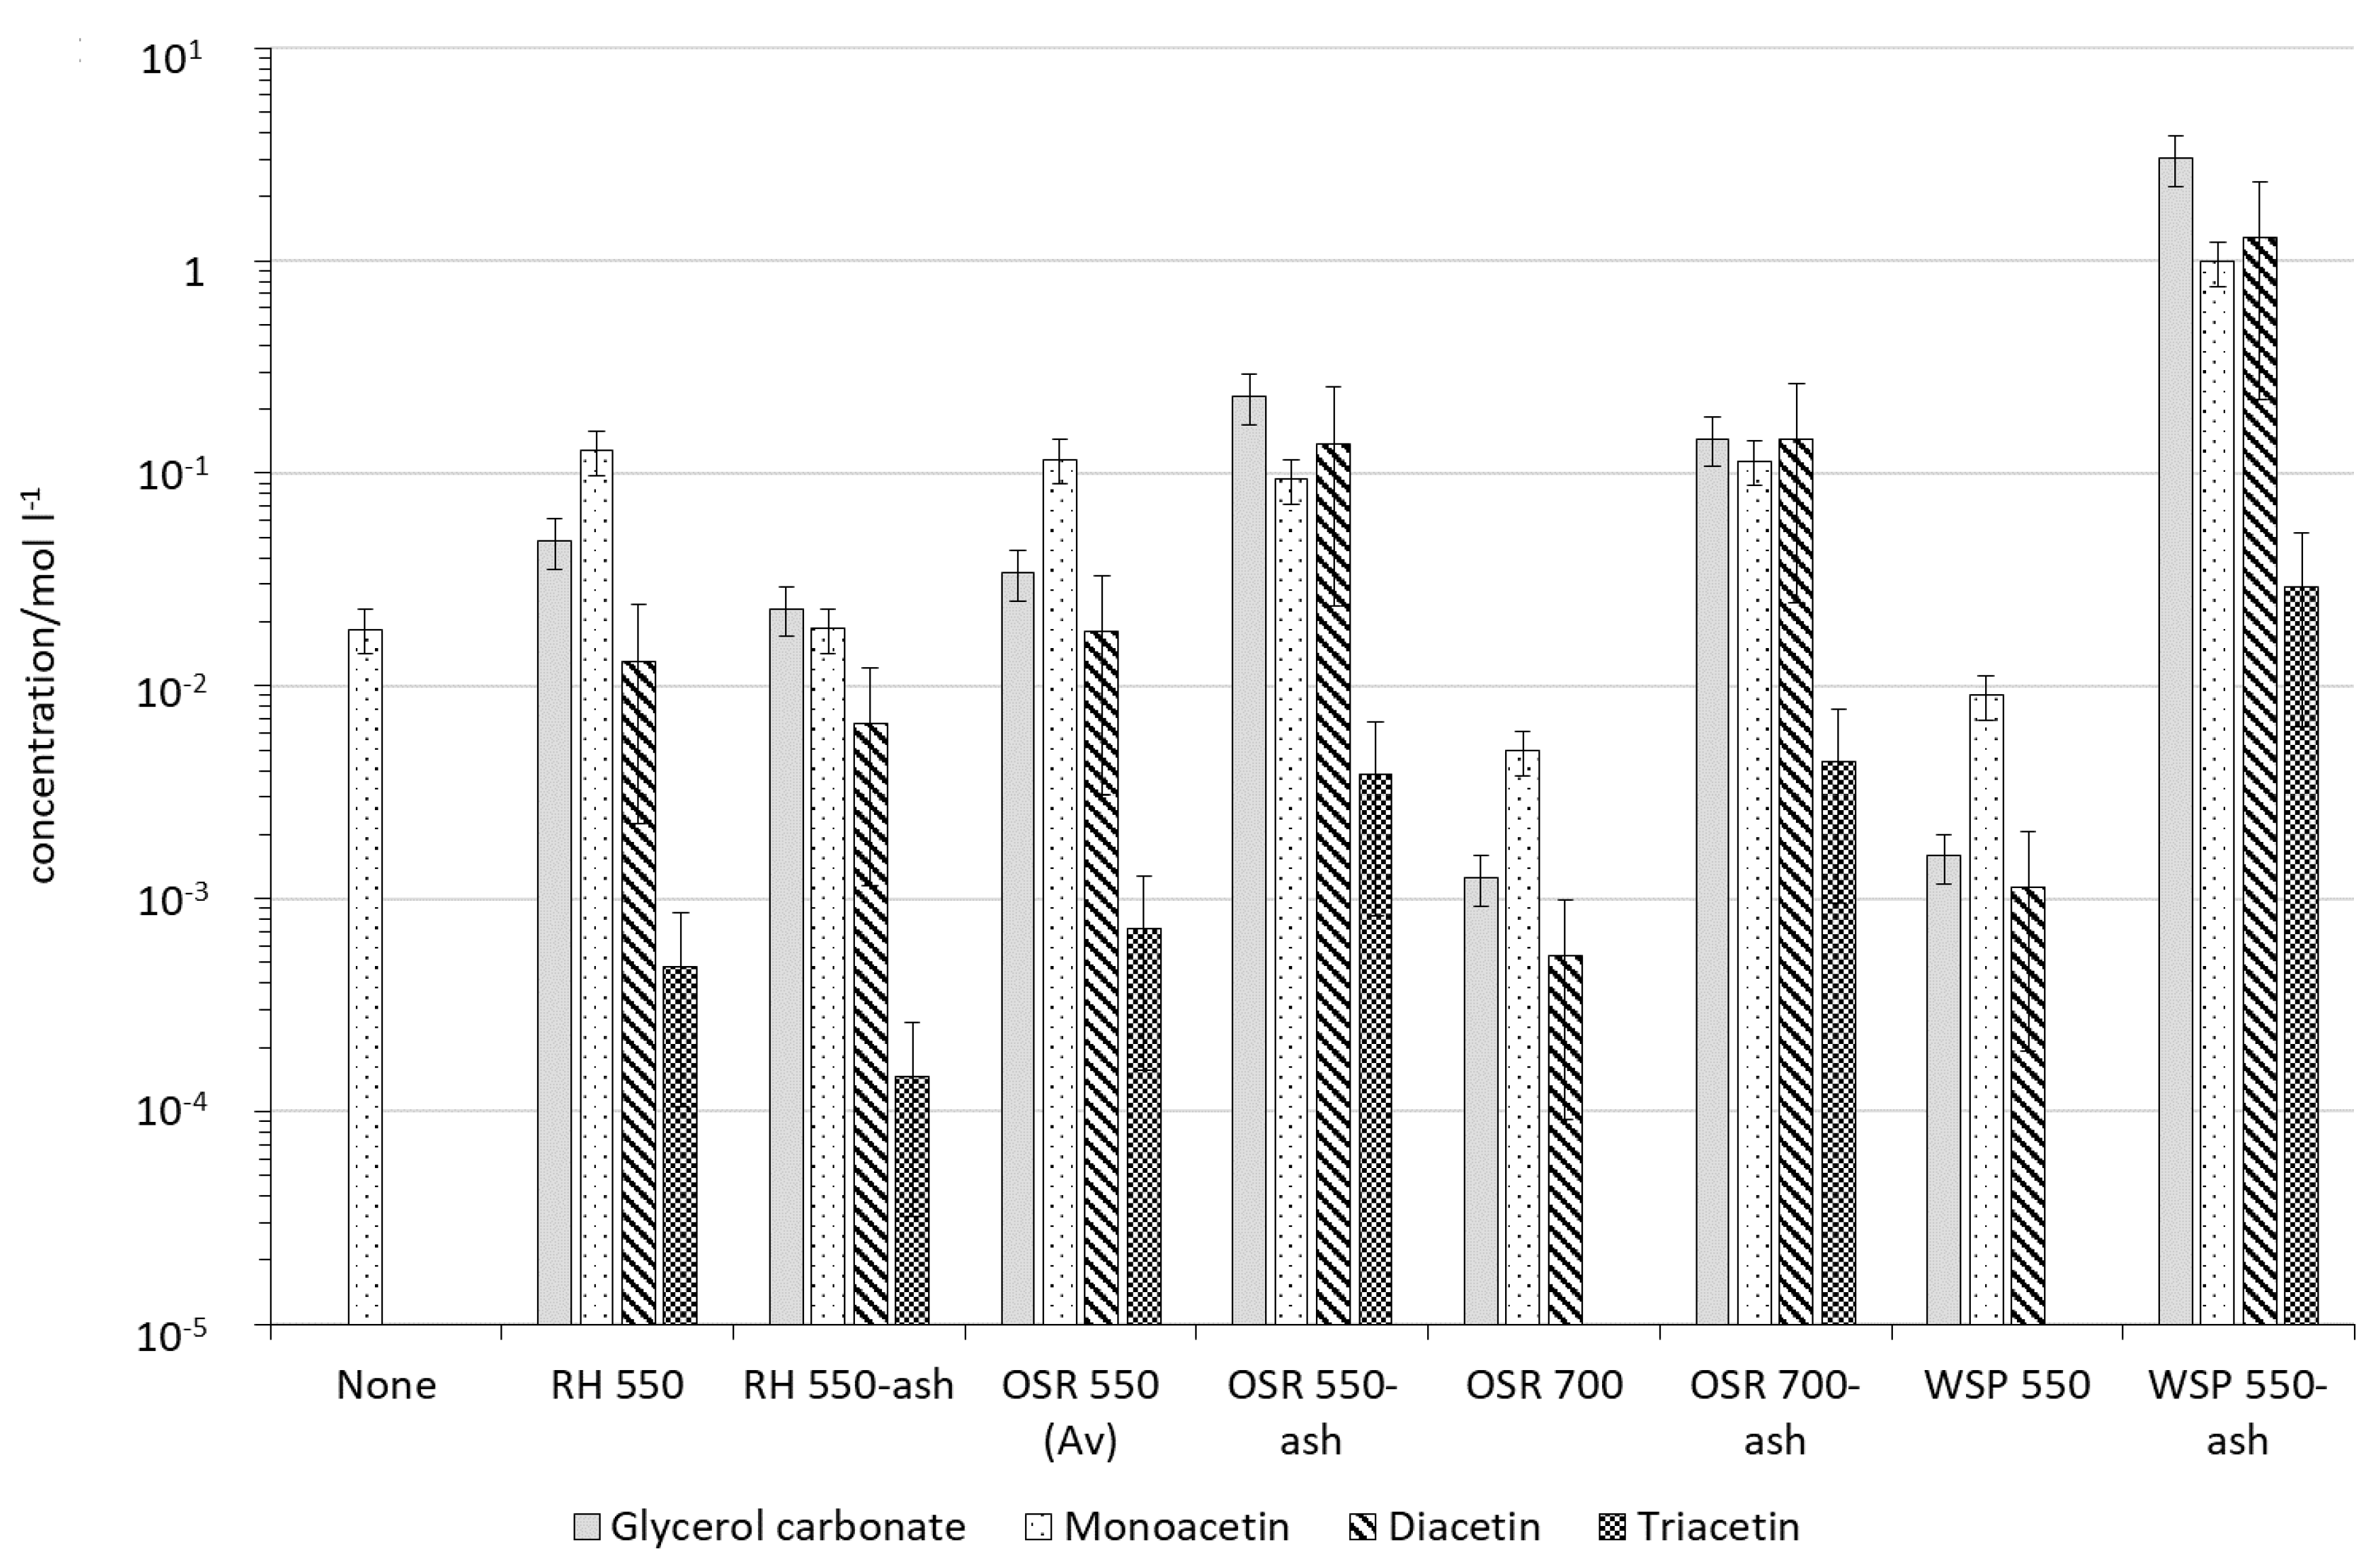
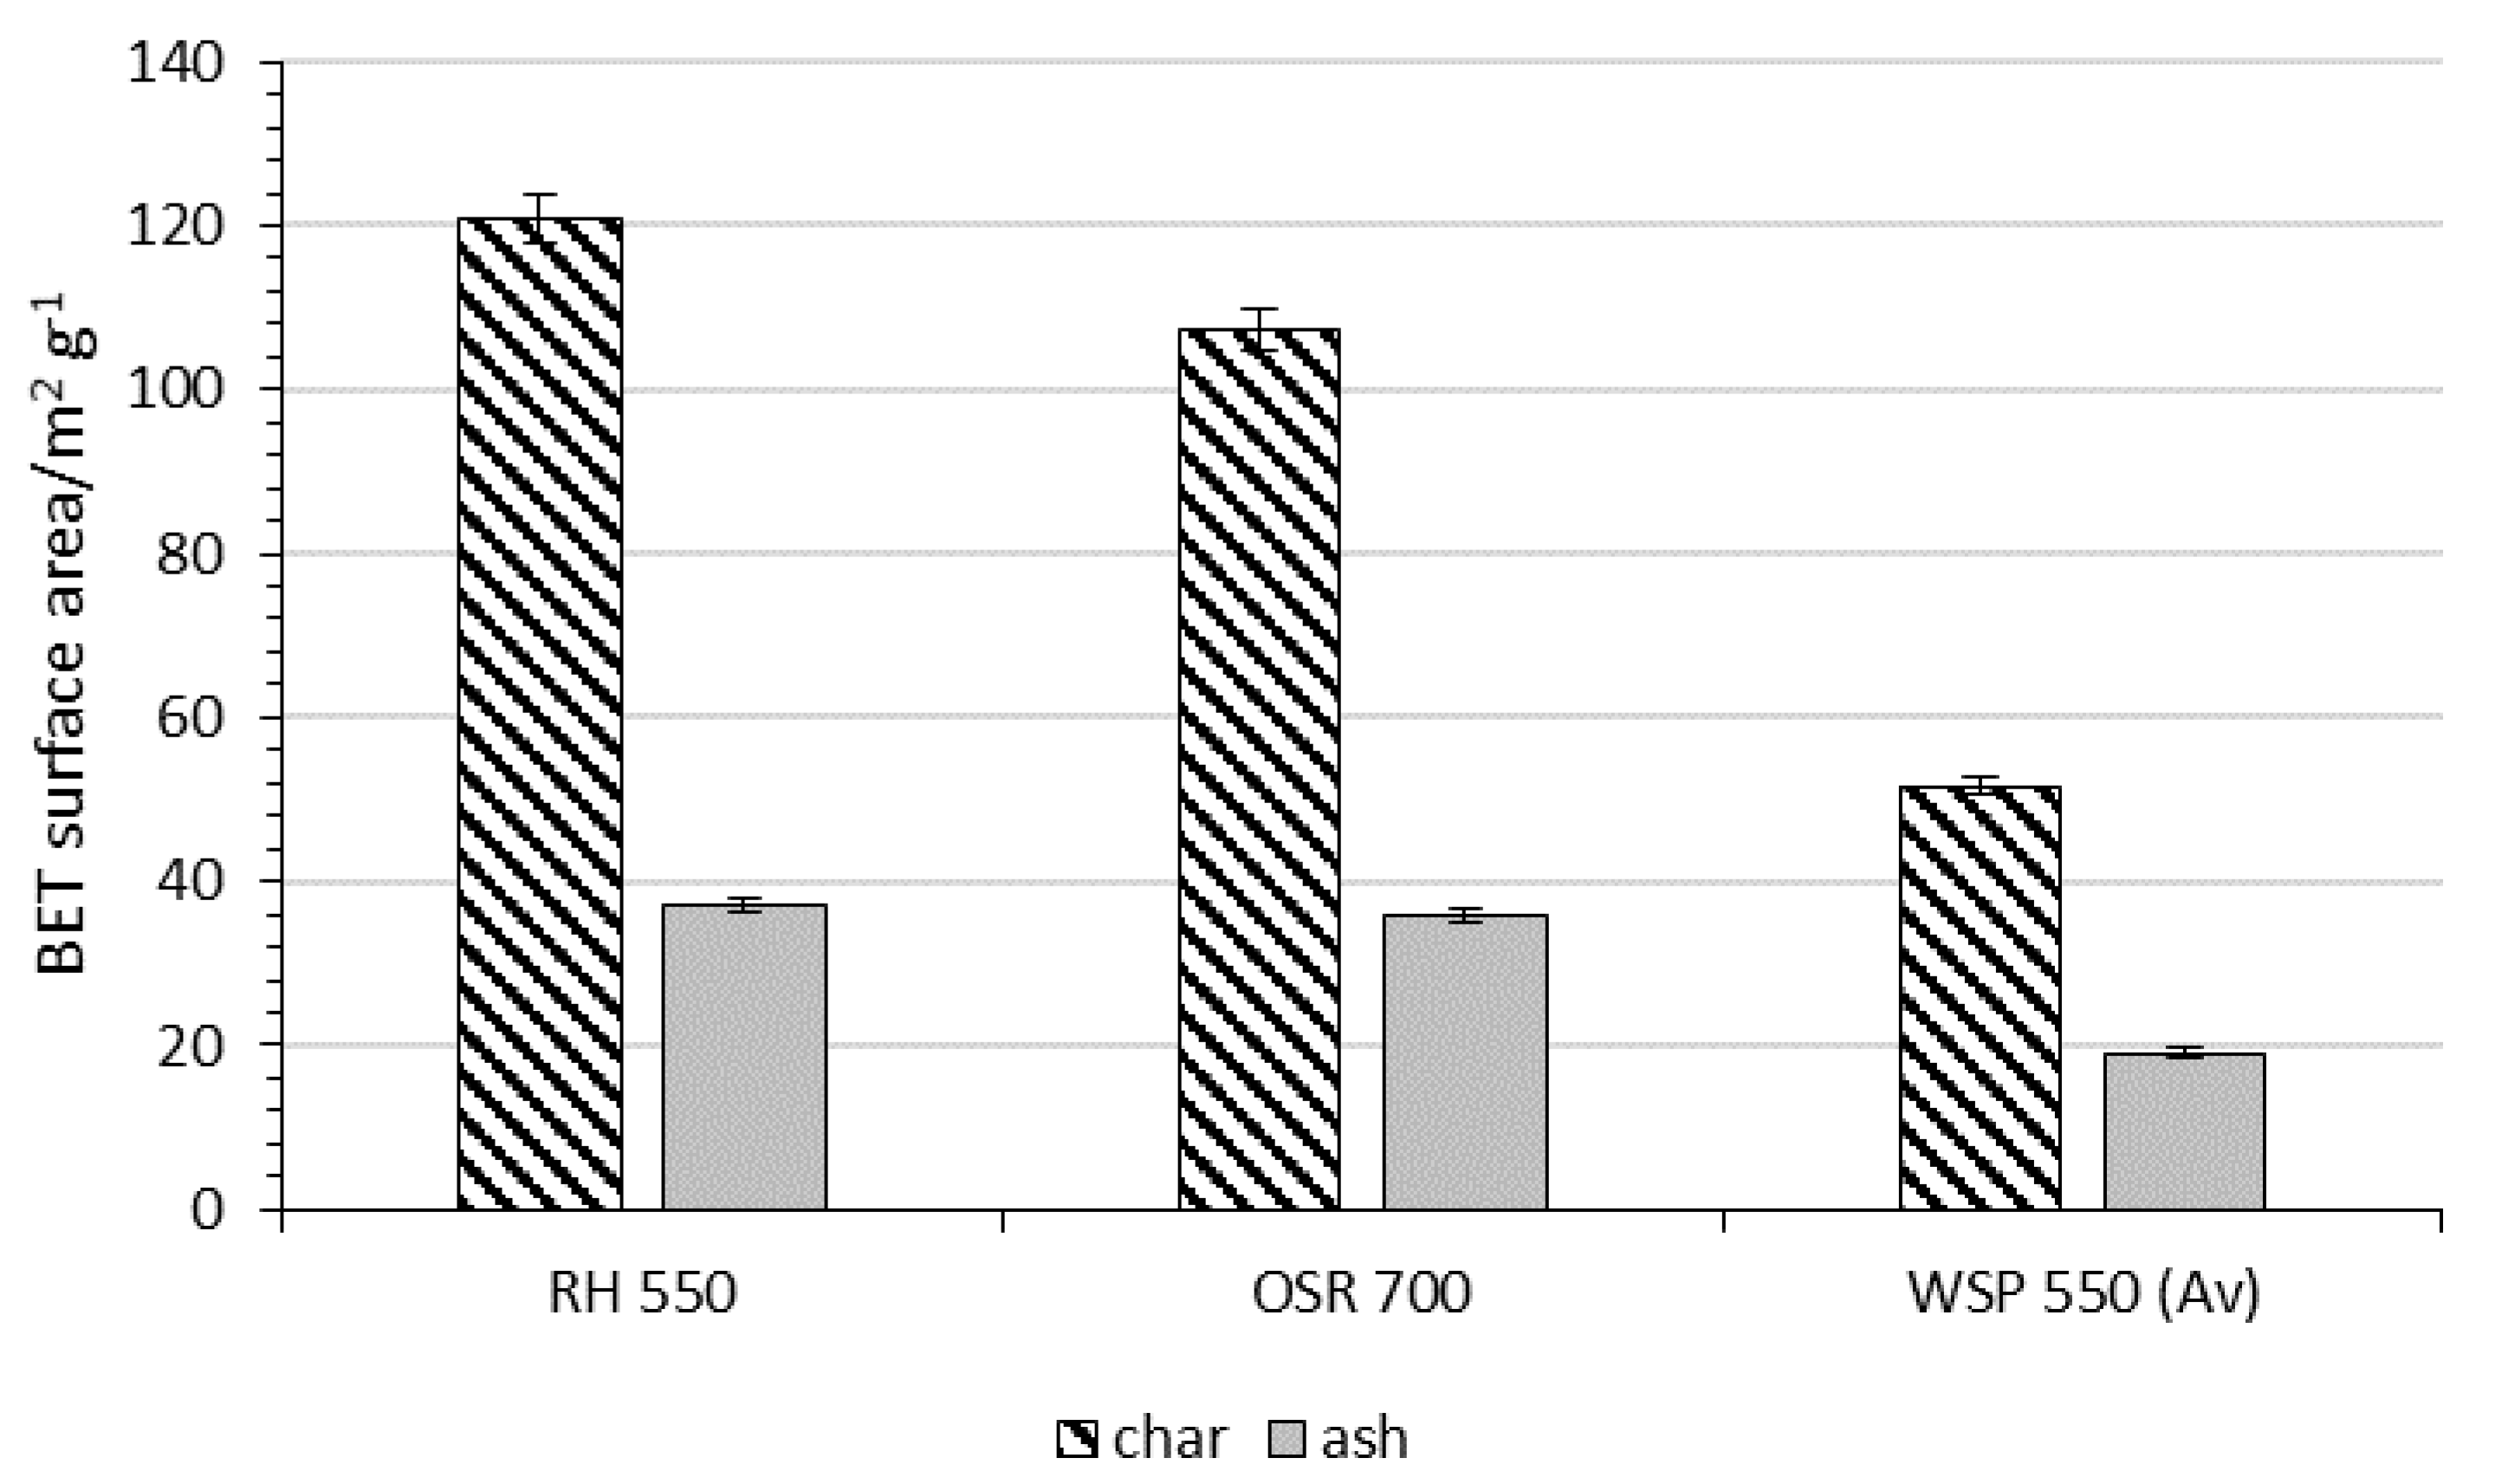
2.1. Characterisation and Activity of Untreated Biochar: Influence of Ash Content
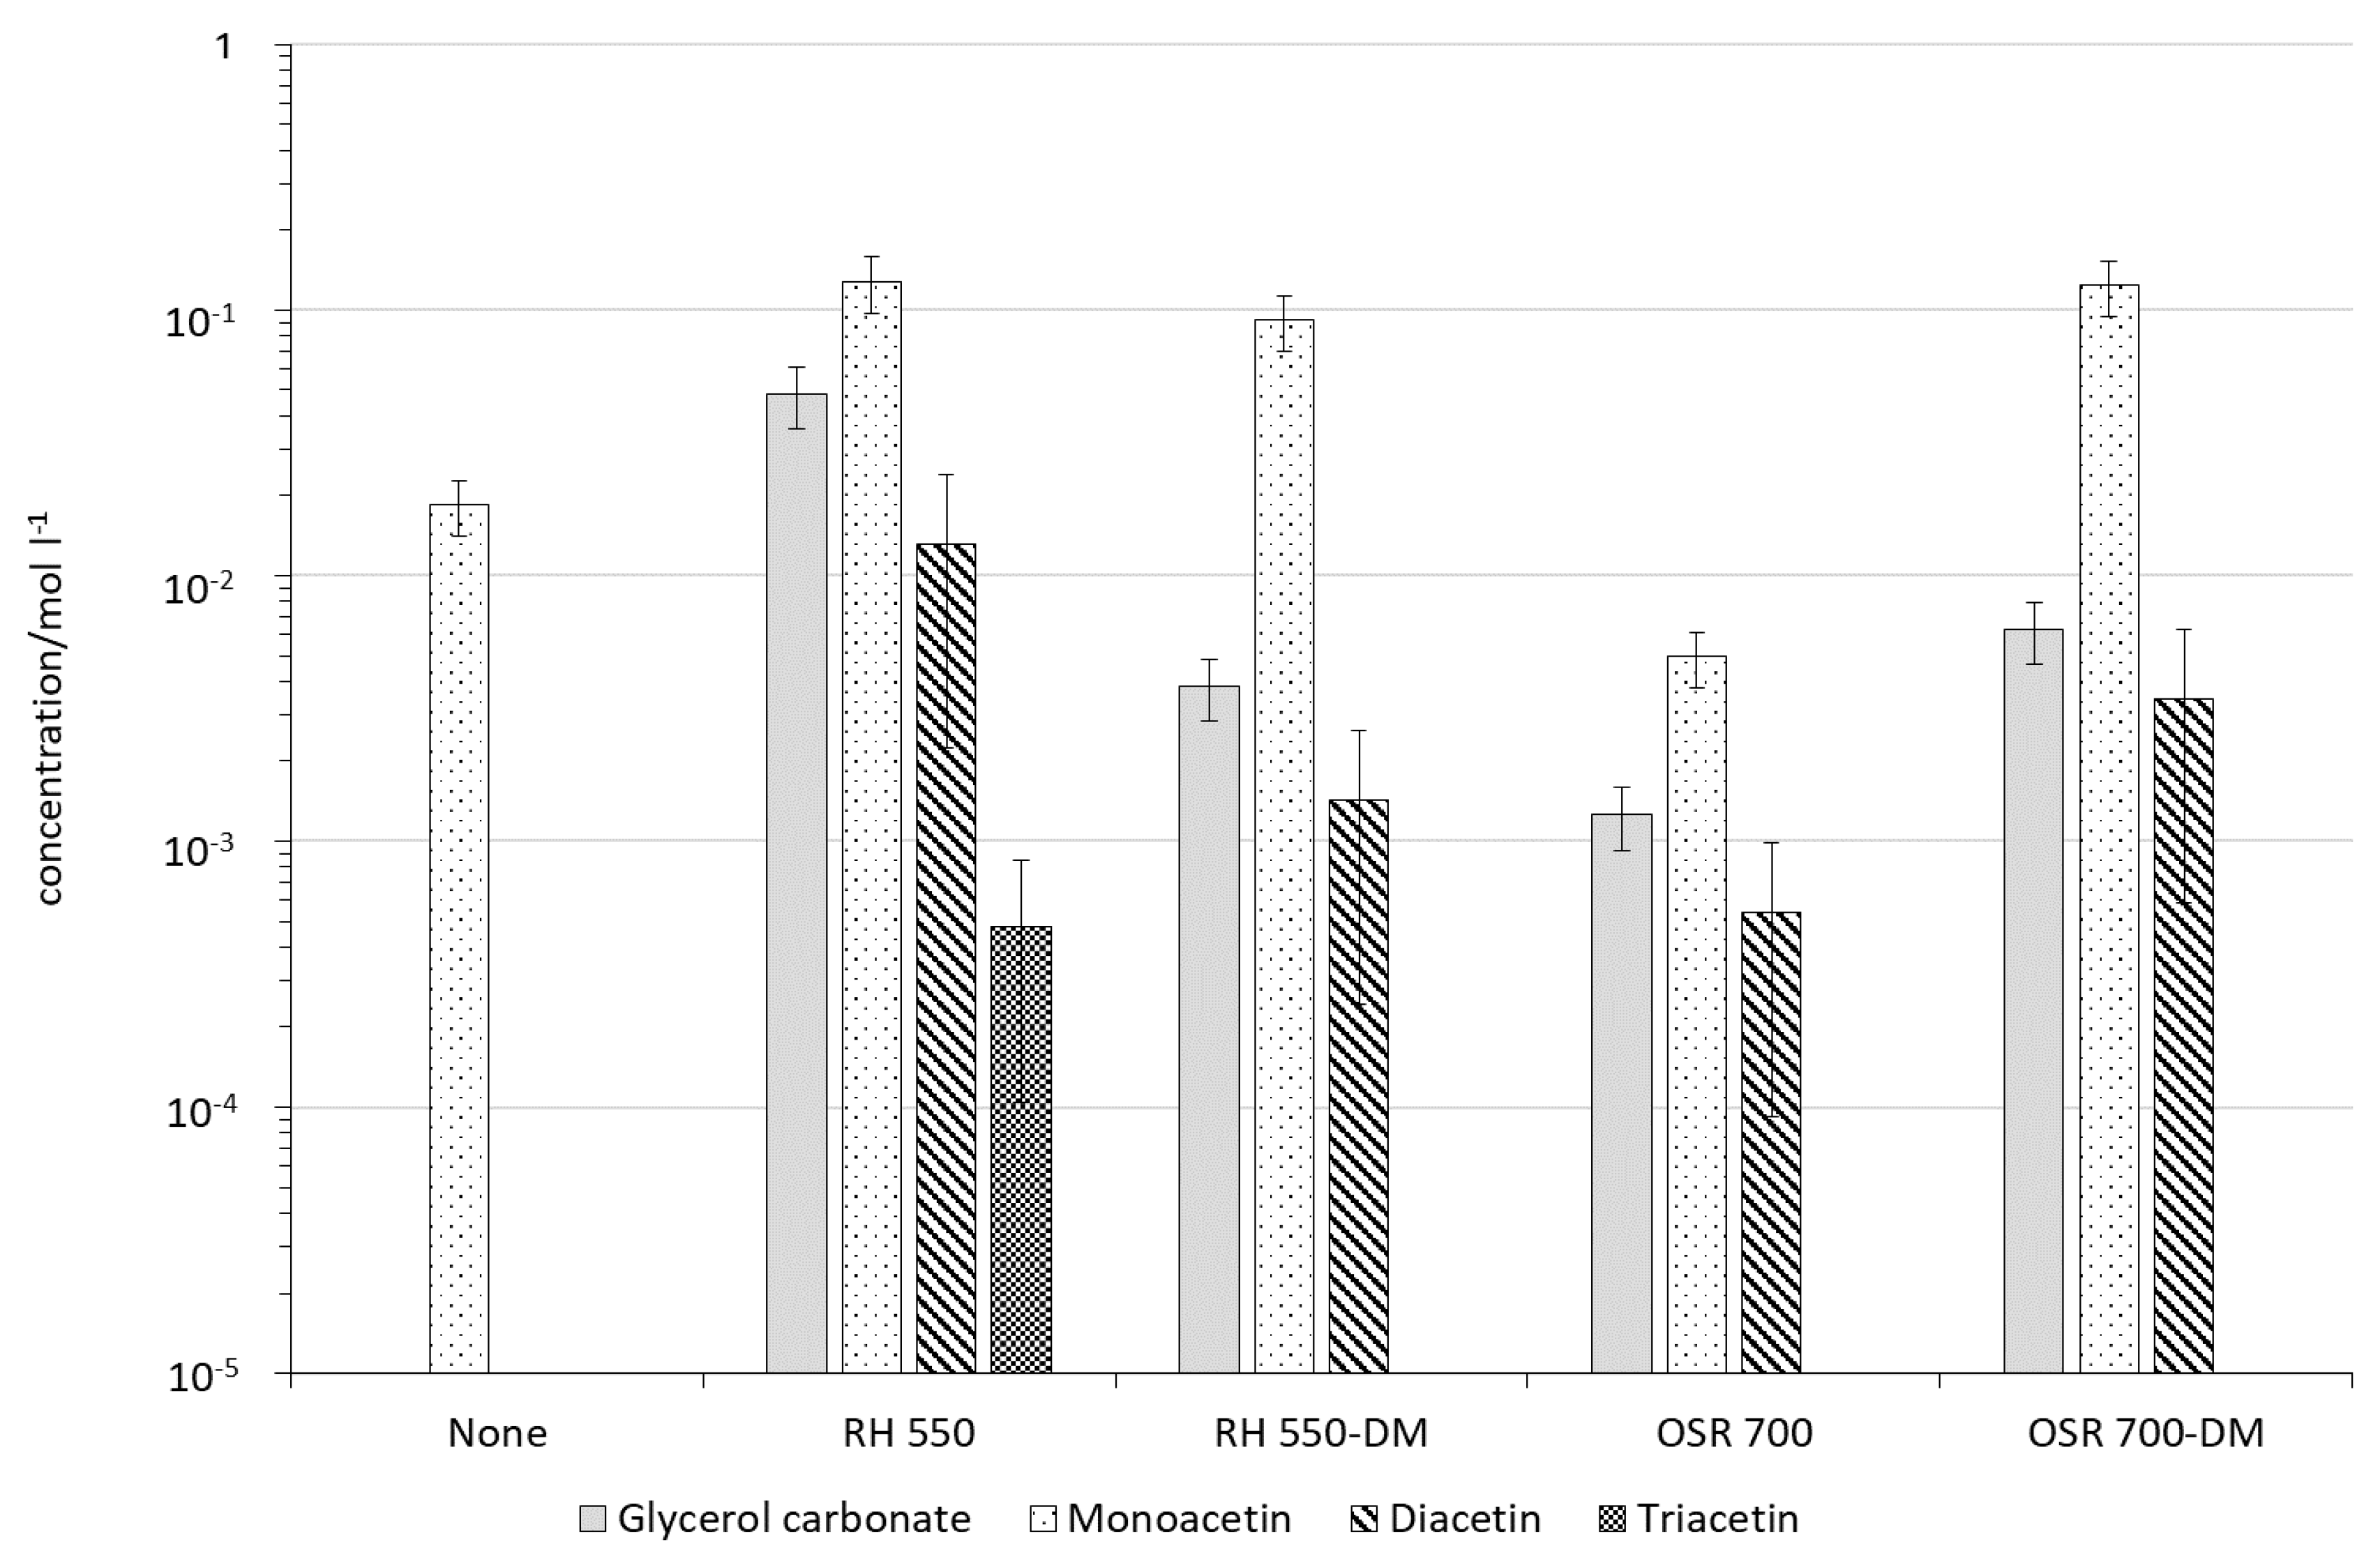
2.2. Role of Carbon
2.3. Influence of Ash Content on Catalytic Activity of Biochar
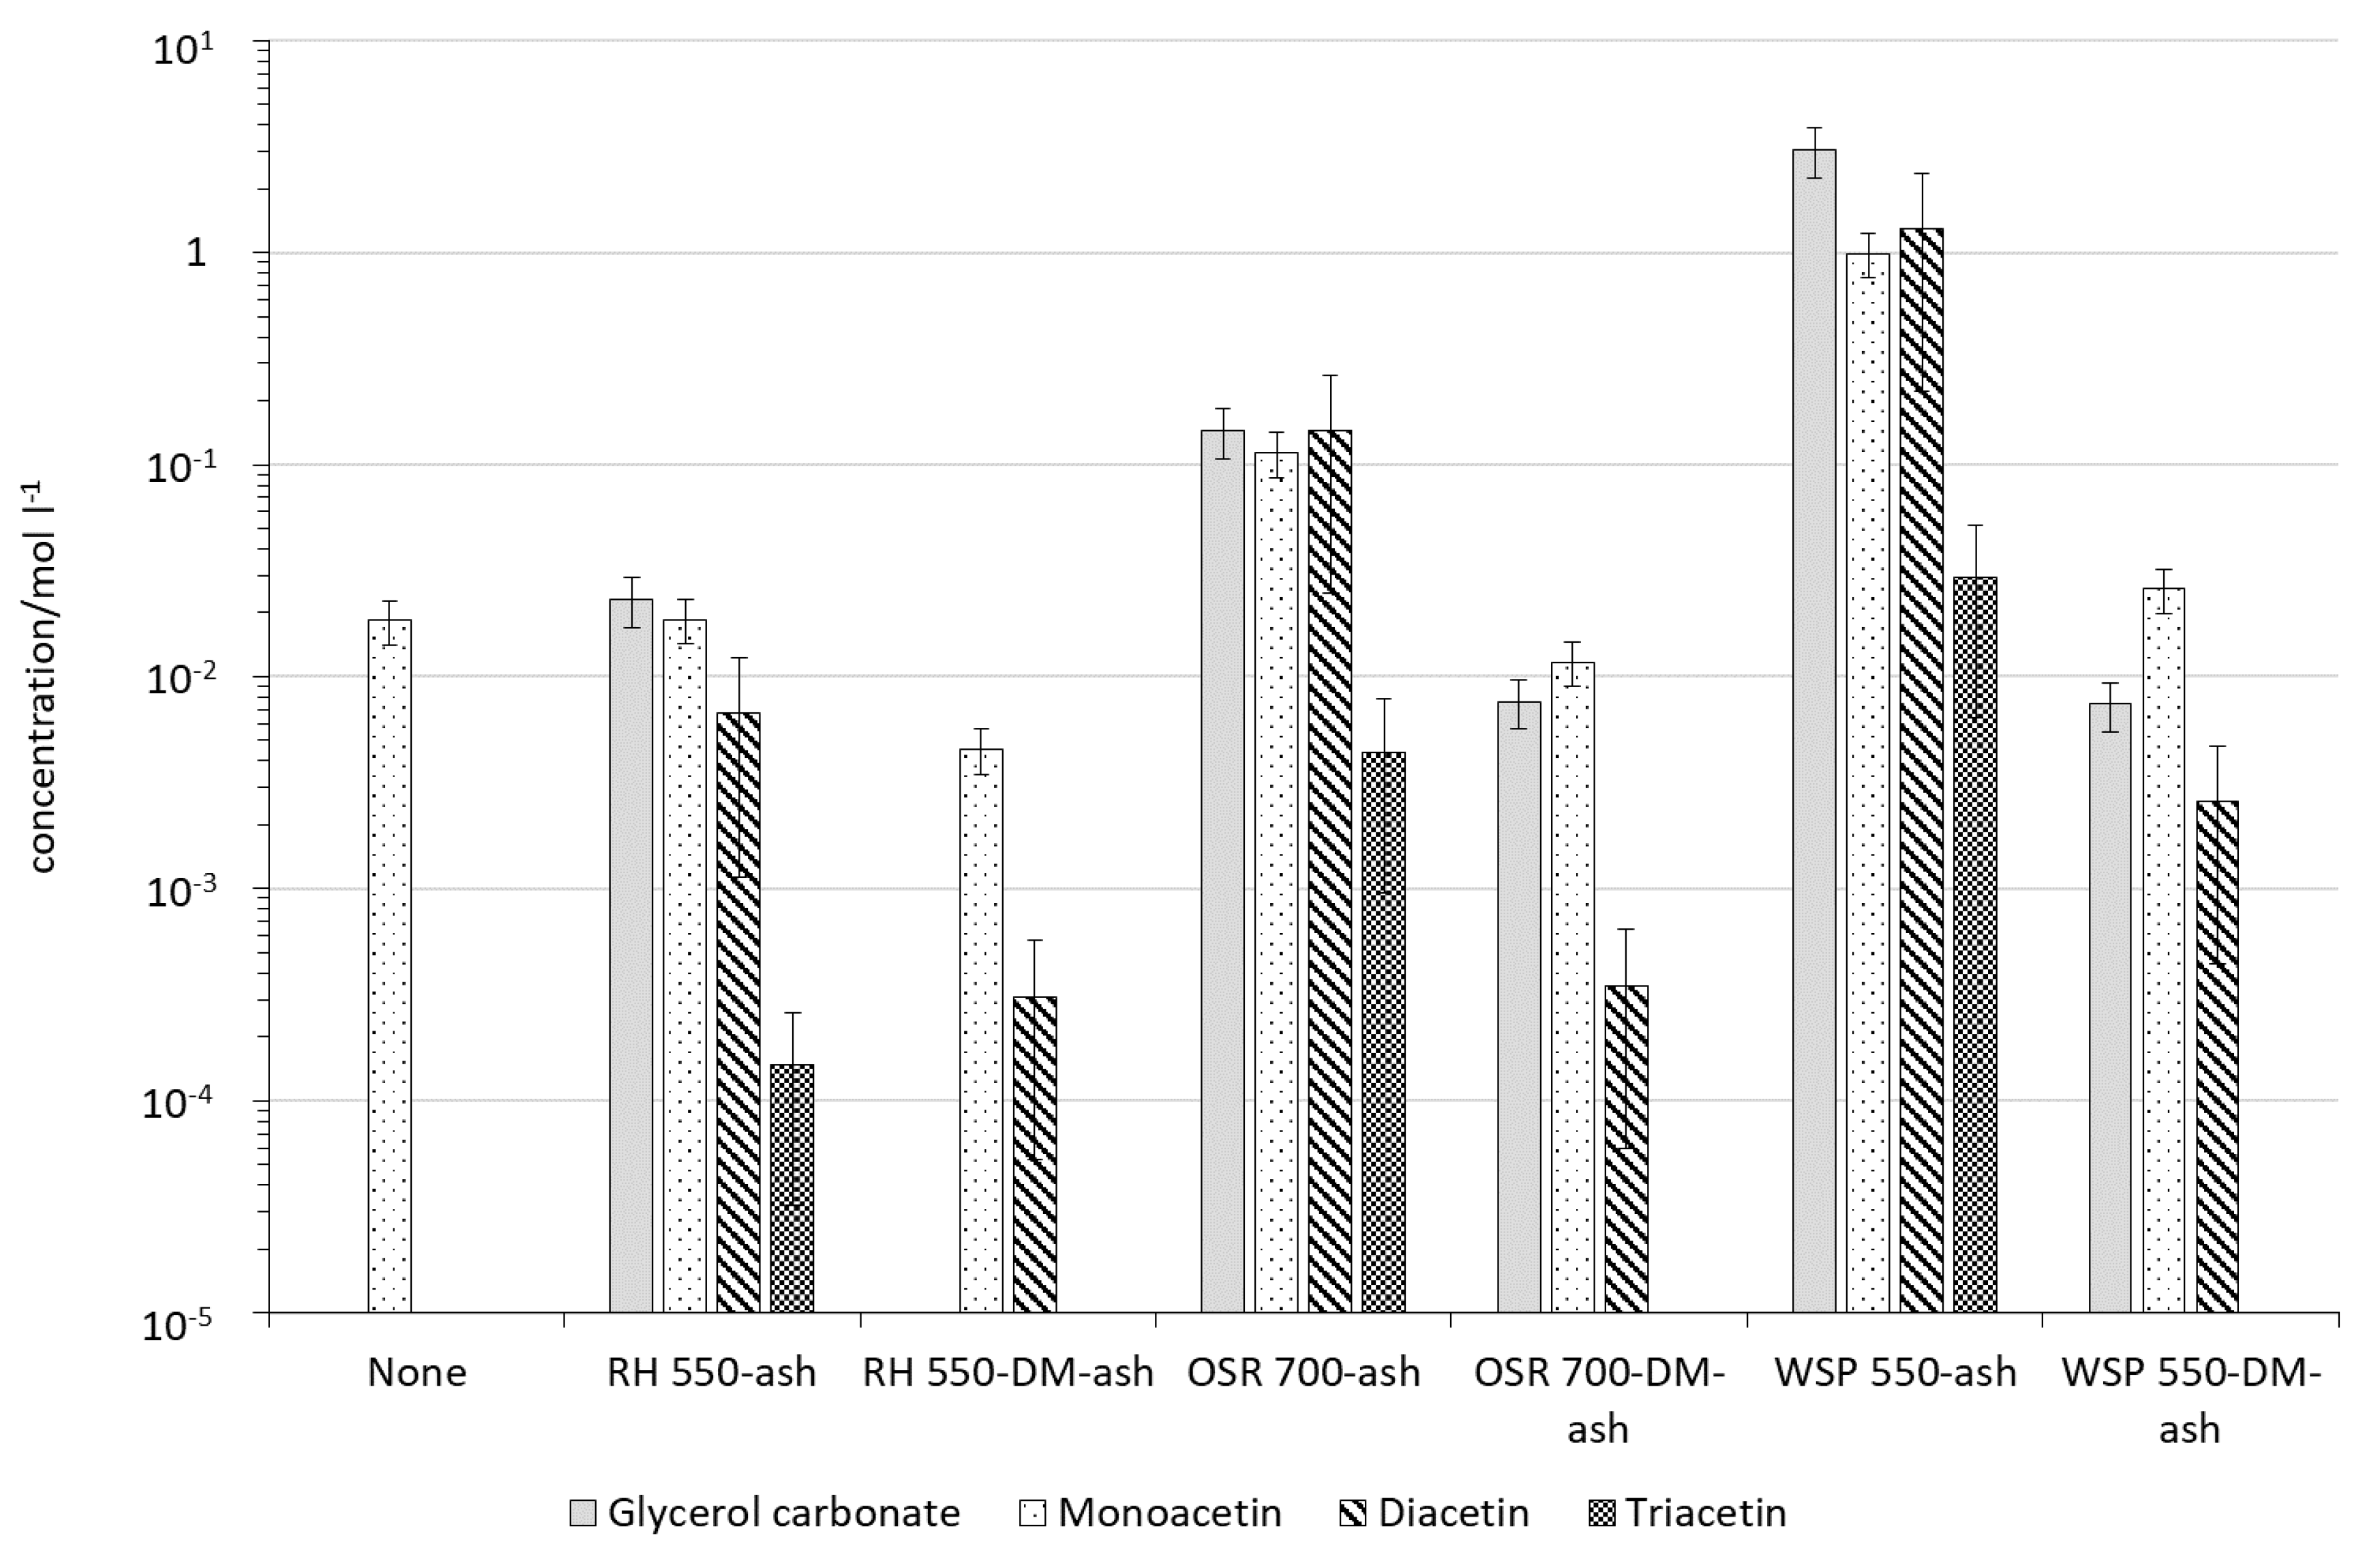
2.4. Characterisation and Activity of Treated Biochar Ash
3. Discussion
4. Materials and Methods
4.1. Materials
4.2. Sample Preparation
4.3. Characterisation Methods
4.4. Reaction Methods
5. Conclusions
Supplementary Materials
Author Contributions
Funding
Conflicts of Interest
References
- LMC. Glycerine Report; IHS, Oleoline; LMC: Oxford, UK, 2018. [Google Scholar]
- Sonnati, M.O.; Amigoni, S.; Taffin de Givenchy, E.P.; Darmanin, T.; Choulet, O.; Guittard, F. Glycerol carbonate as a versatile building block for tomorrow: Synthesis, reactivity, properties and applications. Green Chem. 2013, 15, 283–306. [Google Scholar] [CrossRef]
- Pagliaro, M.; Ciriminna, R.; Kimura, H.; Rossi, M.; Della Pina, C. From Glycerol to Value-Added Products. Angew. Chem. 2007, 38. [Google Scholar] [CrossRef]
- Aresta, M.; Dibenedetto, A.; Fuji, Y.; Yamashita, H.; Koyano, K.; Tatsumi, K.T.; Schubert, G.; Fouassier, M.; Chupova, I.A.; Domen, K.; et al. Utilisation of CO2 as a chemical feedstock: Opportunities and challenges. Dalt. Trans. 2007, 98, 2975. [Google Scholar] [CrossRef] [PubMed]
- Li, H.; Gao, D.; Gao, P.; Wang, F.; Zhao, N.; Xiao, F.; Wei, W.; Sun, Y. The synthesis of glycerol carbonate from glycerol and CO2 over La2O2CO3–ZnO catalysts. Catal. Sci. Technol. 2013, 3, 2801. [Google Scholar] [CrossRef]
- Li, H.; Jiao, X.; Li, L.; Zhao, N.; Xiao, F.; Wei, W.; Sun, Y.; Zhang, B. Synthesis of glycerol carbonate by direct carbonylation of glycerol with CO2 over solid catalysts derived from Zn/Al/La and Zn/Al/La/M (M = Li, Mg and Zr) hydrotalcites. Catal. Sci. Technol. 2015, 5, 989–1005. [Google Scholar] [CrossRef]
- Razali, N. The Synthesis of Glycerol Carbonate from Glycerol and Carbon Dioxide over Heterogeneous Catalysts. Ph.D. Thesis, University of Sheffield, Sheffield, UK, 2017. [Google Scholar]
- Kong, P.S.; Aroua, M.K.; Daud, W.M.A.W.; Lee, H.V.; Cognet, P.; Pérès, Y. Catalytic role of solid acid catalysts in glycerol acetylation for the production of bio-additives: A review. RSC Adv. 2016, 6, 68885–68905. [Google Scholar] [CrossRef]
- Sandesh, S.; Manjunathan, P.; Halgeri, A.B.; Shanbhag, G.V. Glycerol acetins: Fuel additive synthesis by acetylation and esterification of glycerol using cesium phosphotungstate catalyst. RSC Adv. 2015, 5, 104354–104362. [Google Scholar] [CrossRef]
- Konwar, L.J.; Mäki-Arvela, P.; Begum, P.; Kumar, N.; Thakur, A.J.; Mikkola, J.-P.; Deka, R.C.; Deka, D. Shape selectivity and acidity effects in glycerol acetylation with acetic anhydride: Selective synthesis of triacetin over Y-zeolite and sulfonated mesoporous carbons. J. Catal. 2015, 329, 237–247. [Google Scholar] [CrossRef]
- Algoufi, Y.T.; Hameed, B.H. Synthesis of glycerol carbonate by transesterification of glycerol with dimethyl carbonate over K-zeolite derived from coal fly ash. Fuel Process. Technol. 2014, 126, 5–11. [Google Scholar] [CrossRef]
- Ozorio, L.P.; Pianzolli, R.; da Cruz Machado, L.; Miranda, J.L.; Turci, C.C.; Guerra, A.C.O.; Souza-Aguiar, E.F.; Mota, C.J.A. Metal-impregnated zeolite Y as efficient catalyst for the direct carbonation of glycerol with CO2. Appl. Catal. A Gen. 2015, 504, 187–191. [Google Scholar] [CrossRef]
- Razali, N.A.; Conte, M.; McGregor, J. The role of impurities in the La2O3 catalysed carboxylation of crude glycerol. Catal. Lett. 2019, 149, 1403–1414. [Google Scholar] [CrossRef]
- Indran, V.P.; Syuhada Zuhaimi, N.A.; Deraman, M.A.; Maniam, G.P.; Yusoff, M.M.; Yun Hin, T.-Y.; Ab Rahim, M.H. An accelerated route of glycerol carbonate formation from glycerol using waste boiler ash as catalyst. RSC Adv. 2014, 4, 25257–25267. [Google Scholar] [CrossRef]
- Ahmad, M.; Rajapaksha, A.U.; Lim, J.E.; Zhang, M.; Bolan, N.; Mohan, D.; Vithanage, M.; Lee, S.S.; Ok, Y.S. Biochar as a sorbent for contaminant management in soil and water: A review. Chemosphere 2014, 99. [Google Scholar] [CrossRef] [PubMed]
- Hernandez-Mena, L.E.; Pecora, A.B.; Beraldo, A.L. Slow pyrolysis of bamboo biomass: Analysis of biochar properties. Chem. Eng. Trans. 2014, 37, 115–120. [Google Scholar] [CrossRef]
- Klinghoffer, N.B.; Castaldi, M.J.; Nzihou, A. Influence of char composition and inorganics on catalytic activity of char from biomass gasification. Fuel 2015, 157, 37–47. [Google Scholar] [CrossRef]
- Davies, G.; El Sheikh, A.; Collett, C.; Yakub, I.; McGregor, J. Catalytic Carbon Materials from Biomass. In Emerging Carbon Materials for Catalysis; Sadjadi, S., Ed.; Elsevier: Amsterdam, The Netherlands, 2020. [Google Scholar]
- Abdullah, S.H.Y.S.; Hanapi, N.H.M.; Azid, A.; Umar, R.; Juahir, H.; Khatoon, H.; Endut, A. A review of biomass-derived heterogeneous catalyst for a sustainable biodiesel production. Renew. Sustain. Energy Rev. 2017, 70, 1040–1051. [Google Scholar] [CrossRef]
- Lee, J.; Kim, K.H.; Kwon, E.E. Biochar as a Catalyst. Renew. Sustain. Energy Rev. 2017, 77, 70–79. [Google Scholar] [CrossRef]
- Cao, X.; Sun, S.; Sun, R. Application of biochar-based catalysts in biomass upgrading: A review. RSC Adv. 2017, 7, 48793–48805. [Google Scholar] [CrossRef]
- Wang, L.; Ok, Y.S.; Tsang, D.C.W.; Alessi, D.S.; Rinklebe, J.; Wang, H.; Mašek, O.; Hou, R.; O’Connor, D.; Hou, D. New trends in biochar pyrolysis and modification strategies: Feedstock, pyrolysis conditions, sustainability concerns and implications for soil amendment. Soil Use Manag. 2020, 36, 358–386. [Google Scholar] [CrossRef]
- Zhao, L.; Cao, X.; Masek, O.; Zimmerman, A. Heterogeneity of biochar properties as a function of feedstock and production temperatures. J. Hazard. Mater. 2013, 256–257, 1–9. [Google Scholar] [CrossRef]
- Manyà, J.J. Pyrolysis for Biochar Purposes: A Review to Establish Current Knowledge Gaps and Research Needs. Environ. Sci. Technol. 2012, 46, 7939–7954. [Google Scholar] [CrossRef]
- Jindo, K.; Mizumoto, H.; Sawada, Y.; Sanchez-Monedero, M.A.; Sonoki, T. Physical and chemical characterization of biochars derived from different agricultural residues. Biogeosciences 2014, 11, 6613–6621. [Google Scholar] [CrossRef]
- Titirici, M.-M.; White, R.J.; Brun, N.; Budarin, V.L.; Su, D.S.; del Monte, F.; Clark, J.H.; MacLachlan, M.J. Sustainable carbon materials. Chem. Soc. Rev. 2015, 44, 250–290. [Google Scholar] [CrossRef]
- Zhao, Y.; Feng, D.; Zhang, Y.; Huang, Y.; Sun, S. Effect of pyrolysis temperature on char structure and chemical speciation of alkali and alkaline earth metallic species in biochar. Fuel Process. Technol. 2016, 141, 54–60. [Google Scholar] [CrossRef]
- Asadullah, M.; Zhang, S.; Min, Z.; Yimsiri, P.; Li, C.-Z. Effects of biomass char structure on its gasification reactivity. Bioresour. Technol. 2010, 101, 7935–7943. [Google Scholar] [CrossRef]
- Bachmann, H.J.; Bucheli, T.D.; Dieguez-Alonso, A.; Fabbri, D.; Knicker, H.; Schmidt, H.-P.; Ulbricht, A.; Becker, R.; Buscaroli, A.; Buerge, D.; et al. Toward the Standardization of Biochar Analysis: The COST Action TD1107 Interlaboratory Comparison. J. Agric. Food Chem. 2016, 64, 513–527. [Google Scholar] [CrossRef]
- Crombie, K.; Mašek, O.; Cross, A.; Sohi, S. Biochar-synergies and trade-offs between soil enhancing properties and C sequestration potential. GCB Bioenergy 2015, 7, 1161–1175. [Google Scholar] [CrossRef]
- Brewer, C.E.; Unger, R.; Schmidt-Rohr, K.; Brown, R.C. Criteria to Select Biochars for Field Studies based on Biochar Chemical Properties. Bioenergy Res. 2011, 4, 312–323. [Google Scholar] [CrossRef]
- Abu El-Rub, Z.; Bramer, E.A.; Brem, G. Experimental comparison of biomass chars with other catalysts for tar reduction. Fuel 2008, 87, 2243–2252. [Google Scholar] [CrossRef]
- Dehkhoda, A.M.; West, A.H.; Ellis, N. Biochar based solid acid catalyst for biodiesel production. Appl. Catal. A Gen. 2010, 382, 197–204. [Google Scholar] [CrossRef]
- Kastner, J.R.; Miller, J.; Geller, D.P.; Locklin, J.; Keith, L.H.; Johnson, T. Catalytic esterification of fatty acids using solid acid catalysts generated from biochar and activated carbon. Catal. Today 2012, 190, 122–132. [Google Scholar] [CrossRef]
- Moussavi, G.; Khosravi, R. Preparation and characterization of a biochar from pistachio hull biomass and its catalytic potential for ozonation of water recalcitrant contaminants. Bioresour. Technol. 2012, 119, 66–71. [Google Scholar] [CrossRef] [PubMed]
- Ormsby, R.; Kastner, J.R.; Miller, J. Hemicellulose hydrolysis using solid acid catalysts generated from biochar. Catal. Today 2012, 190, 89–97. [Google Scholar] [CrossRef]
- Rafi, J.M.; Rajashekar, A.; Srinivas, M.; Rao, B.V.S.K.; Prasad, R.B.N.; Lingaiah, N. Esterification of glycerol over a solid acid biochar catalyst derived from waste biomass. RSC Adv. 2015, 5, 44550–44556. [Google Scholar] [CrossRef]
- Shen, Y.; Zhao, P.; Shao, Q.; Ma, D.; Takahashi, F.; Yoshikawa, K. In-situ catalytic conversion of tar using rice husk char-supported nickel-iron catalysts for biomass pyrolysis/gasification. Appl. Catal. B Environ. 2014, 152, 140–151. [Google Scholar] [CrossRef]
- Wang, F.J.; Zhang, S.; Chen, Z.D.; Liu, C.; Wang, Y.G. Tar reforming using char as catalyst during pyrolysis and gasification of Shengli brown coal. J. Anal. Appl. Pyrolysis 2014, 105. [Google Scholar] [CrossRef]
- Yu, J.T.; Dehkhoda, A.M.; Ellis, N. Development of Biochar-based Catalyst for Transesterification of Canola Oil. Energy Fuels 2011, 25, 337–344. [Google Scholar] [CrossRef]
- Shen, B.; Chen, J.; Yue, S.; Li, G. A comparative study of modified cotton biochar and activated carbon based catalysts in low temperature SCR. Fuel 2015, 156, 47–53. [Google Scholar] [CrossRef]
- Bazargan, A.; Kostić, M.D.; Stamenković, O.S.; Veljković, V.B.; McKay, G. A calcium oxide-based catalyst derived from palm kernel shell gasification residues for biodiesel production. Fuel 2015, 150, 519–525. [Google Scholar] [CrossRef]
- Chakraborty, R.; Bepari, S.; Banerjee, A. Transesterification of soybean oil catalyzed by fly ash and egg shell derived solid catalysts. Chem. Eng. J. 2010, 165, 798–805. [Google Scholar] [CrossRef]
- Ofori-Boateng, C.; Lee, K.T. The potential of using cocoa pod husks as green solid base catalysts for the transesterification of soybean oil into biodiesel: Effects of biodiesel on engine performance. Chem. Eng. J. 2013, 220, 395–401. [Google Scholar] [CrossRef]
- Riadi, L.; Purwanto, E.; Kurniawan, H.; Oktaviana, R. Effect of Bio-based Catalyst in Biodiesel Synthesis. Procedia Chem. 2014, 9, 172–181. [Google Scholar] [CrossRef]
- Feng, D.; Zhang, Y.; Zhao, Y.; Sun, S.; Gao, J. Improvement and maintenance of biochar catalytic activity for in-situ biomass tar reforming during pyrolysis and H2O/CO2 gasification. Fuel Process. Technol. 2018, 172, 106–114. [Google Scholar] [CrossRef]
- Lisowski, P.; Colmenares, J.C.; Mašek, O.; Lisowski, W.; Lisovytskiy, D.; Kamińska, A.; Łomot, D. Dual Functionality of TiO2/Biochar Hybrid Materials: Photocatalytic Phenol Degradation in the Liquid Phase and Selective Oxidation of Methanol in the Gas Phase. ACS Sustain. Chem. Eng. 2017, 5, 6274–6287. [Google Scholar] [CrossRef]
- Indran, V.P.; Haji Saud, A.S.; Maniam, G.P.; Yusoff, M.M.; Taufiq-Yap, Y.H.; Rahim, M.H.A.; Alloin, F. Versatile boiler ash containing potassium silicate for the synthesis of organic carbonates. RSC Adv. 2016, 6, 34877–34884. [Google Scholar] [CrossRef]
- Paroo Indran, V.; Sajidah Haji Saud, A.; Pragas Maniam, G.; Hin Taufiq-Yap, Y.; Hasbi Ab Rahim, M. Viable Glycerol Carbonate Synthesis Through Direct Crude Glycerol Utilization from Biodiesel Industry. Waste Biomass Valorization 2017. [Google Scholar] [CrossRef]
- Nosyrev, I.E.; Gruber, R.; Cagniant, D.; Krzton, A.; Pajak, J.; Stefanova, M.D.; Grishchuk, S. DRIFT spectroscopic characterization of coal samples modified by chemical treatments. Fuel 1996, 75, 1549–1556. [Google Scholar] [CrossRef]
- Huo, C.-F.; Wu, B.-S.; Gao, P.; Yang, Y.; Li, Y.-W.; Jiao, H. The Mechanism of Potassium Promoter: Enhancing the Stability of Active Surfaces. Angew. Chem. Int. Ed. 2011, 50, 7403–7406. [Google Scholar] [CrossRef]
- Rokicki, G.; Rakoczy, P.; Parzuchowski, P.; Sobiecki, M. Hyperbranched aliphatic polyethers obtained from environmentally benign monomer: Glycerol carbonate. Green Chem. 2005, 7, 529–539. [Google Scholar] [CrossRef]
- Gómez-Jiménez-Aberasturi, O.; Ochoa-Gómez, J.R.; Pesquera-Rodríguez, A.; Ramírez-López, C.; Alonso-Vicario, A.; Torrecilla-Soria, J. Solvent-free synthesis of glycerol carbonate and glycidol from 3-chloro-1,2-propanediol and potassium (hydrogen) carbonate. J. Chem. Technol. Biotechnol. 2010, 85, 1663–1670. [Google Scholar] [CrossRef]
- Mašek, O.; Buss, W.; Brownsort, P.; Rovere, M.; Tagliaferro, A.; Zhao, L.; Cao, X.; Xu, G. Potassium doping increases biochar carbon sequestration potential by 45%, facilitating decoupling of carbon sequestration from soil improvement. Sci. Rep. 2019, 9, 1–8. [Google Scholar] [CrossRef] [PubMed]
- Buss, W.; Bogush, A.; Ignatyev, K.; Masek, O. Unlocking the fertiliser potential of waste-derived biochar. ACS Sustain. Chem. Eng. 2020. [Google Scholar] [CrossRef]
- Collett, C.H.; McGregor, J. Things go better with coke: The beneficial role of carbonaceous deposits in heterogeneous catalysis. Catal. Sci. Technol. 2016, 6, 363–378. [Google Scholar] [CrossRef]
- UK Biochar Research Centre. Standard Biochars. Available online: https://www.biochar.ac.uk/standard_materials.php (accessed on 17 May 2017).
- Mašek, O.; Buss, W.; Roy-Poirier, A.; Lowe, W.; Peters, C.; Brownsort, P.; Mignard, D.; Pritchard, C.; Sohi, S. Consistency of biochar properties over time and production scales: A characterisation of standard materials. J. Anal. Appl. Pyrolysis 2018, 132, 200–210. [Google Scholar] [CrossRef]
- Moreno-Castilla, C.; Carrasco-Marín, F.; Maldonado-Hódar, F.J.; Rivera-Utrilla, J. Effects of non-oxidant and oxidant acid treatments on the surface properties of an activated carbon with very low ash content. Carbon 1997, 36, 145–151. [Google Scholar] [CrossRef]
- Nowakowski, D.J.; Jones, J.M. Uncatalysed and potassium-catalysed pyrolysis of the cell-wall constituents of biomass and their model compounds. J. Anal. Appl. Pyrolysis 2008, 83, 12–25. [Google Scholar] [CrossRef]
- Morgan, M.E.; Jenkins, R.G.; Walker, P.L., Jr. Inorganic constituents in American lignites. Fuel 1981, 60, 189–193. [Google Scholar] [CrossRef][Green Version]
- Raveendran, K.; Ganesh, A.; Khilar, K.C. Influence of mineral matter on biomass pyrolysis characteristics. Fuel 1995, 74, 1812–1822. [Google Scholar] [CrossRef]
- Specac. The Specac Quest: How the ATR Accessory Works; Specac: Orpington, UK, 2016. [Google Scholar]
- ASTM. International Standard Test Methods for Proximate Analysis of Coal and Coke by Macro Thermogravimetric Analysis; ASTM: West Conshohocken, PA, USA, 2010. [Google Scholar]
- National Physical Laboratory. Calibration Software and Reference Materials for Electron Spectrometers. Available online: http://www.npl.co.uk/science-technology/surface-and-nanoanalysis/services/calibration-software-and-reference-materials-for-electron-spectrometers (accessed on 8 August 2018).
- Harkins, W.D.; Jura, G. The Decrease (π) of Free Surface Energy (γ) as a Basis for the Development of Equations for Adsorption Isotherms; and the Existence of Two Condensed Phases in Films on Solids. J. Chem. Phys. 1944, 12, 112–113. [Google Scholar] [CrossRef]
- Horváth, G.; Kawazoe, K. Method for the calculation of effective pore size distribution in molecular sieve carbon. J. Chem. Eng. Jpn. 1983, 16, 470–475. [Google Scholar] [CrossRef]
- Ayala, P.; Maia da Costa, M.E.H.; Prioli, R.; Freire, F.L. Nano- and micro-scale wear of fluorinated carbon films. Surf. Coat. Technol. 2004, 182, 335–341. [Google Scholar] [CrossRef]
- Tarrant, R.N.; McKenzie, D.R.; Bilek, M.M.M. Raman characterisation of PIII multilayer carbon films. Diam. Relat. Mater. 2004, 13, 1422–1426. [Google Scholar] [CrossRef]
- Li, X.; Hayashi, J.; Li, C. Volatilisation and catalytic effects of alkali and alkaline earth metallic species during the pyrolysis and gasification of Victorian brown coal. Part VII. Raman spectroscopic study on the changes in char structure during the catalytic gasification in air. Fuel 2006, 85, 1509–1517. [Google Scholar] [CrossRef]
- Chia, C.H.; Gong, B.; Joseph, S.D.; Marjo, C.E.; Munroe, P.; Rich, A.M. Imaging of mineral-enriched biochar by FTIR, Raman and SEM–EDX. Vib. Spectrosc. 2012, 62, 248–257. [Google Scholar] [CrossRef]


| Reference | Biochar(s) Studied | Target Application |
|---|---|---|
| [32] | Commercial biomass char (type unspecified), pinewood char, pinewood ash | Tar reduction |
| [33] | Three commercial hardwood chars | Biodiesel production (solid acid catalyst) |
| [34] | Pelletised peanut hulls, pine pellets, pine chip char | Esterification of fatty acids (solid acid catalyst) |
| [35] | Pistachio hull biochar | Ozonation of water recalcitrant concentrations |
| [36] | Pine chip, wood-based activated carbon | Catalyst (solid acid) for hemicellulose hydrolysis |
| [37] | Karanja seed shells | Esterification of glycerol with acetic acid |
| [38] | Rice husk char | Conversion of tar using rice husk char-supported nickel–iron catalysts |
| [39] | Shengli brown coal | Pyrolysis and gasification of biomass |
| [40] | Woody biomass | (Solid acid) Transesterification of canola oil |
| [41] | Modified cotton biochar | Low-temperature selective catalytic reduction (SCR) of NO |
| [42] | Calcium oxide-based catalyst from palm kernel shell biochar | Transesterification of sunflower oil with methanol to produce biodiesel |
| [43] | Fly ash and eggshell-derived solid catalysts | Solid base catalyst, transesterification of soybean oil to biodiesel |
| [44] | Ash from cocoa pod husks (supported and unsupported) | Transesterification of soybean oil to biodiesel (Supported and unsupported catalysts) |
| [45] | Palm bunch ash, support for KOH | Biodiesel synthesis (simultaneous ozonolysis and transesterification) |
| [46] | Rice husk biochar | Tar reforming |
| [47] | Miscanthus straw, soft wood | Photocatalytic phenol degradation, oxidation of methanol |
| Property | RH 550 | OSR 550 | OSR 700 | WSP 550 | SWP 550 | AC |
|---|---|---|---|---|---|---|
| Structure | ||||||
| BET area/m2 g−1 | 121 | 62.3 | 107 | 51.7 | 390 | 729 |
| Micropore volume/cm3 g−1 | 3.25 × 10⁻³ | 0.0 | 1.88 × 10⁻² | 2.86 × 10⁻³ | 1.05 × 10⁻¹ | 1.54 × 10⁻¹ |
| Median Pore Width/Å | 7.671 | 11.143 | 7.739 | 8.854 | 7.663 | 7.657 |
| Proximate Composition | ||||||
| Moisture/wt.% | 2.98 | 4.25 | 1.49 | 1.01 | 3.52 | 6.88 |
| Volatile/wt.% | 9.39 | 14.40 | 10.40 | 12.70 | 16.70 | 4.13 |
| Fixed carbon/wt.% | 44.50 | 67.40 | 67.80 | 67.30 | 81.70 | 84.70 |
| Ash/wt.% | 42.90 | 13.60 | 20.30 | 18.90 | 0.00 | 4.25 |
| Surface Elemental Composition | ||||||
| C/at.% | 67.6 | 67.8 | 65.9 | 69.2 | 90.4 | - |
| O/at.% | 20.3 | 12.5 | 21.9 | 20.4 | 9.6 | - |
| Si/at.% | 8.3 | 1.1 | 2.8 | 4.5 | 0.0 | - |
| K/at.% | 0.8 | 17.1 | 5.9 | 3.1 | 0.0 | - |
| Ca/at.% | 0.3 | 0.0 | 1.1 | 1.0 | 0.0 | - |
| Mg/at.% | 0.0 | 0.0 | 0.4 | 0.0 | 0.0 | - |
| Other/at.% | 2.8 | 1.5 | 2.0 | 1.9 | 0.0 | - |
| Property | RH 550-DM | OSR 700-DM | WSP 550-DM |
|---|---|---|---|
| Structure | |||
| BET area/m2 g−1 | 86.6 | 78.8 | 94.7 |
| Micropore volume/cm3 g−1 | 1.83 × 10⁻³ | 9.08 × 10⁻⁴ | 3.55 × 10⁻³ |
| Median Pore Width/Å | 7.672 | 7.688 | 7.663 |
| Proximate Composition | |||
| Moisture/wt.% | 0.60 | 1.54 | 0.98 |
| Volatile/wt.% | 10.89 | 10.78 | 14.90 |
| Fixed carbon/wt.% | 48.38 | 73.48 | 70.36 |
| Ash/wt.% | 40.13 | 14.20 | 13.76 |
| Surface Elemental Composition | |||
| C/at.% | 70.7 | 78.7 | 69.8 |
| O/at.% | 20.0 | 15.3 | 20.1 |
| Si/at.% | 6.2 | 4.0 | 8.2 |
| K/at.% | 0.0 | 0.0 | 0.0 |
| Ca/at.% | 0.1 | 0.4 | 0.0 |
| Mg/at.% | 0.0 | 0.0 | 0.0 |
| Other/at.% | 3.1 | 1.6 | 1.9 |
| Property | RH 550-ash | OSR 700-ash | WSP 550-ash | RH 550-DM-ash | OSR 700-DM-ash | WSP 550-DM-ash |
|---|---|---|---|---|---|---|
| Structure | ||||||
| BET area/m2 g−1 | 37.2 | 35.9 | 19.1 | - | - | - |
| Micropore volume/cm3 g−1 | 1.42 × 10⁻³ | 9.80 × 10⁻⁴ | 5.67 × 10⁻⁴ | - | - | - |
| Median pore width/Å | 10.960 | 10.985 | 10.911 | - | - | - |
| Surface Elemental Composition | ||||||
| C/at.% | 5.0 | 2.0 | 4.4 | 3.6 | 2.2 | 2.5 |
| O/at.% | 59.4 | 63.4 | 62.8 | 68.1 | 64.9 | 65.9 |
| Si/at.% | 29.5 | 19.3 | 22.5 | 26.5 | 21.7 | 27.3 |
| K/at.% | 3.5 | 9.2 | 6.3 | 0.6 | 1.9 | 0.7 |
| Ca/at.% | 0.7 | 3.3 | 2.2 | 0.4 | 4.7 | 2.3 |
| Mg/at.% | 0.9 | 1.4 | 0.6 | 0.2 | 2.7 | 1.0 |
| Other/at.% | 1.0 | 1.4 | 1.2 | 0.6 | 2.0 | 0.3 |
| Feedstock | Pyrolysis Temperature(s)/°C | Abbreviation |
|---|---|---|
| Rice husk | 550 | RH 550 |
| Wheat straw pellets | 550 | WSP 550 |
| Oil seed rape | 550 and 700 | OSR 550, OSR 700 |
| Soft wood | 550 | SWP 550 |
| Temperature/°C | Hold Time/min | Ramp Rate/°C min−1 |
|---|---|---|
| 40 | 2 | 10 |
| 163 | 1 | 50 |
| 190 | 3 | 10 |
| 205 | 3 | 10 |
| 250 | 5 | N/A |
© 2020 by the authors. Licensee MDPI, Basel, Switzerland. This article is an open access article distributed under the terms and conditions of the Creative Commons Attribution (CC BY) license (http://creativecommons.org/licenses/by/4.0/).
Share and Cite
Collett, C.; Mašek, O.; Razali, N.; McGregor, J. Influence of Biochar Composition and Source Material on Catalytic Performance: The Carboxylation of Glycerol with CO2 as a Case Study. Catalysts 2020, 10, 1067. https://doi.org/10.3390/catal10091067
Collett C, Mašek O, Razali N, McGregor J. Influence of Biochar Composition and Source Material on Catalytic Performance: The Carboxylation of Glycerol with CO2 as a Case Study. Catalysts. 2020; 10(9):1067. https://doi.org/10.3390/catal10091067
Chicago/Turabian StyleCollett, Catherine, Ondřej Mašek, Nurul Razali, and James McGregor. 2020. "Influence of Biochar Composition and Source Material on Catalytic Performance: The Carboxylation of Glycerol with CO2 as a Case Study" Catalysts 10, no. 9: 1067. https://doi.org/10.3390/catal10091067
APA StyleCollett, C., Mašek, O., Razali, N., & McGregor, J. (2020). Influence of Biochar Composition and Source Material on Catalytic Performance: The Carboxylation of Glycerol with CO2 as a Case Study. Catalysts, 10(9), 1067. https://doi.org/10.3390/catal10091067