Abstract
Hydrogen production by catalytic partial oxidation and steam reforming of methane and propane towards synthesis gas are numerically investigated in stagnation-flow over a disc coated with a porous Rh/Al2O3 layer. A one-dimensional flow field is coupled with three models for internal diffusion and with a 62-step surface reaction mechanism. Numerical simulations are conducted with the recently developed computer code DETCHEMSTAG. Dusty-Gas model, a reaction-diffusion model and a simple effectiveness factor model, are alternatively used in simulations to study the internal mass transfer inside the 100 µm thick washcoat layer. Numerically predicted species profiles in the external boundary layer agree well with the recently published experimental data. All three models for internal diffusion exhibit strong species concentration gradients in the catalyst layer. In partial oxidation conditions, a thin total oxidation zone occurs close to the gas-washcoat interface, followed by a zone of steam and dry reforming of methane. Increasing the reactor pressure and decreasing the inlet flow velocity increases/decreases the external/internal mass transfer limitations. The comparison of reaction-diffusion and Dusty-Gas model results reveal the insignificance of convective flow on species transport inside the washcoat. Simulations, which additionally solve a heat transport equation, do not show any temperature gradients inside the washcoat.
1. Introduction
Steam reforming (SR) of methane (CH4) (Equation (1)) is the major process for synthesis gas (CO, H2) production today. Steam reforming of propane (C3H8) (Equation (2)) is also realized, because it can be easily stored and distributed [1]. Tubular reactors packed with supported Ni catalysts are largely used for synthesis gas production. Operating temperature and pressure of these tubular reactors are around 800–900 °C and 20–30 bar, respectively. This is an energy-intensive process with long residence time (1 s or more), and industrial production requires large scale operation [2,3,4]. The process is limited by the low catalyst effectiveness factors, weak heat transport capabilities, and significant initial capital expenditures [5,6]. Microchannel reactors have been investigated as an alternative to tubular reactors for SR of CH4 [7,8,9,10,11,12] and SR of C3H8 [1,13,14,15,16]. In microchannel reactors, the active catalyst material is adhered, possibly in a porous layer, to the inner walls of channels. Nobel metal catalysts are the most active catalysts for hydrocarbon reforming in microchannels for a high syngas yield [9,17]. In this respect, rhodium (Rh) is a very active metal and guarantees high conversion at short contact times. It is slightly prone to carbon-deposition, and stable at extreme, cyclic conditions without loss of activity [18]. Microchannel reactors with a Rh catalyst offer enhanced heat and mass transfer, safe control in explosive regime, high surface area, low pressure drop, and short residence time (10 ms or less) [5,19].
Catalytic partial oxidation (CPOX) of CH4 (Equation (3)) and CPOX of C3H8 (Equation (4)) in dry air is an attractive alternative synthesis gas production to larger SR reactors. The system is well-suited for small scale systems, such as foam catalysts, monolithic reactors and micro fuel-cells. For instance, CPOX of CH4 produce H2/CO ratio of two which is suitable as feedstock for methanol synthesis and the Fischer–Tropsch reaction [20]. Rh is an active and stable noble metal for CPOX applications, as well.
Aforementioned catalytic reactors for the SR and CPOX of CH4 and C3H8 exhibit a complex interaction between the catalytically active surface and the surrounding flow field. Understanding the physical and chemical steps of a heterogeneous catalytic processes at a fundamental level aids optimizing the process and the catalyst. Microkinetic models are incorporated into computational fluid dynamics (CFD) codes to model the reforming reactors, and validate them in an operating range relevant to industrial applications. In this respect, detailed reaction mechanisms for methane reforming have been studied since early 1990s. Direct and indirect reaction pathways were proposed for the partial oxidation of CH4 on Rh catalysts. Direct reaction pathways assume that methane is oxidized to form CO and H2, along with the total oxidation [21,22,23]. Indirect mechanisms on the other hand suggest that CH4 reacts initially with O2 to form CO2 and H2O (total oxidation) followed by steam and dry reforming of CH4 [24,25,26,27,28]. Reaction kinetics for CPOX of C3H8 on Rh catalysts were also proposed [16,29]. Similar to the CPOX, microkinetic studies were employed for SR on Rh catalysts [3,16,28,30,31].
One important feature that is used in the catalytic reactors is the inclusion of a porous layer, called washcoat, that is coated on the surface [8,15,19,32,33]. The catalyst is distributed inside this washcoat to increase the internal surface area. In this case, reactants in the bulk flow diffuse from the gas-washcoat interface through pores and react at active sites of the catalyst. After reaction, products diffuse from the washcoat back to the bulk flow [34]. Finite diffusion rates of reactants and products towards and away from active sites may lead to a reduced overall reaction rate. Because of the very exothermic (CPOX) and endothermic (SR) nature of methane reforming processes, heat and mass-transport and chemical kinetics are tightly coupled. At low temperatures, catalytic reactions are slow, and therefore they are the rate-limiting step of the process. At higher temperatures, when the rate of diffusion is slow compared to the intrinsic rate of reaction, mass transport affects the rate of reaction, and the process becomes diffusion-limited [35]. Therefore, it is important to account for internal mass transfer limitations in catalytic reactor modeling in case of a thick catalyst layer [34,36,37,38,39,40].
The stagnation-flow reactor (SFR) offers a simple geometry to investigate the aforementioned chemical and physical processes and their interactions in a heterogeneous catalytic process that are relevant in practical reactor applications [41,42]. Its fluid-mechanical properties enable measuring and modeling the gas-phase boundary layer adjacent to the zero-dimensional catalytic surface [41,43]. One-dimensional (1D) formulation of the SFR facilitates computational modeling and simulation of processes dealing with catalytic combustion/oxidation.
In the present study, CPOX and SR of CH4 and C3H8 are investigated numerically in stagnation-flow over a Rh/Al2O3 catalyst. The experimental conditions are taken from the recent studies of Karakaya et al. [16,28] as a basis for numerical predictions. Reaction-diffusion equation and effectiveness factor approach are used in the simulations to account for internal mass transfer resistances inside the washcoat. The Dusty-Gas model is used exemplarily for the CPOX and SR of CH4 to investigate the effect of convective flow on species transport inside the washcoat layer. Energy balance inside the washcoat is included to analyze heat transport effects. The results give an insight into chemical and physical processes inside the washcoat and the interaction of active catalytic surface with the surrounding flow field. The possible reaction routes, internal and external mass transfer limitations, the effect of convective flow and heat transport inside the catalyst layer are investigated in detail. It is discussed if the surface models are adequate enough to predict the experiments. The results of this study are expected to help in understanding the complex processes in practical catalytic reactors for CPOX and SR of CH4 and C3H8.
2. Results and Discussion
2.1. Cases Studied
In this study, we use the experimental stagnation-flow reactor data of Karakaya et al. [16,28] to investigate CPOX and SR of CH4 and C3H8 over Rh/Al2O3. In this respect, Table 1 and Table 2 give the investigated cases for the CPOX of CH4 and C3H8, respectively. Table 3 and Table 4 give the investigated cases for the SR of CH4 and C3H8, respectively.

Table 1.
Reaction conditions for catalytic partial oxidation (CPOX) of CH4.
Table 2.
Reaction conditions for CPOX of C3H8.
Table 3.
Reaction conditions for steam reforming (SR) of CH4.
Table 4.
Reaction conditions for SR of C3H8.
2.2. Input Data for Numerical Simulations
The inlet conditions of the numerical simulations are based on the experimental conditions that are given in Table 1, Table 2, Table 3 and Table 4. The inlet velocity is taken as 51 cm/s and 53 cm/s for CPOX of CH4 and C3H8, respectively. The inlet velocity is taken as 71 cm/s and 77 cm/s for SR of CH4 and C3H8, respectively. The finite gap between the inlet and catalytic surface is 3.9 cm. The reactor inlet temperature is taken as 313 K and 423 K for CPOX and SR cases, respectively.
In this study, simulations are performed with two different surface models, i.e., with the η-approach and RD-approach. CH4 and C3H8 are chosen as the rate-limiting species for the η-approach simulations. DGM simulations are performed exemplarily for the CPOX and SR of CH4 for evaluating the effect of convective flow on species transport inside the washcoat layer. The thickness, mean pore diameter, tortuosity, and porosity of the washcoat are the parameters that are used in the η-approach, RD-approach, and DGM simulations. In DGM, particle diameter is also needed. The values of these parameters are given in Table 5. The washcoat temperature is kept constant in simulations.
Table 5.
The parameters used in the surface models.
2.3. CPOX of CH4 and C3H8
2.3.1. CPOX of CH4
The results of this section is based on the studies of Karadeniz [44]. Experimental and simulation results are given in Figure 1. In the experiments, each data point is given as an average of four repeated measurements. Differences between these four measurements is less than 10%. According to the results, η-approach, RD-approach, and DGM simulations show relatively good agreement with the experiments for species profiles in the gas-phase boundary layer for Cases 1–5 (Figure 1a,c,e,g,i). Gas-phase boundary layers are around 6–7 mm for Cases 1–5, relative to the external catalyst surface.
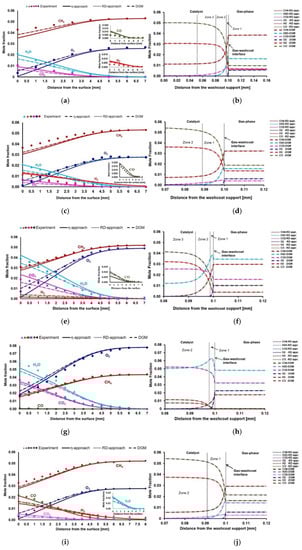
Figure 1.
(a,c,e,g,i): Experimental and simulation results for the species profiles in the gas-phase from Case 1 to Case 5, respectively. (b,d,f,h,j): Species mole fractions inside the porous washcoat layer from Case 1 to Case 5, respevtively.
Surface reactions are fast and internal mass transfer limitations are observed. Φ and η values, which are obtained from η-approach, confirm the strong diffusion limitations (Table 6). Therefore, the rate-limiting process is the internal diffusion. RD-approach and DGM simulations give an insight to realize the physical and chemical processes (reaction routes) inside the washcoat (Figure 1b,d,f,h,j). According to DGM simulations, the pressure gradient inside the washcoat is low (Table 7). Therefore, DGM yields identical species profiles with the RD-approach.
Table 6.
Φ and η values in CPOX of CH4 cases.
Table 7.
The pressure difference in the washcoat in CPOX of CH4 cases.
Further, the reaction routes inside the washcoat is explained below for each individual case.
Case 1: Case 1 is stoichiometric for partial oxidation and total oxidation products (CO2 and H2O) are the main products at the catalyst surface (Figure 1a). Zones one to three in Figure 1b show that there are complex reaction routes inside the washcoat. For a better explanation, only the first and second reaction zones in the washcoat are considered in Figure 2. In zone one, there is a thin total oxidation layer near the external catalyst surface. After this thin total oxidation zone, mainly SR of CH4 occurs in zone two. Dry reforming (DR) of CH4 (Equation (5)) is observed simultaneously in this zone, as well, but to a much lesser extent. In zone three (Figure 1b), only a slight DR of CH4 is observed. Beyond zone three, there is not any reaction in the rest of the washcoat and the system reaches equilibrium. The whole reaction layer is around 50 µm and it is given here as relative to the external catalyst surface (gas-washcoat interface). The species composition at the 50 µm of the washcoat is used in DETCHEMEQUIL code [45] to realize if the composition has reached the thermodynamic equilibrium. Further, DETCHEMEQUIL code calculations show that the species composition (mole fractions (mole frac.)) reaches equilibrium at 50 µm of the washcoat (Table 8).
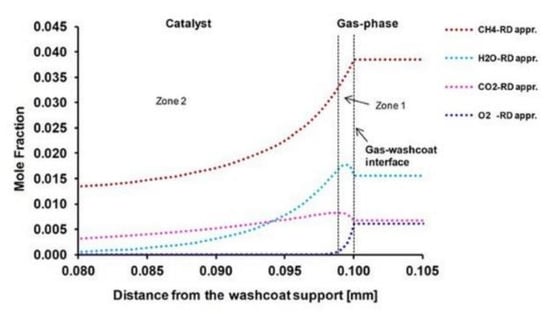
Figure 2.
Reaction routes in the first and second zone of the washcoat.
Table 8.
Equilibrium composition (mole frac.) in the washcoat, relative to external catalyst surface.
Case 2: Case 2 is stoichiometric for partial oxidation and experiments show that O2 is almost completely consumed on the surface. The main products are synthesis gas and total oxidation products (Figure 1c). In Figure 1d, only 30 µm of the washcoat is shown for Case 2, because the reactions occur only in this section. According to RD-approach and DGM simulations, total oxidation is a weak process due to too little amount of O2 inside the catalyst. There exist SR and DR of CH4 in zone one inside the washcoat. However, DR occurs in a much lesser extent than SR. There is just a slight DR process within zone two. DETCHEMEQUIL code shows that the chemical composition reaches thermodynamic equilibrium at the 30 µm of the washcoat as given in Table 8.
Case 3: Case 3 is stoichiometric for total oxidation and CH4 consumption rate increases, compared to Case 2, due to increased amount of oxygen (Figure 1e). Therefore, more total oxidation products are obtained. The amount of synthesis gas products decreases. The reaction layer is divided into three zones in Figure 1f. Zone one, which is adjacent to the external catalyst surface, shows a thin reaction layer where total oxidation occurs. In zone two, there is SR of CH4, where CH4 and H2O are consumed, CO and H2 are produced. CO2 is still formed in the second zone due to water-gas shift (WGS) reaction (Equation (6)). In zone three, CO2 is not formed anymore. The little amount of remaining CH4 reacts with H2O (SR) to yield synthesis gas. DETCHEMEQUIL code shows that the chemical composition reaches thermodynamic equilibrium at the 20 µm of the washcoat as given in Table 8.
Case 4: Case 4 is fuel-rich for total oxidation and total oxidation products are the main products on the surface. No synthesis gas formation is observed at this fuel-rich case (Figure 1g). RD-approach and DGM simulations reveal that there is a total oxidation zone in the washcoat (zone one in Figure 1h), near the external catalyst surface. After this total oxidation zone, there is the SR of CH4. Since there is not any oxygen left and CO2 is still formed, WGS occurs as well. SR and WGS occur simultaneously in the entire zone two. The total reaction layer (zone one and zone two together) is around 15 µm. The species composition reaches thermodynamic equilibrium at the 15 µm of the washcoat as given in Table 8.
Case 5: Case 5 is slightly lean for partial oxidation and CH4 is converted more in Case 5 compared to Case 2 due to the increased surface temperature (Figure 1i). There is a slight increase of the synthesis gas products compared to Case 2. According to the RD-approach and DGM simulations, total oxidation inside the washcoat is weak (Figure 1j). Total reaction layer thickness inside the washcoat is around 30 µm. SR and DR processes take place simultaneously within zone one of the washcoat. However, SR is the dominant process and DR occurs although its much weaker compared to SR. The species composition reaches thermodynamic equilibrium at the 30 µm of the washcoat as given in Table 8.
2.3.2. CPOX of C3H8
The experimental and simulation results of CPOX of C3H8 are given in Figure 3. According to the results, η-approach and RD-approach simulations show relatively good agreement with the experiments for Case 6 and Case 7 (Figure 3a,c). Gas-phase boundary layers are around 6 mm, relative to the external catalyst surface. Surface reactions are fast and internal mass transfer limitations are observed. Φ and η values, which are obtained from η-approach, confirm the strong diffusion limitations (Table 9). Since DGM simulations have already revealed that the pressure gradient inside the washcoat is insignificant for CPOX cases, and DGM yields identical species profiles with RD-approach, it is not calculated here for the CPOX of C3H8.

Figure 3.
(a,c): Experimental and simulation results for the species profiles in the gas-phase for Case 6 and Case 7, respectively. (b,d): Species mole fractions inside the porous washcoat layer from Case 6 and Case 7, respectively.
Table 9.
Φ and η values in CPOX of C3H8 cases.
Further, the reaction routes inside the washcoat is explained below for each individual case.
Case 6: Case 6 is rich for partial oxidation. Zones one to three in Figure 3b show that there are complex reaction routes inside the washcoat. For a better explanation, only the first and second reaction zones in the washcoat are considered in Figure 4. In zone one, there is a thin total oxidation zone near the external catalyst surface similar to the CPOX of CH4 for Case 1 and Case3. After this thin total oxidation zone, mainly SR of CH4 occurs in zone two. DR of CH4 is observed simultaneously in this zone, as well, but in a lesser extent. In zone three, only a slight DR of CH4 is observed (Figure 3b). Beyond zone three, there is not any reaction in the rest of the washcoat and the system reaches equilibrium. DETCHEMEQUIL code shows that the chemical composition reaches thermodynamic equilibrium at the 50 µm of the washcoat as given in Table 10.
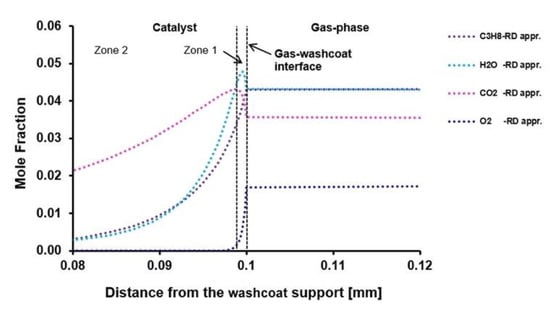
Figure 4.
Reaction routes in the first and second zone of the washcoat.
Table 10.
Equilibrium composition (mole frac.) in the washcoat, relative to external catalyst surface.
Case 7: Case 7 is stoichiometric for partial oxidation and experiments show that O2 is almost completely consumed on the surface (Figure 3c). The main products are synthesis gas and total oxidation products. In Figure 3d, only 30 µm of the washcoat is shown for Case 7, because reactions occur only in this section. In zone one, there is a thin total oxidation zone again near the external catalyst surface similar to Case 6. There exist mainly SR of CH4 inside the second reaction zone of the washcoat. There is DR of CH4, as well, but in a much lesser extent than SR. The species composition reaches thermodynamic equilibrium at the 30 µm of the washcoat as given in Table 10.
2.4. SR of CH4 and C3H8
2.4.1. SR of CH4
The results of this section is based on the studies of Karadeniz [44]. Experimental and simulation results are given in Figure 5. According to the results, η-approach, RD-approach, and DGM simulations show relatively good agreement with the experiments for species profiles in the gas-phase boundary layer for Case 8 and Case 9 (Figure 5a,c). Gas-phase boundary layers are around 9 mm. It is observable that the CO/H2 ratio on the surface obtained from SR of CH4 at 973 K differs from the CO/H2 ratio obtained from CPOX of CH4 at 973 K. Surface reactions are fast and internal mass transfer limitations are observed for SR of CH4, as well. Φ and η values confirm the strong diffusion limitations (Table 11). Therefore, the rate-limiting process is the internal diffusion. According to the DGM simulations, the pressure difference between the gas-washcoat interface and the washcoat support side is low for SR of CH4 (Table 12). Therefore, DGM yields identical species profiles with the RD-approach.
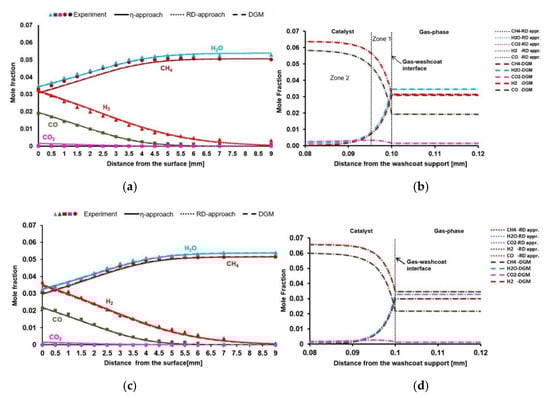
Figure 5.
(a,c): Experimental and simulation results for the species profiles in the gas-phase for Case 8 and Case 9, respectively. (b,d): Species mole fractions inside the porous washcoat layer from Case 8 and Case 9, respectively.
Table 11.
Φ and η values in SR of CH4 cases.
Table 12.
The pressure difference in the washcoat in SR of CH4 cases.
Further, the reaction routes inside the washcoat is explained below for each individual case.
Case 8: The reaction layer inside the washcoat is divided into two zones (Figure 5b). There is a very slight WGS kinetics within zone one. However, the driving process here is SR of CH4, where most of the CH4 and H2O are converted to synthesis gas. In zone two, there is no more WGS kinetics, but a slight SR of CH4. The whole reaction layer is only 20 µm due to strong internal mass transfer limitations. The chemical composition reaches thermodynamic equilibrium at the 20 µm of the washcoat according to the DETCHEMEQUIL code calculations (Table 13).
Table 13.
Equilibrium composition (mole frac.) in the washcoat, relative to external catalyst surface.
Case 9: Case 9 considers SR of CH4 at 1008 K. An increased reaction rate is observed for CH4 and O2, compared to Case 8, due to increased surface temperature. Therefore, a higher synthesis gas yield is obtained (Figure 5c). Figure 5d shows that the reaction layer is around 15 µm. There is only SR of methane within the whole reaction layer. The chemical composition reaches thermodynamic equilibrium at the 15 µm of the washcoat according to the DETCHEMEQUIL code calculations (Table 13).
2.4.2. SR of C3H8
Experimental and simulation results are given in Figure 6. Simulations predict the experiments reasonably well (except CO2 formation). Gas-phase boundary layers are around 7–8 mm. Surface reactions are fast and internal mass transfer limitations are observed for SR of C3H8, as well. Φ and η values confirm the strong diffusion limitations (Table 14). Since DGM simulations have already revealed that the pressure gradient inside the washcoat is insignificant for SR cases, and DGM yields identical species profiles with RD-approach, it is not calculated here for the CPOX of C3H8.
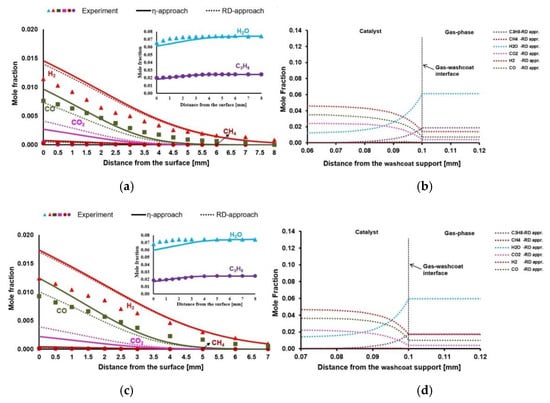
Figure 6.
(a,c): Experimental and simulation results for the species profiles in the gas-phase for Case 10 and Case 11, respectively. (b,d): Species mole fractions inside the porous washcoat layer from Case 10 and Case 11, respectively.
Table 14.
Φ and η values in SR of C3H8 cases.
Further, the reaction routes inside the washcoat is explained below for each individual case with RD-approach.
Case 10: Case 10 considers the SR of C3H8 at 883 K. WGS reaction occurs within the catalyst, where CO2 is formed (Figure 6b). However, the driving process here is SR of C3H8 at this temperature, where most of the C3H8 and H2O are converted to synthesis gas. The chemical composition reaches thermodynamic equilibrium at the 35 µm of the washcoat according to the DETCHEMEQUIL code calculations (Table 15).
Table 15.
Equilibrium composition (mole frac.) in the washcoat, relative to external catalyst surface.
Case 11: Case 11 considers SR of C3H8 at 923 K. Reaction rate increases for C3H8 and O2 slightly, compared to Case 10, due to increased surface temperature. Therefore, slightly higher synthesis gas yield is obtained (Figure 6c). WGS reaction occurs within the catalyst (Figure 6d). However, the driving process here is again SR of C3H8, where most of the C3H8 and H2O are converted to synthesis gas. Figure 6d shows that the reaction layer is around 25 µm relative to the external catalyst surface. The chemical composition reaches thermodynamic equilibrium at the 25 µm of the washcoat according to the DETCHEMEQUIL code calculations (Table 15).
2.5. The Effect of Pressure and Flow Rates on External and Internal Mass Transfer Limitations and Syngas Production via CPOX and SR of CH4 and C3H8
In this section, the effect of the pressure and flow rates on syngas production is investigated for CPOX and SR of CH4 and C3H8. Surface temperature, inlet temperature, carbon to oxygen (C/O) ratio, and steam to carbon (S/C) ratio are given for CPOX and SR cases in Table 16 and Table 17, respectively. Simulations are performed initially with varying pressures from 0.5 to 4 bar, and varying inlet velocities from 0.1 to 1.0 m/s. Internal mass transfer limitations are discussed based on the effectiveness factor (η). It should be mentioned here that internal mass transfer limitation increases with decreasing η. External mass transfer limitations are discussed based on Damkohler (Da) number. External mass transfer limitation is considered to be important, if Da exceeds three [46].
Table 16.
Reaction conditions for CPOX of CH4 and C3H8.
Table 17.
Reaction conditions for SR of CH4 and C3H8.
2.5.1. CPOX of CH4 and C3H8
Figure 7 shows that external mass transfer limitations become important with the increasing reactor pressure and decreasing inlet flow velocity both for CPOX of CH4 and C3H8. External mass transfer limitations are higher for CPOX of CH4 than C3H8 at lower inlet flow velocities and higher reactor pressures. They remain similar at higher flow velocities.
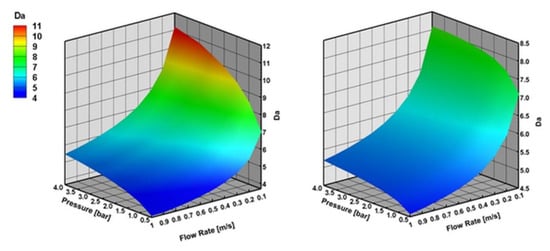
Figure 7.
Damkohler (Da) number with varying reactor pressure and varying inlet flow velocity in CPOX of CH4 and C3H8 at 973 K, the results are obtained with effectiveness factor approach.
Figure 8 shows that internal mass transfer limitations decrease with the increasing reactor pressure and decreasing inlet flow velocity both for CPOX of CH4 and C3H8. Internal mass transfer limitations are slightly higher for CPOX of CH4 than C3H8 at higher reactor pressures and lower inlet flow velocities. On the other hand, CPOX of CH4 shows less internal mass transfer limitations than CPOX of C3H8 at lower reactor pressures and higher inlet flow velocities.
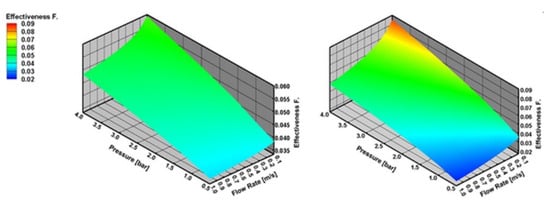
Figure 8.
Effectiveness factor (η) number with varying reactor pressure and varying inlet flow velocity in CPOX of CH4 and C3H8 at 973 K, the results are obtained with effectiveness factor approach.
The mole fraction of H2 at the surface increases with the increasing reactor pressure and decreasing inlet flow velocity both for CPOX of CH4 and C3H8 (Figure 9). This indicates here that internal mass transfer limitations outweigh external mass transfer limitations. As explained above, internal and external mass transfer limitations exhibit opposite behavior to reactor pressure and inlet flow velocities. However, H2 production increases in regimes, where internal mass transfer limitations decrease, even though external mass transfer limitations become important.
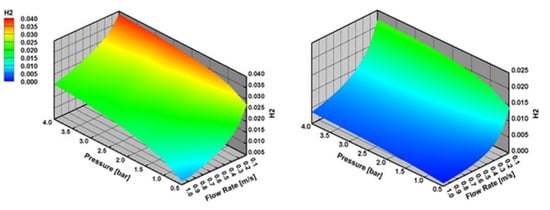
Figure 9.
H2 mole fraction at the surface with varying reactor pressure and varying inlet flow velocity in CPOX of CH4 and C3H8 at 973 K, the results are obtained with effectiveness factor approach.
2.5.2. SR of CH4 and C3H8
Figure 10 shows that external mass transfer limitations become important with increasing reactor pressure and decreasing inlet flow velocity in SR of CH4 and C3H8. Similar to CPOX, external mass transfer limitations are slightly higher for SR of CH4 than C3H8 at higher reactor pressures and lower inlet flow velocities.
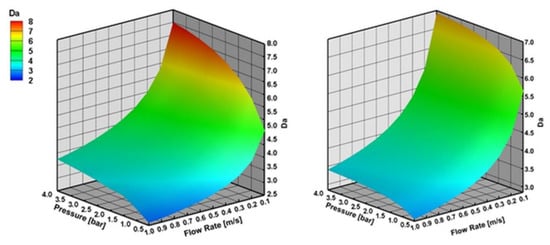
Figure 10.
Da number with varying reactor pressure and varying inlet flow velocity in SR of CH4 and C3H8 at 973 K, the results are obtained with effectiveness factor approach.
Figure 11 shows that internal mass transfer limitations decrease with the increasing reactor pressure and decreasing inlet flow velocity. Internal mass transfer limitations are higher for SR of CH4 than C3H8 at higher reactor pressures and lower inlet flow velocities.
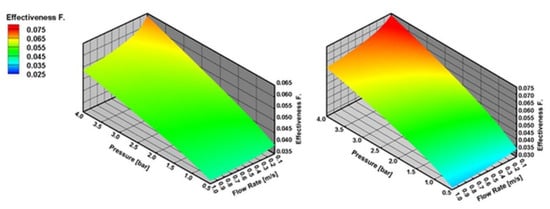
Figure 11.
η number with varying reactor pressure and varying inlet flow velocity in SR of CH4 and C3H8 at 973 K, the results are obtained with effectiveness factor approach.
The mole fraction of H2 at the surface increases with the increasing reactor pressure and decreasing inlet flow velocity both for SR of CH4 and C3H8 (Figure 12). This indicates here again that internal mass transfer limitations outweigh external mass transfer limitations.
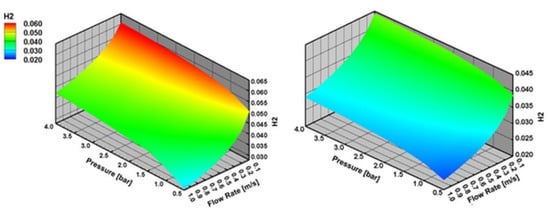
Figure 12.
H2 mole fraction at the surface with varying reactor pressure and varying inlet flow velocity in SR of CH4 and C3H8 at 973 K, the results are obtained with effectiveness factor approach.
2.6. The Effect of Heat Transport Limitations in the Washcoat
In order to study the effect of the heat transport limitations in the washcoat, the experimental configuration of SFR which was used by Karakaya [47] is examined. In the experiments, the resistive heater (FeCrAl alloy) was used for supplying the required heat to the washcoat. There is the ceramic support between the resistive heater and the washcoat. The details of the corresponding heat transfer modeling were explained in Section 3.3 and Section 3.4.
Further, simulations with the energy balance equations are performed exemplarily for the CPOX and SR of CH4. The results indicate that the temperature gradient inside the washcoat is negligible for CPOX and SR cases. Temperature gradient inside the washcoat is obtained less than 0.5 K for all CPOX of CH4 cases and less than 0.3 K for all SR of CH4 cases, respectively. It implies that the thermal conductivity of the alumina is adequate enough to obtain a uniform temperature distribution inside the thin Rh/Al2O3 catalyst layer.
3. Materials and Methods
3.1. Modeling Approach
The modeling approach of this study is based on the consideration of the SFR configuration in one dimension (1D). In the SFR configuration, reactants are directed from the inlet manifold to the active catalytic surface through a finite gap, with a uniform flow velocity, as illustrated in Figure 13. The corresponding mathematical model considers flow with thermal energy and potential gas-phase reactions, heterogeneous surface reactions on the catalytic plate, and boundary conditions for flow equations. The governing equations defining this system are briefly given in the following three sections (Section 3.2, Section 3.3 and Section 3.4). A more detailed explanation for the governing equations were given elsewhere [34,43,44].
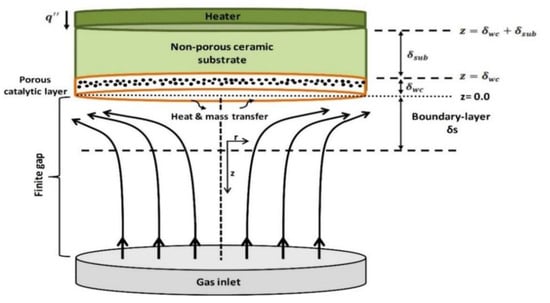
Figure 13.
Experimental configuration of stagnation-flow reactor (SFR) which was used by Karakaya [47].
3.2. Gas-Phase Equations
In the stagnation-flow field, scalar quantities (temperature and species mass fractions) depend only on the distance from the surface, not on the radial position [48,49]. This allows us to draw the attention to the center of the catalytic plate, and the system can be modeled by a one-dimensional representation of Navier–Stokes equations. The flow equations (mass and momentum) are coupled with the thermal energy and species conservation equations in their 1D form.
Thermal energy
Species continuity
Mixture continuity
Radial momentum
Eigenvalue of the radial momentum
Ideal gas law
Dependent variables in the governing equations are the temperature T, the species mass fraction , the axial mass flux , the scaled radial velocity , and the eigenvalue of the momentum equation . Independent variables are the axial distance from the surface x and the time t.
The diffusion flux of each gas-phase species considers diffusive mass flux caused by concentration and temperature gradients in a mixture-average formulation
in which () is the averaged diffusion coefficient and () is the thermal diffusion coefficient of the species i. We account for thermal diffusion effect in the diffusion velocity calculation, because it may play a vital role for light species (namely for H2).
3.3. Chemical and Physical Processes at the Catalytic Surface
Heterogeneous chemical processes at the surface are taken into account by considering finite diffusion inside the washcoat. Therefore, three different surface models are used, i.e., simple effectiveness factor approach, one-dimensional reaction-diffusion equations, and Dusty-Gas model.
Effectiveness factor approach (η-approach) is a simple method to account for diffusion limitations in the washcoat. It is based on the assumption that one target species determines overall reactivity [50]. An effectiveness factor is calculated for the chosen species based on the Thiele modulus [51], and all reaction rates are multiplied by this factor in the species governing equation at the gas-surface interface. In this approach, the effectiveness factor is defined as the ratio of the effective surface reaction rate inside the washcoat to the surface reaction rate without considering the diffusion limitation [34,52].
One-dimensional reaction-diffusion equations (RD-approach) offer a more adequate model to account for internal mass transfer limitations than the effectiveness factor approach. The model calculates spatial variations of concentrations and surface reaction rates inside the washcoat and each gas-phase species leads to one reaction-diffusion equation [34,52].
The most sophisticated surface model in our study is the Dusty-Gas model (DGM). In the DGM, species transport inside the washcoat accounts for ordinary and Knudsen diffusion as well as the pressure-driven convective flow (Darcy flow) [53,54]. The species mass conservation inside the washcoat is given in a conservative form as
where stands for the catalyst density (active catalytic surface area per washcoat volume) as
Total mass density inside the washcoat is given as
In the DGM, the fluxes of each species are coupled with one another [55]. The species molar fluxes are evaluated here using the DGM as it is given in [56]
where is the concentration of gas-phase species n, and is the viscosity of the mixture. The pressure () inside the washcoat is calculated from the ideal-gas law. in Equation (17) are the matrix of diffusion coefficients. Diffusion coefficients () can be calculated from the inverse matrix [54]
where the elements of the H matrix are determined as [54]
where is the Knudsen diffusion coefficient of ith species and determined as
in which is the mean pore diameter. Averaged diffusion coefficients () in Equation (19) are calculated in DETCHEM library [45]. The permeability in Equation (17) is calculated from the Kozeny–Carman relationship [56] as
where is the particle diameter. Surface coverages (i.e., fraction of the surface sites covered by surface species i) in the washcoat are calculated via
in which is the coordination number and is the surface site density.
Heat transport between the resistive heater and the gas/washcoat interface involves different contributions. In the experiments of Karakaya et al. [28], the resistive heater (FeCrAl alloy) is used for supplying the required heat to the washcoat. There exists the ceramic support between the resistive heater and the washcoat (Figure 13). The following energy conservation equations are coupled in this study only with the RD-approach.
Heat flux from the heater to the ceramic support can be calculated from the resistive heating. Energy equation for the ceramic substrate is given as
where the left-hand side represents the energy storage in the ceramic substrate. The right-hand side represents the conduction of the energy along the substrate. Energy equation inside the washcoat is given as
where the left hand side represents the energy storage in the washcoat. The term is here the effective specific heat capacity of the combined washcoat and gas mixture in each cell of the washcoat [57]. The first term on the right-hand side accounts for the conduction of the energy along the washcoat. Heat release due to surface reactions is modeled via the second term. The last term on the right-hand side considers the heat transport due to species diffusion. The effective conductivity in the washcoat is calculated as
in which is the thermal conductivity of the washcoat and is the thermal conductivity of the gas mixture in each cell of the washcoat [32]. In RD-approach, it is assumed that the diffusive mass flux in the washcoat is due to the concentration gradient [34]. Here, we extend the approach by assuming that the diffusive mass flux in the washcoat is due to both concentration and temperature gradients. Therefore, diffusive mass flux is given as
where () is the effective diffusion coefficient of the ith species [34].
3.4. Boundary Conditions
Boundary conditions must be included to close the equation system. They are introduced for the washcoat support side, gas-surface/washcoat interface, and the gas-inlet. Detailed information for the boundary conditions was given in the studies of Karadeniz et al. [34,44]. Here, we additionally give the boundary conditions of the energy conservation equations for the ceramic support and washcoat.
The boundary condition between the resistive heater and the ceramic support (at x = + ) is given as
where is the heat flux supplied by the heater. is the halfway of the distance between the heater-ceramic support interface and adjacent grid point in the ceramic support. The boundary condition at the ceramic support-washcoat interface (at x = ) is given as
where is the distance between the ceramic support-washcoat interface and adjacent grid point in the ceramic substrate. is the distance between the ceramic support-washcoat interface and adjacent grid point in the washcoat. and are given as and , respectively. Finally, energy balance at the gas-washcoat interface (at x = 0.0) is given as
where is the distance between the gas-washcoat interface and adjacent grid point in the gas-phase. is the distance between the gas-washcoat interface and adjacent grid point in the washcoat. and are given as and , respectively. The first term on the right hand side of Equation (29) accounts for heat conduction from the interface to the gas according to the Fourier heat conductivity law. The second term describes convective and diffusive energy transport from the gas-phase to the surface, where is the enthalpy of species i. The third term is heat radiation from the surface due to the Stefan–Boltzmann law, where is the Stefan–Boltzmann constant and is the emissivity of the outer washcoat surface. Here, is the reference temperature to which the surface radiates. The fourth term encompasses heat conduction from washcoat to interface according to the Fourier heat conductivity law.
3.5. Numerical Solution of the Model Equations
The modeled system consists of partial-differential equations (PDE). For numerical solution, it is necessary to transform it to a system of ordinary differential and algebraic equations (DAE). This is accomplished through spatial discretization of the PDE system by using finite difference approximations on a non-equidistant grid. This results in a set of ordinary differential and algebraic equations. The equation set is solved with the LIMEX [58] solver that uses a semi-implicit extrapolation method. Implementation of the mentioned numerical problem is accomplished by the software tool, DETCHEMSTAG [45], which was also used in [34,59].
3.6. Surface Reaction Mechanism for CH4 and C3H8 Partial Oxidation and Steam Reforming over Rh/Al2O3
The reaction mechanism presented here uses a 62 step detailed reaction steps among 7 gas-phase and 17 surface species to represent H2/CO/H2O/CO2/O2/CH4/C3H8 system on a Rh/Al2O3 surface, which is given in the Appendix A (Table A1). The mechanism takes the thermodynamically consistent H2/CO/H2O/CO2/O2/CH4 system [28] and extends it by an additional 14 reactions to account for partial oxidation and steam reforming of propane [16]. The reaction mechanism was developed and validated against a zero-dimensional stagnation-flow reactor data. The fidelity of the reaction kinetics was further tested against a lab-scale annular flow reactor for propane partial oxidation for various temperature and C/O range [29]. The temperature-dependent forward rate coefficients of () are written in the Arrhenius form. The net production rate of each chemical species in the gas phase is balanced with the diffusive flux of that species in the gas phase at steady-state conditions by assuming that no deposition or ablation of chemical species occurs on/from the catalyst surface:
The molar reaction rates () of adsorbed and gas-phase species are then a function of the local coverage and gas-phase concentrations at the gas-catalyst [43,60].
Here, is the number of surface reactions and are the species concentrations, given in mol/m2 for surface species and in mol/m3 for gas phase species and bulk species. The concentration of adsorbed species ci is related to the coverage, i, by the surface site density Γ (ci = θ I × Γ). The surface site density, i.e., the number of adsorption sites per surface area of the Rh particle, is estimated to be 2.72 × 10⁻⁹ mol cm−2. For the reaction with its stoichiometric coefficients of .
The term , which is derived from the CO chemisorption measurements, is introduced as a scaling factor for the active catalytic surface area and the geometric surface area of the stagnation disk [32],
4. Conclusions
This study investigated CPOX and SR of CH4 and C3H8 numerically in stagnation-flow over a porous Rh/Al2O3 catalytic disk. Numerically predicted species profiles in the external boundary layer were validated with the recently published experimental data. Physical and chemical processes inside the washcoat were discussed at a fundamental level. The fundamental findings of this study are relevant for practical conditions for catalytic reactors and they are summarized below:
- The simulations with all three surface models (η-approach, RD-approach, and DGM) indicated strong diffusion limitations inside the washcoat for all studied CPOX and SR cases. Therefore, internal mass transfer limitations must be considered for accurately predicting the experiments for CPOX and SR of CH4 and C3H8 over Rh/Al2O3 catalyst layers.
- The RD-approach and DGM gave an insight into the reaction routes inside the washcoat. According to the RD-approach and DGM simulations, there is not a direct reaction mechanism in the catalyst for the oxidation of CH4 and C3H8 in particular cases. Total oxidation, steam and dry reforming of CH4 and C3H8, and WGS reactions occur in the catalyst. In steam reforming, the main reaction route is SR of CH4 and C3H8 in the catalyst.
- DGM simulations gave almost identical species profiles with the RD-approach for all CPOX and SR cases for CH4, which indicates that the species transport inside the washcoat due to pressure-driven convective flow can be neglected.
- The simulations showed that increasing the reactor pressure and decreasing the inlet flow velocity increases the external mass transfer limitations and decreases the internal mass transfer limitations both for CPOX and SR of CH4 and C3H8. However, internal mass transfer limitations outweigh external mass transfer limitations. Hence, increasing the reactor pressure and decreasing the inlet flow velocity increases the hydrogen production significantly.
- The results showed that the temperature gradient inside the washcoat is negligible, which implies that the thermal conductivity of the alumina is adequate enough to obtain a uniform temperature distribution inside a thin Rh/Al2O3 catalyst layer. Therefore, it is a proper assumption to consider the washcoat as isothermal.
It is expected that the fundamental findings of this study can help to understand the complex processes in practical catalytic reactors for CPOX and SR of CH4 and C3H8.
Author Contributions
Conceptualization, H.K.; investigation, H.K.; methodology, H.K. and C.K.; writing—original draft, H.K.; writing—review & editing, H.K., C.K., S.T., and O.D.; supervision, O.D.; project administration, O.D; funding acquisition, O.D. All authors have read and agreed to the published version of the manuscript.
Funding
This study is financially supported by the Deutsche Forschungsgemeinschaft (DFG) and Steinbeis GmbH für Technologietransfer (STZ 240 Reaktive Strömungen).
Acknowledgments
We deeply appreciate helpful discussions with R. J. Kee and H. Zhu from Colorado School of Mines on stagnation-flow reactor modeling. Financial support by the Deutsche Forschungsgemeinschaft (DFG) and Steinbeis GmbH für Technologietransfer (STZ 240 Reaktive Strömungen) are gratefully acknowledged. We also thank the Steinbeis GmbH für Technologietransfer (STZ 240 Reaktive Strömungen) for a cost-free license of DETCHEMTM.
Conflicts of Interest
The authors declare no conflict of interest.
Nomenclature
| permeability | |
| concentration of gas-phase species in the washcoat | |
| heat capacity of the mixture in the gas-phase | |
| heat capacity of species i | |
| heat capacity of the gaseous mixture at the gas-washcoat interface | |
| heat capacity of the ceramic substrate | |
| heat capacity of the washcoat | |
| washcoat mean pore diameter | |
| particle diameter | |
| effective diffusion coefficient of the species i | |
| Knudsen diffusion coefficient of species i | |
| averaged diffusion coefficient of species i | |
| averaged diffusion coefficient of species i (DGM) | |
| thermal diffusion coefficient of species i | |
| ratio of the active catalytic surface area to the geometric surface area | |
| specific enthalpy of species i | |
| diffusive mass flux of species i | |
| diffusive molar flux of species i in the washcoat (DGM) | |
| diffusive molar flux of species i in the washcoat | |
| L | washcoat thickness |
| molar mass of species i | |
| mean molar mass of the mixture | |
| number of gas phase species | |
| p | pressure |
| pressure in the washcoat | |
| heat flux supplied by the heater | |
| r | radial coordinate |
| ideal gas constant | |
| T | temperature |
| temperature of the ceramic support | |
| temperature at the ceramic support-heater interface | |
| temperature at the ceramic support-washcoat interface | |
| temperature of the washcoat | |
| temperature at the gas-washcoat interface | |
| effective surface reaction rate of species i inside the washcoat | |
| surface reaction rate of species i in the washcoat (reaction-diffusion equations) | |
| surface reaction rate of species i without considering diffusion limitation | |
| t | time |
| axial velocity | |
| scaled radial velocity | |
| axial distance | |
| X | mole fraction of species i |
| mass fraction of species i | |
| Greek Letters | |
| density of the gaseous mixture in the gas-phase | |
| density of the ceramic support | |
| density of the gaseous mixture in the washcoat | |
| density of the gaseous mixture at the gas-washcoat interface | |
| density of the washcoat | |
| effective specific heat capacity of the combined washcoat and gaseous mixture | |
| Kronecker delta | |
| gas-phase reaction rate of species i | |
| λ | thermal conductivity of the mixture |
| thermal conductivity of the ceramic support | |
| effective thermal conductivity in the washcoat | |
| thermal conductivity of the gaseous mixture in the washcoat | |
| thermal conductivity of the washcoat | |
| viscosity of the mixture | |
| viscosity of the mixture in the washcoat | |
| eigenvalue of the momentum equation | |
| active catalyst area per washcoat volume | |
| catalyst pore tortuosity | |
| catalyst porosity | |
| emissivity of the washcoat | |
| surface coverage of species i | |
| number of the site occupied by one particle of species i | |
| surface site density | |
| washcoat effectiveness factor | |
| Φ | Thiele modulus |
Appendix A
Used reaction mechanism for partial oxidation and steam reforming of CH4 and C3H8.
Table A1.
Proposed reaction mechanism for the system H2/CO/H2O/CO2/O2/CH4/C3H8.
Table A1.
Proposed reaction mechanism for the system H2/CO/H2O/CO2/O2/CH4/C3H8.
| Reaction | A (cm, mol, s) | b | Ea (kJ/mol) | |
|---|---|---|---|---|
| R1 | H2 + Rh(s) + Rh(s) → H(s) + H(s) | 3.000 × 10⁻² | stick. coeff. | |
| R2 | O2 + Rh(s) + Rh(s) → O(s) + O(s) | 1.000 × 10⁻² | stick. coeff. | |
| R3 | H2O + Rh(s) → H2O(s) | 1.000 × 10⁻¹ | stick. coeff. | |
| R4 | CO2 + Rh(s) → CO2(s) | 4.800 × 10⁻² | stick. coeff. | |
| R5 | CO + Rh(s) → CO(s) | 4.971 × 10⁻¹ | stick. coeff. | |
| R6 | CH4 + Rh(s) → CH4(s) | 1.300 × 10⁻² | stick.coeff. | |
| R7 | C3H8+ Rh(s) → C3H8(s) | 2.000 × 10⁻³ | stick.coeff. | |
| R8 | H(s) + H(s) → Rh(s) + Rh(s) + H2 | 5.574 × 10¹⁹ | 0.239 | 59.69 |
| R9 | O(s) + O(s) → Rh(s) + Rh(s) + O2 | 5.329 × 10²² | −0.137 | 387.00 |
| R10 | H2O(s) → H2O + Rh(s) | 6.858 × 10¹⁴ | −0.280 | 44.99 |
| R11 | CO(s) → CO + Rh(s) | 1.300 × 10¹³ | 0.295 | 134.07–47θCO |
| R12 | CO2(s) → CO2 + Rh(s) | 3.920 × 10¹¹ | 0.315 | 20.51 |
| R13 | CH4 (s) → CH4 + Rh(s) | 1.523 × 10¹³ | −0.110 | 26.02 |
| R14 | C3H8(s) → C3H8+ Rh(s) | 1.000 × 10¹³ | −0.500 | 30.10 |
| R15 | H(s) + O(s) → OH(s)+ Rh(s) | 8.826 × 10²¹ | −0.048 | 73.37 |
| R16 | OH(s)+ Rh(s) → H(s) + O(s) | 1.000 × 10²¹ | 0.045 | 48.04 |
| R17 | H(s) + OH(s) → H2O(s)+ Rh(s) | 1.743 × 10²² | −0.127 | 41.73 |
| R18 | H2O(s) + Rh(s) → H(s) + OH(s) | 5.408 × 10²² | 0.129 | 98.22 |
| R19 | OH(s) + OH(s) → H2O(s) + O(s) | 5.736 × 10²⁰ | −0.081 | 121.59 |
| R20 | H2O(s) +O(s) → OH(s) + OH(s) | 1.570 × 10²² | 0.081 | 203.41 |
| R21 | CO2(s) + Rh(s) → CO(s) + O(s) | 5.752 × 10²² | −0.175 | 106.492 |
| R22 | CO(s) + O(s) → CO2(s) + Rh(s) | 6.183 × 10²¹ | 0.034 | 129.98–47θCO |
| R23 | CO(s) + Rh(s) → C(s) + O(s) | 6.390 × 10²¹ | 0.000 | 174.76–47θCO |
| R24 | C(s) + O(s) → CO(s) + Rh(s) | 1.173 × 10²² | 0.000 | 92.14 |
| R25 | CO(s) + OH(s) → COOH(s) + Rh(s) | 2.922 × 10²⁰ | 0.000 | 55.33–47θCO |
| R26 | COOH(s) + Rh(s) → CO(s) + OH(s) | 2.738 × 10²¹ | 0.160 | 48.38 |
| R27 | COOH(s) + Rh(s) → CO2(s) + H(s) | 1.165 × 10¹⁹ | 0.000 | 5.61 |
| R28 | CO2(s) + H(s) → COOH(s) + Rh(s) | 1.160 × 10²⁰ | −0.160 | 14.48 |
| R29 | COOH(s) + H(s) → CO(s) + H2O(s) | 5.999 × 10¹⁹ | −0.188 | 33.55 |
| R30 | CO(s) + H2O(s) → COOH(s) + H(s) | 2.258 × 10¹⁹ | 0.051 | 97.08–47θCO |
| R31 | CO(s) + OH(s) → CO2(s) + H(s) | 3.070 × 10¹⁹ | 0.000 | 82.94–47θCO |
| R32 | CO2(s) + H(s) → CO(s) + OH(s) | 2.504 × 10²¹ | −0.301 | 84.77 |
| R33 | C(s) + OH(s) → CO(s) + H(s) | 4.221 × 10²⁰ | 0.078 | 30.04–120θC |
| R34 | CO(s) + H(s) → C(s) + OH(s) | 3.244 × 10²¹ | −0.078 | 138.26–47θCO |
| R35 | CH4(s) +Rh(s) → CH3(s) +H(s) | 4.622 × 10²¹ | 0.136 | 72.26 |
| R36 | CH3(s) +H(s) → CH4(s) +Rh(s) | 2.137 × 10²¹ | −0.058 | 46.77 |
| R37 | CH3(s) +Rh(s) → CH2(s) +H(s) | 1.275 × 1024 | 0.078 | 107.56 |
| R38 | CH2(s) +H(s) → CH3(s) +Rh(s) | 1.073 × 10²² | −0.078 | 39.54 |
| R39 | CH2(s) +Rh(s) → CH(s) +H(s) | 1.275 × 1024 | 0.078 | 115.39 |
| R40 | CH(s) +H(s) → CH2(s) +Rh(s) | 1.073 × 10²² | −0.078 | 52.61 |
| R41 | CH(s) +Rh(s) → C(s) +H(s) | 1.458 × 10²⁰ | 0.078 | 23.09 |
| R42 | C(s) +H(s) → CH(s) +Rh(s) | 1.122 × 10²³ | −0.078 | 170.71–120 θC |
| R43 | CH4(s) +O(s) → CH3(s) +OH(s) | 3.465 × 10²³ | 0.051 | 77.71 |
| R44 | CH3(s) +OH(s) → CH4(s) +O(s) | 1.815 × 10²² | −0.051 | 26.89 |
| R45 | CH3(s) +O(s) → CH2(s) +OH(s) | 4.790 × 1024 | 0.000 | 114.52 |
| R46 | CH2(s) +OH(s) → CH3(s) +O(s) | 2.858 × 10²¹ | 0.000 | 20.88 |
| R47 | CH2(s) +O(s) → CH(s) +OH(s) | 4.790 × 1024 | 0.000 | 141.79 |
| R48 | CH(s) +OH(s) → CH2(s) +O(s) | 2.858 × 10²¹ | −0.000 | 53.41 |
| R49 | CH(s) +O(s) → C(s) +OH(s) | 5.008 × 10²⁰ | 0.000 | 26.79 |
| R50 | C(s) +OH(s) → CH(s) +O(s) | 2.733 × 10²² | 0.000 | 148.81–120θC |
| R51 | C3H8(s)+ Rh(s) → C3H7(s)+ H(s) | 1.300 × 10²¹ | 0.000 | 52.00 |
| R52 | C3H7(s)+ H(s) → C3H8(s)+ Rh(s) | 1.349 × 10²¹ | 0.156 | 46.73 |
| R53 | C3H7(s) + Rh(s) → C3H6(s)+ H(s) | 5.028 × 10²¹ | −0.118 | 84.05 |
| R54 | C3H6(s)+ H(s) → C3H7(s)+ Rh(s) | 2.247 × 10²² | 0.115 | 65.25 |
| R55 | C3H8(s)+ O(s) → C3H7(s)+ OH(s) | 7.895 × 1024 | −0.124 | 69.65 |
| R56 | C3H7(s)+ OH(s) → C3H8(s)+ O(s) | 1.087 × 1024 | 0.124 | 33.24 |
| R57 | C3H7(s)+ O(s) → C3H6(s)+ OH(s) | 1.276 × 10²² | −0.162 | 88.97 |
| R58 | C3H6(s)+ OH(s) → C3H7(s)+ O(s) | 1.875 × 10²⁰ | 0.162 | 45.03 |
| R59 | C3H6(s)+ Rh(s) → C2H3(s)+ CH3(s) | 1.370 × 1024 | −0.280 | 94.63 |
| R60 | C2H3(s)+ CH3(s) → C3H6(s)+ Rh(s) | 9.113 × 1024 | 0.279 | 44.88 |
| R61 | C2H3(s)+ Rh(s) → CH3(s)+ C(s) | 1.370 × 10²² | −0.280 | 46.53 |
| R62 | CH3(s)+ C(s) → C2H3(s)+ Rh(s) | 1.563 × 10²³ | 0.280 | 107.78–120θC |
The rate coefficients are given in the form of k = ATβ exp(−Ea/RT); adsorption kinetics is given in the form of sticking coefficients; the surface site density is Г = 2.72 × 10⁻⁹ mol cm−1.
References
- Silberova, B.; Venvik, H.J.; Holmen, A. Production of hydrogen by short contact time partial oxidation and oxidative steam reforming of propane. Catal. Today 2005, 99, 69–76. [Google Scholar] [CrossRef]
- Korup, O.; Goldsmith, C.F.; Weinberg, G.; Geske, M.; Kandemir, T.; Schlogl, R.; Horn, R. Catalytic partial oxidation of methane on platinum investigated by spatial reactor profiles, spatially resolved spectroscopy, and microkinetic modeling. J. Catal. 2013, 297, 1–16. [Google Scholar] [CrossRef]
- Maestri, M.; Vlachos, D.G.; Beretta, A.; Groppi, G.; Tronconi, E. Steam and dry reforming of methane on Rh: Microkinetic analysis and hierarchy of kinetic models. J. Catal. 2008, 259, 211–222. [Google Scholar] [CrossRef]
- Grasso, G.; Schaefer, G.; Schuurman, Y.; Mirodatos, C. Methane Steam Reforming in Microchannel Reactors: Technical Challenges and Performances Benefits. Top. Catal. 2011, 54, 859. [Google Scholar] [CrossRef]
- Ryi, S.K.; Park, J.S.; Kim, D.K.; Kim, T.H.; Kim, S.H. Methane steam reforming with a novel catalytic nickel membrane for effective hydrogen production. J. Membr. Sci. 2009, 339, 189–194. [Google Scholar] [CrossRef]
- Bitsch-Larsen, A.; Horn, R.; Schmidt, L.D. Catalytic partial oxidation of methane on rhodium and platinum: Spatial profiles at elevated pressure. Appl. Catal. A-Gen. 2008, 348, 165–172. [Google Scholar] [CrossRef]
- Izquierdo, U.; Barrio, V.L.; Cambra, J.F.; Requies, J.; Guemez, M.B.; Arias, P.L.; Kolb, G.; Zapf, R.; Gutierrez, A.M.; Arraibi, J.R. Hydrogen production from methane and natural gas steam reforming in conventional and microreactor reaction systems. Int. J. Hydrog. Energy 2012, 37, 7026–7033. [Google Scholar] [CrossRef]
- Murphy, D.M.; Manerbino, A.; Parker, M.; Blasi, J.; Kee, R.J.; Sullivan, N.P. Methane steam reforming in a novel ceramic microchannel reactor. Int. J. Hydrog. Energy 2013, 38, 8741–8750. [Google Scholar] [CrossRef]
- Kuznetsov, V.V.; Vitovsky, O.V.; Gasenko, O.A. Methane steam reforming in an annular microchannel with Rh/Al2O3 catalyst. J. Eng. Thermophys. 2009, 18, 187–196. [Google Scholar] [CrossRef]
- Wang, F.; Qi, B.; Wang, G.Q.; Li, L.J. Methane steam reforming: Kinetics and modeling over coating catalyst in micro-channel reactor. Int. J. Hydrog. Energy 2013, 38, 5693–5704. [Google Scholar] [CrossRef]
- Patil, R.A.; Patnaik, A.; Ganguly, S.; Patwardhan, A.V. Effect of structural, thermal and flow parameters on steam reforming of methane in a catalytic microreactor. Chem. Eng. Res. Des. 2011, 89, 2159–2167. [Google Scholar] [CrossRef]
- Tonkovich, A.L.Y.; Yang, B.; Perry, S.T.; Fitzgerald, S.P.; Wang, Y. From seconds to milliseconds to microseconds through tailored microchannel reactor design of a steam methane reformer. Catal. Today 2007, 120, 21–29. [Google Scholar] [CrossRef]
- Silberova, B.; Venvik, H.J.; Walmsley, J.C.; Holmen, A. Small-scale hydrogen production from propane. Catal. Today 2005, 100, 457–462. [Google Scholar] [CrossRef]
- Aartun, I.; Silberova, B.; Venvik, H.; Pfeifer, P.; Görke, O.; Schubert, K.; Holmen, A. Hydrogen production from propane in Rh-impregnated metallic microchannel reactors and alumina foams. Catal. Today 2005, 105, 469–478. [Google Scholar] [CrossRef]
- Schädel, B.T.; Duisberg, M.; Deutschmann, O. Steam reforming of methane, ethane, propane, butane, and natural gas over a rhodium-based catalyst. Catal. Today 2009, 142, 42–51. [Google Scholar] [CrossRef]
- Karakaya, C.; Karadeniz, H.; Maier, L.; Deutschmann, O. Surface Reaction Kinetics of the Oxidation and Reforming of Propane over Rh/Al2O3 Catalysts. ChemCatChem 2017, 9, 685–695. [Google Scholar] [CrossRef]
- Wang, Y.; Chin, Y.H.; Rozmiarek, R.T.; Johnson, B.R.; Gao, Y.; Watson, J.; Tonkovich, A.Y.L.; Vander Wiel, D.P. Highly active and stable Rh/MgO-Al2O3 catalysts for methane steam reforming. Catal. Today 2004, 98, 575–581. [Google Scholar] [CrossRef]
- Richardson, J.T.; Garrait, M.; Hung, J.K. Carbon dioxide reforming with Rh and Pt-Re catalysts dispersed on ceramic foam supports. Appl. Catal. A-Gen. 2003, 255, 69–82. [Google Scholar] [CrossRef]
- Simsek, E.; Karakaya, M.; Avci, A.K.; Onsan, Z.I. Oxidative steam reforming of methane to synthesis gas in microchannel reactors. Int. J. Hydrog. Energy 2013, 38, 870–878. [Google Scholar] [CrossRef]
- Zamaniyan, A.; Behroozsarand, A.; Mehdizadeh, H.; Ghadirian, H.A. Modeling of microreactor for syngas production by catalytic partial oxidation of methane. J. Nat. Gas Chem. 2010, 19, 660–668. [Google Scholar] [CrossRef]
- Hickman, D.A.; Haupfear, E.A.; Schmidt, L.D. Synthesis Gas-Formation by Direct Oxidation of Methane over Rh Monoliths. Catal. Lett. 1993, 17, 223–237. [Google Scholar] [CrossRef]
- Wei, Z.W.; Ming, S.C.; Hui, L.W. Mechanistic study of partial oxidation of methane to syngas using in situ time-resolved FTIR and microprobe Raman spectroscopies. Chem. Rec. 2002, 2, 102–112. [Google Scholar]
- Hofstad, K.H.; Hoebink, J.H.B.J.; Holmen, A.; Marin, G.B. Partial oxidation of methane to synthesis gas over rhodium catalysts. Catal. Today 1998, 40, 157–170. [Google Scholar] [CrossRef]
- Tavazzi, I.; Beretta, A.; Groppi, G.; Forzatti, P. Development of a molecular kinetic scheme for methane partial oxidation over a Rh/alpha-Al2O3 catalyst. J. Catal. 2006, 241, 1–13. [Google Scholar] [CrossRef]
- Horn, R.; Williams, K.A.; Degenstein, N.J.; Bitsch-Larsen, A.; Nogare, D.D.; Tupy, S.A.; Schmidt, L.D. Methane catalytic partial oxidation on autothermal Rh and Pt foam catalysts: Oxidation and reforming zones, transport effects, and approach to thermodynamic equilibrium. J. Catal. 2007, 249, 380–393. [Google Scholar] [CrossRef]
- Appel, C.; Mantzaras, J.; Schaeren, R.; Bombach, R.; Inauen, A.; Tylli, N.; Wolf, M.; Griffin, T.; Winkler, D.; Carroni, R. Partial catalytic oxidation of methane to synthesis gas over rhodium: In situ Raman experiments and detailed simulations. Proc. Combust. Inst. 2005, 30, 2509–2517. [Google Scholar] [CrossRef]
- Nogare, D.D.; Degenstein, N.J.; Horn, R.; Canu, P.; Schmidt, L.D. Modeling spatially resolved profiles of methane partial oxidation on a Rh foam catalyst with detailed chemistry. J. Catal. 2008, 258, 131–142. [Google Scholar] [CrossRef]
- Karakaya, C.; Maier, L.; Deutschmann, O. Surface Reaction Kinetics of the Oxidation and Reforming of CH4 over Rh/Al2O3 Catalysts. Int. J. Chem. Kinet. 2016, 48, 144–160. [Google Scholar] [CrossRef]
- Pagani, D.; Livio, D.; Donazzi, A.; Beretta, A.; Groppi, G.; Maestri, M.; Tronconi, E. A kinetic analysis of the partial oxidation of C3H8 over a 2% Rh/Al2O3 catalyst in annular microreactor. Catal. Today 2012, 197, 265–280. [Google Scholar] [CrossRef]
- Jakobsen, J.G.; Jakobsen, M.; Chorkendorff, I.; Sehested, J. Methane Steam Reforming Kinetics for a Rhodium-Based Catalyst. Catal. Lett. 2010, 140, 90–97. [Google Scholar] [CrossRef]
- Zeppieri, M.; Villa, P.L.; Verdone, N.; Scarsella, M.; De Filippis, P. Kinetic of methane steam reforming reaction over nickel- and rhodium-based catalysts. Appl. Catal. A-Gen. 2010, 387, 147–154. [Google Scholar] [CrossRef]
- Stutz, M.J.; Poulikakos, D. Optimum washcoat thickness of a monolith reactor for syngas production by partial oxidation of methane. Chem. Eng. Sci. 2008, 63, 1761–1770. [Google Scholar] [CrossRef]
- Ding, S.; Wu, C.N.; Cheng, Y.H.; Jin, Y.; Cheng, Y. Analysis of catalytic partial oxidation of methane on rhodium-coated foam monolith using CFD with detailed chemistry. Chem. Eng. Sci. 2010, 65, 1989–1999. [Google Scholar] [CrossRef]
- Karadeniz, H.; Karakaya, C.; Tischer, S.; Deutschmann, O. Numerical modeling of stagnation-flows on porous catalytic surfaces: CO oxidation on Rh/Al2O3. Chem. Eng. Sci. 2013, 104, 899–907. [Google Scholar] [CrossRef]
- Hayes, R.E.; Kolaczkowskib, S.T.; Li, P.K.C.; Awdry, S. Evaluating the effective diffusivity of methane in the washcoat of a honeycomb monolith. Appl. Catal. B-Environ. 2000, 25, 93–104. [Google Scholar] [CrossRef]
- Della Torre, A.; Lucci, F.; Montenegro, G.; Onorati, A.; Dimopoulos Eggenschwiler, P.; Tronconi, E.; Groppi, G. CFD modeling of catalytic reactions in open-cell foam substrates. Comput. Chem. Eng. 2016, 92, 55–63. [Google Scholar] [CrossRef]
- Torre, A.D.; Montenegro, G.; Onorati, A.; Tabor, G. CFD Characterization of Pressure Drop and Heat Transfer Inside Porous Substrates. Energy Procedia 2015, 81, 836–845. [Google Scholar] [CrossRef]
- Partopour, B.; Dixon, A.G. Reduced Microkinetics Model for Computational Fluid Dynamics (CFD) Simulation of the Fixed-Bed Partial Oxidation of Ethylene. Ind. Eng. Chem. Res. 2016, 55, 7296–7306. [Google Scholar] [CrossRef]
- Wehinger, G.D.; Klippel, F.; Kraume, M. Modeling pore processes for particle-resolved CFD simulations of catalytic fixed-bed reactors. Comput. Chem. Eng. 2017, 101, 11–22. [Google Scholar] [CrossRef]
- Nico, J.; Matthias, K.; Gregor, D.W. Advances in fixed-bed reactor modeling using particle-resolved computational fluid dynamics (CFD). Rev. Chem. Eng. 2019, 35, 139–190. [Google Scholar] [CrossRef]
- McGuire, N.E.; Sullivan, N.P.; Deutschmann, O.; Zhu, H.Y.; Kee, R.J. Dry reforming of methane in a stagnation-flow reactor using Rh supported on strontium-substituted hexaaluminate. Appl. Catal. A-Gen. 2011, 394, 257–265. [Google Scholar] [CrossRef]
- Coltrin, M.E.; Kee, R.J. Unified Nusselt- and Sherwood-number correlations in axisymmetric finite-gap stagnation and rotating-disk flows. Int. J. Heat Mass Transf. 2016, 102, 122–132. [Google Scholar] [CrossRef]
- Kee, R.J.; Coltrin, M.E.; Glarborg, P. Stagnation flows. In Chemically Reacting Flow; John Wiley & Sons, Inc.: New York, NY, USA, 2005; pp. 249–308. [Google Scholar]
- Karadeniz, H. Numerical Modeling of Stagnation Flows over Porous Catalytic Surfaces. Ph.D. Thesis, Karlsruher Institut für Technologie, Karlsruhe, Germany, 2015. [Google Scholar]
- Deutschmann, O.; Tischer, S.; Kleditzsch, S.; Janardhanan, V.; Correa, C.; Chatterjee, D.; Mladenov, N.; Minh, H.D.; Karadeniz, H.; Hettel, M.; et al. DETCHEM Software Package, 2.8, 2019, Karlsruhe. Available online: http://www.detchem.com (accessed on 10 August 2020).
- Raweewan, K.; Matthias, A.; Hoelderich, W.F. A review of mass transfer controlling the reaction rate in heterogeneous catalytic systems. In Mass Transfer-Advanced Aspects; InTech: London, UK, 2011; pp. 667–684. [Google Scholar] [CrossRef]
- Karakaya, C. A Novel, Hierarchically Developed Surface Kinetics for Oxidation and Reforming of Methane and Propane over Rh/Al2O3. Ph.D. Thesis, Karlsruher Institut für Technologie, Karlsruhe, Germany, 2013. [Google Scholar]
- Behrendt, F.; Deutschmann, O.; Maas, U.; Warnatz, J. Simulation and Sensitivity Analysis of the Heterogeneous Oxidation of Methane on a Platinum Foil. J. Vac. Sci. Technol. A 1995, 13, 1373–1377. [Google Scholar] [CrossRef]
- Warnatz, J.; Allendorf, M.D.; Kee, R.J.; Coltrin, M.E. A model of elementary chemistry and fluid mechanics in the combustion of hydrogen on platinum surfaces. Combust. Flame 1994, 96, 393–406. [Google Scholar] [CrossRef]
- Janardhanan, V.M.; Deutschmann, O. Computational Fluid Dynamics of Catalytic Reactors. In Modeling and Simulation of Heterogeneous Catalytic Reactions; Wiley-VCH Verlag GmbH & Co. KGaA: Weinheim, Germany, 2012; pp. 251–282. [Google Scholar]
- Hayes, R.E.; Mok, P.K.; Mmbaga, J.; Votsmeier, M. A fast approximation method for computing effectiveness factors with non-linear kinetics. Chem. Eng. Sci. 2007, 62, 2209–2215. [Google Scholar] [CrossRef]
- Mladenov, N.; Koop, J.; Tischer, S.; Deutschmann, O. Modeling of transport and chemistry in channel flows of automotive catalytic converters. Chem. Eng. Sci. 2010, 65, 812–826. [Google Scholar] [CrossRef]
- Veldsink, J.W.; Vandamme, R.M.J.; Versteeg, G.F.; Vanswaaij, W.P.M. The Use of the Dusty-Gas Model for the Description of Mass-Transport with Chemical-Reaction in Porous-Media. Chem. Eng. J. Biochem. Eng. J. 1995, 57, 115–125. [Google Scholar] [CrossRef]
- Zhu, H.Y.; Kee, R.J.; Janardhanan, V.M.; Deutschmann, O.; Goodwin, D.G. Modeling elementary heterogeneous chemistry and electrochemistry in solid-oxide fuel cells. J. Electrochem. Soc. 2005, 152, A2427–A2440. [Google Scholar] [CrossRef]
- Kong, W.; Zhu, H.Y.; Fei, Z.Y.; Lin, Z.J. A modified dusty gas model in the form of a Fick’s model for the prediction of multicomponent mass transport in a solid oxide fuel cell anode. J. Power Sources 2012, 206, 171–178. [Google Scholar] [CrossRef]
- Janardhanan, V.M.; Deutschmann, O. CFD analysis of a solid oxide fuel cell with internal reforming: Coupled interactions of transport, heterogeneous catalysis and electrochemical processes. J. Power Sources 2006, 162, 1192–1202. [Google Scholar] [CrossRef]
- Seyed-Reihani, S.A.; Jackson, G.S. Effectiveness in catalytic washcoats with multi-step mechanisms for catalytic combustion of hydrogen. Chem. Eng. Sci. 2004, 59, 5937–5948. [Google Scholar] [CrossRef]
- Deuflhard, P.; Hairer, E.; Zugck, J. One-step and extrapolation methods for differential-algebraic systems. Numer. Math. 1987, 51, 501–516. [Google Scholar] [CrossRef]
- Karadeniz, H.; Karakaya, C.; Tischer, S.; Deutschmann, O. Mass Transfer Effects in Stagnation Flows on a Porous Catalyst: Water-Gas-Shift Reaction Over Rh/Al2O3. Z. Phys. Chem. 2015, 229, 709–737. [Google Scholar] [CrossRef]
- Deutschmann, O. (Ed.) Modeling and Simulation of Heterogeneous Catalytic Reactions: From the Molecular Process to the Technical System; Wiley-VCH: Weinheim, Germany, 2012; p. 354. [Google Scholar]
© 2020 by the authors. Licensee MDPI, Basel, Switzerland. This article is an open access article distributed under the terms and conditions of the Creative Commons Attribution (CC BY) license (http://creativecommons.org/licenses/by/4.0/).