Article

Ordered Mesoporous Carbon as a Support of Pd Catalysts for CO2 Electrochemical Reduction

by
Sara Pérez-Rodríguez
1,*,
Elena Pastor
2 and
María Jesús Lázaro
1
1
Instituto de Carboquímica (CSIC), Miguel Luesma Castán 4, 50018 Zaragoza, Spain
2
Departamento de Química-Física, Universidad de La Laguna, Avda. Astrofísico Francisco Sánchez s/n, 38071 La Laguna (Tenerife), Spain
*
Author to whom correspondence should be addressed.
Catalysts 2020, 10(8), 912; https://doi.org/10.3390/catal10080912
Submission received: 23 July 2020 / Revised: 6 August 2020 / Accepted: 6 August 2020 / Published: 10 August 2020
(This article belongs to the Special Issue Electrocatalysis in Energy and Green Chemistry)

Abstract

:
Ordered mesoporous carbons (OMCs) have been used as catalyst supports of Pd nanoparticles for the electrochemical reduction of CO2 in 0.1 M KHCO3. OMC with tunable porosity and morphology were obtained by the hard-template approach using synthesized SBA-15 templates. SBA-15 materials were prepared using a mass ratio of the silica precursor (TEOS) and the surfactant (P123) of 2 or 5. After removing silica particles by a purification treatment with NaOH-ethanol or HF, different OMCs were obtained, with a developed porosity (up to 1050 m2 g−1) and ordered 2D hexagonal mesostructure (p6 mm). An increase in the TEOS/P123 ratio as well as the treatment with HF resulted in a decrease in the structural ordering of the materials. Pd nanoparticles with an average size of around 3 nm were deposited on the OMC. However, larger nanoparticles were also observed, especially for the materials obtained using a mass ratio TEOS/P123 of 5. Despite these differences, electrochemical experiments showed that CO2 was successfully reduced to other species (mainly COad) for all Pd/OMC electrocatalysts. These reduced species were adsorbed on Pd active sites, inhibiting the hydrogen evolution reaction.

1. Introduction

The electrochemical reduction of CO2 is known to be a promising alternative for the production of a wide range of valuable products, including liquid compounds (e.g., methanol, formic acid, formaldehyde, etc.) and gas fuels (such as carbon monoxide, methane, etc.) [1,2,3,4]. These compounds may be used as chemicals or directly as fuels, allowing CO2 recycling in energy carriers, i.e., the storage of electric energy.
The electrochemical valorization of CO2 has been explored on several metal electrodes, obtaining a different performance and product distribution [1,2]. A promising catalyst should drive both the CO2 activation and the posterior hydrogenation toward reduced species. Pt and Pd have attracted special attention due to their ability to adsorb hydrogen (low hydrogen overpotentials) [5,6,7,8,9,10]. Additionally, adsorbed hydrogen interacts with CO2 molecules, enhancing the adsorption of species derived from CO2 reduction (“reduced CO2” species) in the active phase [6,11]. Adsorbates are known to self-poison the Pt active sites [9,12], whereas “reduced CO2” species may behave as a reactive intermediate for CO2 electroreduction on Pd [9]. Although CO and formic acid have been mainly obtained on Pd-based catalysts, the formation of hydrocarbons has been also demonstrated at low current densities [6,7,10,13]. However, further efforts are required in order to obtain an active and selective catalyst for the electrochemical reduction of CO2.
In addition to an active metallic phase, the selection of suitable support is essential in the design of active catalysts for CO2 reduction. Carbon black is the material traditionally used as a support in the area of electrocatalysis. Carbon black consists of carbonaceous spheres, with the surface decorated by micropores, which provides a relatively high specific surface area (>250 m2 g−1) [14]. However, these micropores can be blocked by metallic nanoparticles, which can restrict the accessibility of the reagents to active centers and the diffusion of reaction products [15,16]. Nanostructured carbon materials with a much more developed porosity, such as ordered mesoporous carbons (OMCs), have emerged as promising supports in the electrocatalysis field. OMCs can reach high surface areas (up to 2000 m2 g−1), with pore sizes from 2 to 10 nm [17,18], which may facilitate the dispersion of metallic nanoparticles and improve the distribution and adsorption of CO2 on the catalyst surface [19,20]. For instance, a higher activity for the hydrogen evolution reaction (HER) and a more significant current for CO2 reduction was evidenced on Pd nanoparticles supported on OMC than those obtained on Pd/Vulcan in a previous work [5]. Furthermore, porous carbon materials induce changes in the diffusion of reaction products through the electrode, which may even favor selectivity to a given product [21,22]. The texture and structure of the support are also known to play an important role in the HER and the hydrogen diffusion hindrance along the carbon framework, as well as in the interaction strength between the metal active sites and adsorbed hydrogen, which can condition the electrochemical behavior for CO2 reduction [5].
In this work, the electrochemical behavior toward the electrochemical reduction of CO2 of different Pd/OMC catalysts has been studied. With this aim, OMCs with tunable morphological and textural properties have been obtained by the nanocasting route, using different SBA-15 silica materials as the hard template. In addition, different agents, HF or NaOH-ethanol, were employed to remove the silica matrix. The influence of the physicochemical properties of the resultant OMC materials on the activity for CO2 reduction was evaluated in KHCO3 aqueous solution (0.1 M) by cyclic voltammetry and oxidation experiments of an adsorbed monolayer of CO and of species derived from CO2 reduction (stripping experiments).

2. Results and Discussion

2.1. Physicochemical Characterization of OMC Supports

OMC materials were synthesized by the hard-nanocasting route using silica SBA-15 [5,23,24]. Briefly, the silica template SBA-15 was impregnated with the carbon source, a furan resin/acetone. The resultant composites were carbonized at 700 °C in a nitrogen atmosphere and OMCs were obtained after a silica removal treatment with NaOH-ethanol. Two different silica templates were used in the synthesis of OMC, with a mass relation (R) of the silica precursor (TEOS) and surfactant (P123) of 2 or 5. The resultant mesoporous carbons were denoted as OMC-R2 and OMC-R5, respectively. For comparison, the material obtained with a ratio TEOS/P123 of 5 was subjected to a purification treatment using HF (labeled as OMC-R5HF) instead of NaOH-ethanol.
X-ray diffraction (XRD) patterns at low angles of OMC supports are given in Figure 1. OMCs present a peak at 2Ɵ = 1°, which can be indexed as (100) diffraction, associated with a highly ordered hexagonal mesostructure (p6 mm) [25]. The relative intensity of the (100) diffraction peak, and consequently the order degree of the materials, decreases in the order OMC-R2 > OMC-R5 > OMC-R5HF, showing that an increase in the TEOS/P123 ratio and treatment with HF instead of NaOH-ethanol result in a decrease in the structural ordering. The loss of the ordering arrangement as the ratio R rises is explained by a reduction in the P123 copolymer amount, which drives silica structuration and originates the mesoporosity after calcination. Consequently, a decrease in the P123 surfactant could form non-interconnected units, resulting in partially ordered silica. By comparing the materials prepared from the same silica template (SBA- 15-R5) but using a different silica removal agent, it is remarkable that the OMC washed with HF (OMC-R5HF) presents a lower ordering degree than the same material washed with NaOH-ethanol (OMC-R5). These results suggest that HF may attack the most accessible carbon, in addition to silica particles, due to the harsh conditions of this treatment. The removal of this labile carbon led to improved thermal stability in air, as evidenced by thermogravimetric analysis (TGA; see Section 2.2). Thus, the carbon support synthesized using a ratio R = 2 and a NaOH-ethanol washing procedure (OMC-R2) presented the highest ordered structure. On the other hand, OMCs present a slight diffraction at 2Ɵ = 25° (see Section 2.2), which is attributed to the graphite (002) diffraction line, indicative of the amorphous carbon structure of OMCs.
Transmission electron microscopy (TEM) images (Figure 2) also evidenced the hexagonal ordered mesostructure of OMCs, consisting of amorphous carbon cylinders. Figure 2a displays the parallel arrangement of carbon cylinders for OMC-R2, while the p6mm structure can be observed in Figure 2b. The removal of the silica with HF led to a partial loss of the range ordering of OMC, as can be seen in Figure 2c,d, in agreement with the XRD results.
The textural parameters of OMCs determined by N2-physisorption are listed in Table 1. OMCs exhibit a developed porosity, with a specific BET (Brunauer, Emmett and Teller) surface area (SBET) of 884–1050 m2 g−1 and a total pore volume (VT) ranging from 0.55 to 0.77 cm3 g−1. A decrease in the mass ratio R resulted in an increase in the adsorption capacity, which may be ascribed to the long-range ordering of OMC-R2. These results demonstrate that it is possible to obtain OMCs with the desired texture by adjusting the mass ratio R. Additionally, the textural parameters increased substantially when HF was used to eliminate the silica particles instead of NaOH-ethanol. This can be explained by the lower ordering degree of OMC-R5HF due to the attack of the most accessible carbon, as evidenced by TEM, XRD and TGA. Finally, OMCs presented similar pore size distributions, with the only peak centered around 3.0–3.6 nm, in agreement with the values of the average pore size (Dp, Table 1).
The surface chemistry of OMC was studied by temperature-programmed desorption (TPD) analysis (Table 2). Besides the removal of silica particles, carbon purification treatments with NaOH-ethanol or HF resulted in the creation of oxygenated species. NaOH led to the introduction of a higher oxygen amount than that obtained on the carbon purified with HF. Table 2 also evidences a similar content for all the supports of basic functionalities (quinones, carbonyls and phenols) decomposed into CO, whereas the material treated with HF (OMC-R5HF) presented a noticeably lower amount of species desorbed as CO2, which are assigned to acid groups (carboxylic and lactones) [26]. In accordance with these results, a higher value of the relation CO/CO2 was obtained for OMC-R5HF (5.3). The materials washed with NaOH-EtOH presented a similar surface acidity, with CO/CO2 values around 2.

2.2. Physicochemical Characterization of the Pd/OMC Catalysts

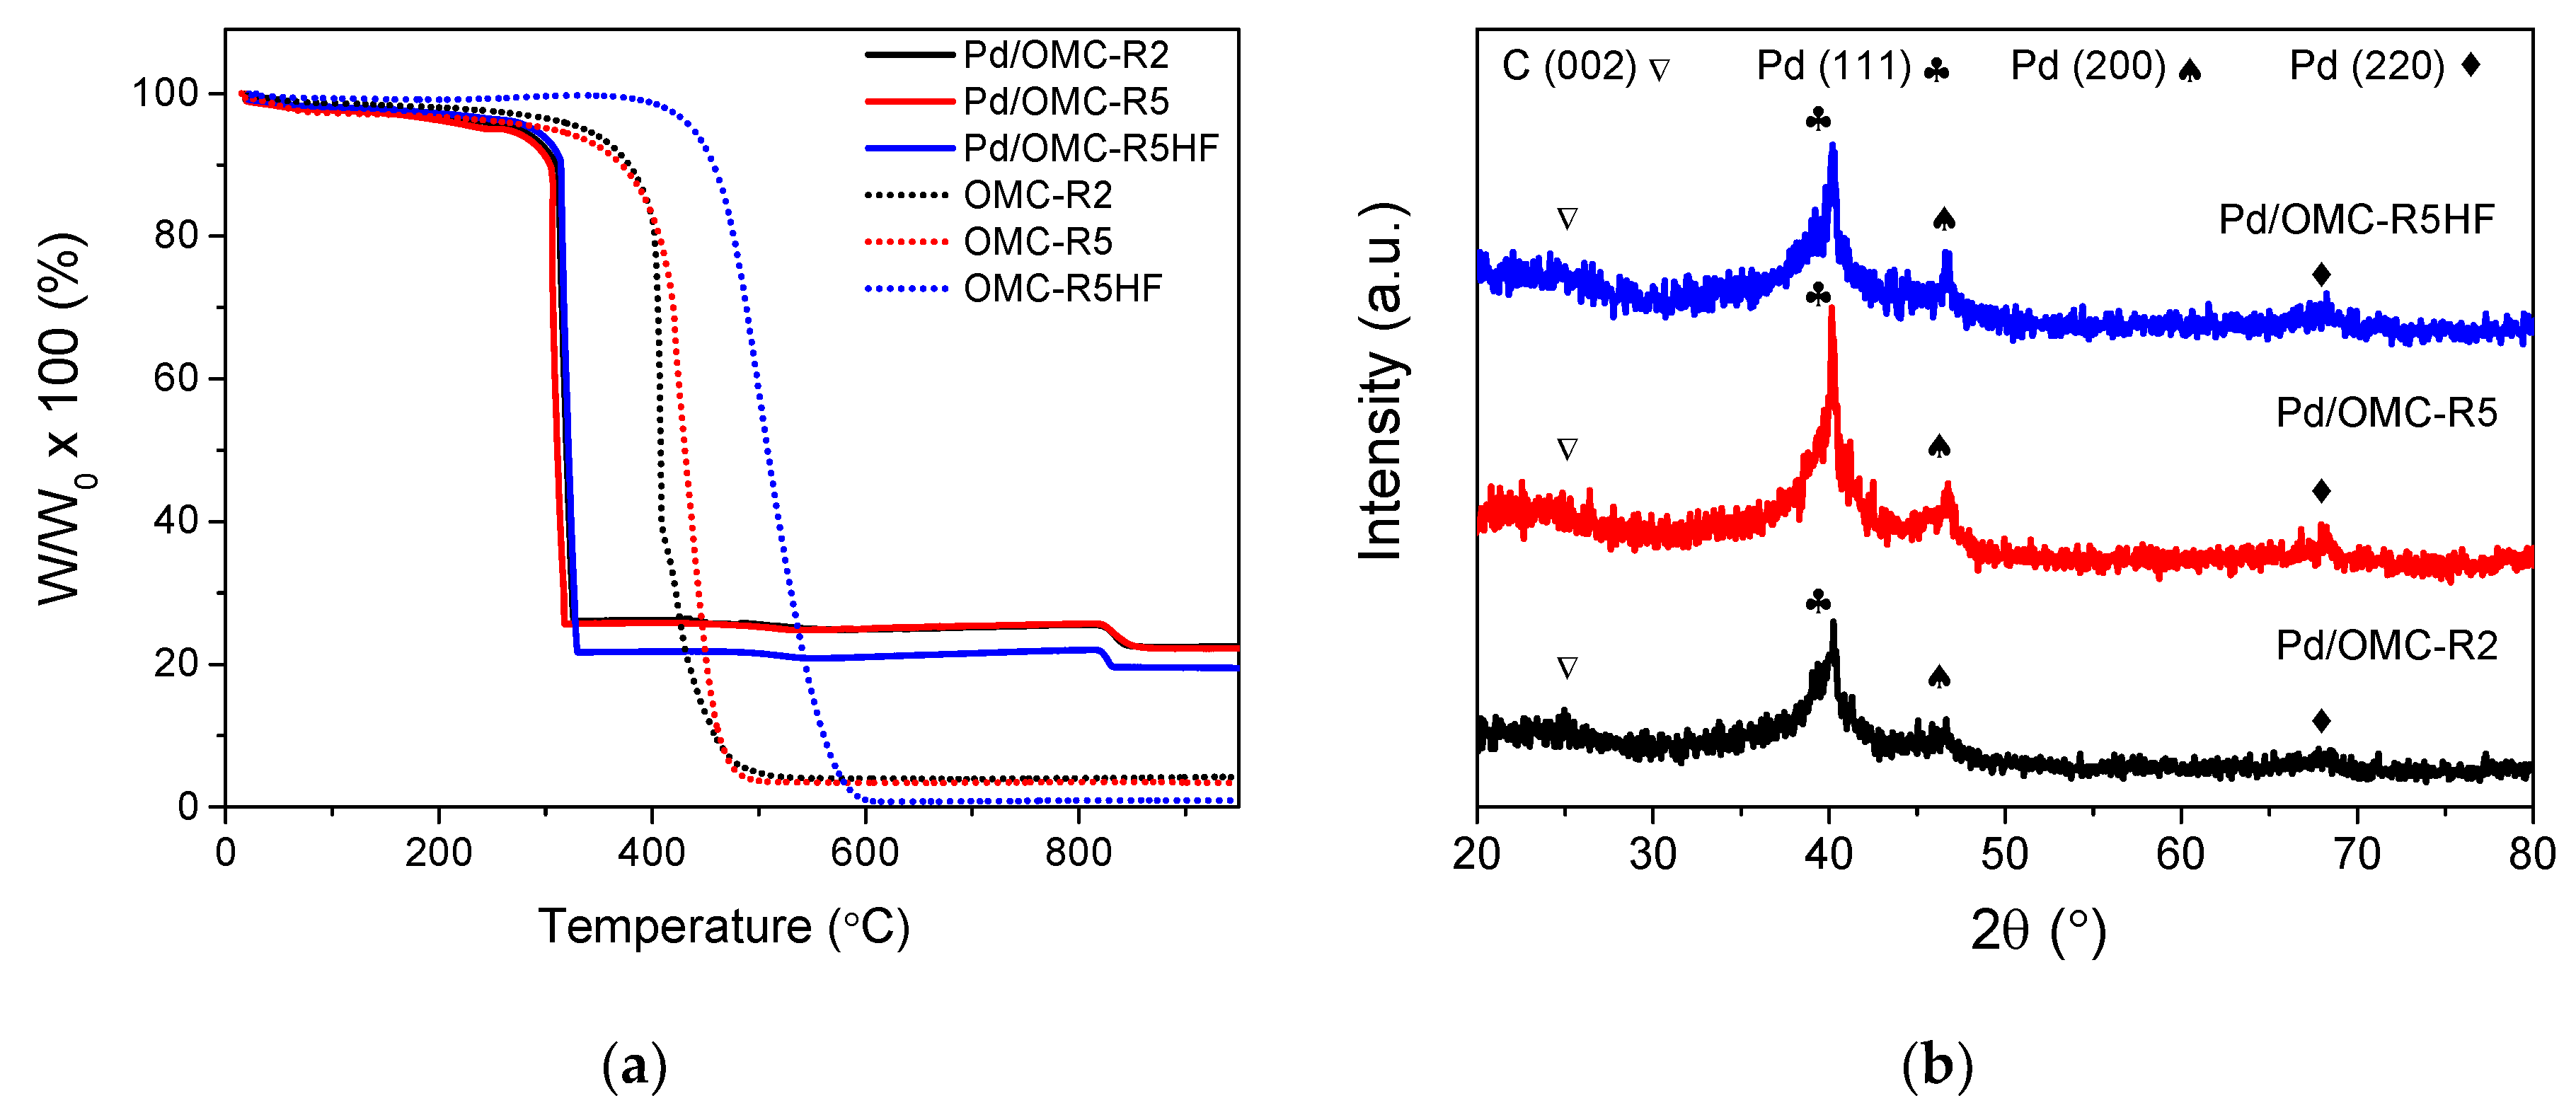
Pd/OMC (20 wt.% Pd) catalysts were synthesized by reduction with sodium borohydride, following a previous methodology [5]. Energy dispersive X-ray (EDX) evidenced a Pd loading similar to the theoretical value for all the catalysts (Table 3). Similar results were obtained by TGA. In this case, Pd amount was estimated considering the ash content of the support (Figure 3a).
The structure of Pd/C catalysts was studied by XRD (Figure 3b). Three representative peaks appeared at 2Ɵ = 39.4, 45.6 and 67.4 in all the electrocatalyst patterns, which can be ascribed to (111), (200) and (220) planes of Pd, respectively. These results indicate that Pd was deposited with an fcc structure. Pd crystallite sizes (Table 3) were obtained by Scherrer’s equation on the (220) contribution assuming K = 0.89 [27]. Similar sizes were obtained for all the catalysts, with a value of around 3–4 nm.
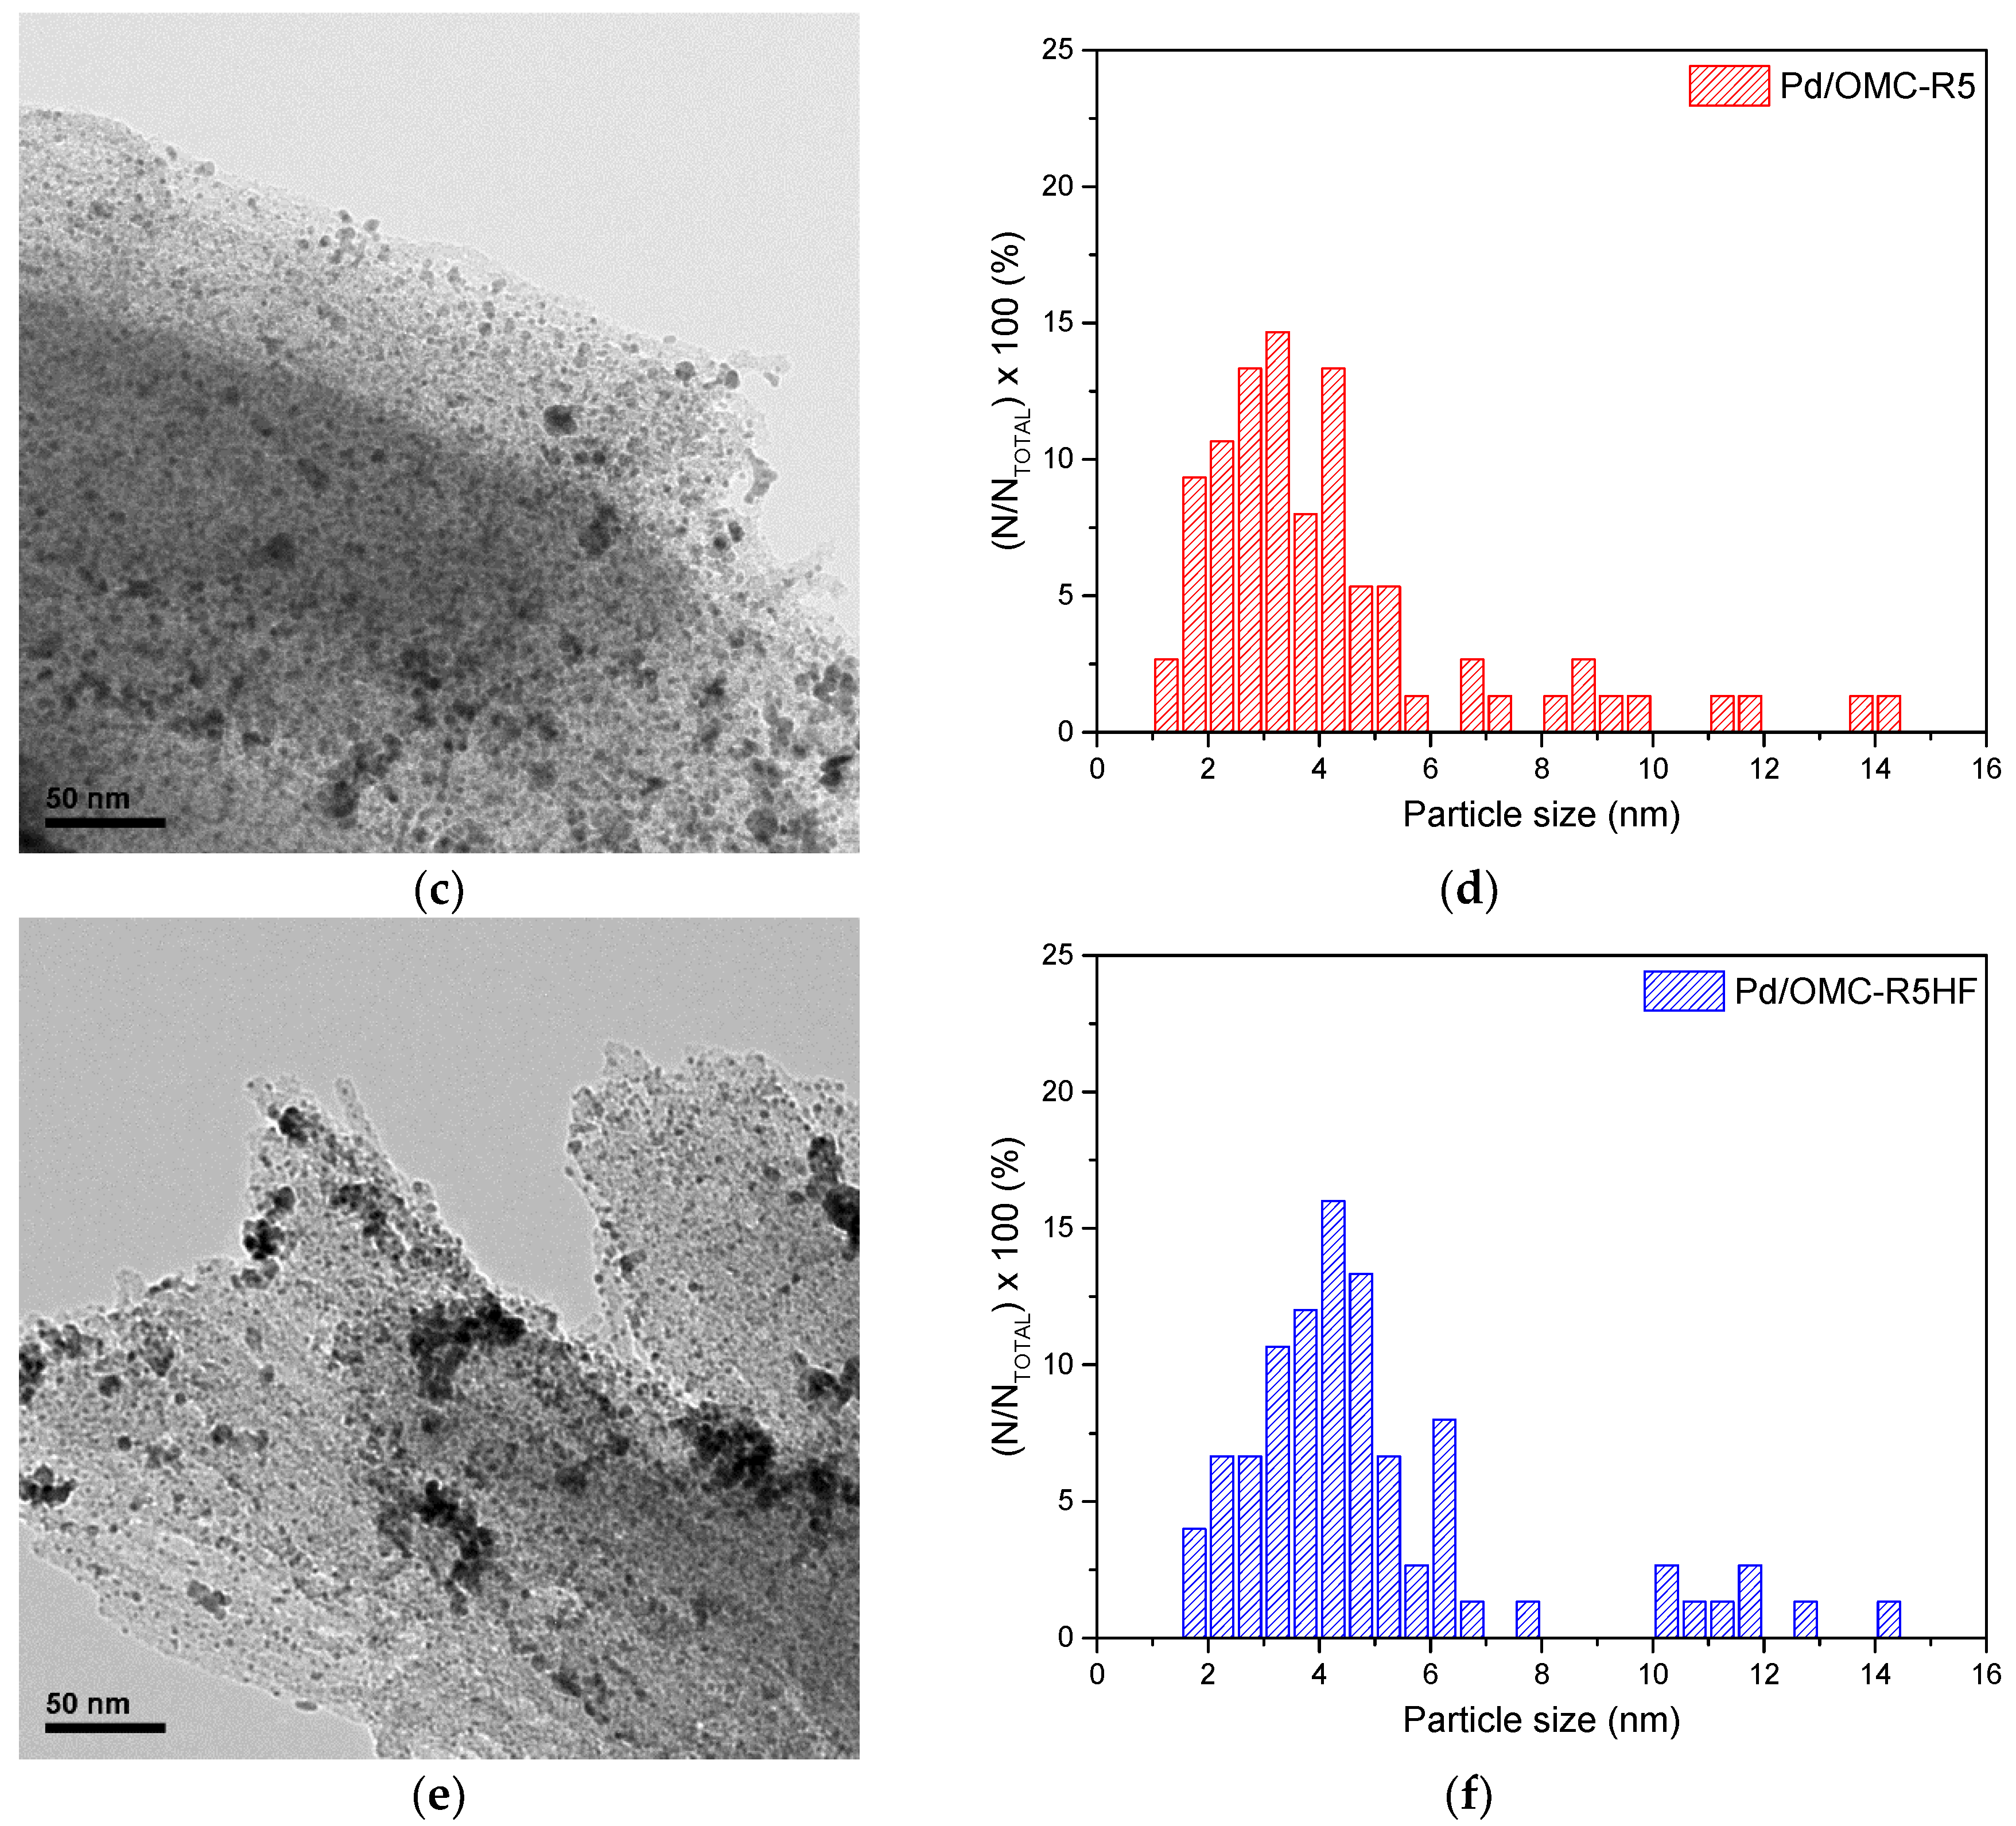
TEM micrographs together with particle size distributions of Pd/OMC catalysts are given in Figure 4. In general, uniform dispersion of Pd nanoparticles on the OMC materials was obtained. Despite the developed surface area of OMC treated with HF, some particle aggregates are evident on this catalyst (Pd/OMC-R5HF, Figure 4d). This carbon material presented the lowest oxygen amount and the least developed acidity (Table 2). Acid groups are known to improve the hydrophilicity of carbons and, consequently, these species are expected to enhance the interaction between the carbonaceous support and the metal precursor. Therefore, the higher agglomeration of Pd nanoparticles on the carbon treated with HF might be explained by a poorer carbon/metal interaction. The presence of aggregates can also be attributed to the lower ordering degree of OMC-R5HF due to the high severity of the purification treatment with HF. The average particle size was close to 3 nm for all the samples (in agreement with the XRD results), although particles with a diameter in the range 6–15 nm were also observed. Interestingly, the supports obtained with a mass ratio R = 5 (Pd/OMC-R5 and Pd/OMC-R5HF) exhibited larger nanoparticles compared to Pd/OMC-R2.

2.3. Electrochemical Characterization of Pd/OMC Catalysts

The electrochemical performance toward CO2 reduction of Pd/OMC electrocatalysts was studied in 0.1 M KHCO3, at room temperature (RT), by cyclic voltammetry. Figure 5a shows the cyclic voltammograms (CVs) recorded at 10 mV s−1 from −0.8 to 0.9 V vs. Ag/AgCl in the base electrolyte in the absence (black curves) or in the presence (red curves) of dissolved CO2. In the N2-saturated solution, hydrogen adsorption/absorption takes place at potentials more negative than −0.3 V vs. Ag/AgCl, followed by the HER below −0.6 V vs. Ag/AgCl. In the presence of CO2 (red curves), a 50 mV shift to more positive potentials occurs due to the pH differences in both electrolytes (8.4 and 6.8 in N2 and CO2-saturated electrolytes, respectively).
Different behavior toward the HER of Pd/OMC catalysts is evident by comparison of the currents at −0.8 V vs. Ag/AgCl in the absence of CO2. Pd/OMC-R5 exhibited the highest cathodic current, indicating improved activity for the HER at this catalyst surface. This higher activity toward the HER on Pd/OMC-R5 may be associated with the good dispersion of Pd nanoparticles with a larger average size on this catalyst surface, as was observed by TEM (Figure 4). In this context, Pd/OMC-R2 presented a lower fraction of particles with an average size > 4 nm, whereas some particle agglomeration was found on Pd/OMC-R5HF. Particle size effect on Pd/C catalysts has been investigated for the HER by other authors [28,29]. For example, Zheng et al. [29] reported an increase in the hydrogen evolution specific exchange current density as the particle size increases, ranging from 3 to 42 nm in both acid and basic media. They attributed this particle size effect to the distribution of surface facets among different-sized Pd nanoparticles, together with the structure sensitivity of the activity on different facets [29].
CVs were also recorded from −1.4 to 0.8 V vs. Ag/AgCl in the electrolyte saturated with N2 and CO2 (Figure 5b). In the CO2-saturated voltammograms (red curve) a peak around −1.0 vs. Ag/AgCl appears during the cathodic sweep, whereas hydrogen oxidation is partly blocked in the anodic scan. These results can be explained by the reduction of CO2 to other species (reduced CO2 species, (CO2)red) which are adsorbed on the active sites of Pd/OMC catalysts, inhibiting the HER [5,6,11]. The latter is more significant for Pd/OMC-R5, which is explained by a higher coverage of (CO2)red species. In this context, this electrocatalyst exhibited the highest current for the HER. Hydrogen plays a significant role in the formation of adsorbates evolved from CO2 and, hence, a higher Had coverage could result in a more effective interaction with CO2 molecules. In fact, hydrogen evolution is totally blocked on Pd/OMC-R5 due to the presence of adsorbed compounds, whereas the HER is still evident for Pd/OMC-R2 and Pd/OMC-R5HF due to a lower coverage of active sites by (CO2)red species in these materials. In agreement with these results, two oxidation peaks are evident at 0.1 and 0.3 V during the anodic sweep of Pd/OMC-R5 in the presence of CO2. These peaks are associated with the oxidation of the adsorbates derived from CO2 reduction, mainly COad, but also COOHad or COHad can be generated [6,11,13,30].
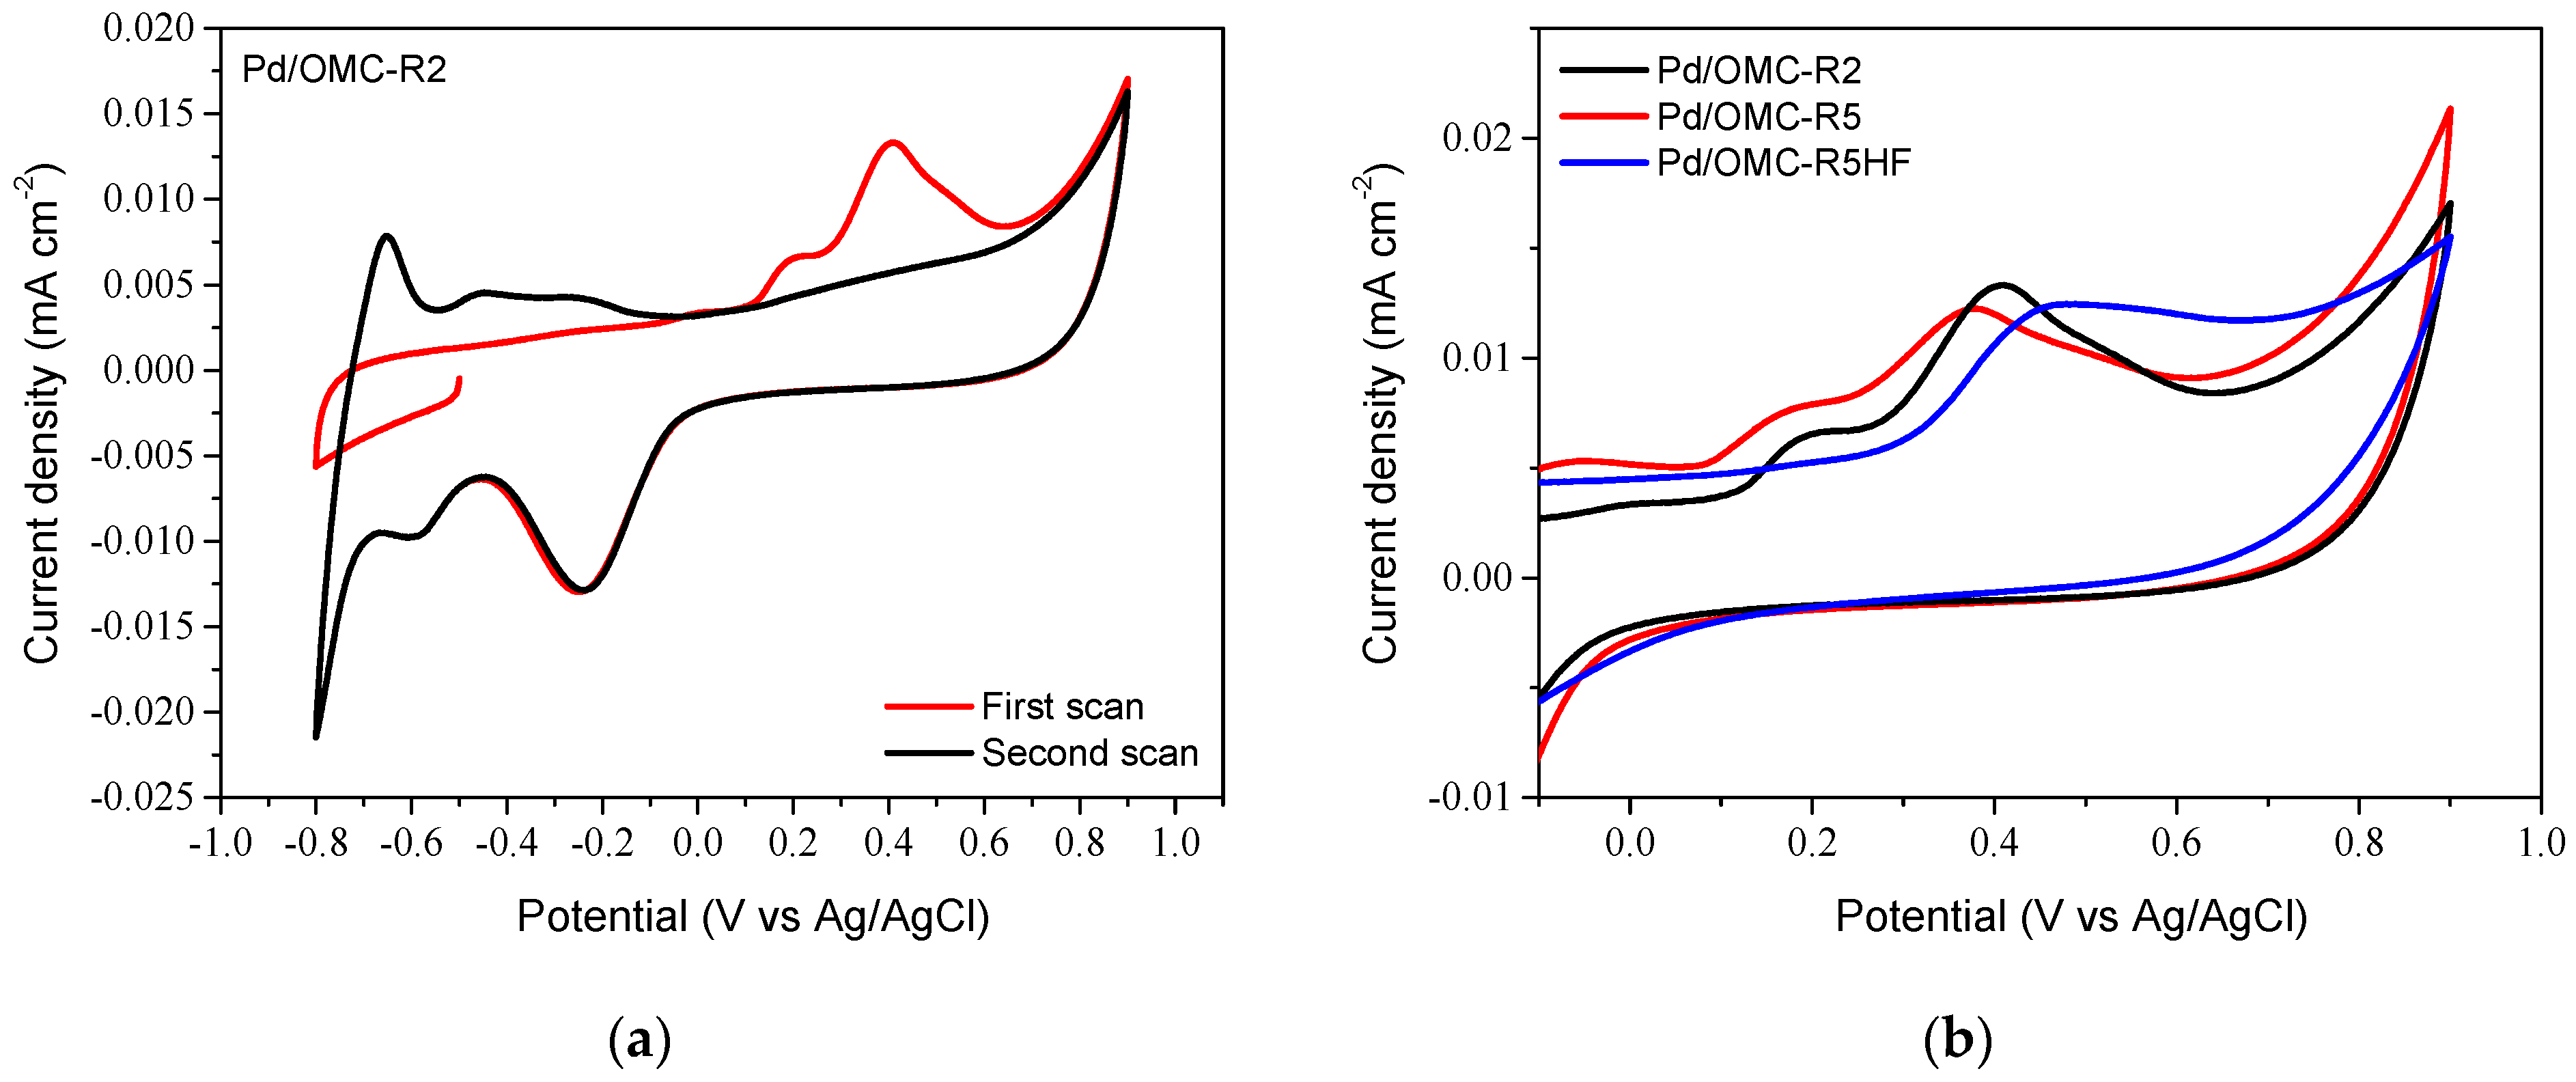
In order to obtain deeper insights into the formation of adsorbed species from CO2 reduction on Pd/OMC catalysts and in the nature of these adsorbates, CO and reduced CO2 stripping voltammograms were recorded in 0.1 M KHCO3. Figure 6a shows an example of a CO stripping curve for the Pd catalyst supported on OMC-R2. Hydrogen adsorption/oxidation features are completely blocked during the first scan and CO oxidation is evident in the potential window from 0.1 to 0.7 V vs. Ag/AgCl. Figure 6b shows the comparison of CO oxidation curves (first scan of CO stripping voltammogram) of Pd/OMC catalysts. Pd nanoparticles supported on OMCs purified with NaOH-ethanol (Pd/OMC-R2 and Pd/OMC-R5) exhibited a bimodal distribution for CO oxidation, with the first (I) and second peaks (II) centered around 0.2 V and 0.4 V vs. Ag/AgCl, respectively. Other authors have also reported bimodal CO oxidation profiles on carbon-supported Pd nanoparticles [31,32,33]. In contrast, a single peak centered around 0.5 V vs. Ag/AgCl is observed for Pd/OMC-R5HF. In addition, the onset potential for CO oxidation increases following the sequence Pd/OMC-R5 < Pd/OMC-R2 < Pd/OMC-R5HF. These results indicate an improved condition for CO oxidation on the materials obtained after silica removal with NaOH-ethanol, whereas the treatment with HF resulted in poor activity for CO oxidation.
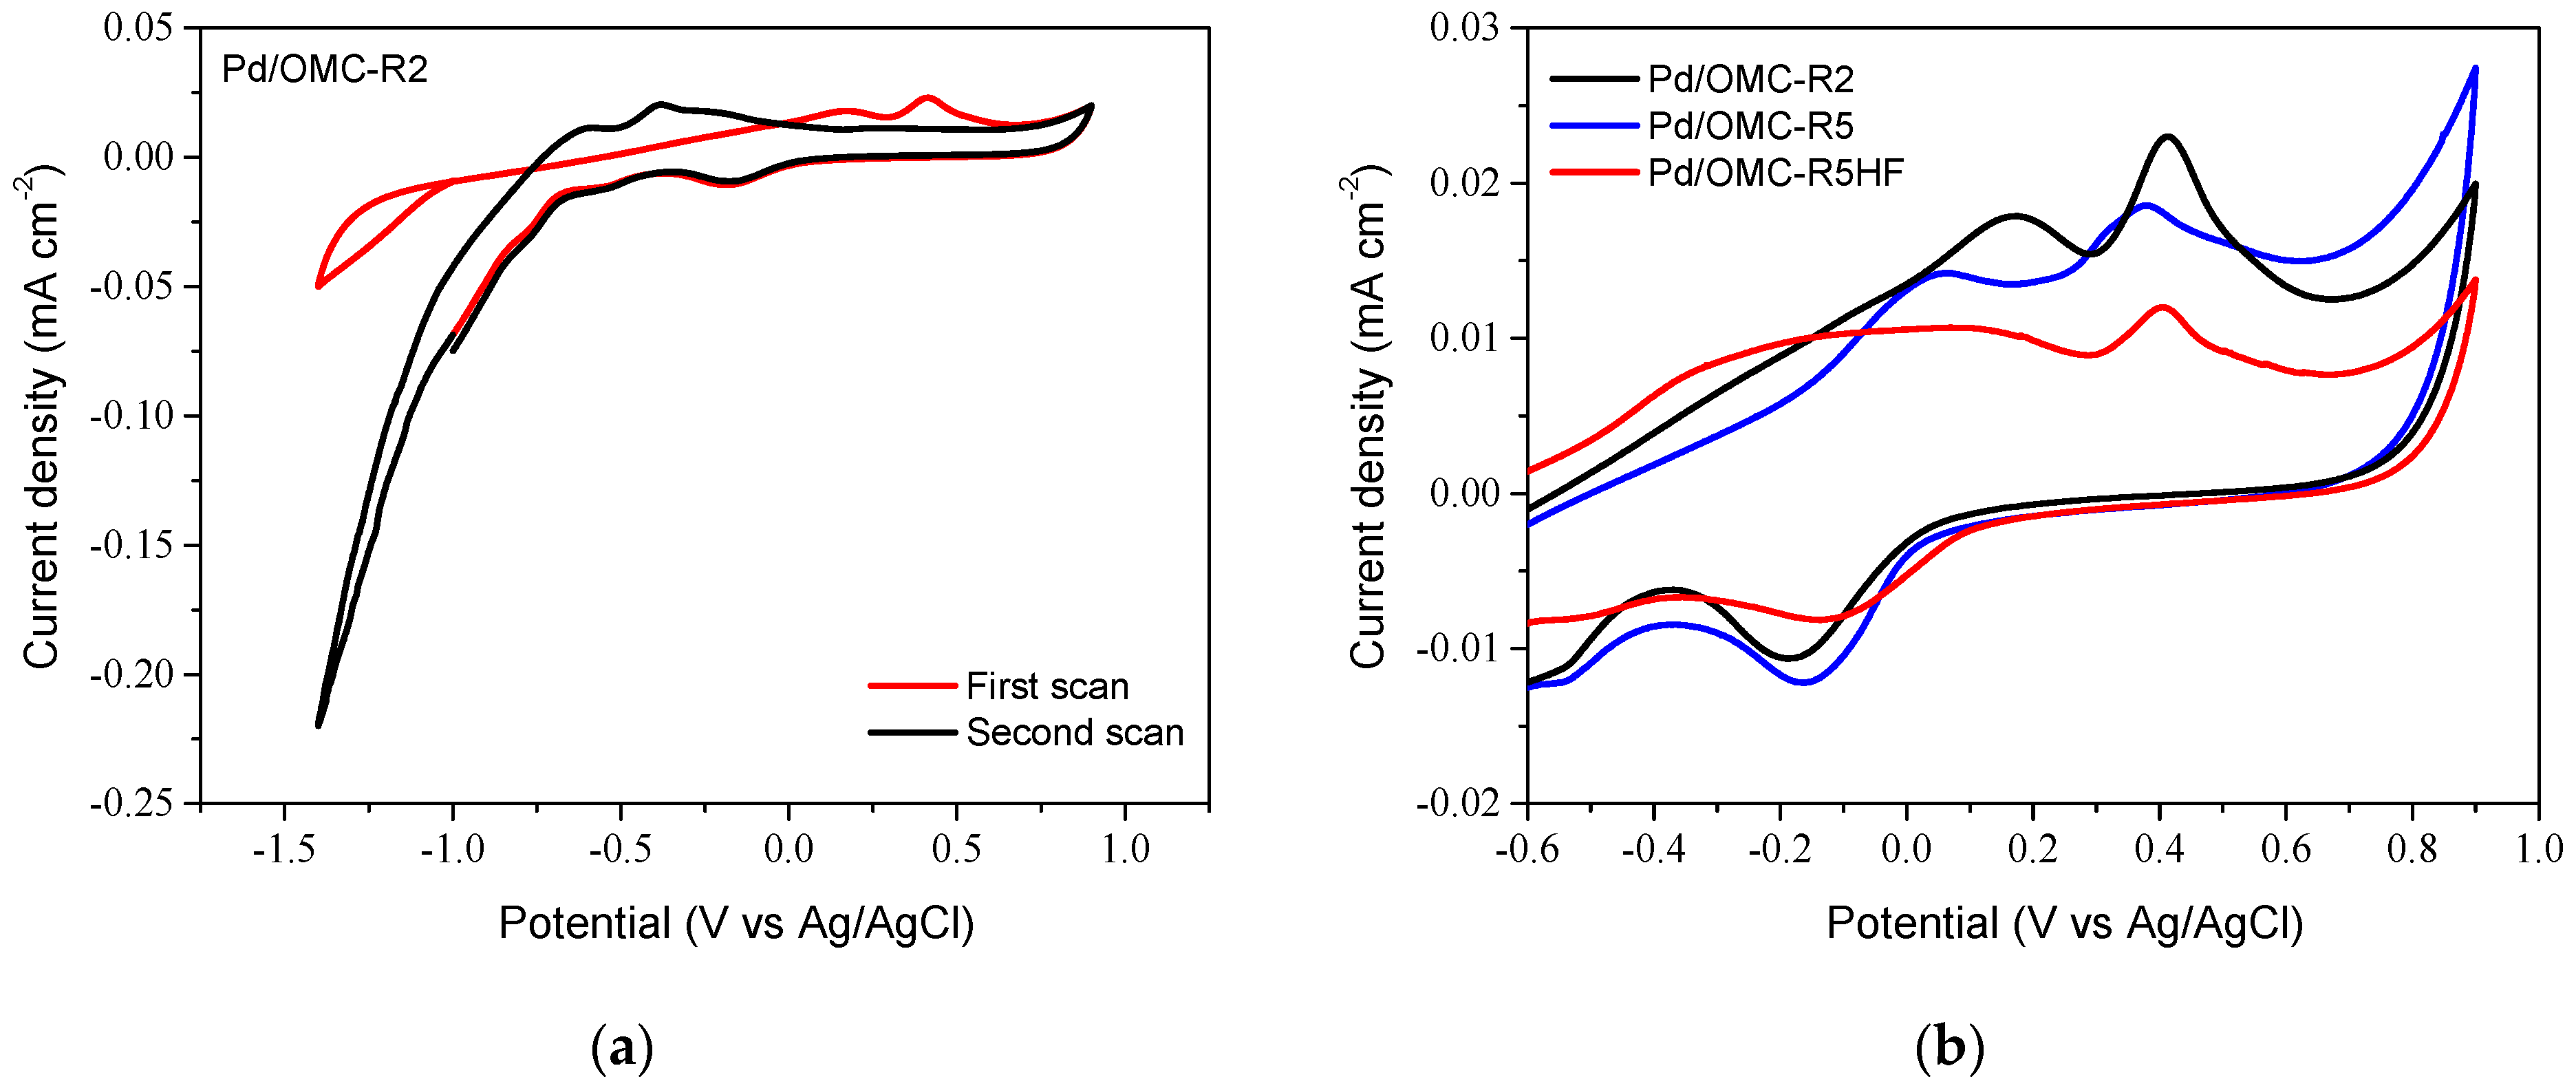
“Reduced CO2” stripping experiments were also carried out in the CO2-saturated base electrolyte. The potential was set to −1.0 V vs. Ag/AgCl under CO2 bubbling. Under these conditions, CO2 is reduced to other species, which are adsorbed on Pd nanoparticles. Then, the CO2 excess was purged from the electrolyte with N2 and a CV was recorded from −1.4 to 0.8 V vs. Ag/AgCl at 10 mV s−1. Figure 7a shows the “reduced CO2” stripping voltammograms of Pd/OMC-R2. In contrast to the results obtained in a CO2-saturated electrolyte (Figure 5b), the current related to hydrogen evolution is completely blocked for Pd nanoparticles deposited on OMC-R2. Similar results (not shown) were obtained when a ratio of TEOS/P123 = 5 was used for the synthesis of the support (Pd/OMC-R5 and Pd/OMC-R5HF). Figure 7b shows a comparison of the first scan of the “reduced CO2” stripping voltammograms for all the catalysts. Pd/OMC samples exhibited two peaks associated with the oxidation of adsorbed species derived from the electrochemical CO2 reduction. The first contribution takes place in a wide potential region (from −0.6 to 0.3 V vs. Ag/AgCl), followed by a second, sharper one at ~0.4 V vs. Ag/AgCl.
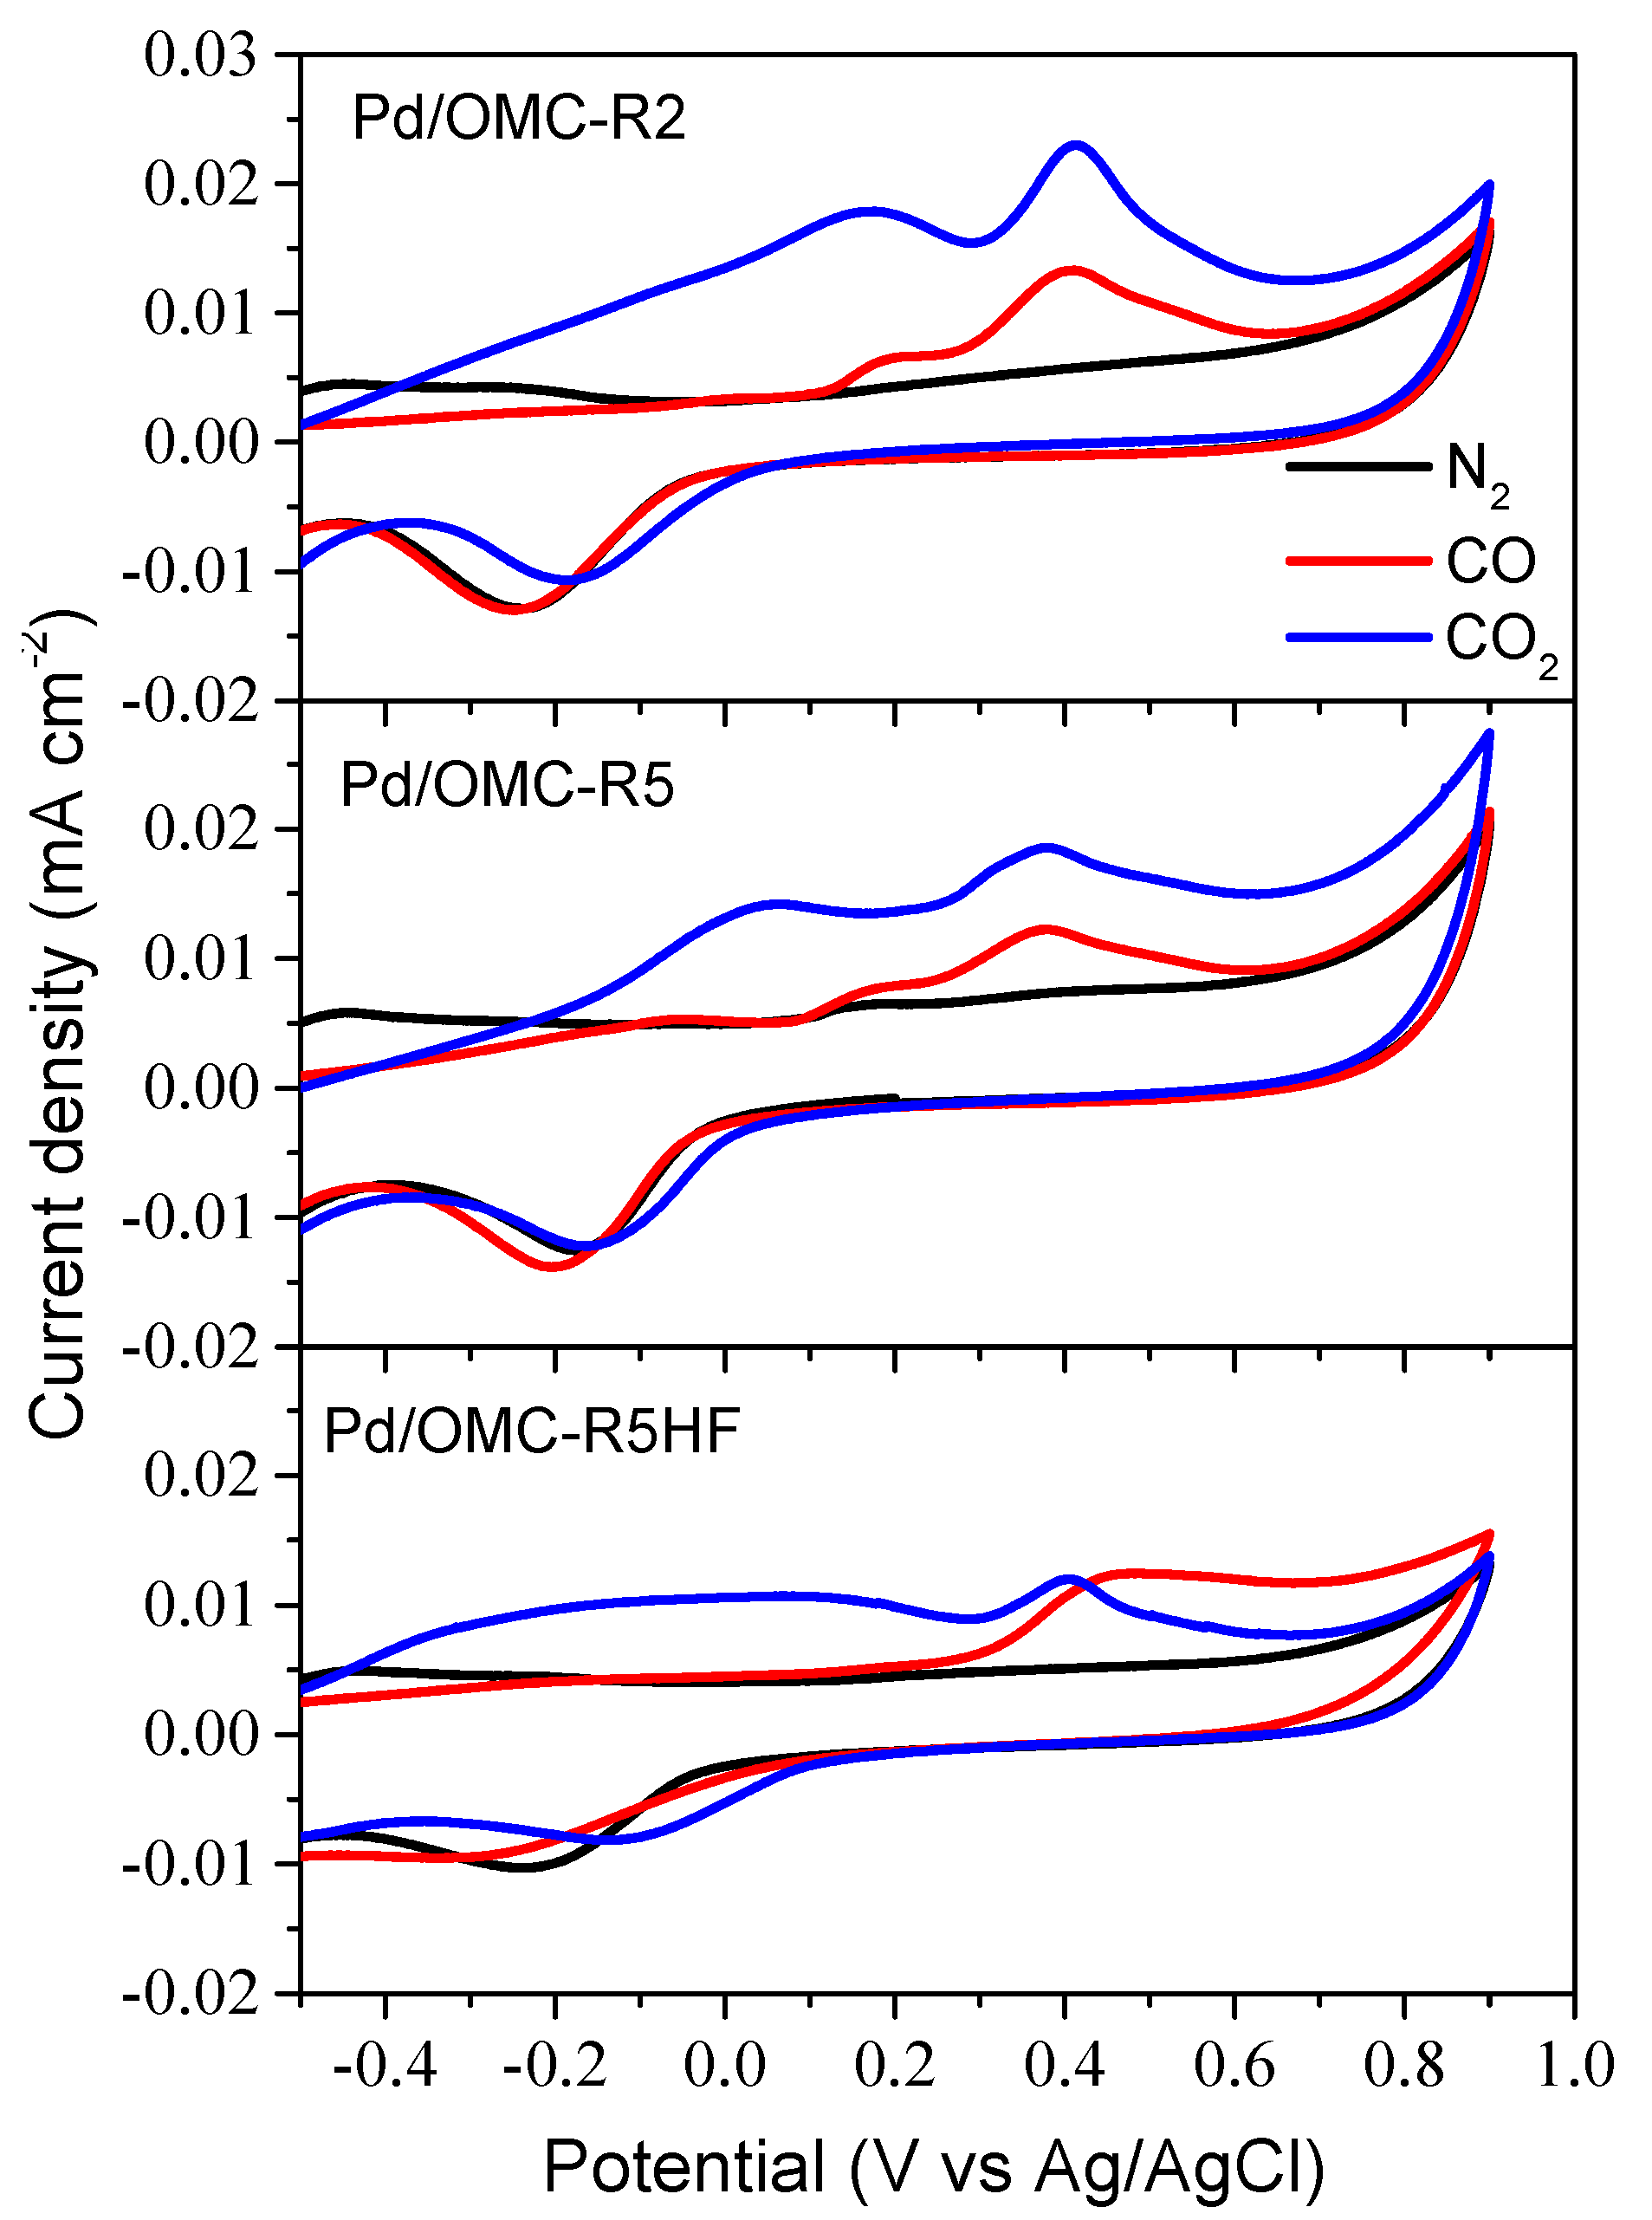
A comparison of the CO and “reduced CO2” stripping voltammograms for the Pd/OMC catalysts is presented in Figure 8. In all cases, the charge associated with the oxidation of adsorbates from CO2 reduction is more significant than that of CO oxidation. Additionally, the oxidation of (CO2)red species takes place at more negative potentials. The latter might be explained by the reduction of CO2 not only to COad but also to other adsorbates (e.g., COOHad or COHad), at potentials more negative than −0.8 V vs Ag/AgCl. The ratio between the oxidation charges ascribed to “reduced CO2” and CO ( k = Q C O 2 , r e d / Q C O ) was obtained by the integration of the stripping curves (Figure 6b and Figure 7b). Similar k values were obtained for Pd/OMC electrocatalysts: 2.8, 2.2 and 2.4 for Pd/OMC-R2, Pd/OMC-R5 and Pd/OMC-R5HF, respectively. Possible adsorbates (COad, COOHad, COHad) involve different interchanged electrons (2e for COad, 1 for COOHad and 3 for COHad), and hence, different oxidation charges when are oxidized to CO2. Therefore, k values are related to the adsorbate distribution on Pd/OMC catalysts. However, the coverage of (CO2)red species on Pd nanoparticles blocks the hydrogen region, and hence hydrogen oxidation might partially overlap with the oxidation of adsorbates from CO2 reduction. Therefore, the oxidation of absorbed hydrogen may also contribute to the higher oxidation charge in the “reduced CO2” strippings.

3. Materials and Methods

3.1. Synthesis of OMC Supports and Pd/OMC Catalysts

OMC supports were produced by the nanocasting route from SBA-15 silica [5,23,24,34]. Briefly, SBA-15 silica materials were synthesized using TEOS (tetraethyl orthosilicate, 98 wt.%, Aldrich, St. Louis, MO, USA) as silica source and Pluronic P123 (EO20PO70EO20, Aldrich) in order to generate mesoporosity. Two silica templates, SBA-15-R2 and SBA-15-R5, were prepared using a TEOS/P123 mass ratio of 2 and 5, respectively. OMCs were obtained from the silica templates by impregnation with furan resin/acetone, followed by carbonization at 700 °C for 3 h (N2 atmosphere). Carbonized samples were purified with 1.1 M NaOH (98 wt.%, Panreac, Barcelona, Spain) ethanol/water solution (0.3:1 v/v) or with HF (47–51 wt.%, Panreac) to remove the silica particles.
The Pd electrocatalysts were synthesized by impregnation of the carbon support with the metal precursor and posterior reduction with sodium borohydride, following the procedure previously reported in [5]. Briefly, an aqueous 3.0 mM Na2PdCl4 (98 wt.%, Sigma-Aldrich) solution was added to a water carbon dispersion under sonication. Afterward, the pH was fixed to 5.0 using NaOH (98 wt.%, Panreac). Then, the metal precursor was reduced by an aqueous 48.0 mM NaBH4 (99 wt.%, Sigma-Aldrich) solution. Finally, catalysts were filtered, washed and dried overnight. The theoretical Pd loading was 20 wt.%.

3.2. Physicochemical Characterization

TEM micrographs were taken by means of a JEOL-2000 FXII (Tokyo, Japan) microscope. The crystal size of Pd nanoparticles was determined by the Digital Micrograph software, considering around 200 particles per sample.
XRD patterns of the materials were obtained on a Bruker AXS D8 Advance diffractometer (θ–θ configuration; Cu Kα radiation, λ = 0.15406 nm, Bruker AXS, Karlsruhe, Germany). Scans were performed at 0.24° min−1 for 2Ɵ values from 0.5° to 4° for OMC and at 1° min−1 from 10° to 80° for Pd/OMC catalysts.
N2 physisorption was carried out at 77 K in a Micromeritics ASAP 2020 (Norcross, GA, USA). The BET equation was used to determine the total surface area, whereas the total pore volume was calculated by the single point method at P/P0 = 0.99. Pore size distributions were determined from the analysis of the adsorption isotherm by the BJH (Barrett, Joyner and Halenda) methodology.
The metal loading of the electrocatalysts was determined by an EDX analyzer Röntec XFlash Si(Li) coupled to a scanning electron microscope (Hitachi S-3400N). TGA analyses in air were carried out on a thermogravimetric system (SETARAM Setsys Evolution) from RT to 950 °C (5 °C min−1).
TPD analyses of the carbon materials were performed by means of an AutoChem II 2920 (Micromeritics, USA) analyzer under a flow of Ar (50 mL min−1) from RT to 1000 °C (10 °C min−1). CO and CO2 desorbed amounts were detected by mass spectroscopy (Pfeiffer Vacuum ThermoStarTM) and quantified by integration of the area under the flow rate versus time curve.

3.3. Electrochemical Characterization

Electrochemical measurements were carried out in a conventional electrochemical cell at RT using a potentiostat-galvanostat Autolab PGSTAT302 (Ecochemie, Metrohm, Utrecht, The Netherlands). A high surface area carbon rod was employed as a counter electrode and an Ag/AgCl/3M KCl electrode as reference. All potentials in the text are referred to Ag/AgCl/3M KCl. The working electrodes were prepared by depositing a layer of the electrocatalyst on a 7.0 mm diameter glassy carbon disc (SIGRADUR® G). Catalyst inks were prepared by dispersing 2 mg of catalyst and 15 µL of Nafion (5 wt.%, Aldrich) in 500 μL of deionized water (Millipore Milli-Q system) under sonication. A volume of 10 μL of the suspension was deposited over the glassy carbon disc and dried at RT.
The base electrolyte was a 0.1 M KHCO3 (99.99%, Sigma Aldrich) aqueous solution saturated in nitrogen. First, 20 scans were recorded at 20 mV s−1 from −0.8 to 0.9 V in the working electrolyte to activate the catalyst surface.
CO stripping experiments were carried out by adsorbing CO (N47) on the catalytic active sites at –0.5 V vs. Ag/AgCl for 30 min. Then, the CO excess was purged with N2 for 30 min. CVs were recorded from −0.8 to 0.9 V at 10 mV s−1 for three scans. Electrochemical active areas of Pd catalysts were determined by the integration of the oxidation peaks of the CO stripping voltammograms, assuming a charge of 210 µC cm−2 involved in the oxidation of a bridge adsorbed CO monolayer (COad) [35,36]. Currents were normalized by these electroactive areas, resulting in the current densities (J, A cm−2) given in the text.
“Reduced CO2” stripping voltammograms were obtained after CO2 saturation of the 0.1 M KHCO3 base electrolyte. Then, the potential was set to −1.0 V for 30 min. Under these conditions, CO2 is reduced, forming adsorbed species onto the Pd surface. After this, the solution was again saturated with N2 for 40 min. Finally, the potential was cycled between −1.4 and 0.9 V at 10 mV s−1 for three scans.

4. Conclusions

Pd/OMCs were synthesized by the nanocasting approach and tested for the electrochemical reduction of CO2. Moreover, the influence of the TEOS/P123 ratio and the purification treatment on the physicochemical properties of OMC and the resultant Pd electrocatalysts were evaluated by different analytical and electrochemical techniques.
OMCs showed a hexagonal ordered structure, consisting of non-crystalline carbon cylinders, with a high BET surface area (812–1050 m2 g−1) and pore volume (0.55–0.77 cm3 g−1). An increase in the TEOS/P123 mass ratio or the use of HF as a silica removal agent resulted in a decrease in the structural ordering of OMC, with OMC-R5HF being the material with a less ordered arrangement. All catalysts presented a Pd average particle size of around 3 nm, although larger particles were also observed, especially for the materials obtained using an R = 5 (Pd/OMC-R5 and Pd/OMC-R5HF) with particles with a diameter in the range 5–15 nm. A good dispersion of the metal phase onto OMC was obtained, except for Pd/OMC-R5HF, where some agglomeration was evident due to the lower amount of oxygen functional groups on this carbon which favor the anchoring of metal particles.
Pd/OMC-R5 presented the highest activity for the HER with a current density of around −0.06 mA cm−2 at −0.8 V vs. Ag/AgCl in 0.1 M KHCO3, whereas values of −0.04 and −0.03 mA cm−2 were obtained for Pd/OMC-R2 and Pd/OMC-R5HF, respectively. This better hydrogen affinity on the former catalyst resulted in an improved condition for the formation of adsorbed species (mainly COad) in the presence of CO2. Adsorption experiments of CO and “reduced CO2” evidenced a higher oxidation charge from “reduced CO2” stripping for all the catalysts, which may be explained by the formation of other adsorbates in addition to COad.

Author Contributions

Conceptualization, S.P.-R.; methodology, S.P.-R.; investigation, S.P.-R., E.P. and M.J.L. writing—original draft preparation, S.P.-R. writing—review and editing, S.P.-R., E.P. and M.J.L. funding acquisition, M.J.L. All authors have read and agreed to the published version of the manuscript.

Funding

The authors gratefully acknowledge the financial support given to the Fuel Conversion Group by the Aragón Government (T06).

Conflicts of Interest

The authors declare no conflict of interest.

References

  1. Hori, Y.; Wakebe, H.; Tsukamoto, T.; Koga, O. Electrocatalytic process of CO selectivity in electrochemical reduction of CO2 at metal electrodes in aqueous media. Electrochim. Acta 1994, 39, 1833–1839. [Google Scholar] [CrossRef]
  2. Martín, A.J.; Larrazábal, G.O.; Pérez-Ramírez, J. Towards sustainable fuels and chemicals through the electrochemical reduction of CO2: Lessons from water electrolysis. Green Chem. 2015, 17, 5114–5130. [Google Scholar] [CrossRef]
  3. Vasileff, A.; Zheng, Y.; Qiao, S.Z. Carbon Solving Carbon’s Problems: Recent Progress of Nanostructured Carbon-Based Catalysts for the Electrochemical Reduction of CO2. Adv. Energy Mater. 2017, 7, 1700759. [Google Scholar] [CrossRef]
  4. Nitopi, S.; Bertheussen, E.; Scott, S.B.; Liu, X.; Engstfeld, A.K.; Horch, S.; Seger, B.; Stephens, I.E.L.; Chan, K.; Hahn, C.; et al. Progress and Perspectives of Electrochemical CO2 Reduction on Copper in Aqueous Electrolyte. Chem. Rev. 2019, 119, 7610–7672. [Google Scholar] [CrossRef] [PubMed] [Green Version]
  5. Pérez-Rodríguez, S.; Rillo, N.; Lázaro, M.J.; Pastor, E. Pd catalysts supported onto nanostructured carbon materials for CO2 valorization by electrochemical reduction. Appl. Catal. B Environ. 2015, 163, 83–95. [Google Scholar] [CrossRef]
  6. Kolbe, D.; Vielstich, W. Adsorbate formation during the electrochemical reduction of carbon dioxide at palladium—A DEMS study. Electrochim. Acta 1996, 41, 2457–2460. [Google Scholar] [CrossRef]
  7. Cai, F.; Gao, D.; Zhou, H.; Wang, G.; He, T.; Gong, H.; Miao, S.; Yang, F.; Wang, J.; Bao, X. Electrochemical promotion of catalysis over Pd nanoparticles for CO2 reduction. Chem. Sci. 2017, 8, 2569–2573. [Google Scholar] [CrossRef] [Green Version]
  8. Umeda, M.; Niitsuma, Y.; Horikawa, T.; Matsuda, S.; Osawa, M. Electrochemical Reduction of CO2 to Methane on Platinum Catalysts without Overpotentials: Strategies for Improving Conversion Efficiency. ACS Appl. Energy Mater. 2020, 3, 1119–1127. [Google Scholar] [CrossRef] [Green Version]
  9. Taguchi, S.; Aramata, A.; Enyo, M. Reduced CO2 on polycrystalline Pd and Pt electrodes in neutral solution: Electrochemical and in situ Fourier transform IR studies. J. Electroanal. Chem. 1994, 372, 161–169. [Google Scholar] [CrossRef]
  10. Gao, D.; Zhou, H.; Cai, F.; Wang, J.; Wang, G.; Bao, X. Pd-Containing Nanostructures for Electrochemical CO2 Reduction Reaction. ACS Catal. 2018, 8, 1510–1519. [Google Scholar] [CrossRef]
  11. Arévalo, M.C.; Gomis-Bas, C.; Hahn, F.; Beden, B.; Arévalo, A.; Arvia, A.J. A contribution to the mechanism of “reduced” CO2 adsorbates electro-oxidation from combined spectroelectrochemical and voltammetric data. Electrochim. Acta 1994, 39, 793–799. [Google Scholar] [CrossRef]
  12. Pérez-Rodríguez, S.; Barreras, F.; Pastor, E.; Lázaro, M.J. Electrochemical reactors for CO2 reduction: From acid media to gas phase. Int. J. Hydrog. Energy 2016, 41, 19756–19765. [Google Scholar] [CrossRef]
  13. Azuma, M.; Hashimoto, K.; Watanabe, M.; Sakata, T. Electrochemical reduction of carbon dioxide to higher hydrocarbons in a KHCO3 aqueous solution. J. Electroanal. Chem. Interfacial Electrochem. 1990, 294, 299–303. [Google Scholar] [CrossRef]
  14. Bezerra, C.W.B.; Zhang, L.; Liu, H.; Lee, K.; Marques, A.L.B.; Marques, E.P.; Wang, H.; Zhang, J. A review of heat-treatment effects on activity and stability of PEM fuel cell catalysts for oxygen reduction reaction. J. Power Sources 2007, 173, 891–908. [Google Scholar] [CrossRef]
  15. Antolini, E. Carbon supports for low-temperature fuel cell catalysts. Appl. Catal. B Environ. 2009, 88, 1–24. [Google Scholar] [CrossRef]
  16. Sharma, S.; Pollet, B.G. Support materials for PEMFC and DMFC electrocatalysts—A review. J. Power Sources 2012, 208, 96–119. [Google Scholar] [CrossRef]
  17. Ma, T.-Y.; Liu, L.; Yuan, Z.-Y. Direct synthesis of ordered mesoporous carbons. Chem. Soc. Rev. 2013, 42, 3977–4003. [Google Scholar] [CrossRef]
  18. Eftekhari, A.; Fan, Z. Ordered mesoporous carbon and its applications for electrochemical energy storage and conversion. Mater. Chem. Front. 2017, 1, 1001–1027. [Google Scholar] [CrossRef]
  19. Guo, Z.; Xiao, N.; Li, H.; Wang, Y.; Li, C.; Liu, C.; Xiao, J.; Bai, J.; Zhao, S.; Qiu, J. Achieving efficient electroreduction CO2 to CO in a wide potential range over pitch-derived ordered mesoporous carbon with engineered Ni-N sites. J. CO2 Util. 2020, 38, 212–219. [Google Scholar] [CrossRef]
  20. Zhou, S.; Xu, H.; Yuan, Q.; Shen, H.; Zhu, X.; Liu, Y.; Gan, W. N-Doped Ordered Mesoporous Carbon Originated from a Green Biological Dye for Electrochemical Sensing and High-Pressure CO2 Storage. ACS Appl. Mater. Interfaces 2016, 8, 918–926. [Google Scholar] [CrossRef]
  21. Centi, G.; Perathoner, S.; Winè, G.; Gangeri, M. Electrocatalytic conversion of CO2 to long carbon-chain hydrocarbons. Green Chem. 2007, 9, 671–678. [Google Scholar] [CrossRef]
  22. Li, W.; Herkt, B.; Seredych, M.; Bandosz, T.J. Pyridinic-N groups and ultramicropore nanoreactors enhance CO2 electrochemical reduction on porous carbon catalysts. Appl. Catal. B Environ. 2017, 207, 195–206. [Google Scholar] [CrossRef]
  23. Pérez-Rodríguez, S.; Sebastián, D.; Lázaro, M.J. Insights on the Electrochemical Oxidation of Ordered Mesoporous Carbons. J. Electrochem. Soc. 2020, 167, 024511. [Google Scholar] [CrossRef]
  24. Pérez-Rodríguez, S.; Sebastián, D.; Lázaro, M.J. Electrochemical oxidation of ordered mesoporous carbons and the influence of graphitization. Electrochim. Acta 2019, 303, 167–175. [Google Scholar] [CrossRef] [Green Version]
  25. Triblock Copolymer Syntheses of Mesoporous Silica with Periodic 50 to 300 Angstrom Pores | Science. Available online: https://science.sciencemag.org/content/279/5350/548.full (accessed on 16 July 2020).
  26. Figueiredo, J.L.; Pereira, M.F.R.; Freitas, M.M.A.; Órfão, J.J.M. Modification of the surface chemistry of activated carbons. Carbon 1999, 37, 1379–1389. [Google Scholar] [CrossRef]
  27. Langford, J.I.; Wilson, A.J.C. Scherrer after sixty years: A survey and some new results in the determination of crystallite size. J. Appl. Crystallogr. 1978, 11, 102–113. [Google Scholar] [CrossRef]
  28. Sarkar, S.; Peter, S.C. An overview on Pd-based electrocatalysts for the hydrogen evolution reaction. Inorg. Chem. Front. 2018, 5, 2060–2080. [Google Scholar] [CrossRef]
  29. Zheng, J.; Zhou, S.; Gu, S.; Xu, B.; Yan, Y. Size-Dependent Hydrogen Oxidation and Evolution Activities on Supported Palladium Nanoparticles in Acid and Base. J. Electrochem. Soc. 2016, 163, F499. [Google Scholar] [CrossRef]
  30. Azuma, M.; Hashimoto, K.; Hiramoto, M.; Watanabe, M.; Sakata, T. Electrochemical Reduction of Carbon Dioxide on Various Metal Electrodes in Low-Temperature Aqueous KHCO3 Media. J. Electrochem. Soc. 1990, 137, 1772. [Google Scholar] [CrossRef]
  31. Juárez-Marmolejo, L.; Pérez-Rodríguez, S.; Montes de Oca-Yemha, M.G.; Palomar-Pardavé, M.; Romero-Romo, M.; Ezeta-Mejía, A.; Morales-Gil, P.; Martínez-Huerta, M.V.; Lázaro, M.J. Carbon supported PdM (M = Fe, Co) electrocatalysts for formic acid oxidation. Influence of the Fe and Co precursors. Int. J. Hydrog. Energy 2019, 44, 1640–1649. [Google Scholar] [CrossRef] [Green Version]
  32. Miyake, H.; Okada, T.; Samjeské, G.; Osawa, M. Formic acid electrooxidation on Pd in acidic solutions studied by surface-enhanced infrared absorption spectroscopy. Phys. Chem. Chem. Phys. 2008, 10, 3662–3669. [Google Scholar] [CrossRef] [PubMed]
  33. He, N.; Qin, C.; Wang, R.; Ma, S.; Wang, Y.; Qi, T. Electro-catalysis of carbon black or titanium sub-oxide supported Pd–Gd towards formic acid electro-oxidation. RSC Adv. 2016, 6, 68989–68996. [Google Scholar] [CrossRef]
  34. Calvillo, L.; Celorrio, V.; Moliner, R.; Cabot, P.L.; Esparbé, I.; Lázaro, M.J. Control of textural properties of ordered mesoporous materials. Microporous Mesoporous Mater. 2008, 116, 292–298. [Google Scholar] [CrossRef]
  35. Arévalo, M.C.; Rodríguez, J.L.; Pastor, E. Elucidation of the reaction pathways of allyl alcohol at polycrystalline palladium electrodes. J. Electroanal. Chem. 2001, 505, 62–71. [Google Scholar] [CrossRef]
  36. Arévalo, M.C.; Rodríguez, J.L.; Pastor, E. Adsorption, oxidation and reduction reactions of propargyl alcohol on palladium as studied by electrochemical mass spectrometry. J. Electroanal. Chem. 1999, 472, 71–82. [Google Scholar] [CrossRef]
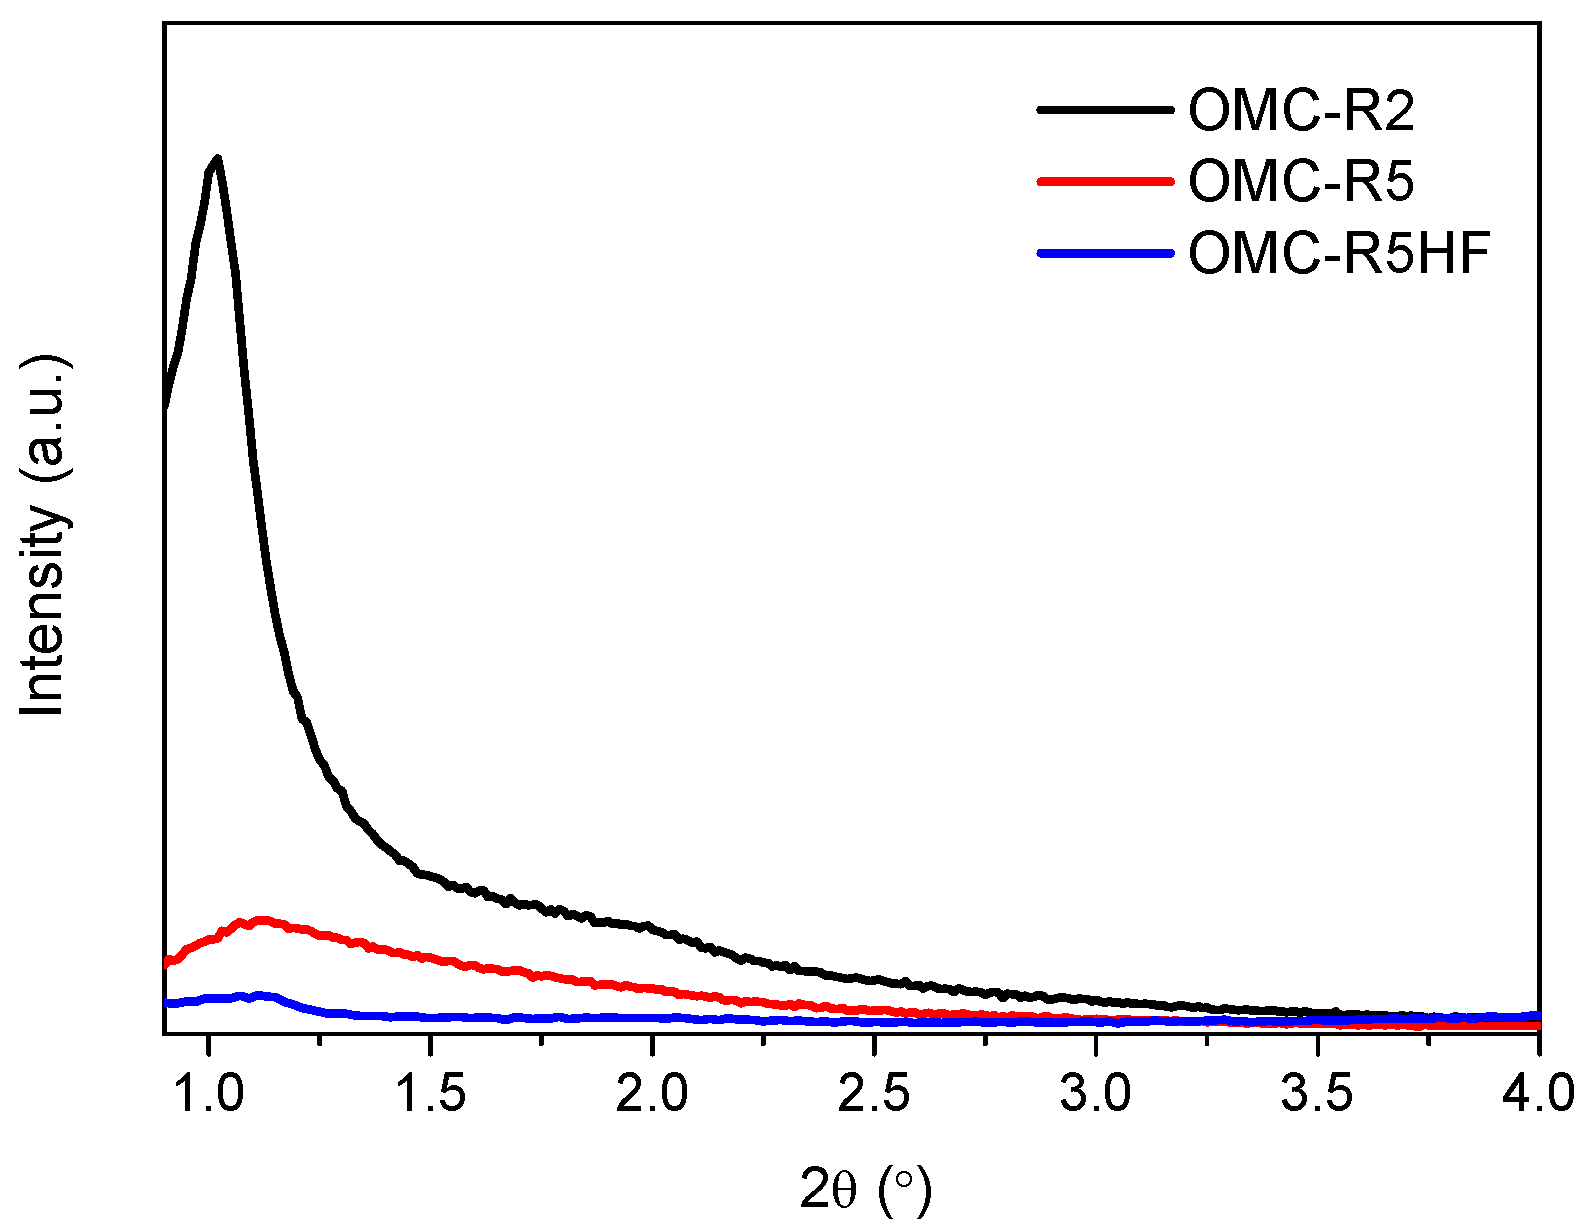
Figure 1. XRD patterns of ordered mesoporous carbon (OMC) supports.
Catalysts 10 00912 g001
Figure 2. TEM images of (a,b) OMC-R2 and (c,d) OMC-R5HF.
Catalysts 10 00912 g002
Figure 3. (a) TGA profiles of Pd/OMC and OMC. (b) XRD patterns of Pd/OMC catalysts.
Catalysts 10 00912 g003
Figure 4. TEM images (left) and particle size distribution (right) of Pd/OMC catalysts: (a,b) Pd/OMC-R2; (c,d) Pd/OMC-R5; (e,f) Pd/OMC-R5HF.
Catalysts 10 00912 g004aCatalysts 10 00912 g004b
Figure 5. Cyclic voltammograms (CVs) of Pd/C catalysts in 0.1 M KHCO3 (v = 10 mV s−1, Ei = 0.2 V vs. Ag/AgCl): (a) from −0.8 to 0.9 V vs. Ag/AgCl; (b) from −1.4 to 0.9 V vs. Ag/AgCl. N2 saturated solution. Red curves: CO2 saturated solution.
Catalysts 10 00912 g005
Figure 6. CO stripping voltammograms of Pd/OMC catalysts in 0.1 M KHCO3 (v = 10 mV s−1, Ead = −0.5 V vs. Ag/AgCl): (a) Pd/OMC-R2; (b) Comparison of the first scan of Pd/OMC catalysts.
Catalysts 10 00912 g006
Figure 7. Reduced CO2 stripping voltammograms of Pd/OMC catalysts in 0.1 M KHCO3 (v = 10 mV s−1, Ead = −1.0 V vs. Ag/AgCl): (a) Pd/OMC-R2; (b) Comparison of the first scan of Pd/OMC catalysts.
Catalysts 10 00912 g007
Figure 8. Comparison of CO and reduced CO2 stripping voltammograms of Pd/OMC catalysts in 0.1 M KHCO3 (v = 10 mV s−1).
Catalysts 10 00912 g008
Table 1. Textural parameters of OMC supports.
OMCSBET (m2 g−1)VT (cm3 g−1)Dp (nm)
OMC-R28840.593.0
OMC-R58120.553.5
OMC-R5HF10500.773.6
Table 2. Surface chemistry of OMC supports.
OMCCO (µmol g−1)CO2 (µmol g−1)CO/CO2O (wt.%)
OMC-R215278411.85.1
OMC-R514757701.94.8
OMC-R5HF14672765.33.2
Table 3. Metal loading by EDX, TGA and crystal size by XRD of Pd/OMC catalysts.
Catalyst% Pd (wt.-EDX)% Pd (wt.-TGA)d (nm)
Pd/OMC-R222.418.23.0
Pd/OMC-R519.9 18.93.5
Pd/OMC-R5HF21.8 18.54.4