Article

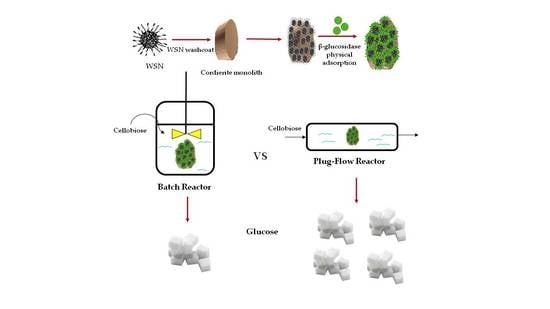
Immobilization of β-Glucosidase over Structured Cordierite Monoliths Washcoated with Wrinkled Silica Nanoparticles

by
Virginia Venezia
1,
Aniello Costantini
1,*,
Gianluca Landi
2,*,
Almerinda Di Benedetto
1,
Filomena Sannino
3 and
Valeria Califano
4
1
Dipartimento di Ingegneria Chimica, dei Materiali e della Produzione Industriale, University of Naples Federico II, 80125 Naples, Italy
2
Institute for Researches on Combustion-CNR, 80125 Naples, Italy
3
Department of Agricultural Sciences, Università degli Studi di Napoli Federico II, Via Università 100, 80055 Portici (Na), Italy
4
Istituto Motori-CNR, 80125 Naples, Italy
*
Authors to whom correspondence should be addressed.
Catalysts 2020, 10(8), 889; https://doi.org/10.3390/catal10080889
Submission received: 21 July 2020 / Revised: 1 August 2020 / Accepted: 4 August 2020 / Published: 6 August 2020
(This article belongs to the Special Issue Porous Materials and Catalysts)

Abstract

:
The enzymatic conversion of biomass-derived compounds represents a key step in the biorefinery flowsheet, allowing low-temperature high-efficiency reactions. β-Glucosidases are able to hydrolyze cellobiose into glucose. Wrinkled silica nanoparticles (WSNs) were demonstrated to be a good support for the immobilization of β-glucosidases, showing better performance than free enzymes in batch reaction; on the other hand, immobilized enzyme microreactors (IEMs) are receiving significant attention, because small quantities of reagents can be used, and favorable heat and mass transfer can be achieved with respect to conventional batch systems. In this work, we prepared, characterized, and tested structured enzymatic reactor compounds by a honeycomb monolith, a WSN washcoat, and β-glucosidases as the active phase. Powder and structured materials were characterized by transmission electron microscopy (TEM), scanning electron microscopy (SEM), N2 physisorption, thermogravimetric analysis (TGA), and Fourier-transform infrared spectroscopy (FT-IR). Structured catalysts were tested under both batch and continuous flow reaction conditions and compared to powder catalysts (batch reaction). The WSN washcoat was attached well onto the monolith walls, as suggested by the negligible weight loss after ultrasound treatment; the WSNs preserved their shape, porosity, and individual nature when deposited onto the monolith walls. The immobilized enzyme microreactors proved to be very efficient in hydrolysis of cellobiose to glucose, showing a complete conversion under continuous flow reaction at a batch-equivalent contact time equal to 120 min vs. 24 h obtained in the batch experiments. The apparent KM value showed a 20-fold decrease with respect to the batch process, due to the absence of external diffusive transport limitations.

Graphical Abstract

1. Introduction

β-glucosidases (BGs) (EC 3.2.1.21) are an enzyme belonging to the glycosyl hydrolase family that hydrolyzes various β-linked diglucosides and aryl-β-glucosides. They find applications in many biotechnological fields, such as the release of aromatic residues in the flavor industry and the synthesis of oligosaccharides and glycosides in the pharmaceutical industry [1]. One important role of BG is the conversion into glucose of the cellobiose derived from the enzymatic hydrolysis of lignocellulosic biomass. This reaction is catalyzed by the enzyme complex cellulase, of which BG is a part. This allows the production of sugars that can be fermented in ethanol, which can be used as biofuel, with both environmental and geopolitical benefits. In fact, lignocellulosic biomass is a renewable source widely available worldwide.
Enzymatic hydrolysis processes are usually carried out by incubating the substrate with the free or immobilized enzyme in a batch reactor. This procedure has some major problems, such as high consumption of the costly enzyme, long incubation time requirements, and mass transfer limitations. The use of immobilized enzyme microreactors (IEMs) can overcome these problems, using small quantities of reagents and favoring rapid heat and mass transfer that cannot be achieved by a conventional batch system [2]. Additionally, the laminar flow rate occurring within the microchannels avoids foam formation and turbulence often affecting batch reactors [3,4]. Examples of IEMs are reported in the literature [5,6,7,8,9,10,11,12,13], some of them using BG as an enzymatic catalyst [5,6,13]. Microfluidic reactors generally show improved performance than the corresponding free enzymes.
Mesoporous silica can be used for many applications such as drug delivery and fluorescence biological probes [14,15], and is a suitable support for enzyme immobilization [16,17]. They have high chemical, mechanical, and thermal stability. Their high surface area and pore volume allow for large enzyme loadings and a good dispersion inside the pores. In our previous works, we showed that wrinkled silica nanoparticles (WSNs) are a good support for BG immobilization [18,19,20]. WSNs are formed by silica fibers or wrinkles spreading uniformly in all directions from the center of the particles, forming central-radial pores, which widen outward. These nanoparticles show a hierarchical pore distribution characterized by mesopores corresponding to inter-wrinkled distances, and a mesoporous structure, in addition to wrinkles and additional microporosity. This peculiar morphology created a favorable microenvironment for catalysis [18,19,20].
On the other hand, ceramic powders can be easily washcoated onto monoliths and foams [21,22,23,24,25,26]. Honeycomb monoliths represent effective ecological, economic, and versatile catalytic supports for the production of a variety of fine chemicals. The use of an enzyme-loaded honeycomb monolith within a microfluidic reactor can improve reaction efficiency and facilitate continuous operation, reuse, and regeneration.
The main objective of this work is the intensification and engineering of the enzymatic hydrolysis process through the transition from a batch reactor to a flow reactor, by the application of ceramic cordierite monoliths. This material has several advantages, such as a high melting point (1300 °C), high mechanical resistance, and very low thermal expansion coefficient, essential for resisting thermal shocks. These properties allow good adhesion of the support layer (washcoat), to guarantee a high specific surface on which the active phases of the biocatalyst are dispersed. The washcoat consisted of β-glucosidases immobilized into wrinkled silica nanoparticles (BG/WSNs). Based on the know-how for producing a zeolite washcoat [23,27], WSNs were deposited onto the walls of the cordierite honeycomb.
The catalytic performance, thermal stability, and pH stability of β-glucosidase in WSNs were determined in a discontinuous reactor (batch case) and in a flow reactor (plug-flow case).

2. Results

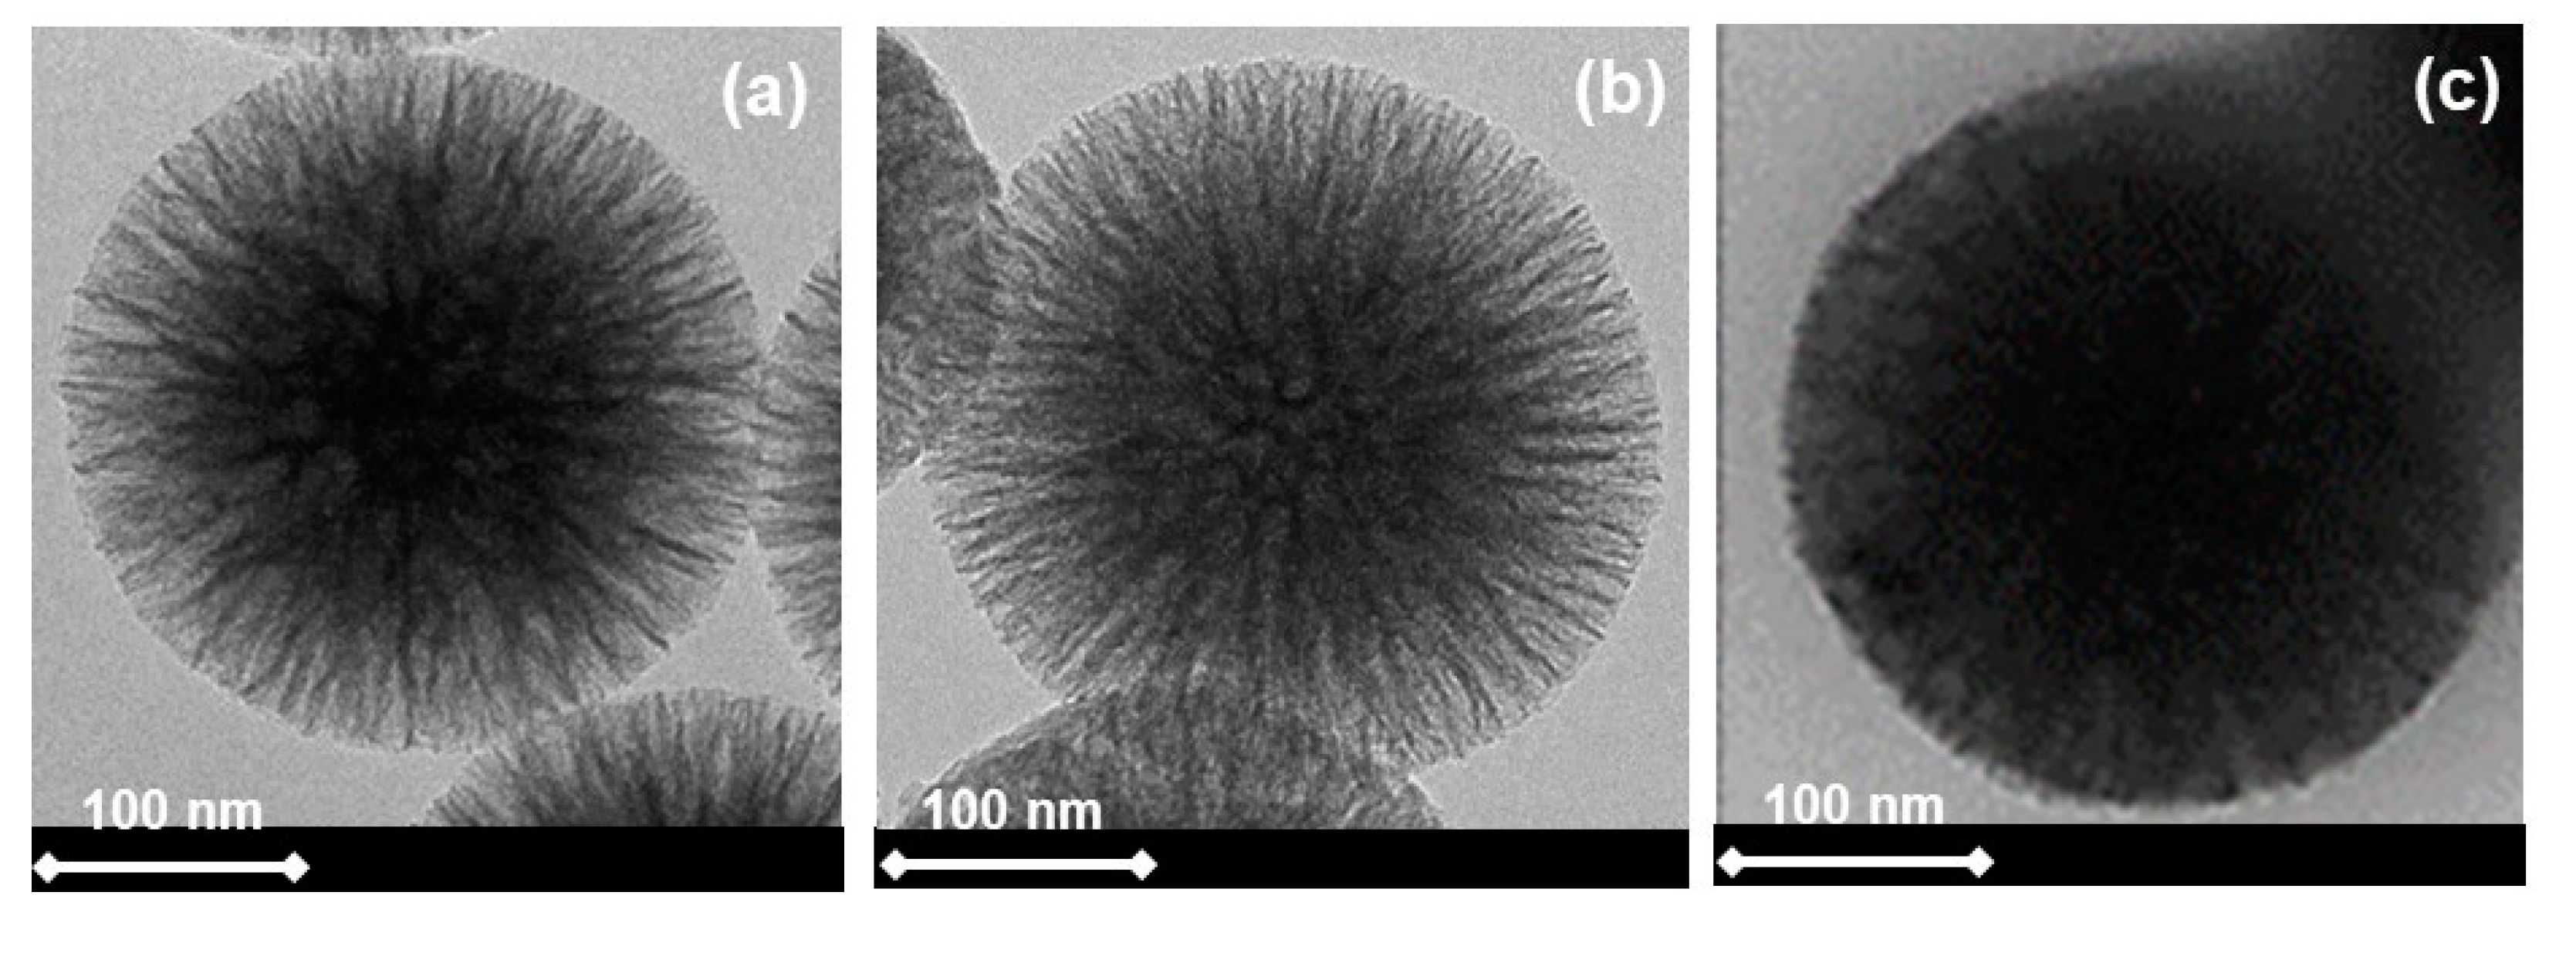
2.1. Textural and Morphological Characterizations

The Brunauer–Emmett–Teller (BET) surface area and the pore size distribution of WSNs before and after calcination were evaluated from the nitrogen adsorption–desorption isotherm (figure not shown). The WSNs before calcination have a BET surface area of 580 m2/g and total pore volume of 1.72 cm3/g. The pore size distribution indicates the presence of mesopores in the range of 5–50 nm, corresponding to an inter-wrinkled distance having a mean value of 12.2 nm. A second distribution exists is in the range of 2–4 nm, suggesting that the wrinkles themselves have a mesoporous structure [19]. Moreover, there is an additional microporosity in the range of 1–2 nm [19]. This hierarchical micro/mesoporous structure is advantageous with respect to monomodal porous systems [28], because it can enhance the diffusion of small molecules through multiple mass transport pathways within the silica network.
The calcined WSNs have a BET specific surface area larger than forty percent of the nanoparticles before calcination, while they have a slightly larger total pore volume and the same porosimetric distributions. The increase in the surface area and the almost constant pore volume can be mainly attributed to the increase in the number of micropores, which have a deep effect on surface area but a slight effect on the total pore volume. This, in turn, is determined by the removal of organic matter that was not eliminated by the acid extraction.
TEM images of WSNs before and after calcination and BG/WSNs are displayed in Figure 1a–c, respectively.
The TEM images of Figure 1a,b show colloidal particles comprising silica fibers spreading out from the center of the particles, forming central-radial pores that widen from the inside out. As can be seen, there are no effects induced by calcination treatment on the morphology of the nanoparticles. In agreement with the porosimetry results, they appear more porous. This is evident from the fact that the dark area inside the particles, which represents a silica core, shows a smaller electron density than the untreated WSN, appearing clearer. TEM images of BG immobilized into WSNs (BG/WSNs) show that the dark region is much more extended, indicating a higher electron density in the wrinkle region, due to the presence of the enzyme. There is no visible protein corona around the particles [29], indicating that BG is mainly located in the inter-wrinkled space.

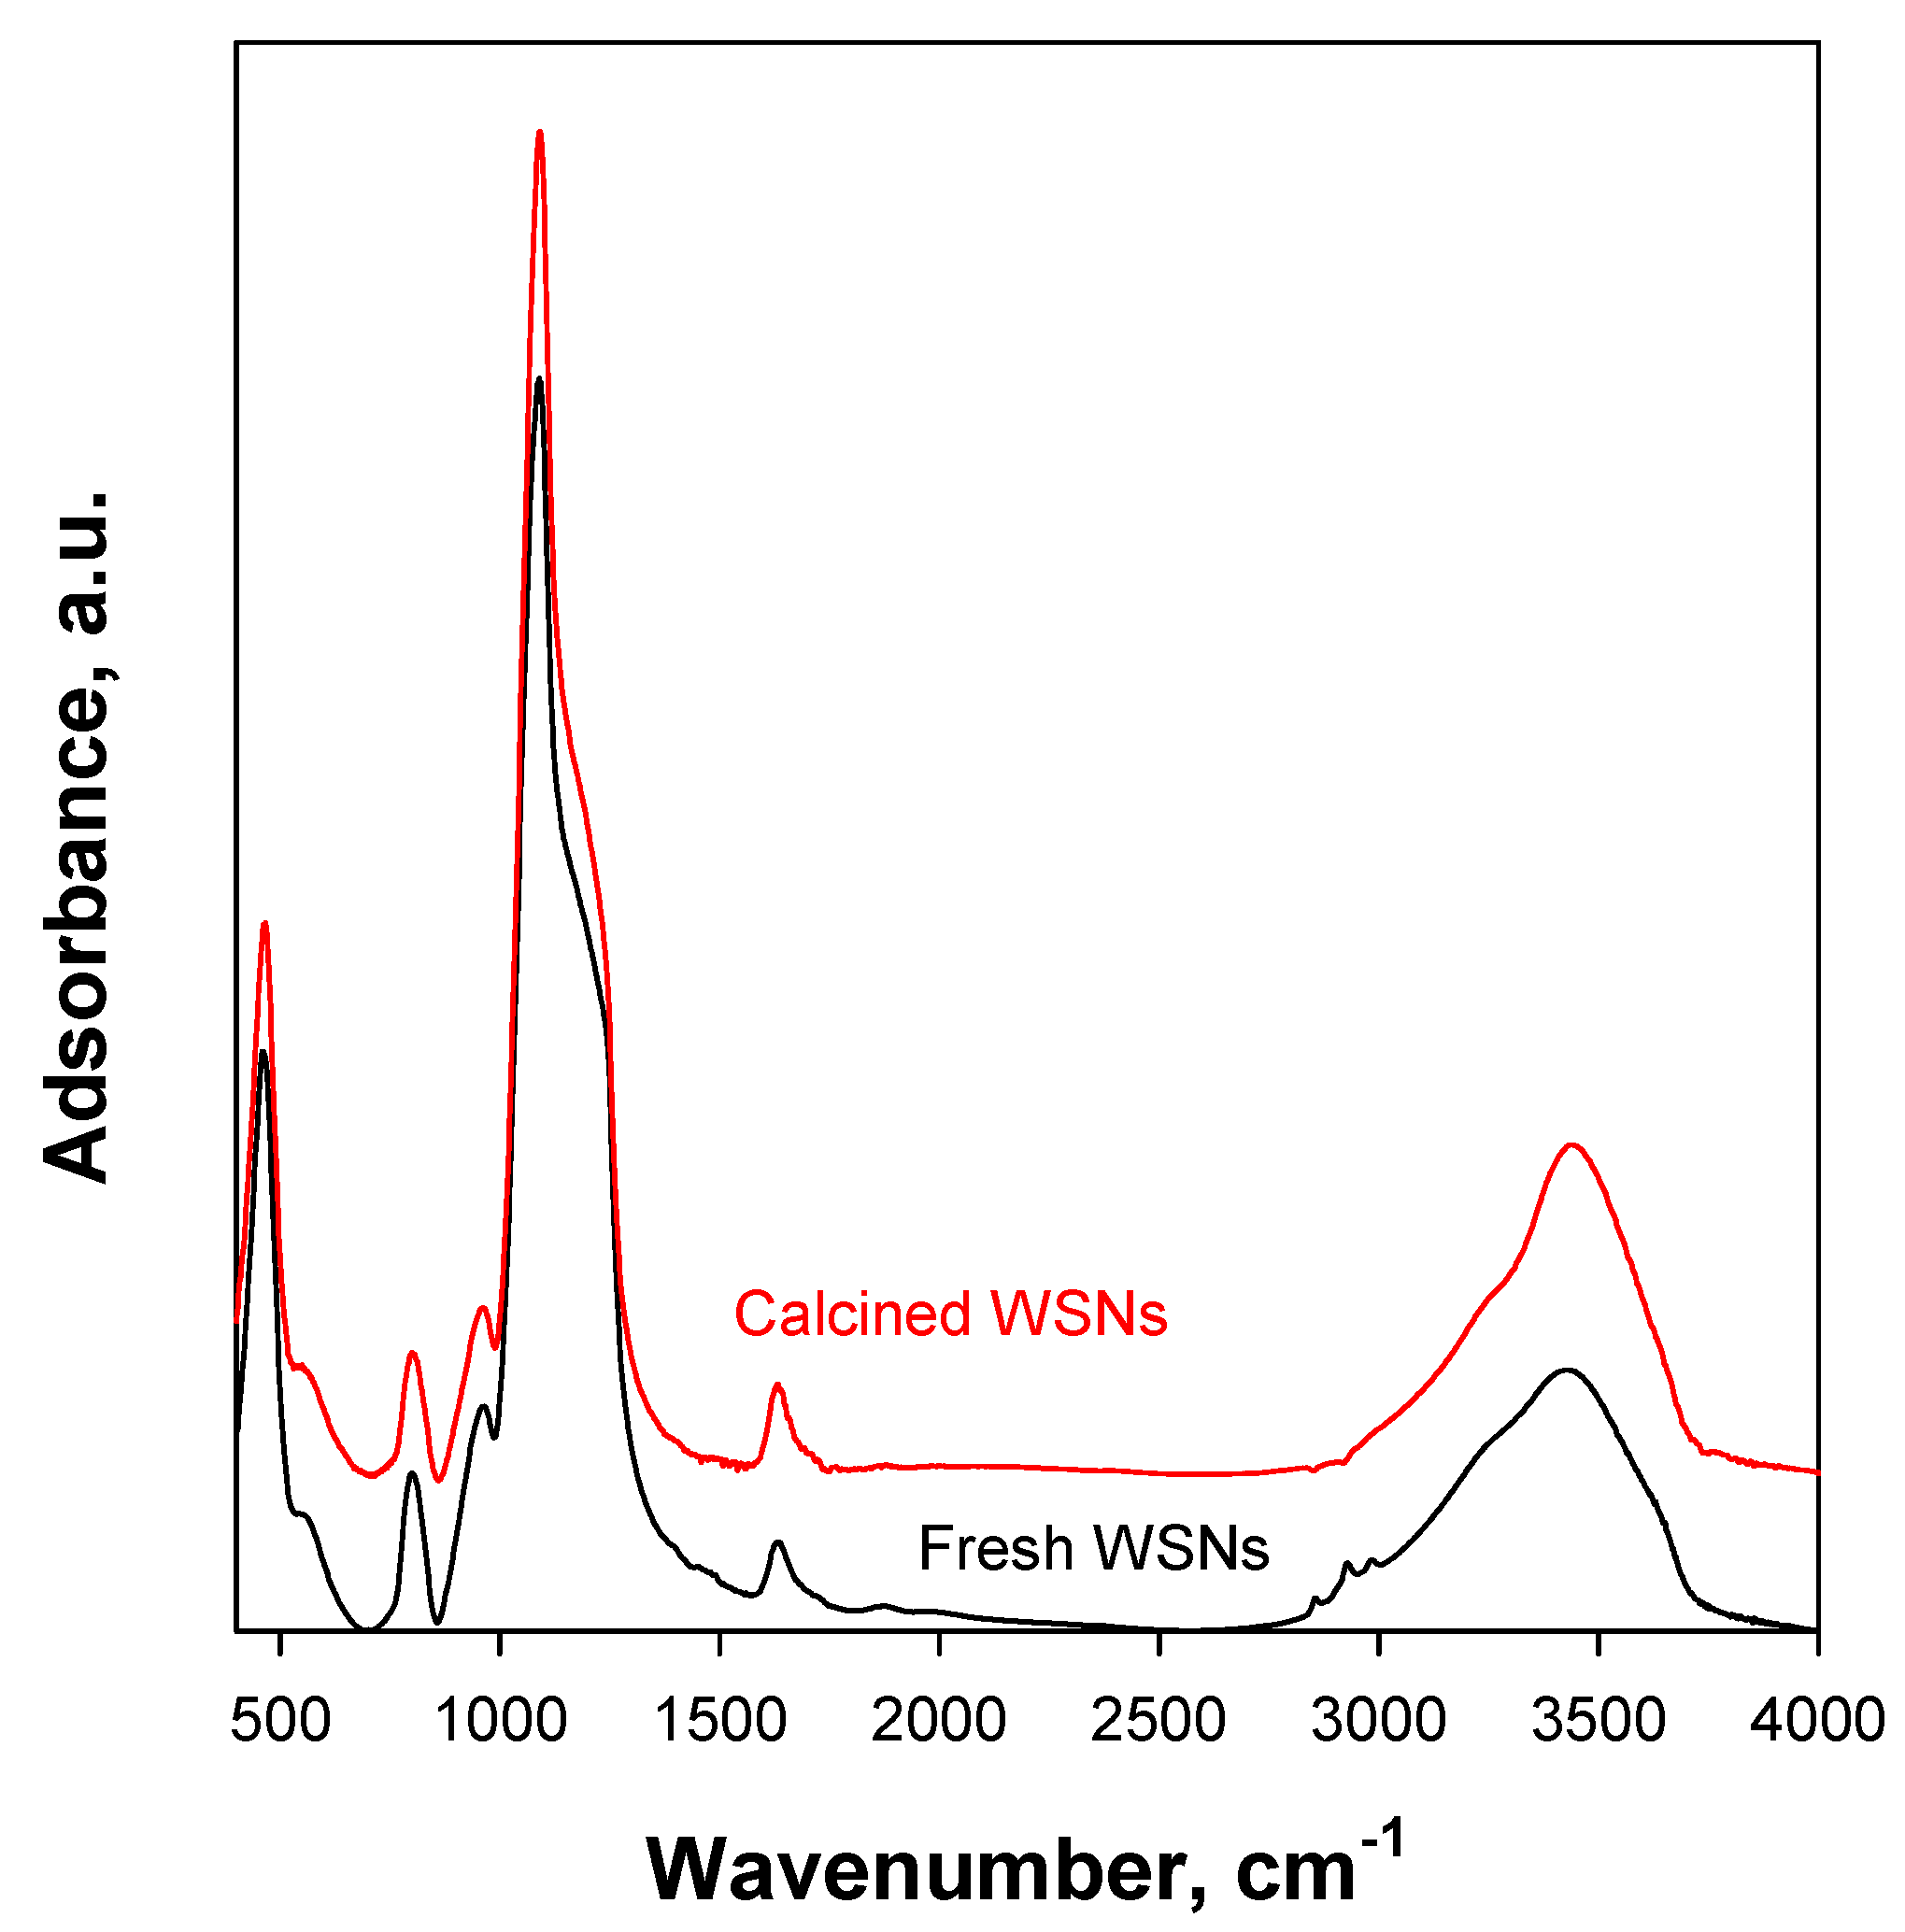
2.2. FTIR and TG Analysis

In Figure 2, the FT-IR spectra of fresh WSNs and calcined WSNs are reported. In both spectra, there are bands related to Si−O−Si vibrational modes at 500 (δSi−O−Si), 800 (νsym Si−O−Si), and 1090 cm−1 (transversal optic (TO) ν asym Si−O−Si), with a shoulder at 1200 cm−1 (longitudinal optic (LO) νasym Si−O−Si). The position of these bands is the same for the two samples and is indicative of a dense silica network [30]. The bands at 560 (δSi−OH) and 960 cm−1Si−OH) indicate the presence of surface Si−OH groups. Furthermore, in the 2750−3700 cm−1 range, a broad band appears due to the stretching modes of Si−OH and H−OH. The bands related to the vibration modes of the organic matter between 2800 and 3000 cm–1 are present in the spectrum of pristine WSNs but disappear in the calcined one, as organic matter is burned during calcination. FTIR spectra show that there is no chemical modification of the silica network after calcination at 450 °C. On the other hand, the condensation of silanols to siloxanes generally occurs at higher temperatures [31].
The FTIR and TEM studies agree that WSNs do not undergo chemical or physical modification after the calcination process. As washcoating requires a calcination at 450 °C after each dip-coating with the nanoparticles, the above results suggest that no WSN modification is expected on the structured catalyst.
To evaluate the amount of immobilized enzyme in the calcined WSNs and in the WSN washcoat on cordierite monoliths, thermogravimetric analysis was performed. TGA was carried out on dried samples, and the weight loss for both samples was evaluated in a temperature range between 200 and 800 °C. The WSN washcoat on cordierite monoliths adsorbed more than twice the calcined WSNs, 68% vs. 30% in weight. The excess is due to the location of the enzyme in the pores of the monolith itself. However, as demonstrated by thermogravimetric measurements, the enzyme placed in the monolith channels is not released after tests in batch mode but is instead immediately lost in continuous mode.

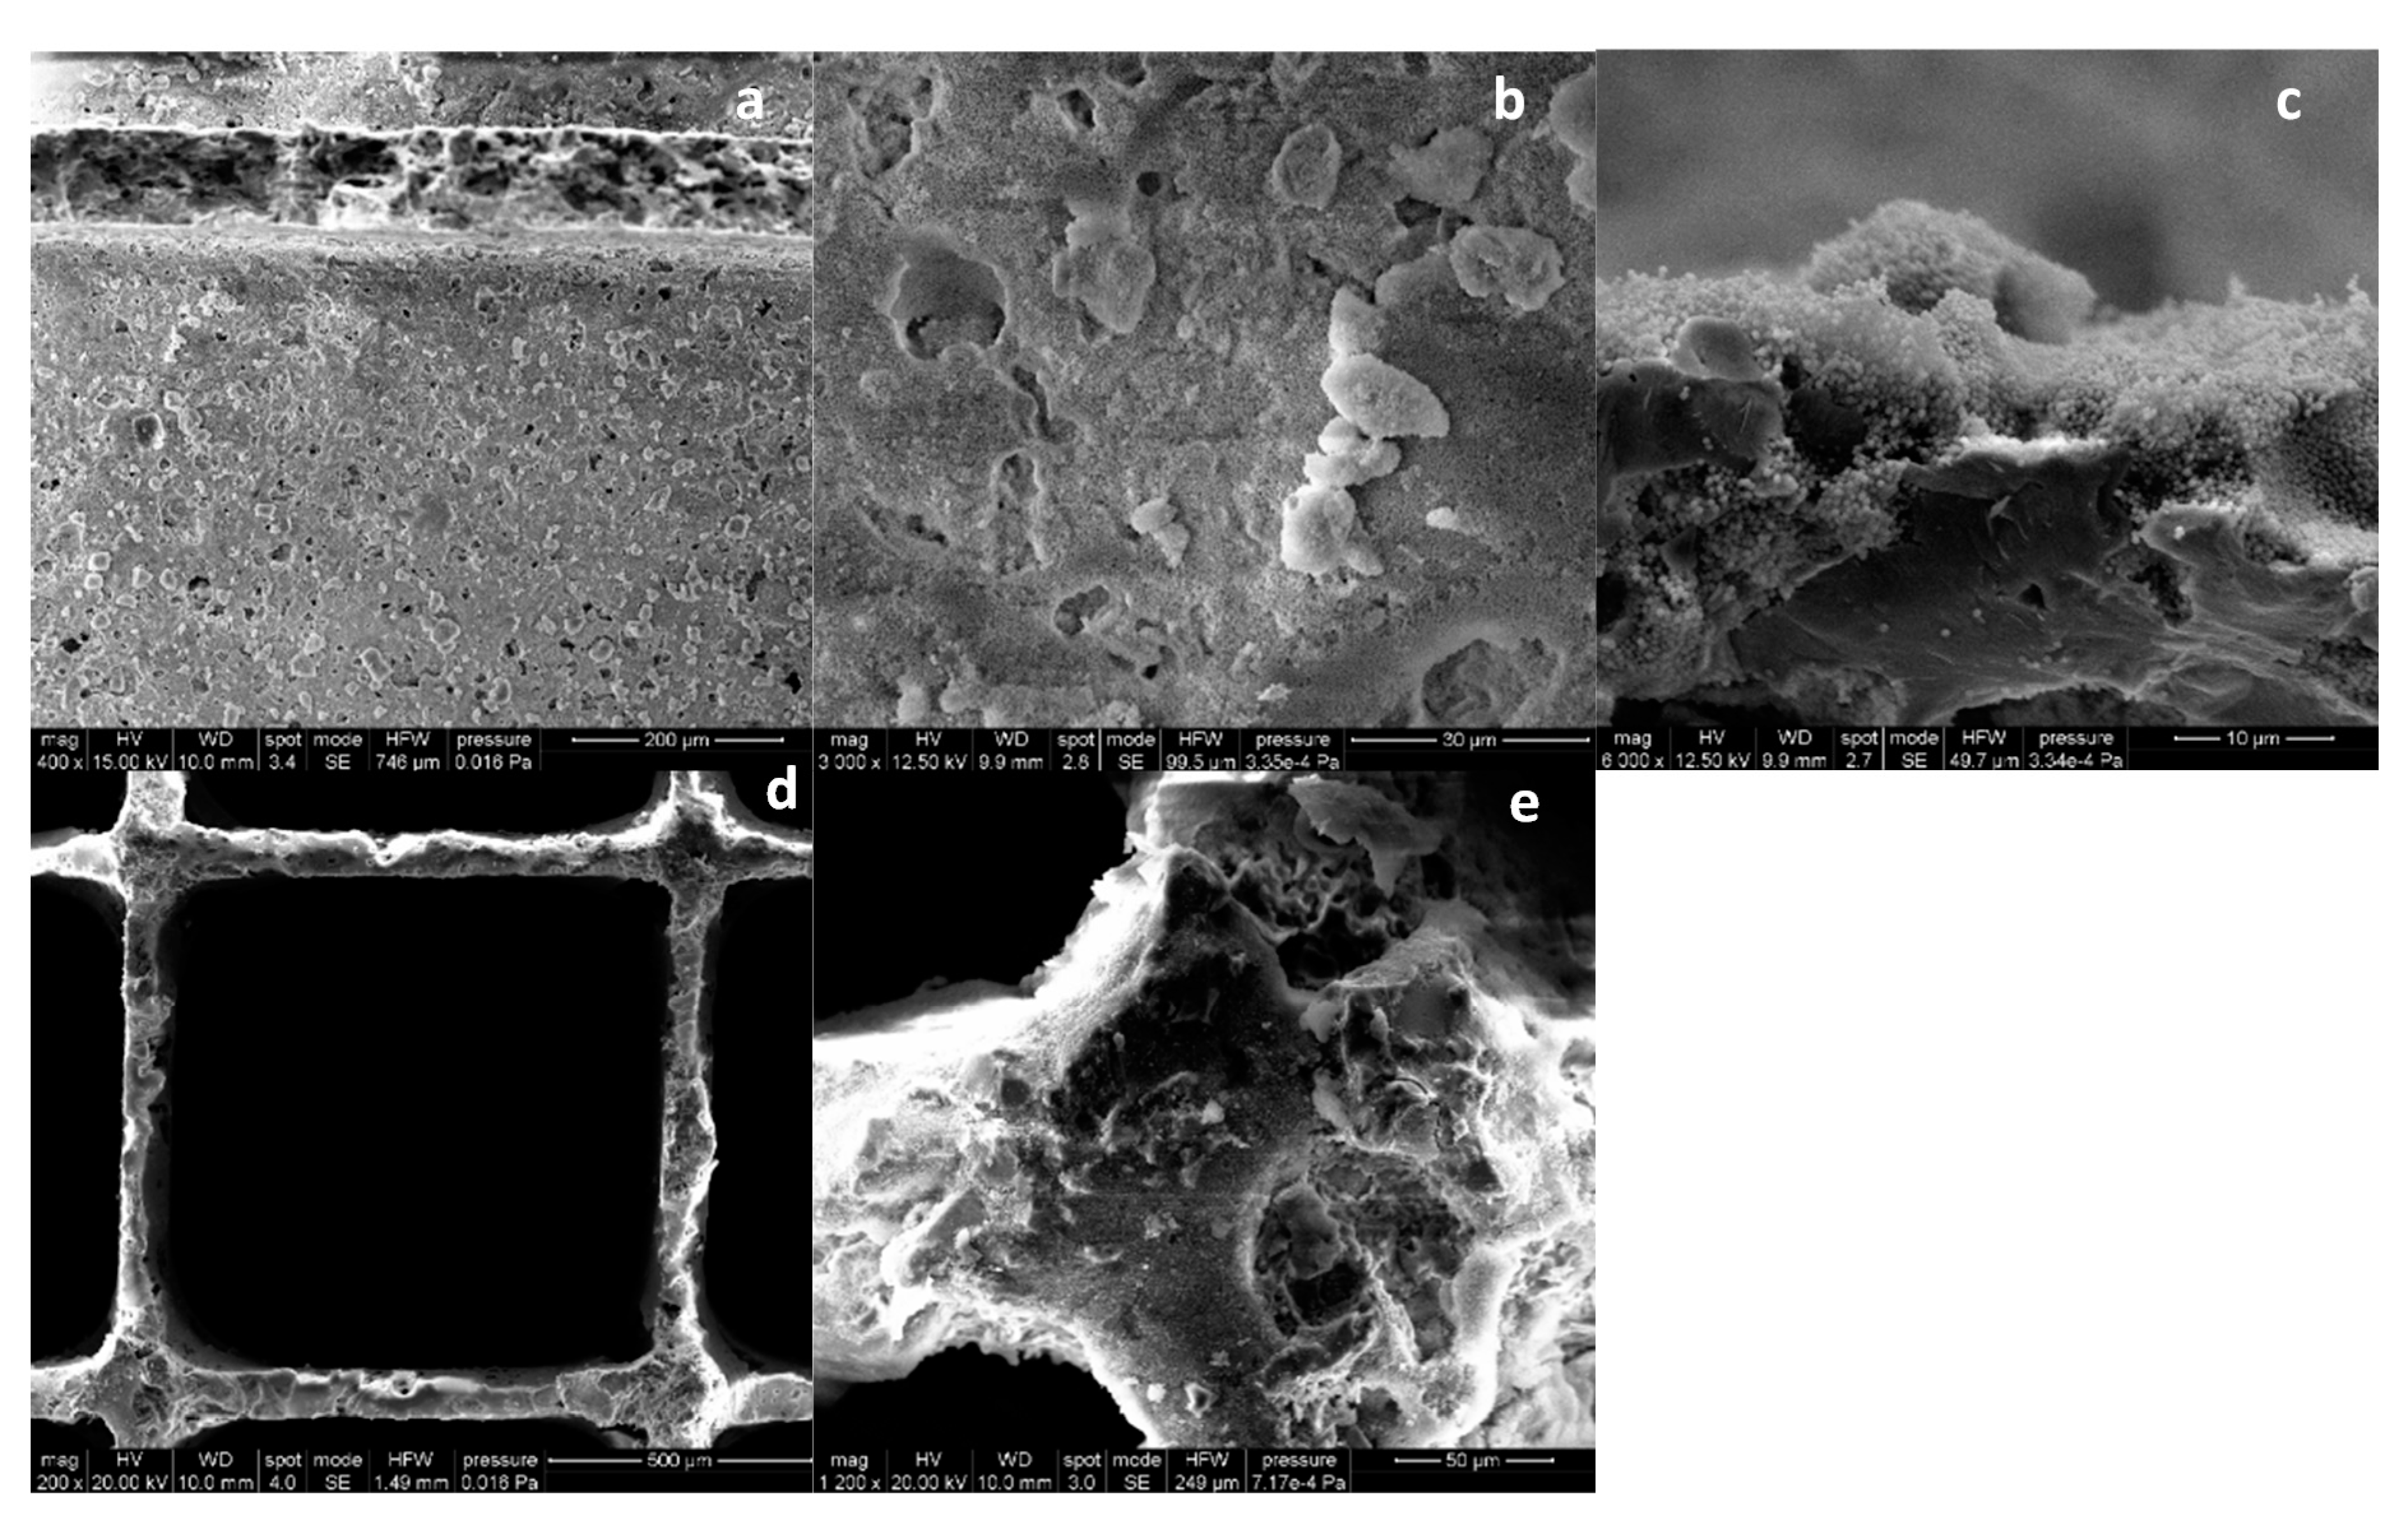
2.3. Scanning Electron Microscopy of WSN Monolith
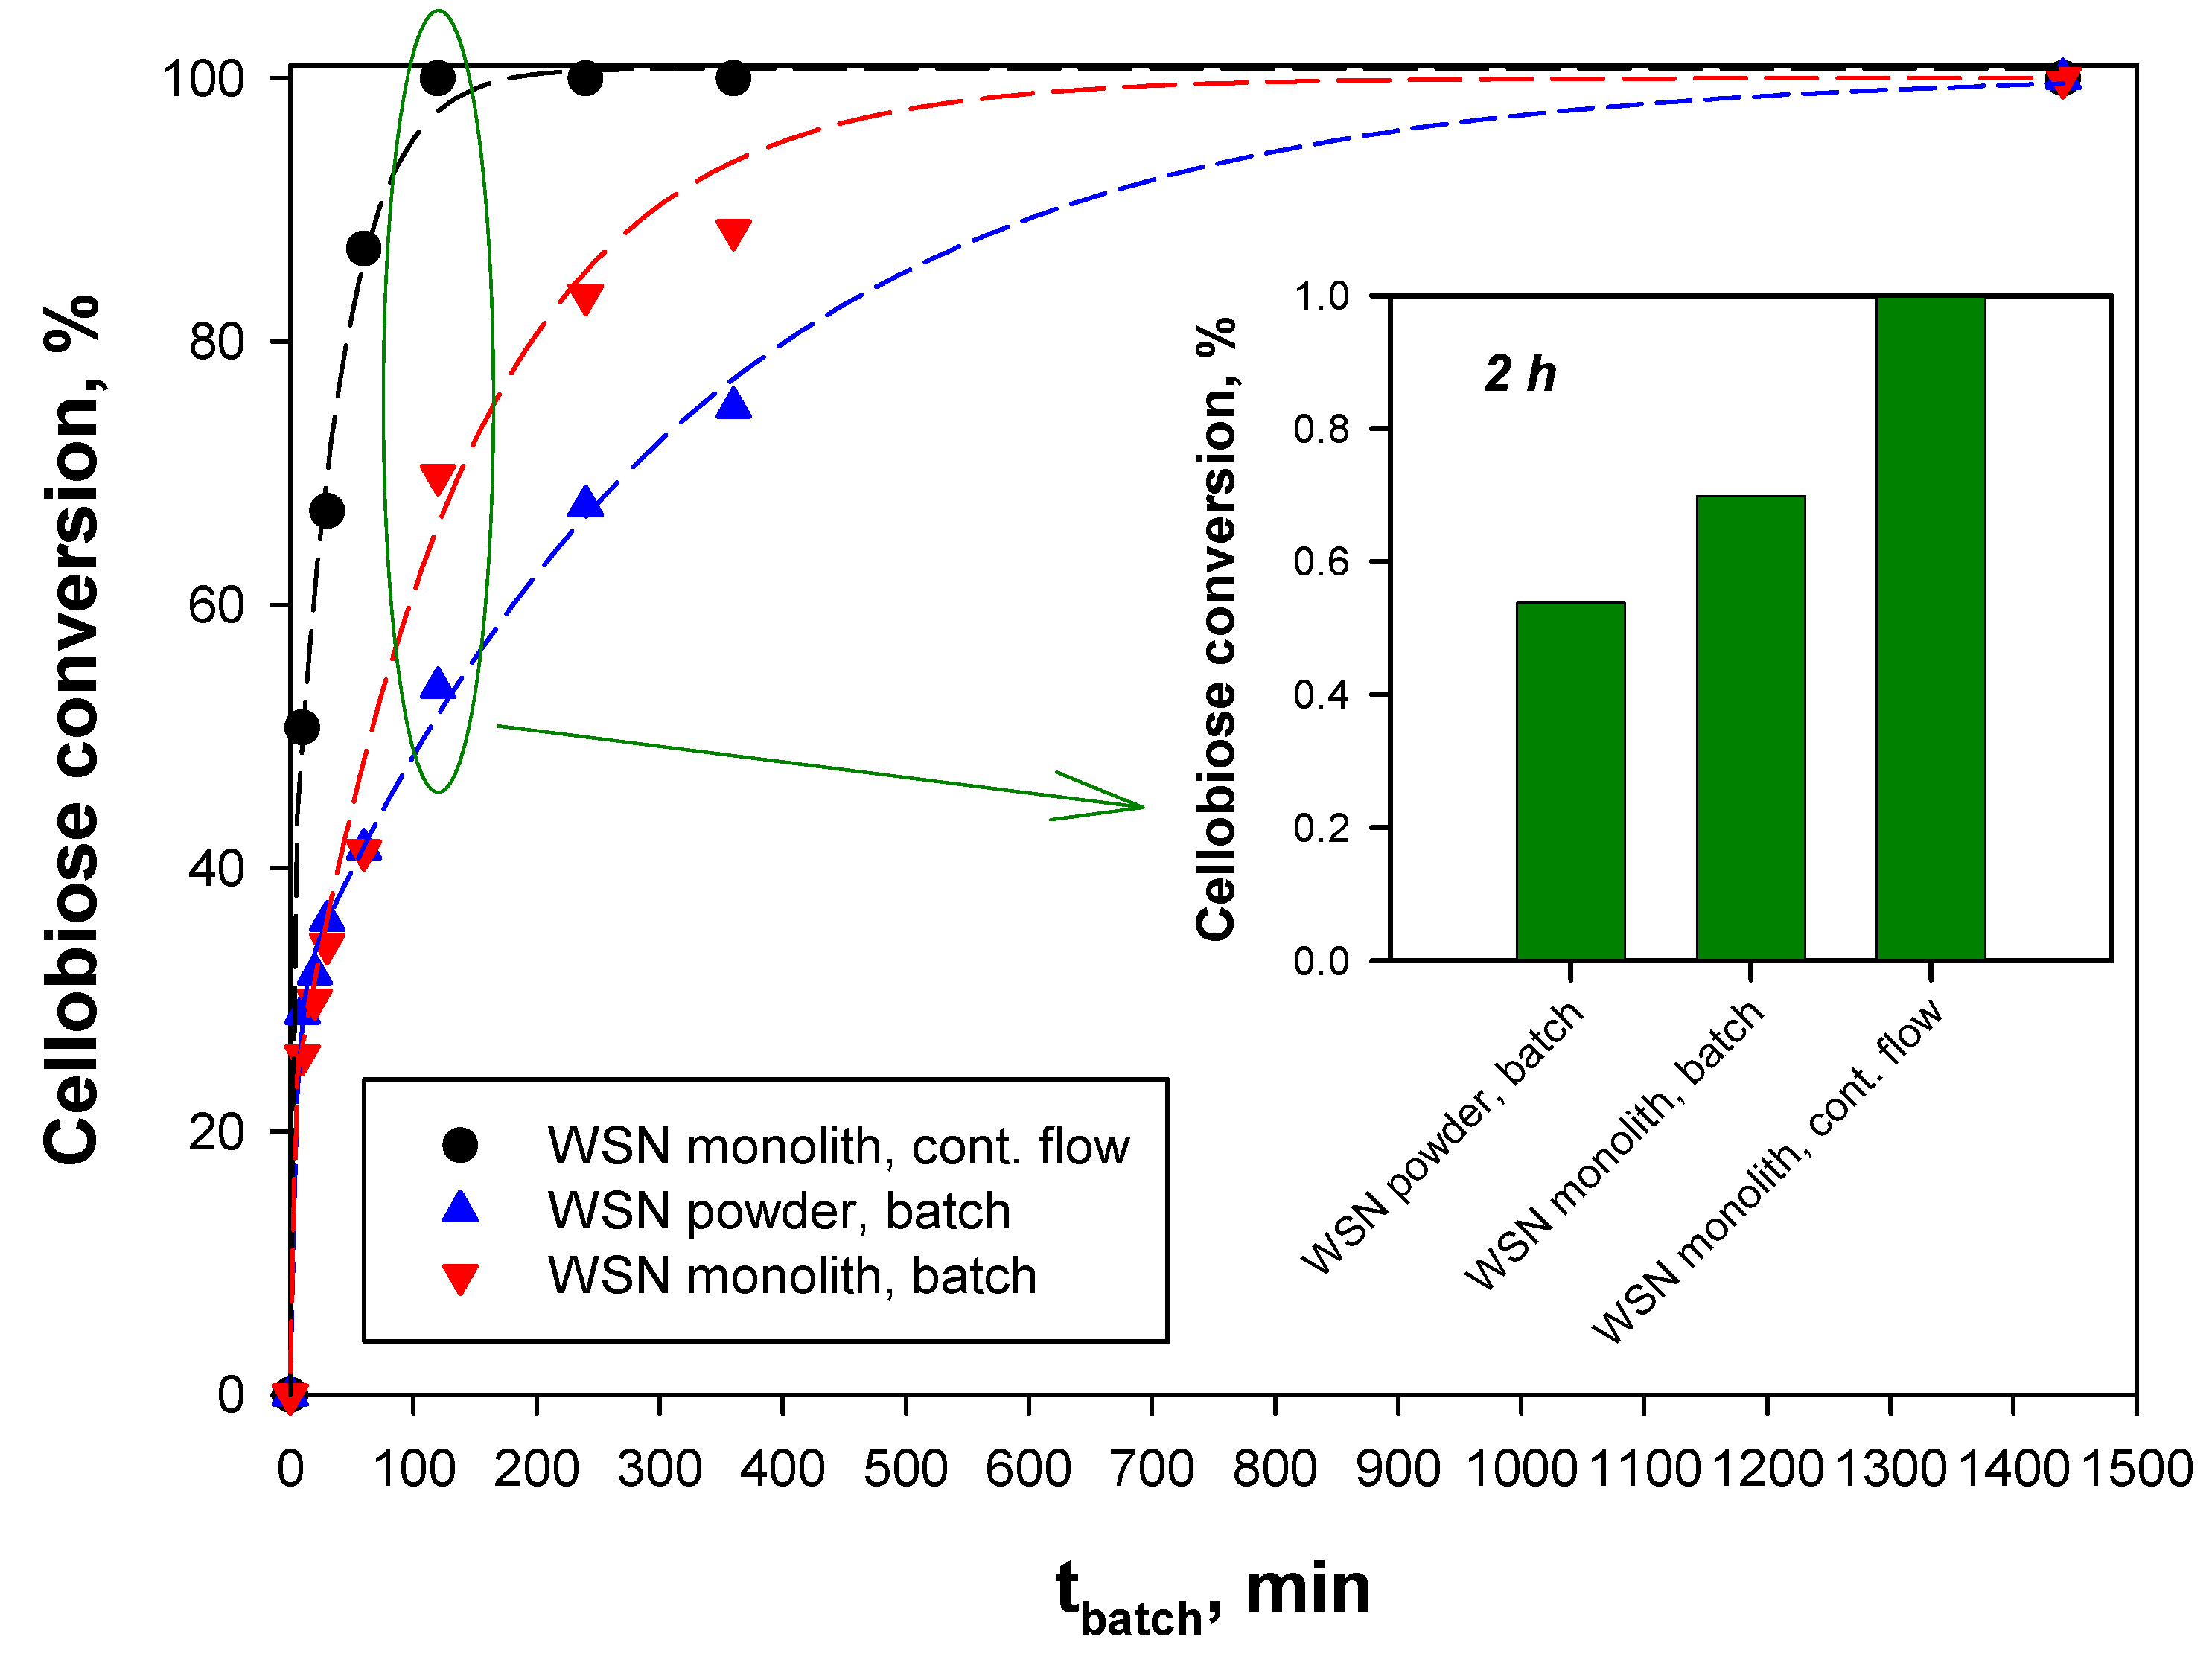
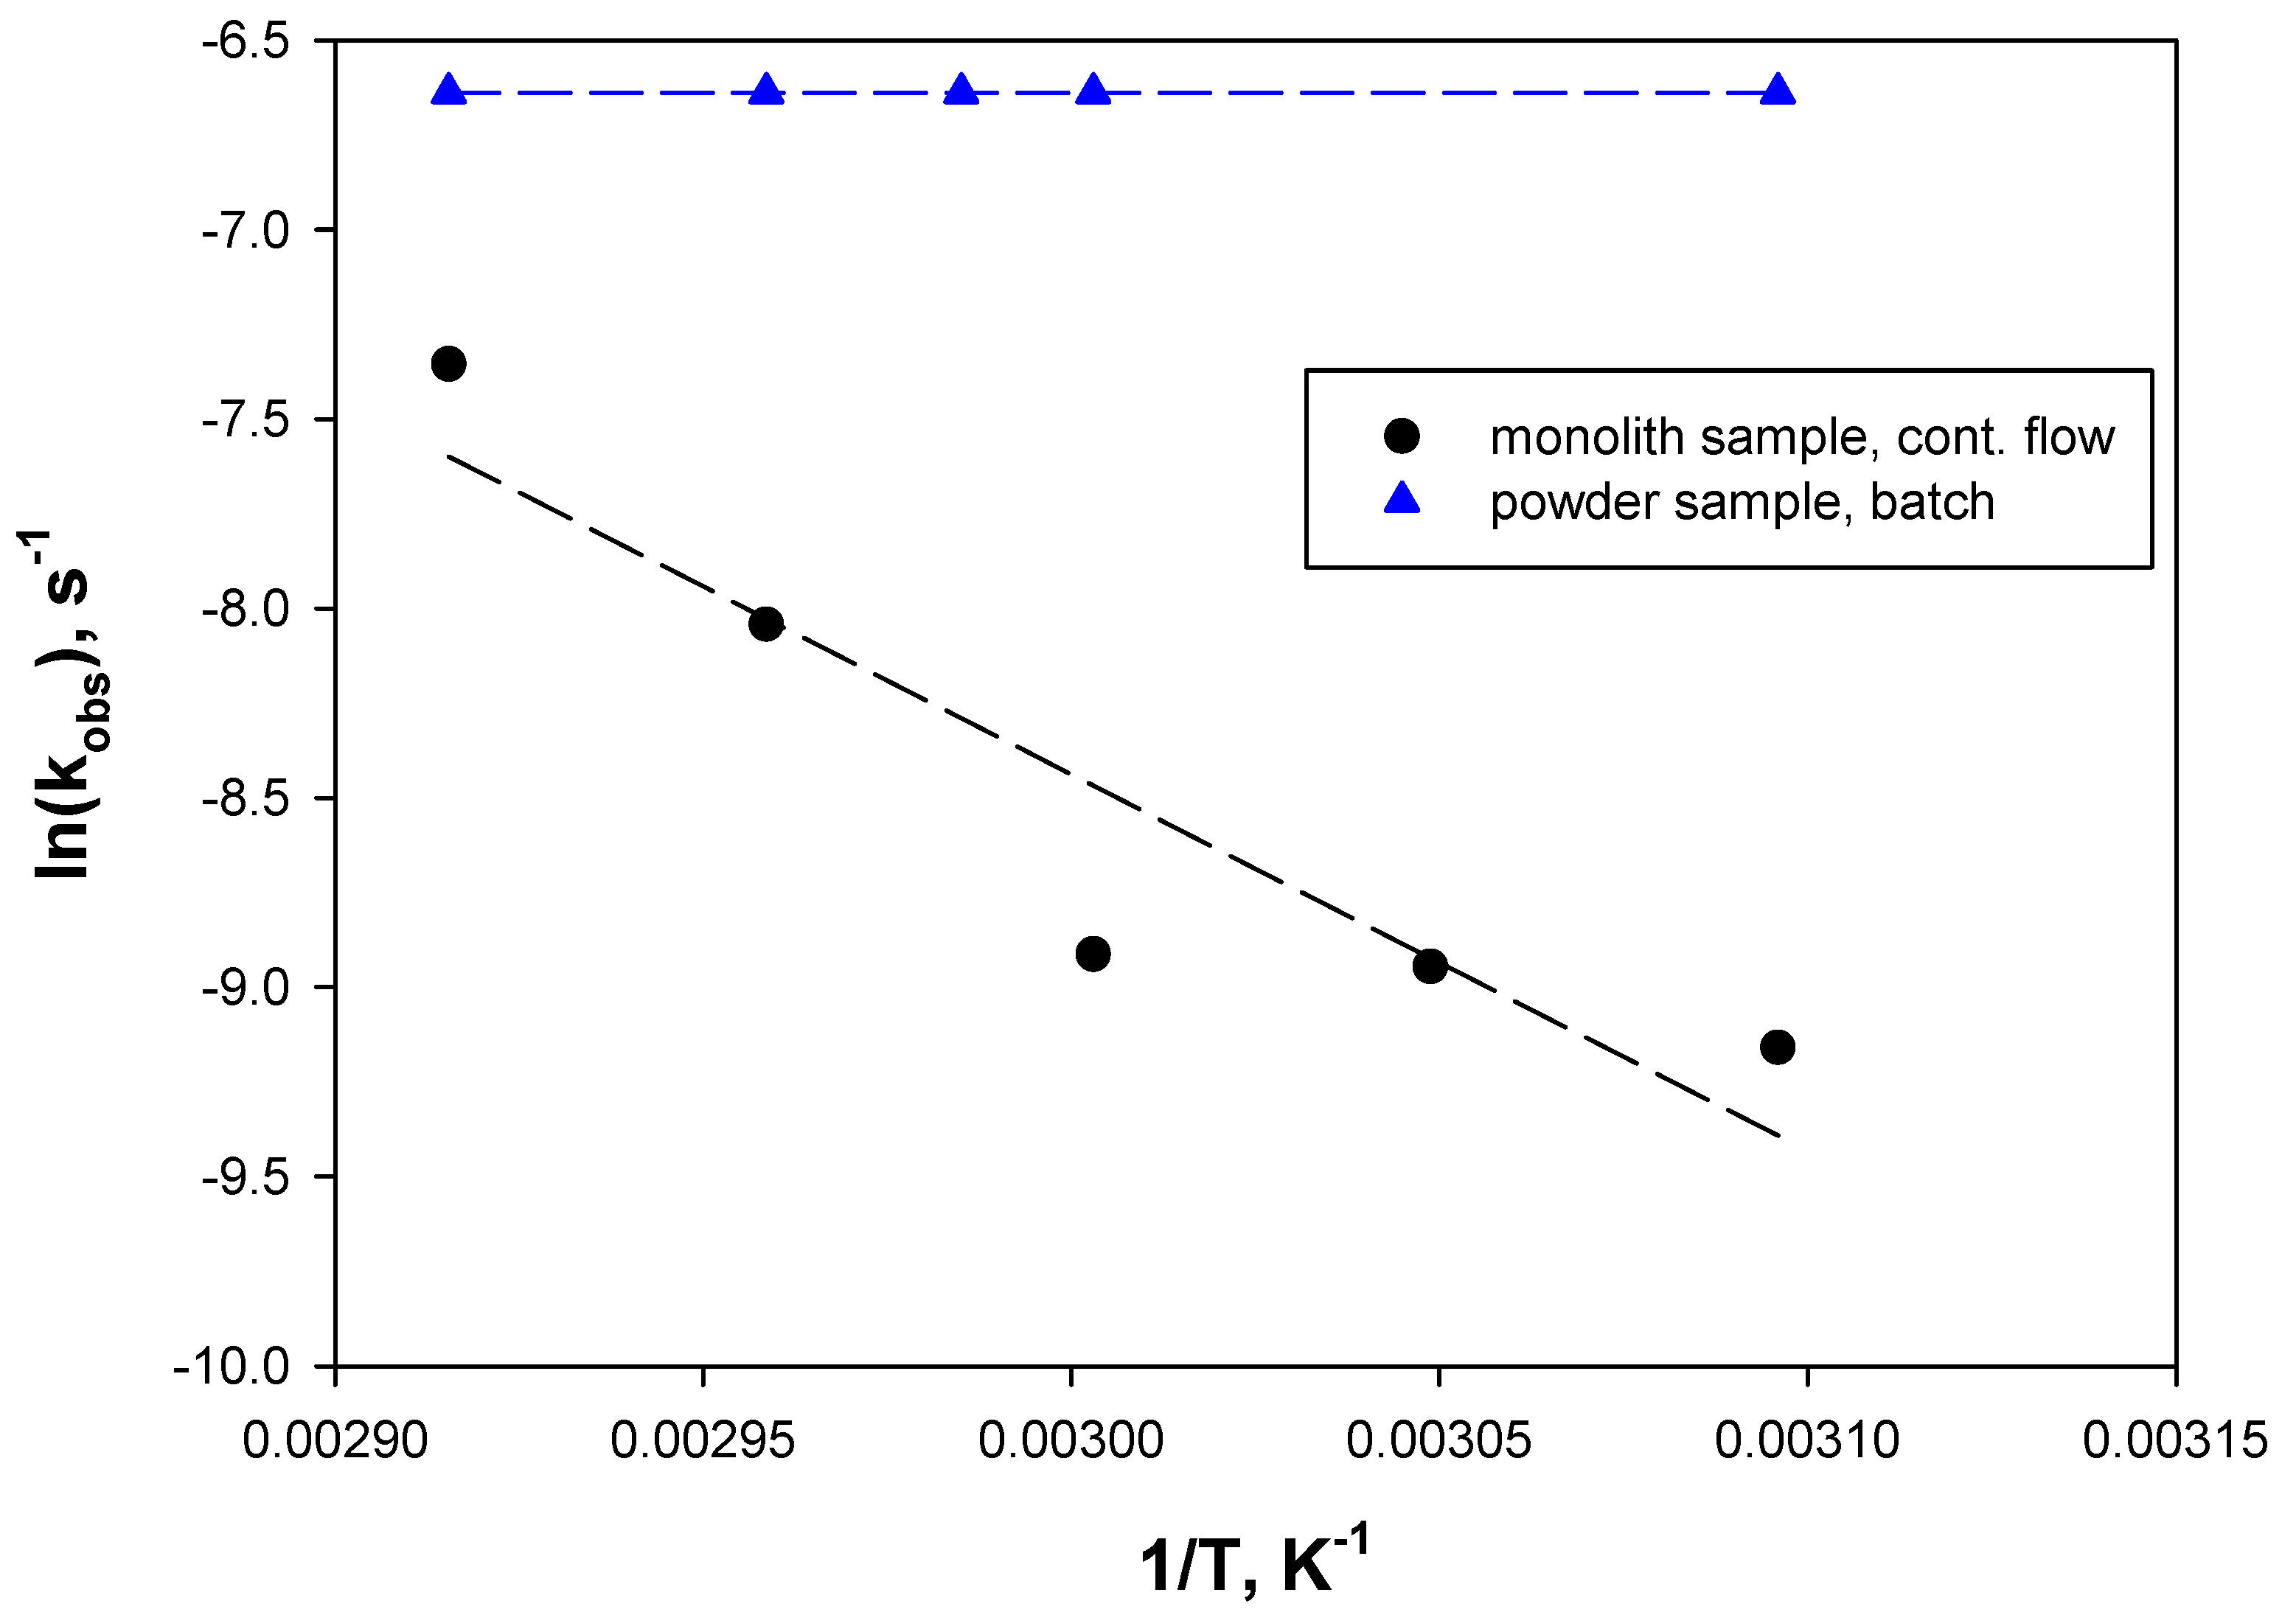
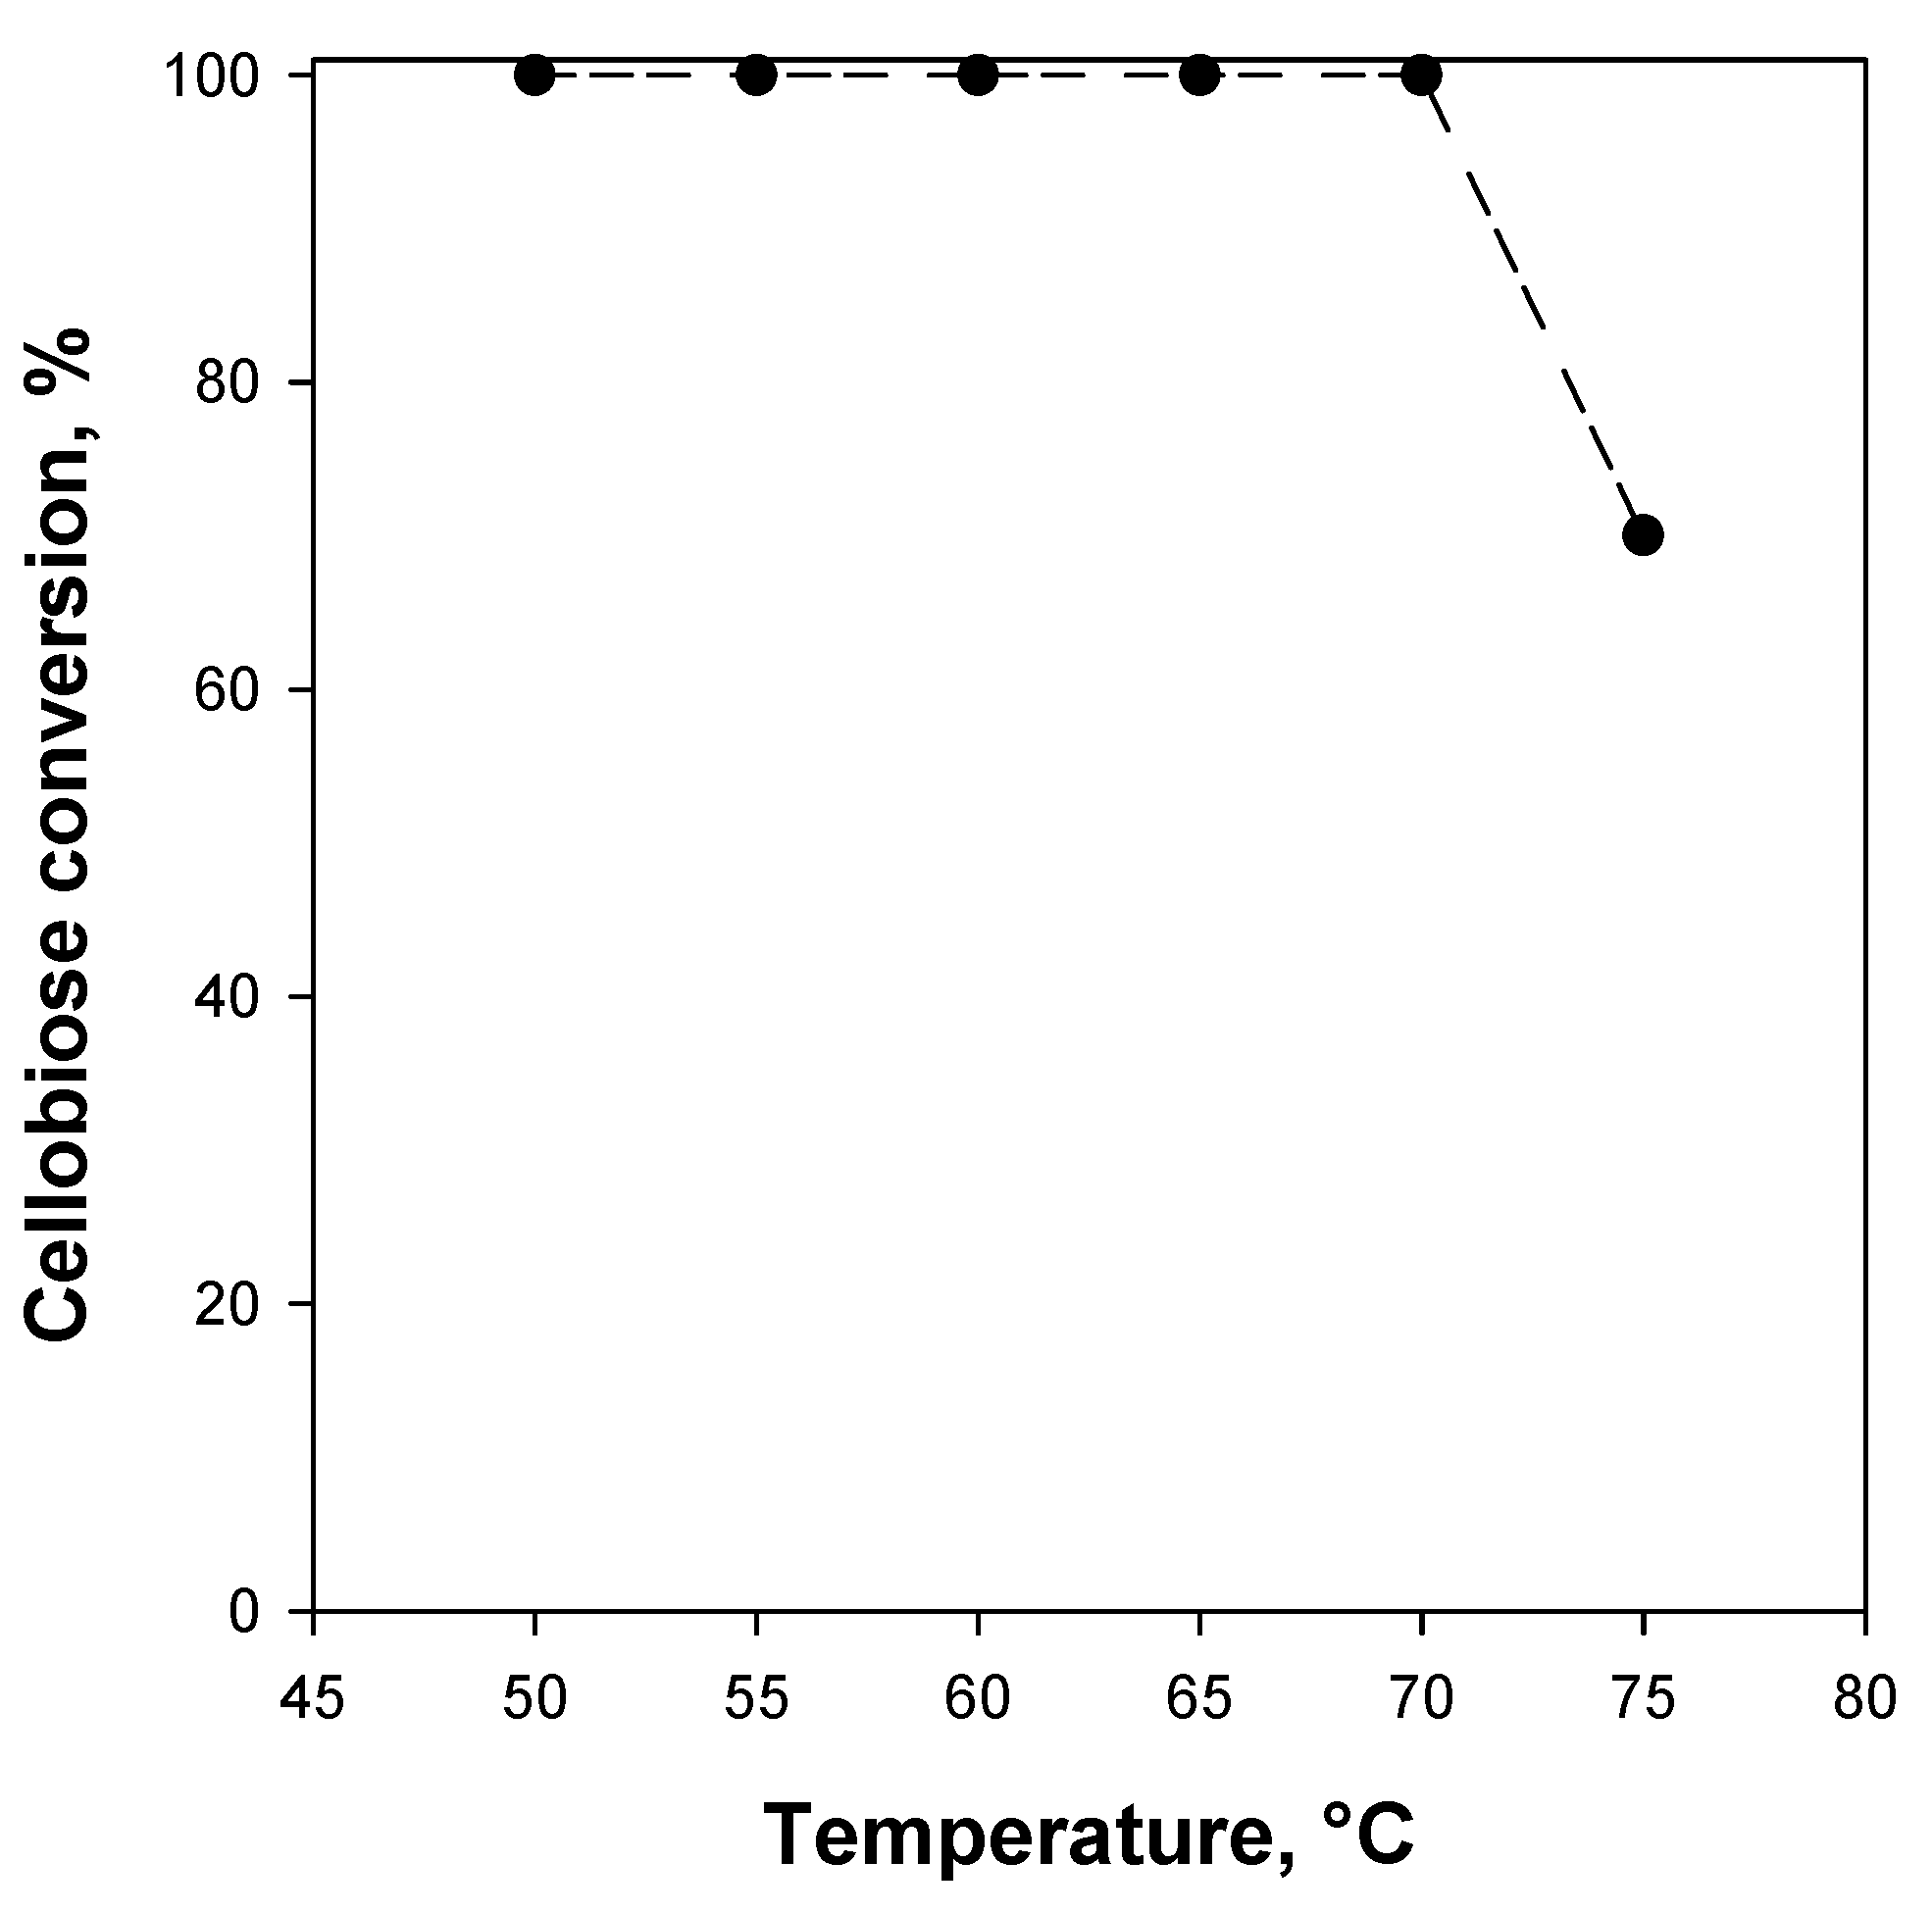
Figure 3 shows SEM images of monoliths washcoated with WSNs. As shown in Figure 3a,b, the washcoat is homogeneously deposited onto the walls. The holes detected in the washcoat can be ascribed to the macroporosity of the cordierite, suggesting a partial penetration of the nanoparticles inside the walls. The typical shape of the nanoparticles can be detected even after the washcoating procedure (Figure 3c), with no modification of the WSN structure occurring during the preparation of the structured catalyst. Figure 3d shows a cross-section of the monolith, where an enlargement showing a corner is reported in Figure 3e. Good washcoat distribution can be detected in these images too. A slight accumulation in the corner can be identified, as generally occurring in the honeycomb monoliths [32]. Both Figure 3c and e show a slight penetration of the WSNs inside the honeycomb walls. The mean washcoat thickness is about 4 μm.

2.4. Reaction Tests

Figure 4 shows the cellobiose conversion to glucose as a function of time as measured at T = 50 °C for the powder sample in batch, for the monolith sample in batch, and for the monolith sample, continuous flow reaction.
The monolith sample shows a higher conversion rate than the powder catalyst under the same reaction conditions, i.e., under batch reaction. The improved performance of the monolith sample under batch and mainly under continuous flow reaction conditions is evident by comparing the cellobiose conversion at a 2 h reaction time (or batch-equivalent contact time) reported in the inset of Figure 4. This is due to a better utilization of the active phase, related to the higher amount of adsorbed enzyme, the excess being placed in the monolith channels. Anyway, as shown later, the kinetic constants are quite the same. Full conversion is attained after 24 h. In the case of the monolith, different behavior is found when operating at batch or continuous mode: Complete conversion under continuous flow reaction conditions is attained at a batch-equivalent contact time equal to 120 min, much lower than the corresponding value obtained in the batch experiments (24 h).
The experimental data in Figure 4 were used to evaluate the apparent kinetic parameters KM and Vmax in the three cases. The results are summarized in Table 1.
The results obtained for the continuous case show a decrease in the KM value of about 20 times, while Vmax is constant. Enzyme immobilization can produce two types of effects: Conformational and/or micro-environmental [33]. Both will influence the kinetics of the catalyzed reaction. The conformational effects refer to structural variations of the enzyme molecule following the immobilization procedure. Alterations of the native three-dimensional structure of the enzyme and steric effects due to its proximity to the surface of the support will generally influence the Vmax of the catalyzed reaction. In our case, Vmax does not vary, indicating no detrimental effect from conformational changes to the enzyme. The micro-environment effects refer to mass transfer. The mass transport of the substrate from the bulk of the reaction medium to the active site of the enzyme will generally influence the KM value. In particular, an increase in KM indicates the presence of mass transfer limitations. In order to justify the marked decrease in KM for the continuous case, a study was carried out to verify that, in the batch case, limitations to external diffusive transport are established, while, in the continuous case, these effects are absent. A detailed description of the calculation is reported in Section 3.7.
In Figure 5, the natural logarithm of the observed kinetic constant is plotted as a function of the reciprocal of the reaction temperature. The kinetic constant, i.e., the reaction rate, expressed by powder WSNs under batch reaction conditions is insensitive to the temperature, suggesting external mass transfer limitations. On the contrary, the reaction rate of the structured catalyst under continuous flow reaction conditions increases by increasing the temperature, suggesting kinetic limitation and, thus, faster mass transfer from the bulk of the solution to the biocatalyst surface. The deviation in the experimental points with respect to the linearity can be due to a mixed regime (limited kinetic and internal mass transfer) or to deviation in the kinetics from the first order, as approximated for the calculations (see Section 3.7).
The values of the Thiele modulus (see Section 3.7) and, thus, the efficiency of the structured biocatalyst were calculated. The efficiency is equal to 1 independently from the reaction temperature, suggesting that there is no internal mass transfer limitation.
This KM decrease was also reported previously [34,35]. It is assumed that better mass transfer and heat transfer in the continuous case with respect to the batch case contribute to the improvement in kinetic parameters.
Figure 6 shows the effect of the temperature on the cellobiose conversion over the WSN monolith under continuous flow reaction conditions. By increasing the temperature up to 70 °C, a cellobiose conversion of 100% is retained; because a 2 h batch-equivalent contact time corresponds to the first full conversion detected at 50 °C, no deactivation occurs up to 70 °C. A further temperature increase causes a drastic performance reduction. These results agree with those reported on powder WSNs under batch reaction conditions [18] showing increased stability of the immobilized enzyme compared to the free one between 50 and 70 °C; this result suggests that neither washcoating onto the monolith walls nor the flow conditions affect the BG thermostability. As stated above, no deactivation occurs between 50 and 70 °C; however, due to the full conversion measured within this temperature range, an eventual activity increase could not have been measured. This eventuality is not so remote, because the calcined WSNs show a larger void fraction and, thus, lower mass transfer limitations, generally associated with constant activity at different temperatures.
As known, enzymes are proteins containing acid carboxylic groups (COOH) and basic amino groups (NH2). Therefore, enzyme activity is affected by the pH value, each enzyme being characterized by an optimal pH value. Figure 7 shows the residual activity as a function of pH for the WSN monolith under continuous flow reaction conditions. With respect to the standard conditions, i.e., pH = 5, higher pH values are beneficial for the BG activity. Interestingly, a more acidic reaction environment causes a significant activity reduction at pH = 3, while at pH = 4, the activity seems unaffected. According to these results, the BG activity is unaffected or even improved in a significant pH range; this also means that no performance reduction is expected with normal pH oscillations of the reacting mixture.

3. Materials and Methods

3.1. WSNs Synthesis

Wrinkled silica nanoparticles were synthesized as specified in [36]. Briefly, 8.96 g of cetylpyridinium bromide and 5.38 g of urea were dissolved in 268 mL of water; 268 mL of cyclohexane and 8.24 mL of iso-propanol were added to the solution. Tetraethyl orthosilicate (TEOS) was added dropwise to the stirred solution for a final volume of 24.0 mL. The solution was stirred for 30 min at room temperature, and then the reaction mixture was heated up to 70 °C for 16 h in a closed system. The surfactant removal was obtained by hydrochloric acid extraction. The nanoparticles were finally washed three times with ethanol.

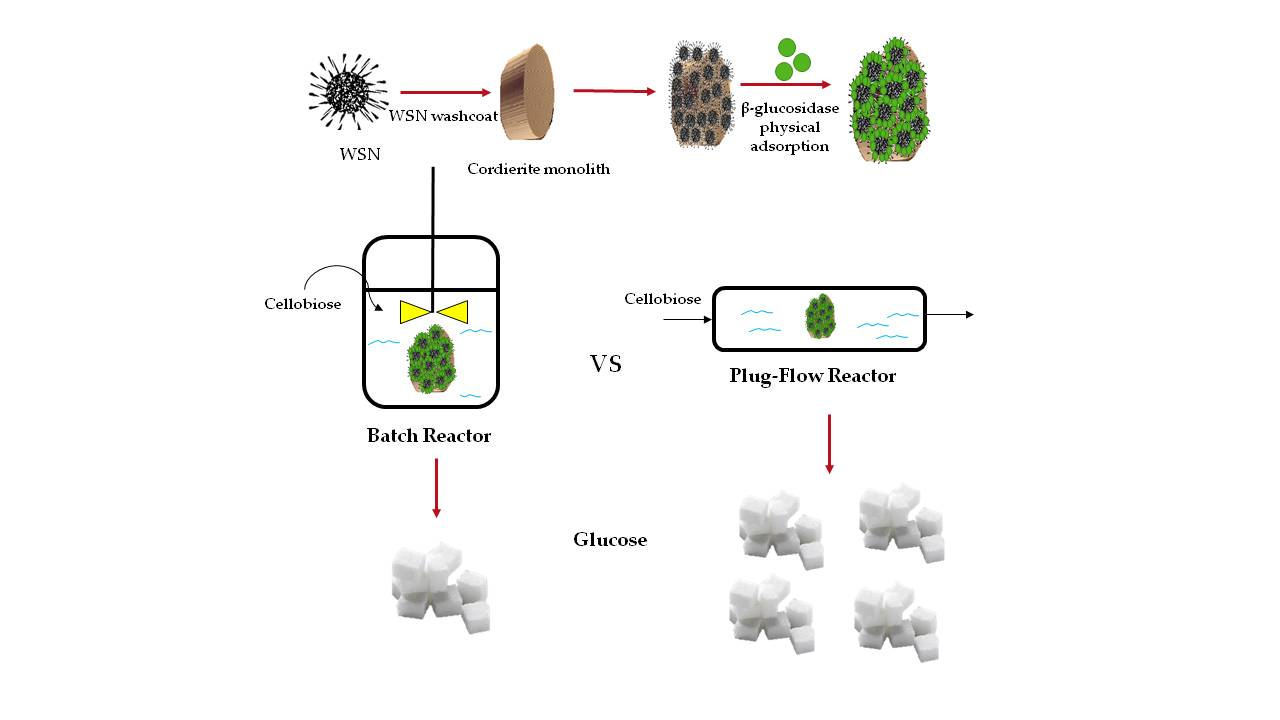
3.2. Monolith Preparation

Structured reactors were prepared according to the procedure reported in [23,27] and adapted to the specific features of the proposed materials. Commercial honeycomb monoliths (cordierite, 600 cpsi; NGK) were cut in the desired shape and dimension (cylinder; D = 16 mm; L = 12 mm). The active layer was deposited by dip-coating using a slurry containing the as-prepared wrinkled SiO2 nanoparticles without further treatment. No binder was added to the water suspension. After each impregnation, the monoliths were dried at 120 °C for 20 min, calcined for 2 h at 450 °C, and then weighed. This procedure was repeated four times for each monolith until the target weight (about 0.05 g) of silica was reached.

3.3. Immobilization Procedure

The adsorption was carried out in a buffer solution at pH 5 containing 0.03 mM of β-glucosidase and 2 mg/mL of WSNs. The mixture was kept under gentle stirring overnight at room temperature. The nanoparticles containing BG (BG/WSNs) were removed by centrifugation at 11,000 rpm for 10 min, washed twice with the buffer solution to remove the enzyme that had not been adsorbed, and stored in buffer at 4 °C. The adsorption of the enzyme on the structured substrates was carried out in the same conditions as in the case of the powder biocatalyst. The adsorption of the enzyme on the structured substrates was carried out in the same conditions as in the case of the powder biocatalyst. In this case, the biocatalysts obtained were dipped in a new buffer solution at pH 5 for 10 min in order to be separated from the amount of non-adsorbed enzyme.

3.4. Materials Characterizations

The morphology of pristine WSN, calcined WSN, and biocatalyst (BG/WSN) was evaluated by transmission electron microscopy (TEM) (PHILIPS EM208S microscope equipped with a Mega View camera for digital acquisition of images).
The internal morphology of channels was observed using an FEI Inspect scanning electron microscope (SEM). A monolith was cut in order to analyze the inner channels.
In order to test the adhesion of the washcoat on the cordierite walls, dried monoliths were placed in an ultrasound bath for 15 min and the weight loss was measured. The weight loss percentage was related to the ceria washcoat and calculated according to the following equation:
W f W u W f W 0 · 100
where Wf is the monolith weight at the end of the washcoating procedure, Wu is the monolith weight after sonication, and W0 is the weight of the uncoated monolith. The measured weight loss is negligible (≈ 3%), suggesting a good adhesion of the WSN washcoat on the monolith walls.
The organic content of each sample was estimated by thermogravimetric analysis (TGA) using a thermogravimetric apparatus Q600SDT, under air atmosphere, in a temperature range between 25 and 800 °C and at a heating rate of 10 °C/min. Sample masses were 10 mg, and they were put in a platinum crucible.
A Nicolet Instrument Nexus model (Thermo Scientific, Waltham, MA, USA) equipped with a DTGS KBr (deuterated triglycine sulfate with potassium bromide windows) detector was used to perform the FT-IR investigation. IR spectra were recorded in the 4000–400 cm–1 range with a 2 cm–1 resolution. The IR spectrum of each sample was corrected for the spectrum of blank KBr by mixing 199 mg of KBr and 1 mg of dried sample powders and pressing into pellets of 13 mm diameter.
The textural properties of bare WSNs and calcinated WSNs were determined by N2 adsorption at –196 °C with a Quantachrome Autosorb 1-C, after degassing for 4 h at 150 °C. The Brunauer–Emmett–Teller (BET) method was adopted for the calculation of the specific surface area, while pore size distribution was evaluated by means of the Barrett–Joyner–Halenda (BJH) adsorption method for mesopores and Dubinin–Astakov (DA) method for micropores.

3.5. Batch Reactor Setup

Batch experiments were carried out in a closed vessel at pH 5 and 50 °C using 8 mM cellobiose as a substrate under gentle stirring. The amount of BG was 0.15 mg/mL for all samples. The reaction kinetics was monitored at different times (10, 30, 60, 120, 240, and 1440 min) by making subsequent samplings. The reaction was stopped by thermal inactivation at 100 °C for 10 min. The samples were centrifuged for 10 min at 11,500 rpm to remove the biocatalysts and the supernatant was analyzed for glucose detection.

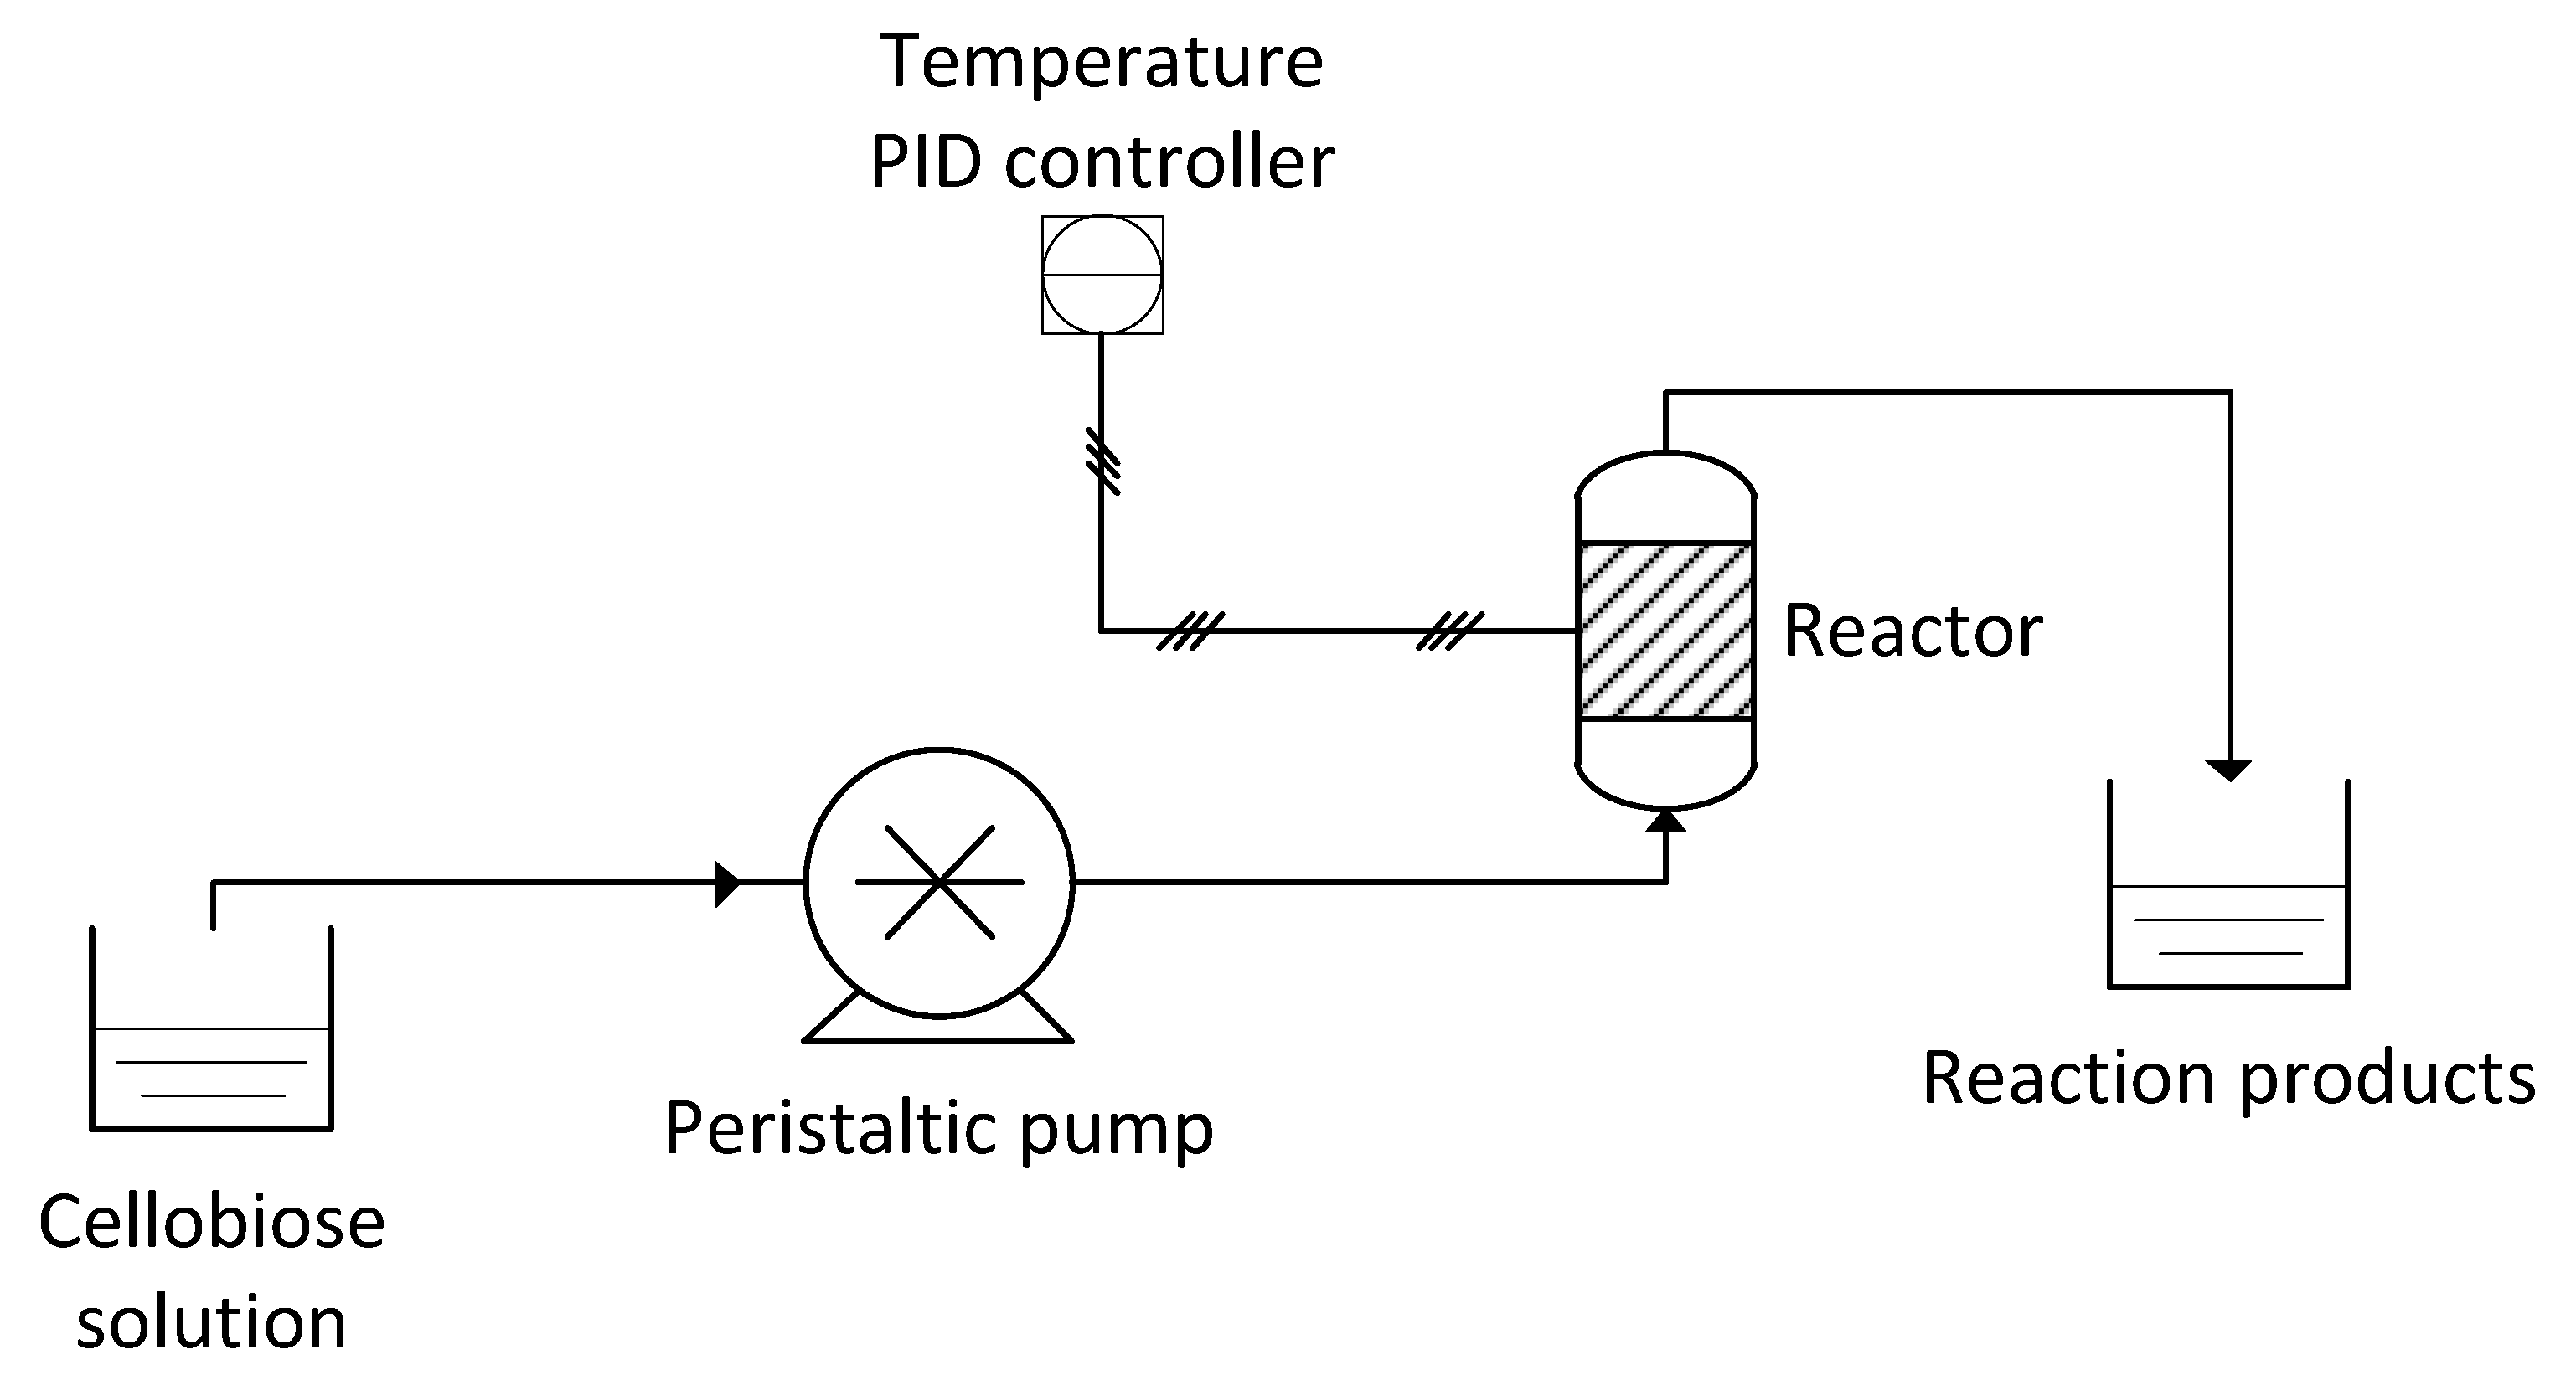
3.6. Continuous Flow Reactor Setup

Continuous flow experiments were carried out in a lab-scale rig (Figure 8). A peristaltic pump (Gilson Minipuls 3) was used to control the liquid flow rate. A Pyrex tube was used to host the monolith; in order to obtain a homogenous flow, the reactor was placed vertically and the liquid flowed bottom to top (upflow). A heating tape and a temperature proportional-integral-derivative (PID) controller provided with a K-type thermocouple were used to control the reaction temperature. The temperature was measured on the outer surface of the Pyrex tube near the exit of the monolith. The flow exiting the rector was collected and analyzed according to the procedure reported in the previous Section.
Contact time is defined as follows:
τ = W c a t m F ,
where Wcat-m is the biocatalyst mass in the monolithic reactor (i.e., the mass of the active layer, ceramic monolith excluded) and F is the flow rate. In order to compare batch and continuous tests, a batch-equivalent contact time (tbatch) is defined as follows:
t b a t c h = τ · V b a t c h W c a t p ,
where Vbatch and Wcat-p are the volume of solution and the biocatalyst mass used in the batch experiments, respectively.
Catalytic tests are conducted isothermally. However, the current reaction temperature can be modified by the thermicity of the reaction. To this end, the adiabatic temperature increase (ΔTad) has been calculated according the following equation:
T a d = c C · H r c p · ρ ,
where cC is the concentration of cellobiose in the starting solution (mol/m3), ΔHr is reaction heat (kJ/mol), cp is the specific heat of the reacting mixture (kJ/(kg·K)), and ρ is the density of the reacting mixture (kg/m3).
The reaction heat has been calculated as follows:
H r = Σ ν i Δ H i ,
where νi is the stoichiometric coefficient (positive for the products and negative for the reagents) and ΔHi is the heat of formation (kJ/mol). The reaction is:
C 12 H 22 O 11 + H 2 O 2 C 6 H 12 O 6 ,
Table 2 shows the values of the parameters used to calculate the ΔTad.
The value of ΔTad is equal to 3.5 K. This value is low enough to consider the reaction temperature independent from the cellobiose conversion and equal to the measured temperature.The monolithic sample was re-used several times, showing stable operation. Long runs (>100 h) will be carried out in a future work. Repeated tests showed a difference within the experimental error (±5%).

3.7. Glucose Analysis, Determination of Kinetic Constants and of Mass Transfer Limitations

For both the continuous and batch reactor, several withdrawals were analyzed with a glucose (GO) assay kit. The amount of glucose was determined by incubating the reaction mixture (1 mL), previously diluted, with 2 mL of glucose-measuring reagent at 37 °C for 30 min, based on the D-glucose oxidase–peroxidase method [37]. Absorbance was measured at 540 nm by a spectrometer instrument (Perkin Elmer Instruments, Lambda 25 UV/Vis).
The kinetic parameters were determined by the integrated rate equation, based on the evaluation of the substrate concentration over time. This equation is obtained by integrating the Michaelis–Menten one [33]:
1 t ln ( S i S ) = V m a x K m S i S t K m ,
where Si and S are the initial concentration and the concentration at time t of cellobiose. By plotting the first term as a function of (SiS)/t, the result is a straight line with slope –1/Km and intercept Vmax/Km.
The thermostability tests were carried out for both the continuous and the batch process. The hydrolysis reaction was carried out under the same experimental conditions, varying the temperature in an interval between 50 and 75 ° C and setting the contact time as a function of an equivalent batch time of 2 h.
The cellobiose molar flow rate Fc from the solution bulk toward the active surface is given by Equation (8).
F C = k m · a · ( C b C s ) ,
where km is the mass transfer coefficient, a is the external specific geometric surface of the structured catalyst, and Cb and Cs are the cellobiose concentrations in the solution bulk and on the catalytic surface, respectively. The external specific geometric surface a for a square-channel honeycomb is equal to
a = 4 l ,
where l is the channel side length, and is equal to
a = 6 d W S N ,
where dWSN is the mean WSN diameter.
Under steady-state conditions for the continuous flow reactor and at each time instant for the batch reactor, the reactant molar flow rate is equal to the reacted cellobiose, as there is no accumulation of species at the liquid–solid interface.
Due to the low cellobiose concentration, Michaelis–Menten kinetics can be approximated to first-order kinetics; therefore, the reaction rate equation is as follows:
r = k · C s ,
where k is the kinetic constant.
By equating Equations (8) and (11), the surface reactant concentration can be derived (Equation (12):
C s = ( k m · a · C b ) ( k + k m · a ) ,
By replacing Cs in Equation (11), the reaction rate equation is:
r = k · k m · a ( k + k m · a )   · C b ,
Actually, the observed kinetic constant kobs is a combination of the kinetic constant (k) and of the mass transfer coefficient (km):
k o b s = k · k m · a ( k + k m · a ) ,
Under the hypothesis of first-order kinetics, the reactant conversion (x) is given by Equation (15)
x = 1 e k o b s τ ,
where τ is the space-time for the continuous flow reactor; it is worth noting that, for the batch reactor, space-time is substituted by time (t). Thus, kobs can be easily evaluated by measurable values, according to the following equation:
k o b s = l n   ( 1 x ) τ   ,
To evaluate intra-diffusional limits, the Thiele modulus and the efficiency factor ƞ were calculated.
The Thiele modulus (Φ) for a structured biocatalyst is given by Equation (17):
Φ = δ · k · C b n 1 D   ,
where δ is the washcoat thickness deposited on the monolith walls and n is the reaction order.
The efficiency factor η can be then calculated as follows:
η = t a n h   ( Φ ) Φ   ,
In Table 3, the symbols used for mass transfer calculations, and their units and values (if constant), are reported.

4. Conclusions

In this work, the intensification and engineering of the enzymatic hydrolysis of cellobiose were carried out through the transition from a batch reactor to a flow reactor, by the application of ceramic cordierite monoliths washcoated with β-glucosidase immobilized into wrinkled silica nanoparticles. A good washcoat distribution was detected by SEM analysis, showing a partial penetration of the nanoparticles inside the walls. The washcoated nanoparticles preserved their individual nature.
The immobilized enzyme microreactors proved to be very efficient in increasing the conversion rate of cellobiose to glucose. The complete conversion under continuous flow reaction was attained at a batch-equivalent contact time equal to 120 min vs. 24 h obtained in the batch experiments. At a 2 h reaction time, the cellobiose conversion of powder WSNs and monoliths under batch reaction conditions was 54 and 70%, respectively, clearly showing the outstanding performance of the IEM especially under continuous flow. The apparent KM value showed a 20-fold decrease with respect to the batch process, due to the absence of external diffusive transport limitations.
These results indicate that the use of microfluidic reactors represents a good approach for the large-scale utilization of enzyme catalysts.

Author Contributions

Conceptualization, A.C. and A.D.B.; methodology, G.L. and V.C.; validation, A.D.B.; formal analysis, A.C. and V.C.; investigation, V.V., G.L. and F.S.; data curation, V.V. and V.C.; writing—original draft preparation, A.C., G.L. and V.C.; writing—review and editing, V.V., A.D.B. and F.S. All authors have read and agreed to the published version of the manuscript.

Funding

This research received no external funding.

Conflicts of Interest

The authors declare no conflict of interest.

References

  1. Javed, M.R.; Buthe, A.; Rashid, M.H.; Wang, P. Cost-efficient entrapment of β-glucosidase in nanoscale latex and silicone polymeric thin films for use as stable biocatalysts. Food Chem. 2016, 190, 1078–1085. [Google Scholar] [CrossRef]
  2. Miyazaki, M.; Honda, T.; Yamaguchi, H.; Briones, M.P.P.; Maeda, H. Enzymatic processing in microfluidic reactors. Biotechnol. Genet. Eng. Rev. 2008, 25, 405–428. [Google Scholar] [CrossRef]
  3. Seo, T.Y.; Eum, K.W.; Han, S.O.; Kim, S.W.; Kim, J.H.; Song, K.H.; Choe, J. Immobilized cell microchannel bioreactor for evaluating fermentation characteristics of mixed substrate consumption and product formation. Process Biochem. 2012, 47, 1011–1015. [Google Scholar] [CrossRef]
  4. Lévesque, F.; Seeberger, P.H. Continuous-flow synthesis of the anti-malaria drug artemisinin. Angew. Chem-Int. Ed. 2012, 51, 1706–1709. [Google Scholar] [CrossRef]
  5. Song, J.; Imanaka, H.; Imamura, K.; Kajitani, K.; Nakanishi, K. Development of a highly efficient indigo dyeing method using indican with an immobilized β-glucosidase from Aspergillus niger. J. Biosci. Bioeng. 2010, 110, 281–287. [Google Scholar] [CrossRef]
  6. Thomsen, M.S.; Nidetzky, B. Coated-wall microreactor for continuous biocatalytic transformations using immobilized enzymes. Biotechnol. J. 2009, 4, 98–107. [Google Scholar] [CrossRef]
  7. Barsan, M.M.; David, M.; Florescu, M.; Ţugulea, L.; Brett, C.M.A. A new self-assembled layer-by-layer glucose biosensor based on chitosan biopolymer entrapped enzyme with nitrogen doped graphene. Bioelectrochemistry 2014, 99, 46–52. [Google Scholar] [CrossRef]
  8. Kecskemeti, A.; Gaspar, A. Preparation and characterization of a packed bead immobilized trypsin reactor integrated into a PDMS microfluidic chip for rapid protein digestion. Talanta 2017, 166, 275–283. [Google Scholar] [CrossRef] [Green Version]
  9. Gunda, N.S.K.; Singh, M.; Norman, L.; Kaur, K.; Mitra, S.K. Optimization and characterization of biomolecule immobilization on silicon substrates using (3-aminopropyl) triethoxysilane (APTES) and glutaraldehyde linker. Appl. Surf. Sci. 2014, 305, 522–530. [Google Scholar] [CrossRef]
  10. Malecha, K.; Remiszewska, E.; Pijanowska, D.G. Surface modification of low and high temperature co-fired ceramics for enzymatic microreactor fabrication. Sens. Actuators B Chem. 2014, 190, 873–880. [Google Scholar] [CrossRef]
  11. Křenková, J.; Foret, F. Immobilized microfluidic enzymatic reactors. Electrophoresis 2004, 25, 3550–3563. [Google Scholar] [CrossRef]
  12. Schwarz, A.; Thomsen, M.S.; Nidetzky, B. Enzymatic synthesis of β-glucosylglycerol using a continuous-flow microreactor containing thermostable β-glycoside hydrolase CelB immobilized on coated microchannel walls. Biotechnol. Bioeng. 2009, 103, 865–872. [Google Scholar] [CrossRef]
  13. Wei, C.; Zhou, Y.; Zhuang, W.; Li, G.; Jiang, M.; Zhang, H. Improving the performance of immobilized β-glucosidase using a microreactor. J. Biosci. Bioeng. 2018, 125, 377–384. [Google Scholar] [CrossRef]
  14. Silvestri, B.; Vitiello, G.; Luciani, G.; Calcagno, V.; Costantini, A.; Gallo, M.; Parisi, S.; Paladino, S.; Iacomino, M.; D’Errico, G.; et al. Probing the Eumelanin-Silica Interface in Chemically Engineered Bulk Hybrid Nanoparticles for Targeted Subcellular Antioxidant Protection. ACS Appl. Mater. Interfaces 2017, 9, 37615–37622. [Google Scholar] [CrossRef]
  15. Branda, F.; Silvestri, B.; Costantini, A.; Luciani, G. Effect of exposure to growth media on size and surface charge of silica based Stöber nanoparticles: A DLS and ζ-potential study. J. Sol-Gel Sci. Technol. 2014, 73, 54–61. [Google Scholar] [CrossRef]
  16. Díaz, J.F.; Balkus, K.J. Enzyme immobilization in MCM-41 molecular sieve. J. Mol. Catal. B Enzym. 1996, 2, 115–126. [Google Scholar] [CrossRef]
  17. Hartono, S.B.; Qiao, S.Z.; Liu, J.; Jack, K.; Ladewig, B.P.; Hao, Z.; Lu, G.Q.M. Functionalized mesoporous silica with very large pores for cellulase immobilization. J. Phys. Chem. C 2010, 114, 8353–8362. [Google Scholar] [CrossRef]
  18. Sannino, F.; Costantini, A.; Ruffo, F.; Aronne, A.; Venezia, V.; Califano, V. Covalent immobilization of β-glucosidase into mesoporous silica nanoparticles from anhydrous acetone enhances its catalytic performance. Nanomaterials 2020, 10, 108. [Google Scholar] [CrossRef] [Green Version]
  19. Califano, V.; Costantini, A.; Silvestri, B.; Venezia, V.; Cimino, S.; Sannino, F. The effect of pore morphology on the catalytic performance of β-glucosidase immobilized into mesoporous silica. Pure Appl. Chem. 2019, 91, 1583–1592. [Google Scholar] [CrossRef]
  20. Califano, V.; Sannino, F.; Costantini, A.; Avossa, J.; Cimino, S.; Aronne, A. Wrinkled silica nanoparticles: Efficient matrix for β-glucosidase immobilization. J. Phys. Chem. C 2018, 122, 8373–8379. [Google Scholar] [CrossRef]
  21. Barbato, P.S.; Di Benedetto, A.; Landi, G.; Lisi, L. Structuring CuO/CeO2 catalyst as option to improve performance towards CO-PROX. Top. Catal. 2016, 59, 1371–1382. [Google Scholar] [CrossRef]
  22. Zhang, Q.; Shore, L.; Farrauto, R.J. Selective CO oxidation over a commercial PROX monolith catalyst for hydrogen fuel cell applications. Int. J. Hydrogen Energy 2012, 37, 10874–10880. [Google Scholar] [CrossRef]
  23. Lisi, L.; Pirone, R.; Russo, G.; Stanzione, V. Cu-ZSM5 based monolith reactors for no decomposition. Chem. Eng. J. 2009, 154, 341–347. [Google Scholar] [CrossRef]
  24. Tang, L.; Zhao, Z.; Li, K.; Yu, X.; Wei, Y.; Liu, J.; Peng, Y.; Li, Y.; Chen, Y. Highly active monolith catalysts of LaKCoO3 perovskite-type complex oxide on alumina-washcoated diesel particulate filter and the catalytic performances for the combustion of soot. Catal. Today 2020, 339, 159–173. [Google Scholar] [CrossRef]
  25. Gómez, L.E.; Sollier, B.M.; Lacoste, A.M.; Miró, E.E.; Boix, A.V. Hydrogen purification for fuel cells through CO preferential oxidation using PtCu/Al2O3 structured catalysts. J. Environ. Chem. Eng. 2019, 7, 103376. [Google Scholar] [CrossRef]
  26. Vita, A.; Italiano, C.; Ashraf, M.A.; Pino, L.; Specchia, S. Syngas production by steam and oxy-steam reforming of biogas on monolith-supported CeO2-based catalysts. Int. J. Hydrogen Energy 2018, 43, 11731–11744. [Google Scholar] [CrossRef]
  27. Landi, G.; Lisi, L.; Pirone, R.; Tortorelli, M.; Russo, G. NO decomposition over La-doped Cu-ZSM5 monolith under adsorption-reaction conditions. Appl. Catal. A Gen. 2013, 464–465, 61–67. [Google Scholar] [CrossRef]
  28. Du, X.; He, J. Hierarchically mesoporous silica nanoparticles: Extraction, amino-functionalization, and their multipurpose potentials. Langmuir 2011, 27, 2972–2979. [Google Scholar] [CrossRef]
  29. Venezia, V.; Sannino, F.; Costantini, A.; Silvestri, B.; Cimino, S.; Califano, V. Mesoporous silica nanoparticles for β-glucosidase immobilization by templating with a green material: Tannic acid. Microporous Mesoporous Mater. 2020, 302, 110203. [Google Scholar] [CrossRef]
  30. Bloisi, F.; Califano, V.; Perretta, G.; Nasti, L.; Aronne, A.; Di Girolamo, R.; Auriemma, F.; De Rosa, C.; Vicari, L.R.M. Lipase immobilization for catalytic applications obtained using fumed silica deposited with MAPLE technique. Appl. Surf. Sci. 2016, 374, 346–352. [Google Scholar] [CrossRef]
  31. Pan, D.; Yuan, P.; Zhao, L.; Liu, N.; Zhou, L.; Wei, G.; Zhang, J.; Ling, Y.; Fan, Y.; Wei, B.; et al. New understanding and simple approach to synthesize highly hydrothermally stable and ordered mesoporous materials. Chem. Mater. 2009, 21, 5412–5425. [Google Scholar] [CrossRef]
  32. Cimino, S.; Landi, G.; Lisi, L.; Russo, G. Development of a dual functional structured catalyst for partial oxidation of methane to syngas. Catal. Today 2005, 105, 718–723. [Google Scholar] [CrossRef]
  33. Illanes, A. Enzyme Biocatalysis: Principles and Applications; Springer: Dordrecht, The Netherlands, 2008. [Google Scholar]
  34. Liu, X.; Meng, X.Y.; Xu, Y.; Dong, T.; Zhang, D.Y.; Guan, H.X.; Zhuang, Y.; Wang, J. Enzymatic synthesis of 1-caffeoylglycerol with deep eutectic solvent under continuous microflow conditions. Biochem. Eng. J. 2019, 142, 41–49. [Google Scholar] [CrossRef]
  35. Muderrisoglu, C.; Sargin, S.; Yesil-Celiktas, O. Application of β-glucuronidase-immobilised silica gel formulation to microfluidic platform for biotransformation of β-glucuronides. Biotechnol. Lett. 2018, 40, 773–780. [Google Scholar] [CrossRef] [PubMed]
  36. Moon, D.S.; Lee, J.K. Tunable synthesis of hierarchical mesoporous silica nanoparticles with radial wrinkle structure. Langmuir 2012, 28, 12341–12347. [Google Scholar] [CrossRef] [PubMed]
  37. Bergmeyer, H.A. Methods of Enzymatic Analysis; Elsevier: Berlin, Germany, 1974. [Google Scholar]
Figure 1. TEM images of wrinkled silica nanoparticles (WSNs) before (a) and after calcination (b), and β-glucosidase (BG)/WSNs (c).
Catalysts 10 00889 g001
Figure 2. FT-IR spectra of WSNs before and after calcination at 450 °C.
Catalysts 10 00889 g002
Figure 3. SEM images of WSN monolith: (a) top view of the channel; zoom view of (b) washcoat surface (c) cordierite wall with washcoat (d) front view of the monolith channel; (e) zoom view of the corner of the channel.
Catalysts 10 00889 g003
Figure 4. Cellobiose conversion to glucose as a function of the reaction time or the batch-equivalent contact time over WSN catalysts: () Powder sample, batch reaction; () monolith sample, batch reaction; (●) monolith sample, continuous flow reaction. Temperature: 50 °C.
Catalysts 10 00889 g004
Figure 5. ln(kobs) as a function of the reciprocal of the reaction temperature over WSN catalysts: () Powder sample, batch reaction; (●) monolith sample, continuous flow reaction.
Catalysts 10 00889 g005
Figure 6. Cellobiose conversion to glucose as a function of the reaction temperature over WSN monolith catalysts. Batch-equivalent contact time: 2 h.
Catalysts 10 00889 g006
Figure 7. Residual activity of WSN monolith catalysts as a function of pH. Batch-equivalent contact time: 1 h; temperature: 50 °C.
Catalysts 10 00889 g007
Figure 8. Process flow diagram of the continuous flow test rig.
Catalysts 10 00889 g008
Table 1. Apparent kinetic parameters of different BG-based reaction systems.
Kinetic ConstantsFree BG [20]BG/WSNs PowderBG/WSNs/Monolith BatchBG/WSNs/Monolith Continuous
KM (mM)5.44.34.20.23
Vmax (μmol/min∗mg)43414241
Table 2. Parameters used to calculate the adiabatic temperature increase.
-ΔHi, kJ/molνicc, mol/m3cp, kJ/(kg·K)ρ, kg/m3
Cellobiose–5401.50–14.67--
Water–285.85–1---
Glucose–1273.302---
Mixture---4.1861000
Table 3. Parameters used to calculate mass transfer limitations.
ParameterUnitsValue
Fcmol m–3 s–1
k, kobss–1
kmm s–1
am−1
l, dWSNm0.001, 20 × 10–9
Cb, Csmol m–3
rmol m–3 s–1
τ, ts
x
dm0.001
Dm2 s–14.5 × 10⁻¹⁰
ρkg m–31000
um s–1
μkg m–1 s–15.47 × 10⁻⁴
δm4.00 × 10–6

