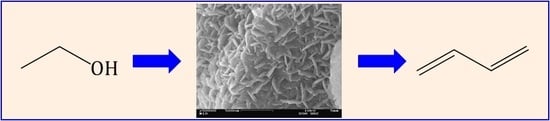
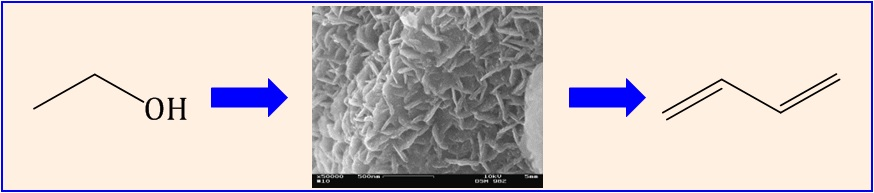
Studies on the Binary MgO/SiO2 Mixed Oxide Catalysts for the Conversion of Ethanol to 1,3-Butadiene


 ,
,
Abstract
1. Introduction
2. Results and Discussion
2.1. Binary MgO/SiO2 Mixed Oxides from Commercially Available Precursors
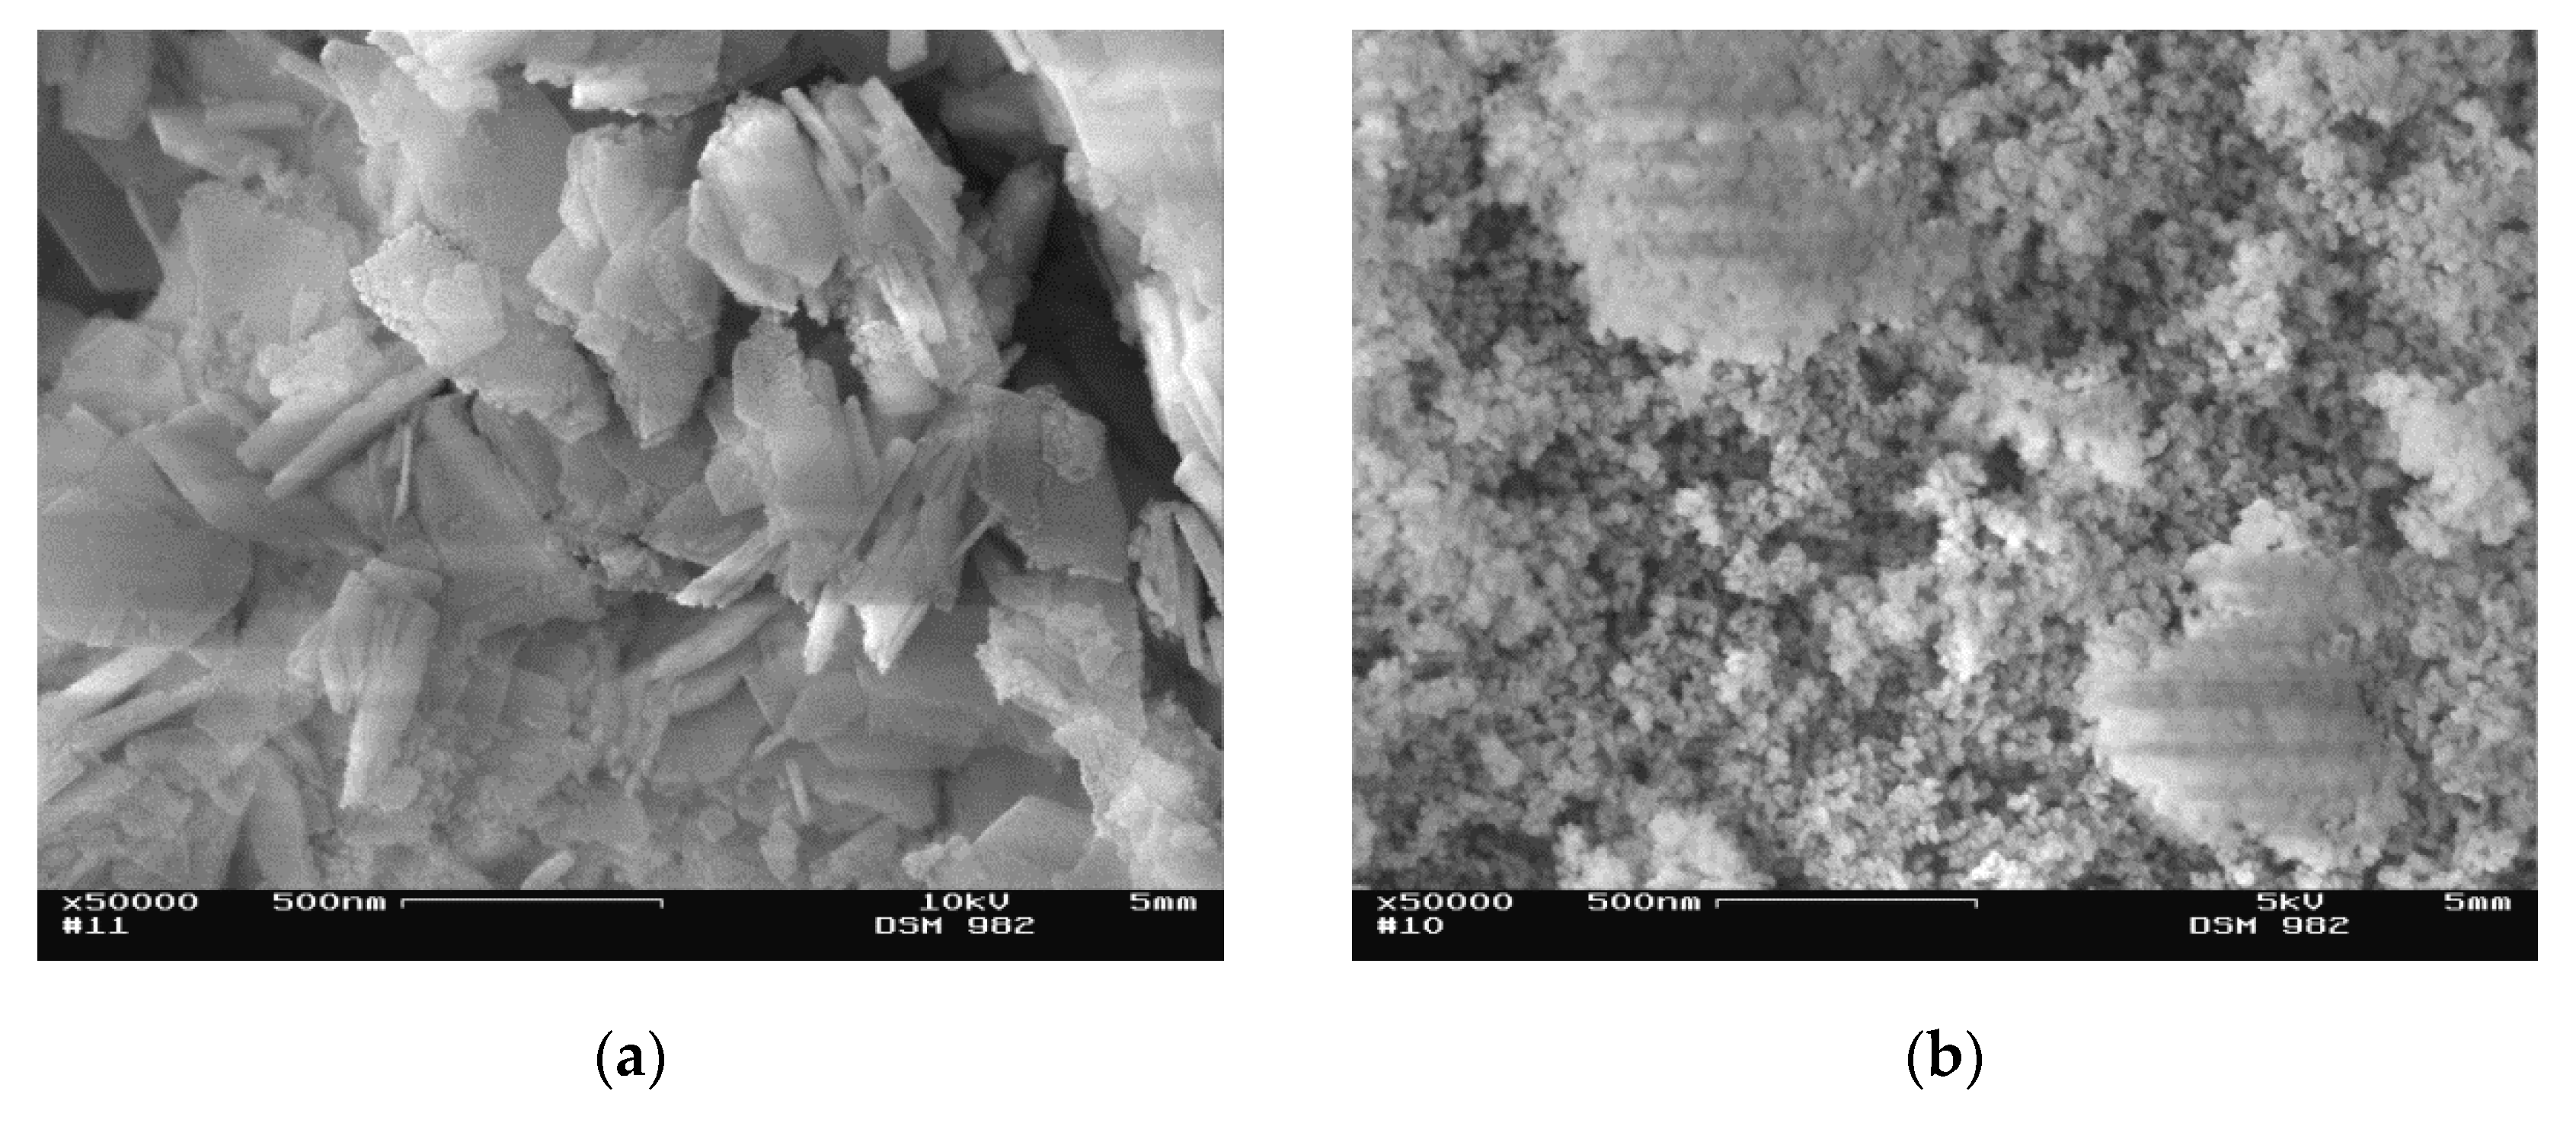
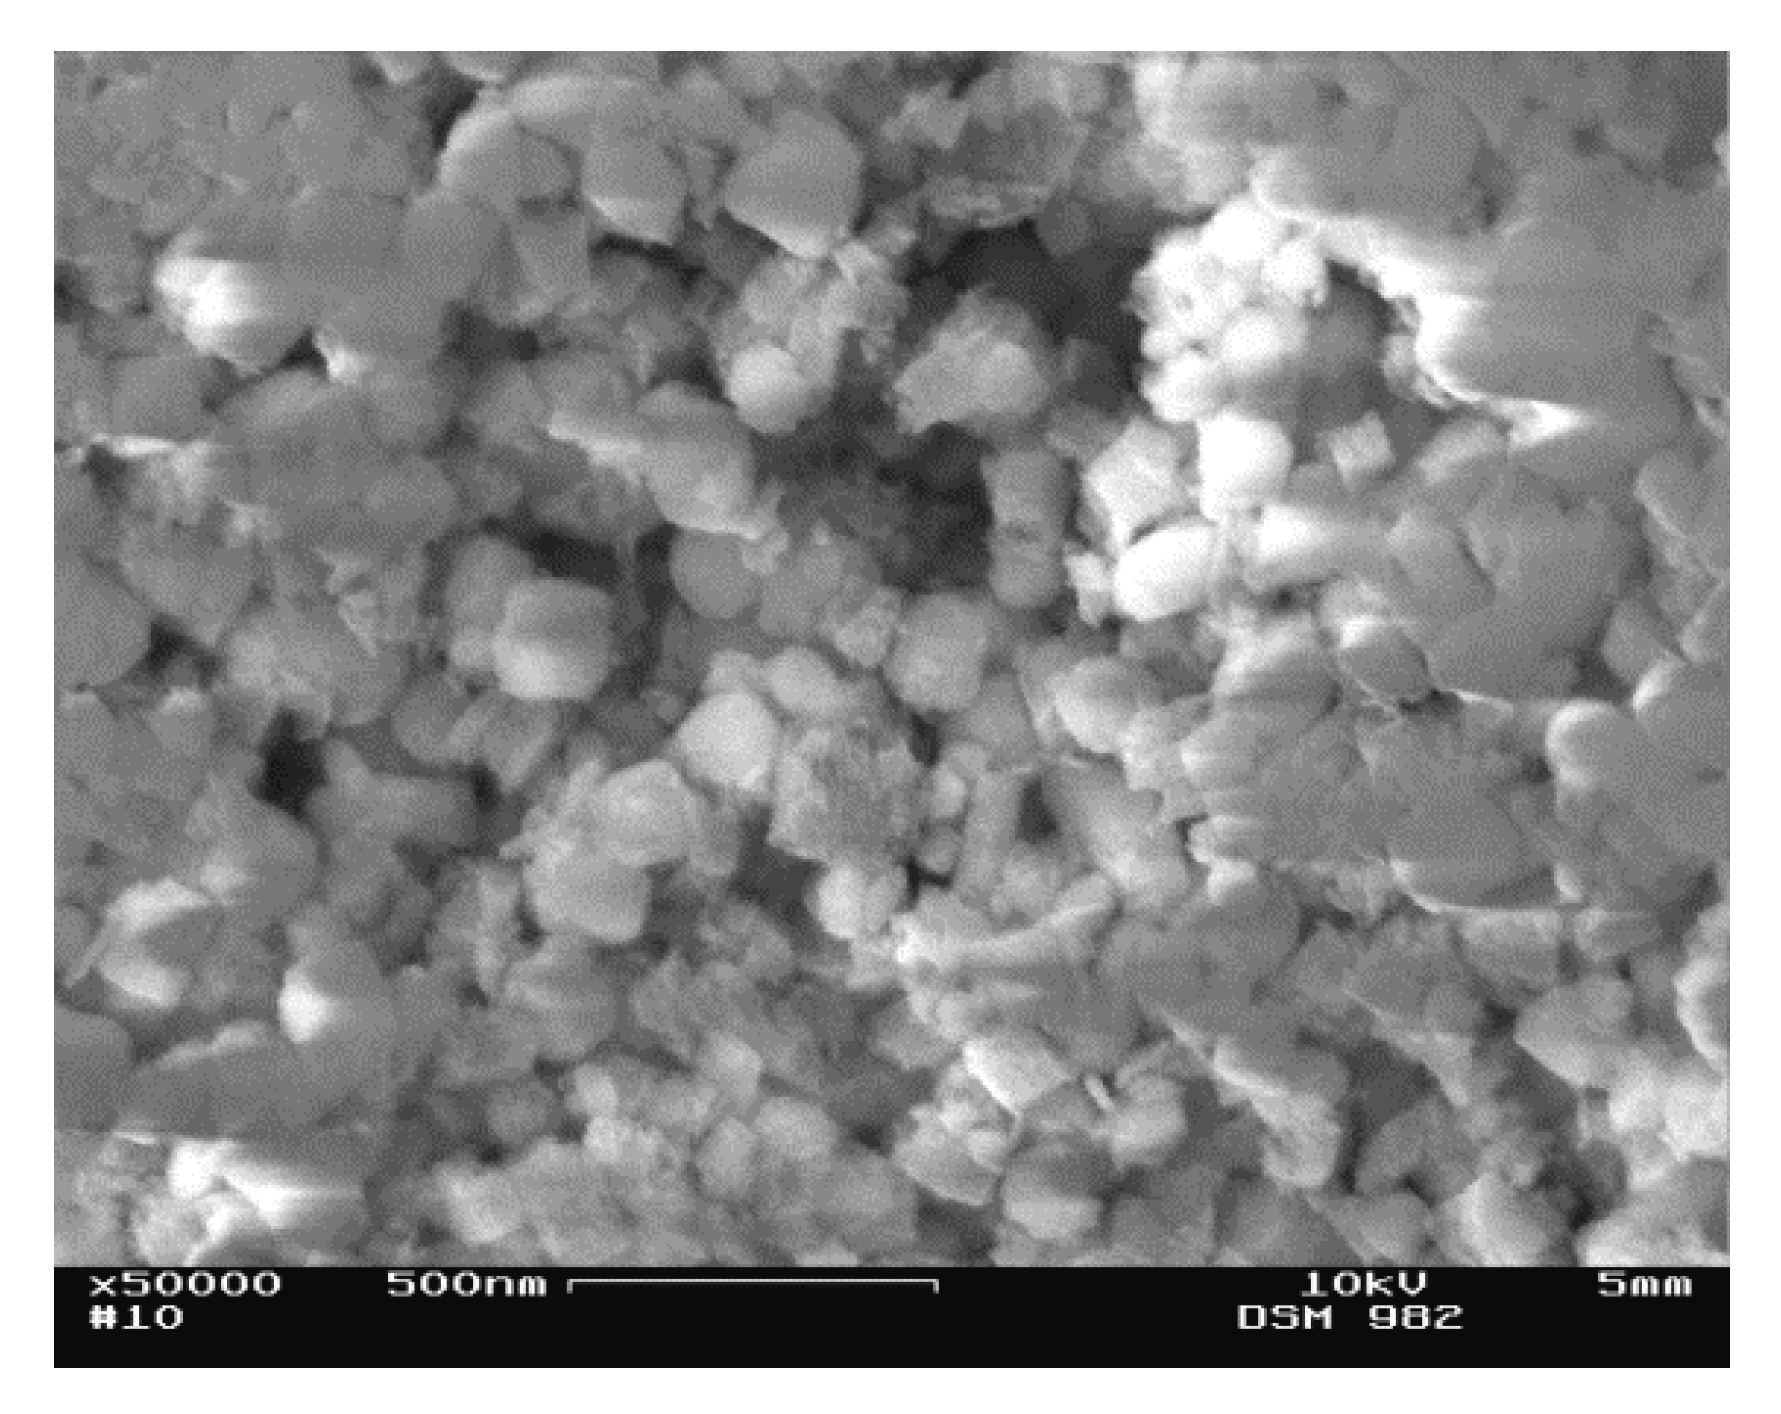
2.1.1. Characterization
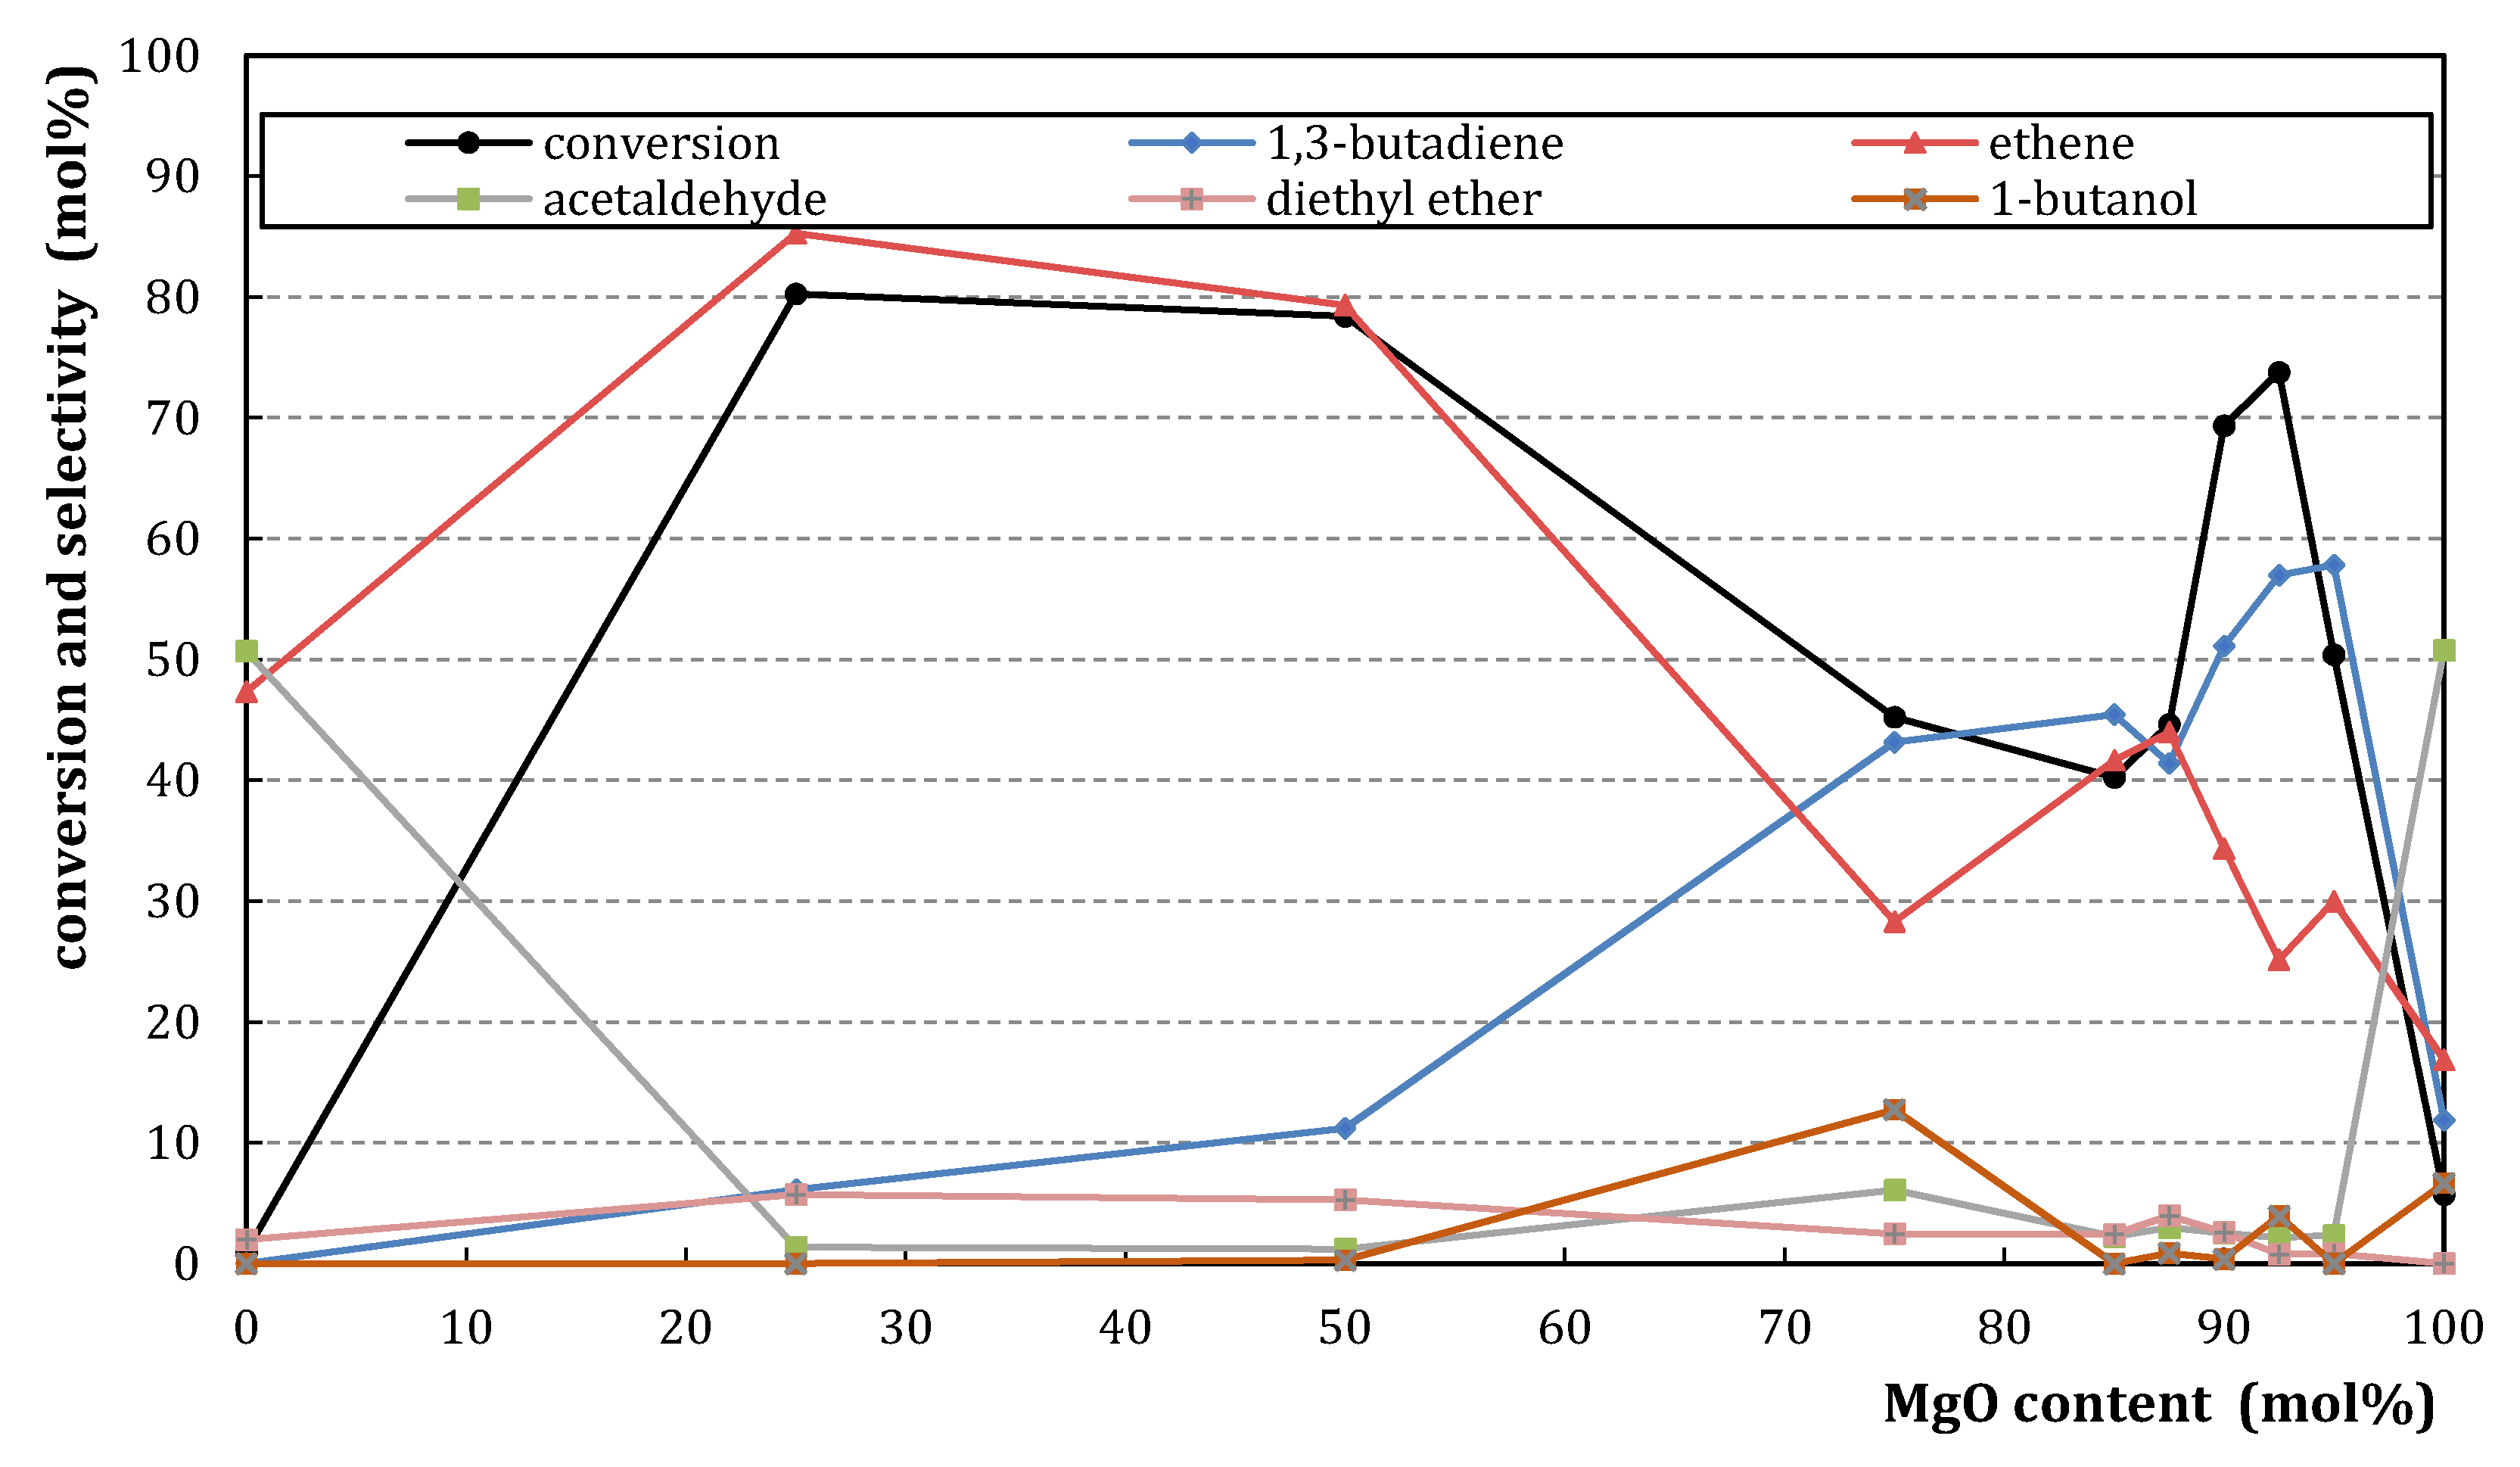
2.1.2. Catalytic Testing
2.2. Binary MgO/SiO2 Mixed Oxides with Mesoporous MgO
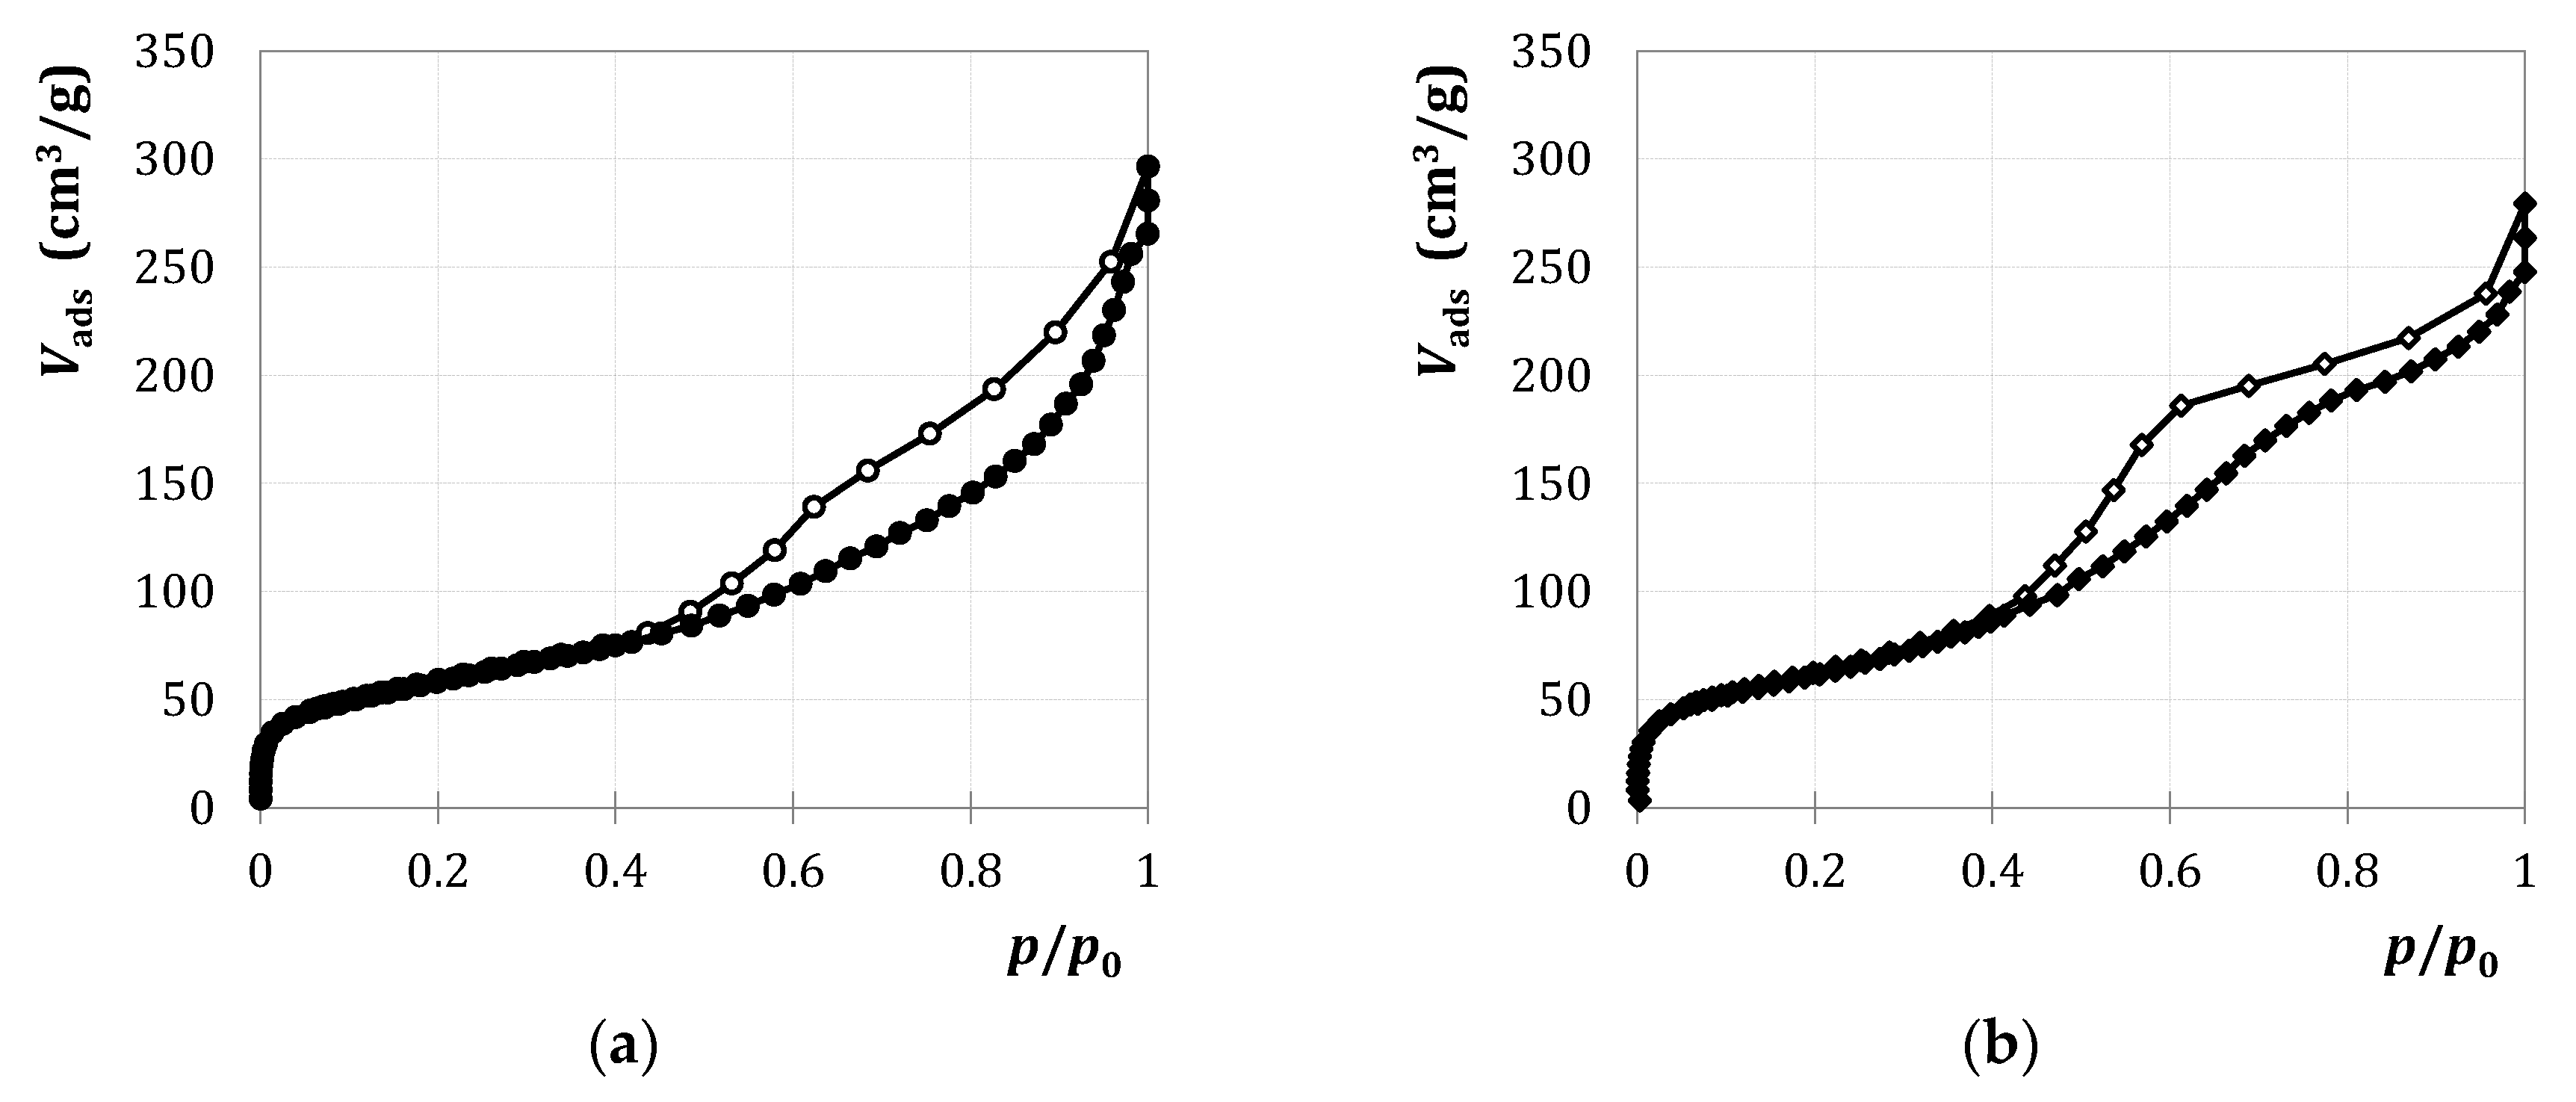
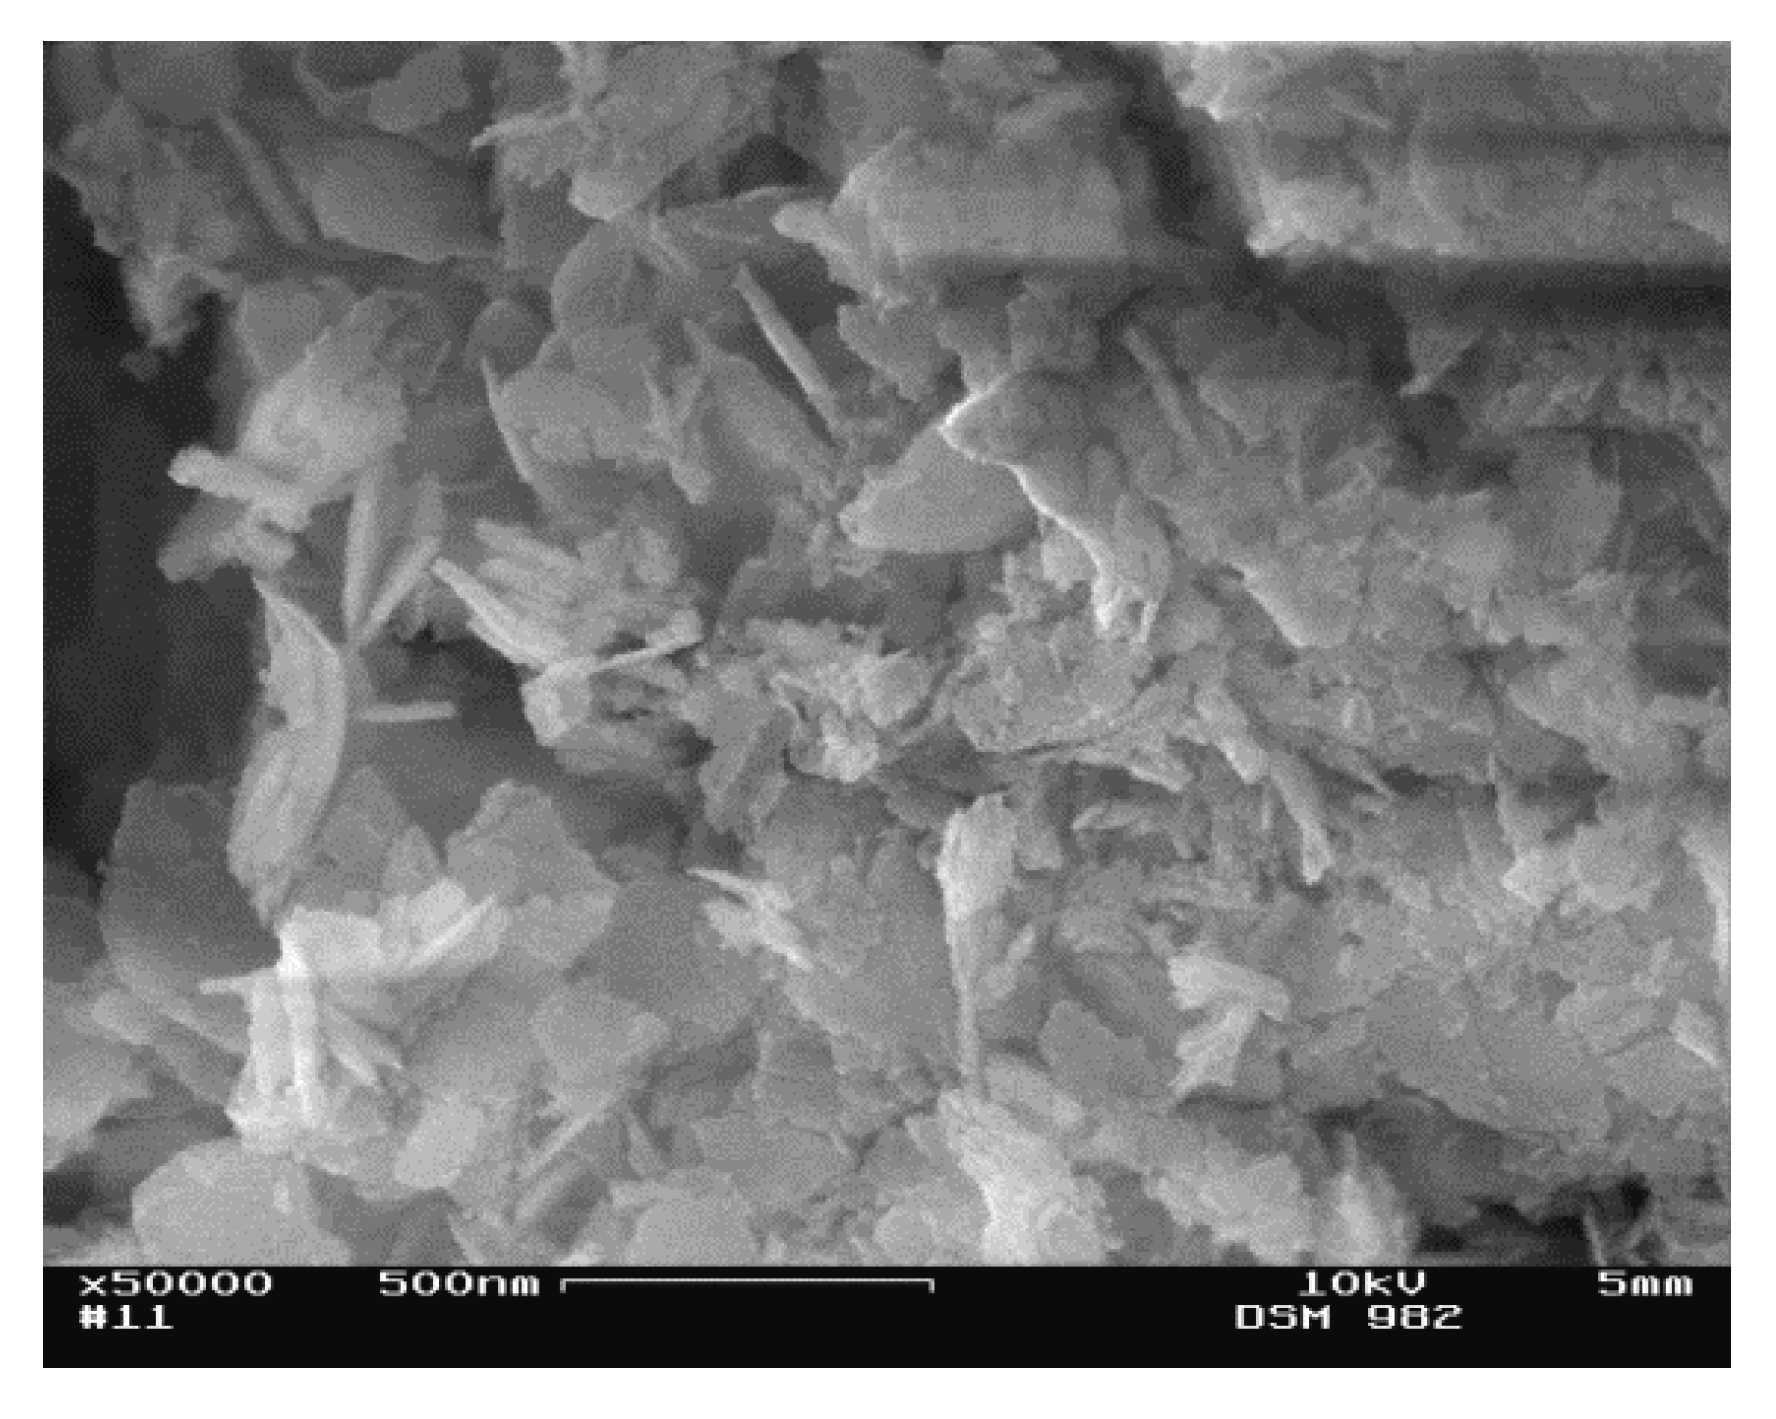
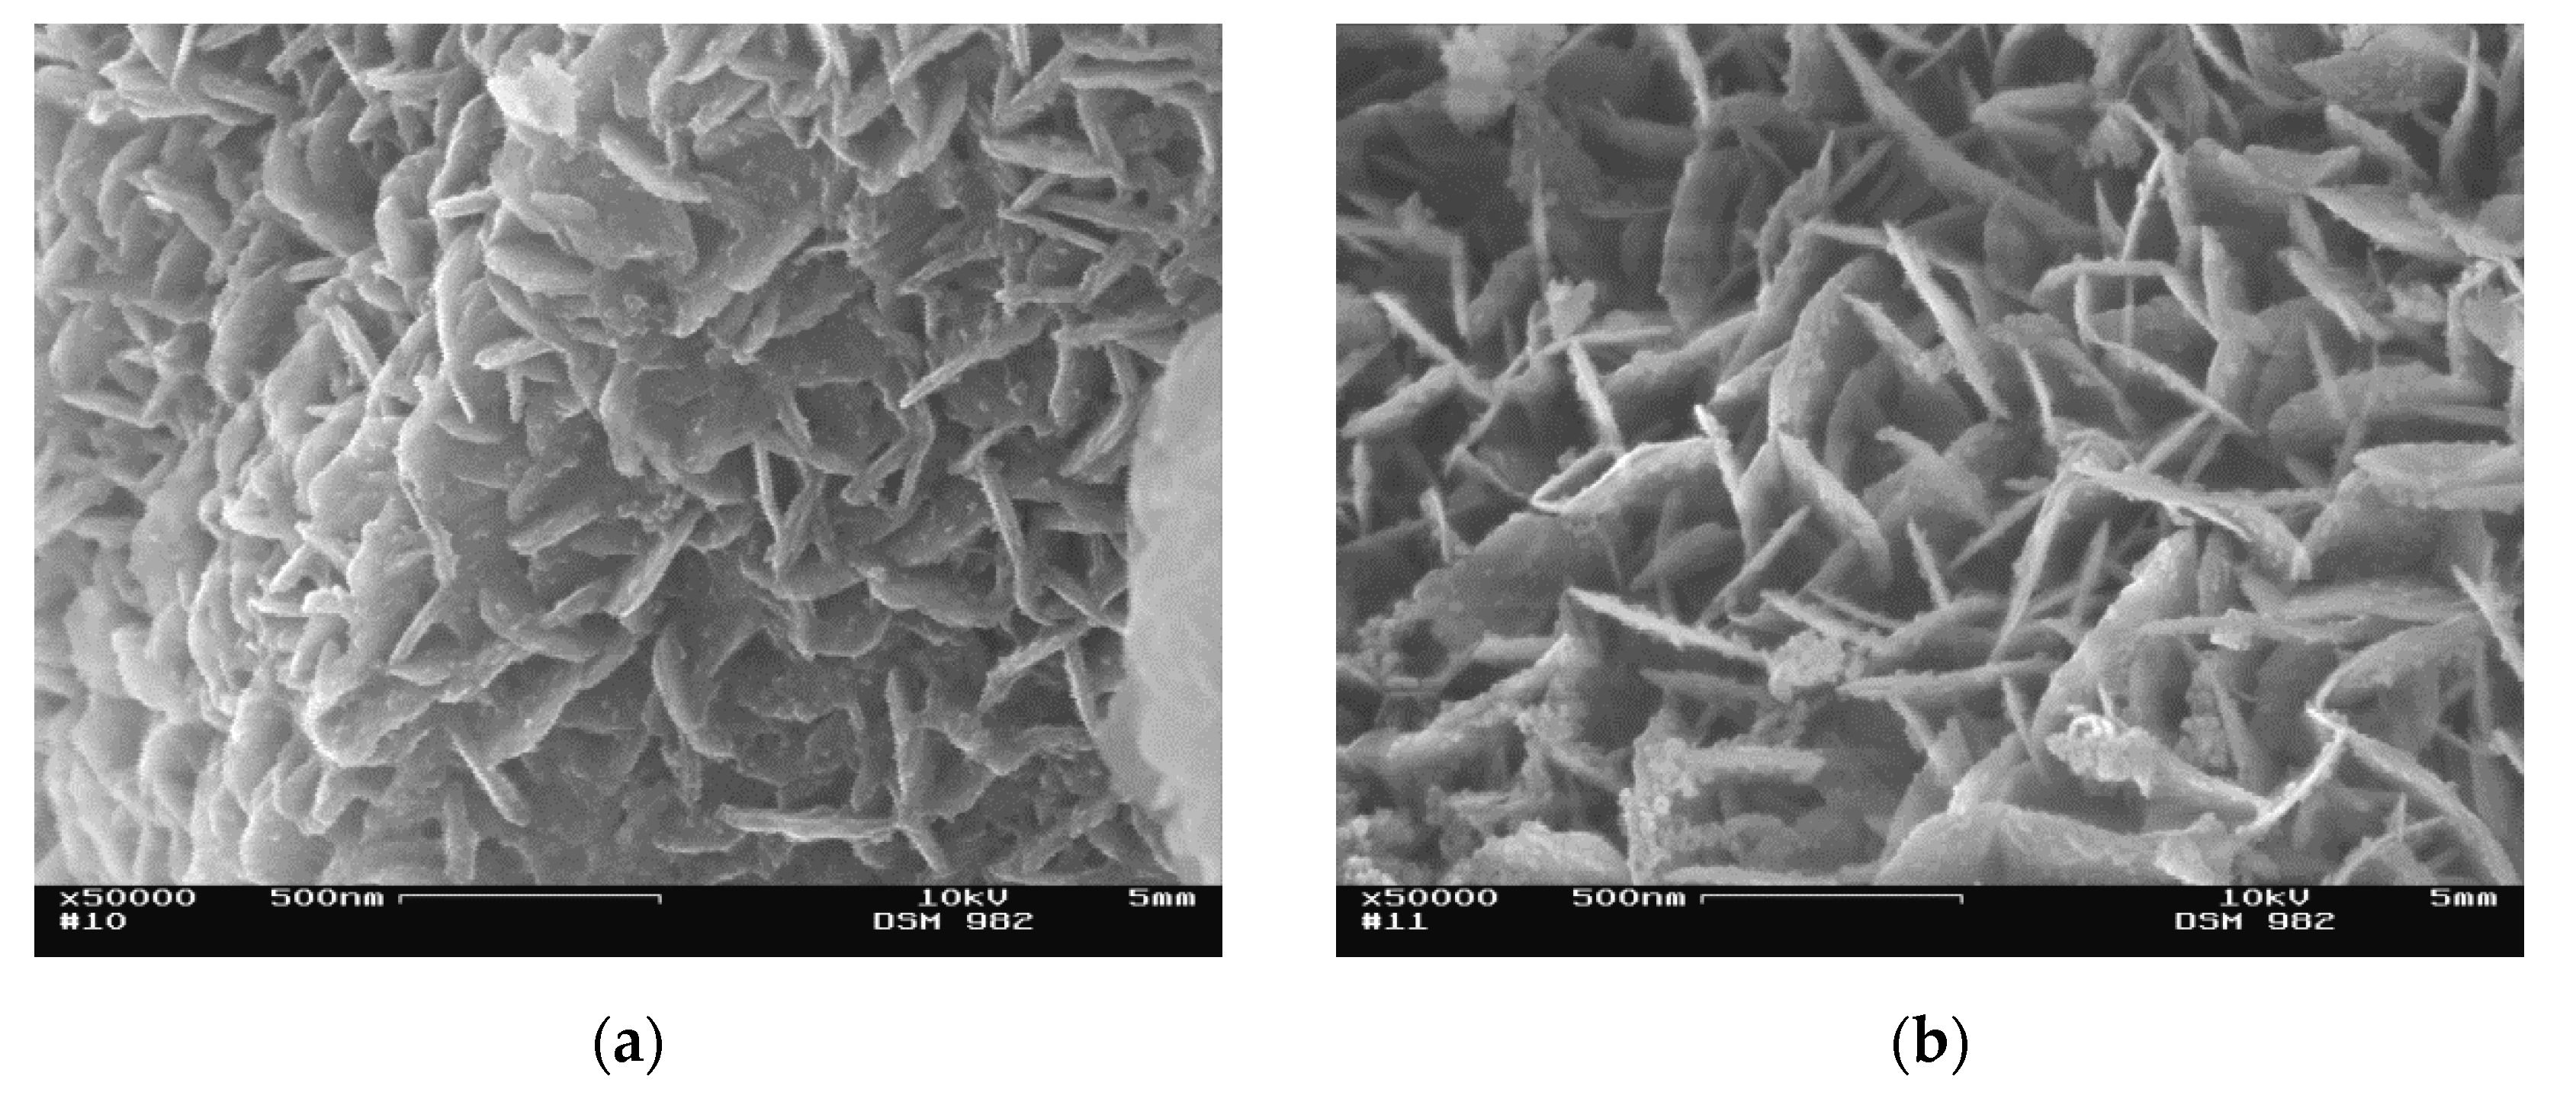
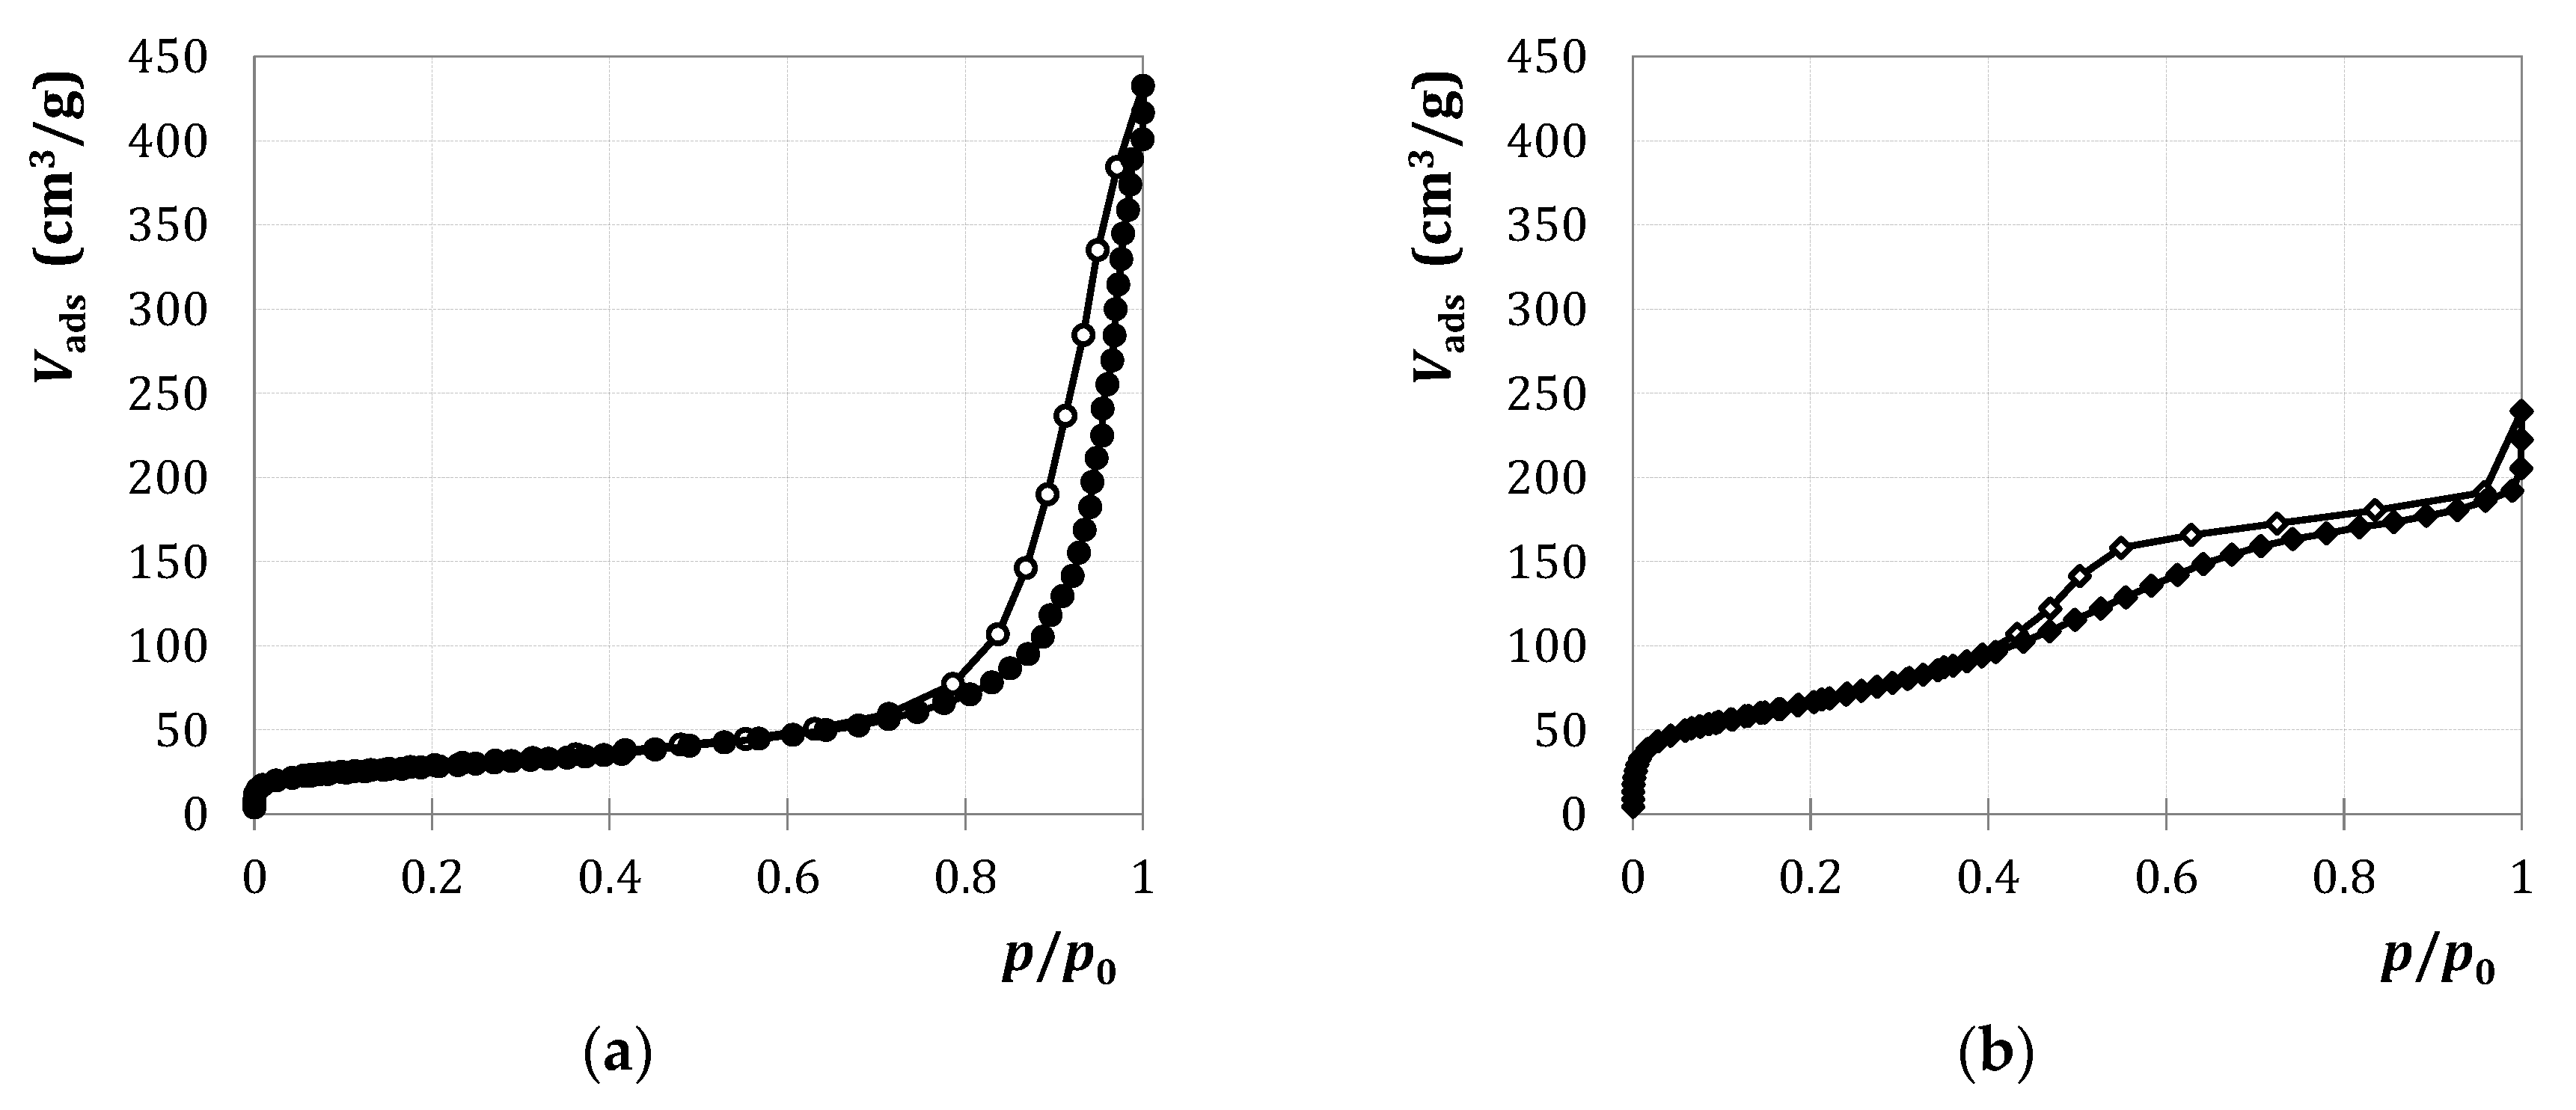
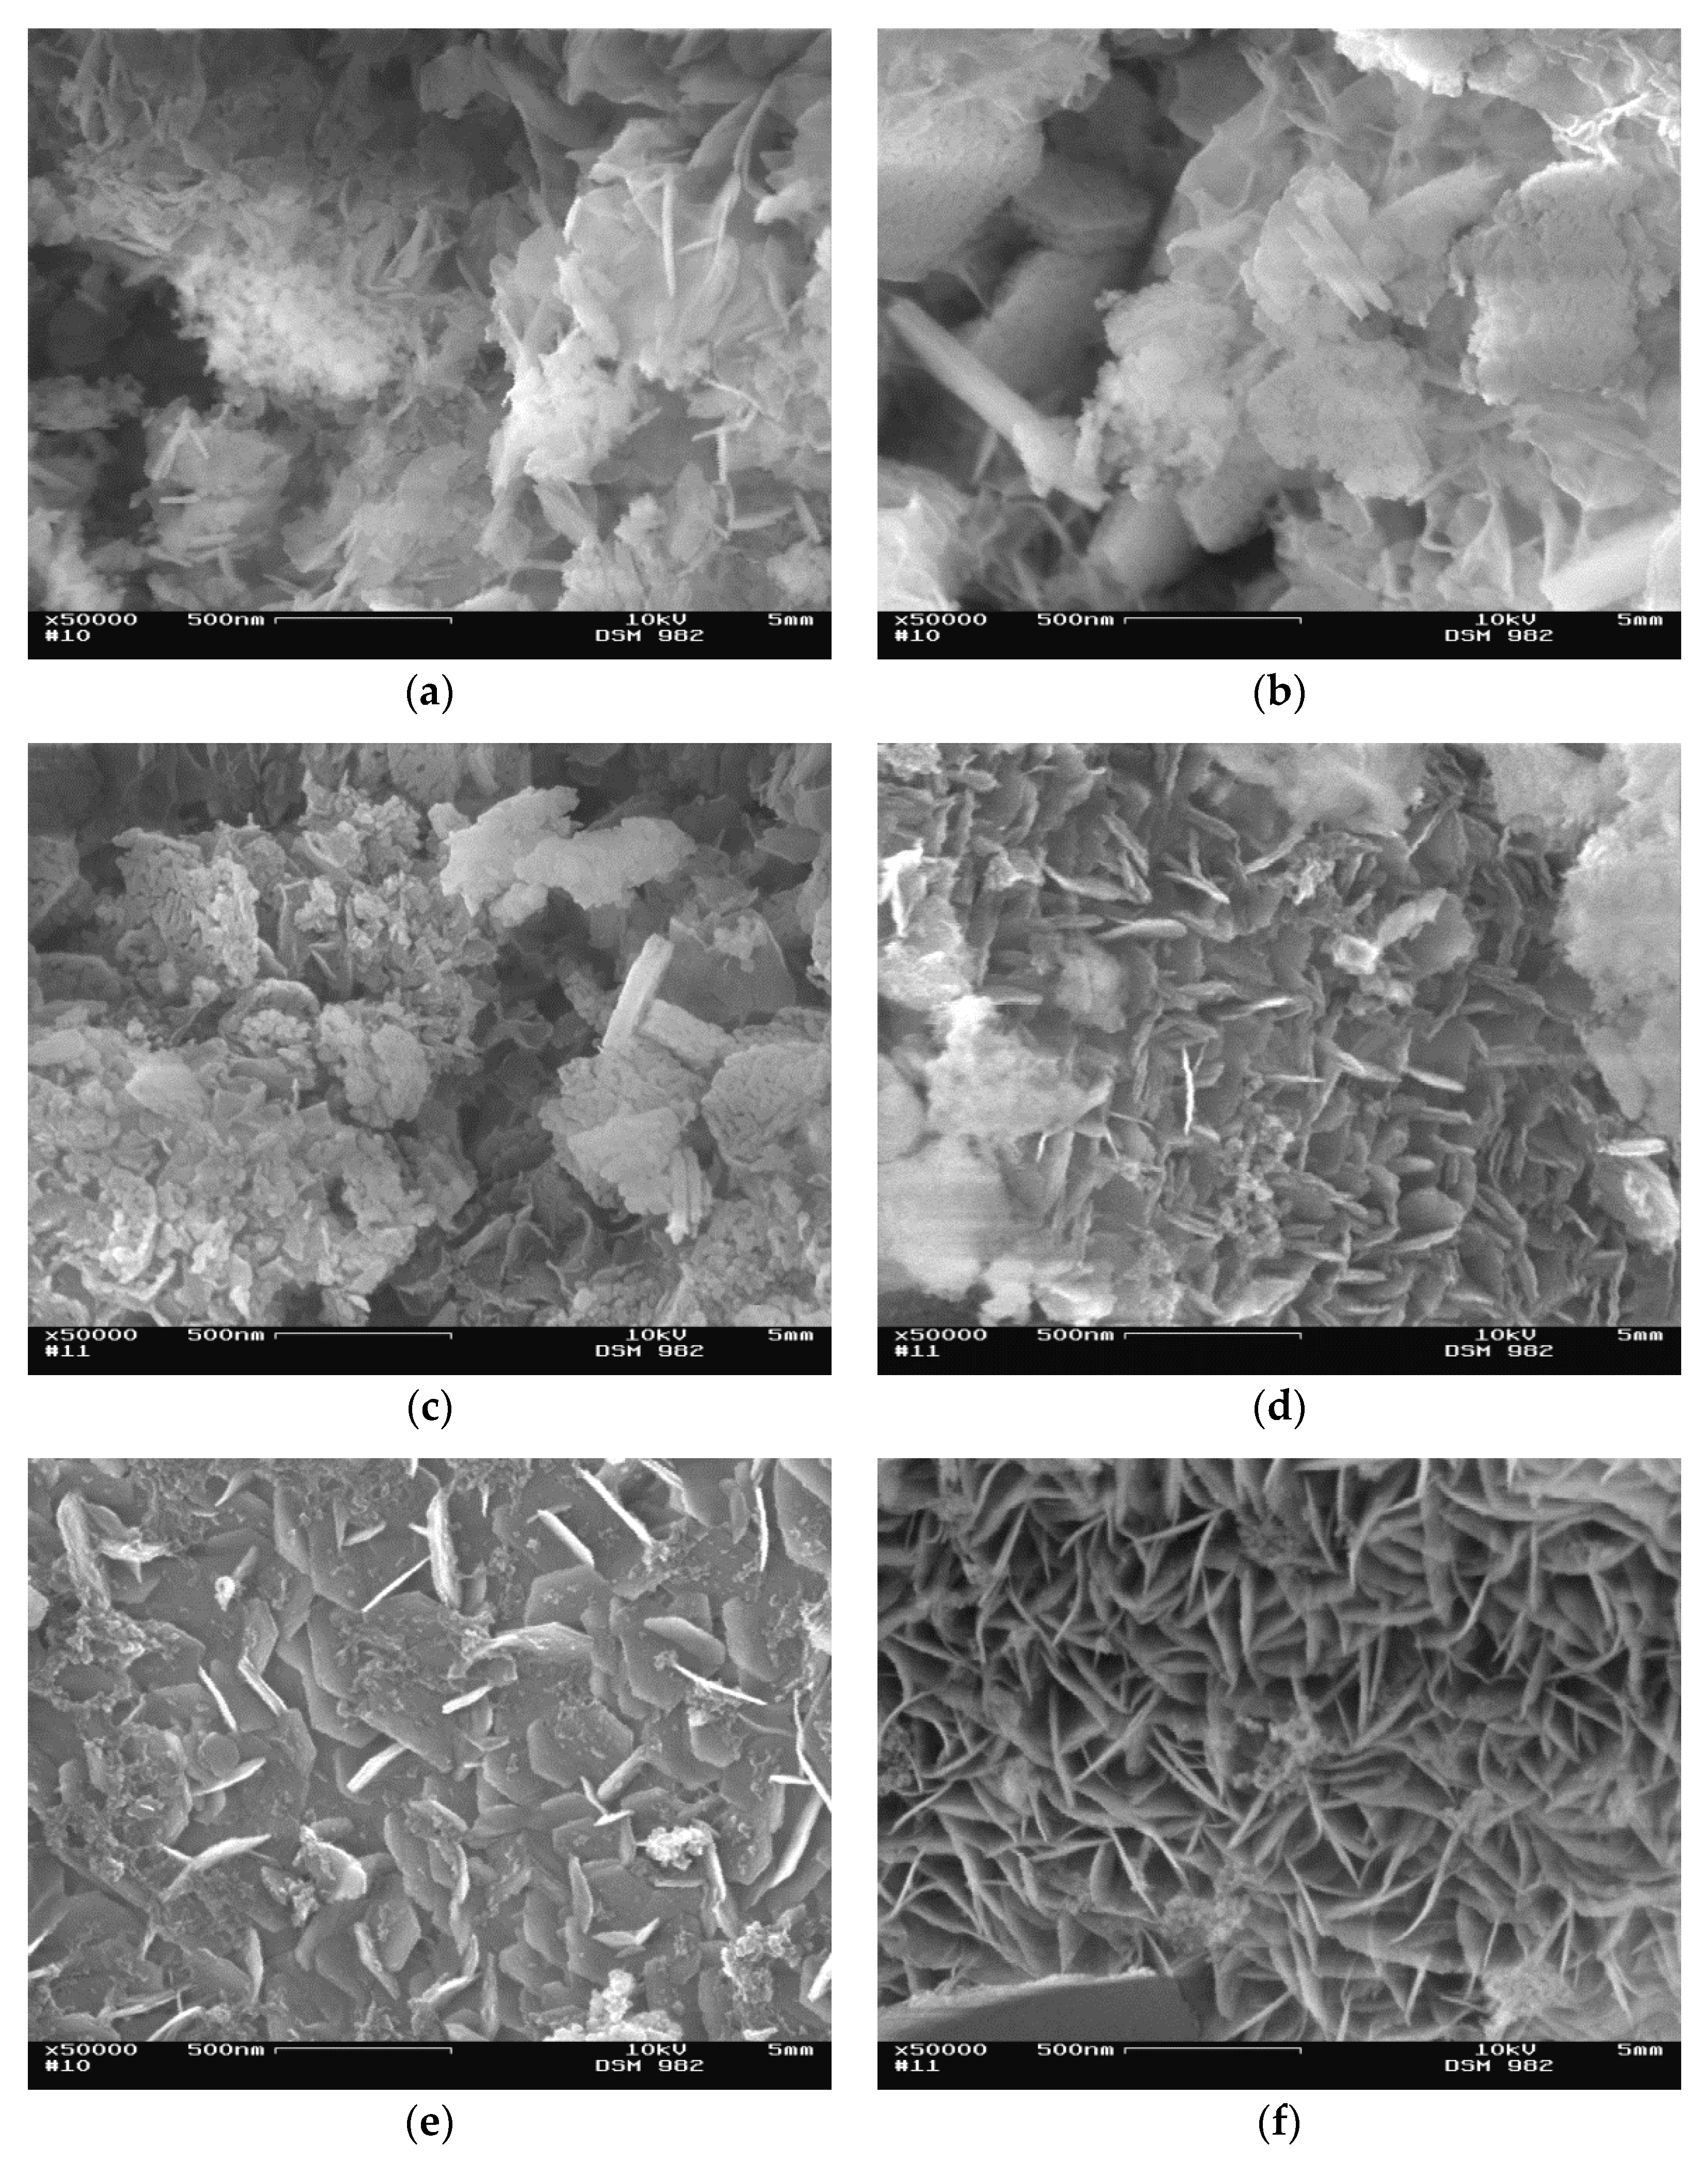
2.2.1. Characterization
2.2.2. Catalytic Testing
3. Materials and Methods
3.1. Chemicals Used
3.2. Preparation of Binary MgO/SiO2 Mixed Oxides from Commercially Available Precursors
3.3. Preparation of Binary MgO/SiO2 Mixed Oxides with Mesoporous MgO
3.4. Characterization of MgO/SiO2 Mixed Oxides and Precursors
3.5. Catalytic Testing
4. Conclusions
Author Contributions
Funding
Acknowledgments
Conflicts of Interest
Appendix A

| Processing | End Product | Use |
|---|---|---|
| Polymerization | Polybutadiene (PBR) | Tires |
| Copolymerization with styrene | Styrene-butadiene rubber (SBR) | Tires |
| Styrene-butadiene latex (SBL) | Paper coating | |
| Copolymerization with acrylonitrile | Nitrile-butadiene rubber (NBR) | Seals, gloves |
| Copolymerization with acrylonitrile and styrene | Acrylonitrile butadiene styrene plastics (ABS) | Components in the electronics and automotive industries |
| Conversion with prussic acid to adiponitrile and subsequent hydrogenation | Hexamethylene diamine | Nylon-6,6 |
| Conversion with chlorine to chloroprene and subsequent polymerization | Polychloroprene (neoprene) | Clothes |
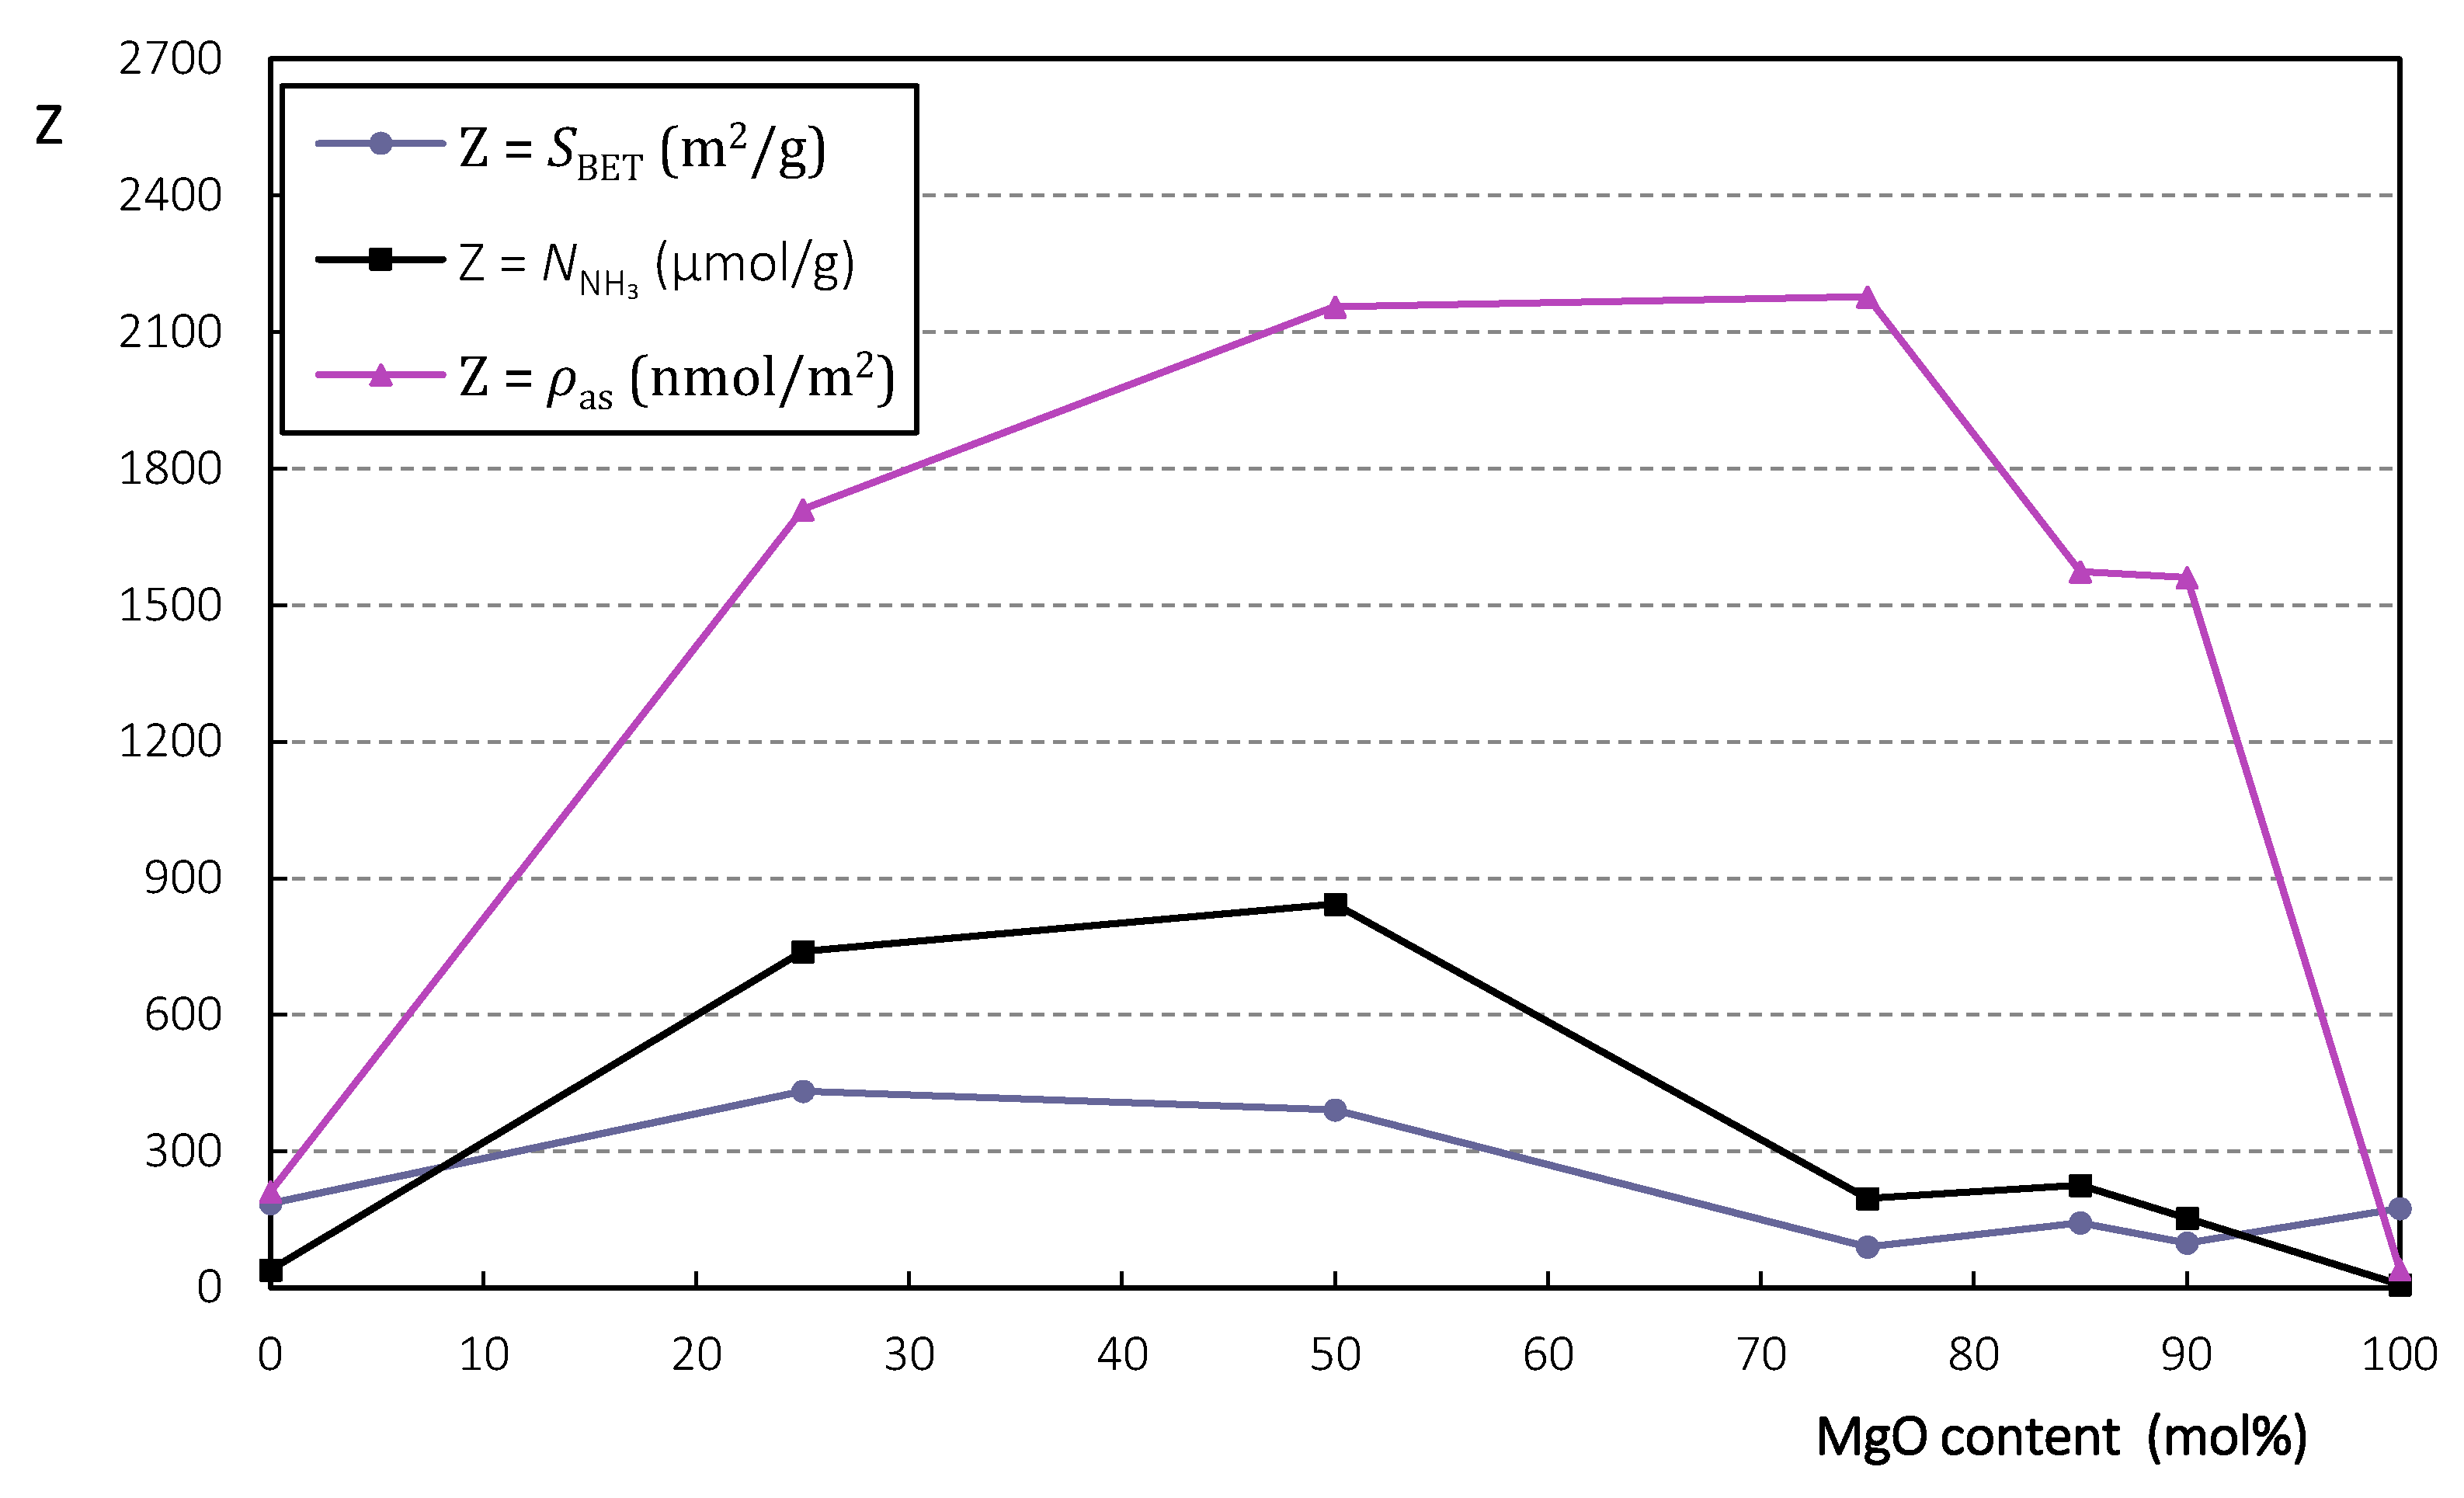
| MgO Content (mol%) | 0 | 25 | 50 | 75 | 85 | 90 | 100 |
|---|---|---|---|---|---|---|---|
| (m2/g) | 185 | 432 | 391 | 90 | 143 | 98 | 174 |
| (μmol/g) | 39 | 739 | 843 | 196 | 225 | 153 | 7 |
| (nmol/m2) | 211 | 1711 | 2156 | 2178 | 1573 | 1561 | 40 |


References
- Organization of the Petroleum Exporting Countries OPEC, World Oil Outlook 2014. Available online: https://www.opec.org/opec_web/en/publications/3049.htm (accessed on 7 June 2020).
- Reschetilowski, W.; Schmidt, M. Bioethanol im Fokus der nachhaltigen Energie- und Chemiewirtschaft. Wiss. Z. TU Dresd. 2007, 56, 73–78. [Google Scholar]
- Kalkman, J.; Pfeiffer, W.; Pereira, S. Are We Running out of Oil? Available online: https://www.rolandberger.com/fr/Publications/Are-we-running-out-of-oil.html (accessed on 7 June 2020).
- White, W. Butadiene production process overview. Chem. Biol. Interact. 2007, 166, 10–14. [Google Scholar] [CrossRef] [PubMed]
- Malaysian Rubber Board LGM, NR Statistics 2019. Available online: http://www.lgm.gov.my/general/General.aspx (accessed on 7 June 2020).
- Weissermel, K.; Arpe, H.J. Industrielle Organische Chemie; Wiley-VCH: Weinheim, Germany, 1998. [Google Scholar]
- Fedtke, M.; Pritzkow, W.; Zimmermann, G. Technische Organische Chemie; Deutscher Verlag für Grundstoffindustrie: Leipzig, Germany, 1992. [Google Scholar]
- Bruijnincx, P.; Weckhuysen, B. Shale gas revolution: An opportunity for the production of biobased chemicals? Angew. Chem. Int. Ed. Engl. 2013, 52, 11980–11987. [Google Scholar] [CrossRef] [PubMed]
- Angelici, C.; Weckhuysen, B.; Bruijnincx, P. Chemocatalytic conversion of ethanol into butadiene and other bulk chemicals. ChemSusChem 2013, 6, 1595–1614. [Google Scholar] [CrossRef]
- Hirschberg, H. Handbuch Verfahrenstechnik und Anlagenbau; Springer: Berlin/Heidelberg, Germany, 1999. [Google Scholar]
- Lebedew, S. Preparation of bivinyl directly from alcohol. Zh. Obshch. Khim. 1933, 3, 698–717. [Google Scholar]
- Kvisle, S.; Aguero, A.; Sneeden, R. Transformation of ethanol into 1,3-butadiene over magnesium oxide/silica catalysts. Appl. Catal. 1988, 43, 117–131. [Google Scholar] [CrossRef]
- León, M.; Diaz, E.; Ordóñez, S. Ethanol catalytic condensation over Mg-Al mixed oxides derived from hydrotalcites. Catal. Today 2011, 164, 436–442. [Google Scholar] [CrossRef]
- Ezinkwo, G.; Tretjakov, V.; Aliyu, A.; Ilolov, A. Fundamental Issues of Catalytic Conversion of Bio-Ethanol into Butadiene. ChemBioEng. Rev. 2014, 1, 194–203. [Google Scholar] [CrossRef]
- Jones, M. Catalytic transformation of ethanol into 1,3-butadiene. Chem. Cent. J. 2014, 8, 53. [Google Scholar] [CrossRef]
- Makshina, E.; Dusselier, M.; Janssens, W.; Degrève, J.; Jacobs, P.; Sels, B. Review of old chemistry and new catalytic advances in the on-purpose synthesis of butadiene. Chem. Soc. Rev. 2014, 43, 7917–7953. [Google Scholar] [CrossRef]
- Brückner, R. Reaktionsmechanismen; Springer: Berlin/Heidelberg, Germany, 2004. [Google Scholar]
- Makshina, E.; Janssens, W.; Sels, B.; Jacobs, B. Catalytic study of the conversion of ethanol into 1,3-butadiene. Catal. Today 2012, 198, 338–344. [Google Scholar] [CrossRef]
- Bhattacharyya, S.; Sanyal, S. Kinetic study on the mechanism of the catalytic conversion of ethanol to butadiene. J. Catal. 1967, 7, 152–158. [Google Scholar] [CrossRef]
- Di Cosimo, J.; Acosta, A.; Apesteguía, C. Gas-phase hydrogen transfer reduction of α,β-unsaturated ketones on Mg-based catalysts. J. Mol. Catal. A Chem. 2004, 222, 87–96. [Google Scholar] [CrossRef]
- Niiyama, H.; Morii, S.; Echigoya, E. Butadiene formation from ethanol over silica-magnesia catalysts. Bull. Chem. Soc. Jpn. 1972, 45, 655–659. [Google Scholar] [CrossRef]
- Lebedev, S. Improvements in or Relating to the Preparation of Diolefines Directly from Alcohols. Patent GB 331482A, 30 June 1931. [Google Scholar]
- Szukiewicz, W. Method for Producing Butadiene. Patent US 2357855A, 12 September 1944. [Google Scholar]
- Corson, B.; Jones, H.; Welling, C.; Hinckley, J.; Stahly, E. Butadiene from Ethyl Alcohol. Catalysis in the One- and Two-Stop Processes. Ind. Eng. Chem. 1950, 42, 359–373. [Google Scholar] [CrossRef]
- Ohnishi, R.; Akimoto, T.; Tanabe, K. Pronounced catalytic activity and selectivity of MgO-SiO2-Na2O for synthesis of buta-1,3-diene from ethanol. J. Chem. Soc. Chem. Commun. 1985, 70, 1613–1614. [Google Scholar] [CrossRef]
- Suzuki, E.; Idemura, S.; Ono, Y. Catalytic conversion of 2-propanol and ethanol over synthetic hectorite and its analogues. Appl. Clay Sci. 1988, 3, 123–134. [Google Scholar] [CrossRef]
- Lewandowski, M.; Babu, G.; Vezzoli, M.; Jones, M.; Owen, R.; Mattia, D.; Plucinski, P.; Mikolajska, E.; Ochenduszko, A.; Apperley, D. Investigations into the conversion of ethanol to 1,3-butadiene using MgO:SiO2 supported catalysts. Catal. Commun. 2014, 49, 25–28. [Google Scholar] [CrossRef]
- Haufe, R.; Reschetilowski, W.; Thomas, A.; Hauser, M. Process for the Production of 1,3-butadiene. Patent EP 2 918 338 A1, 16 September 2015. [Google Scholar]
- Kovařík, B. Einfluss der Magnesiumsilikate auf die Aktivität des Lebedew-Katalysators. Collect. Czech. Chem. Commun. 1961, 26, 1918–1924. [Google Scholar] [CrossRef]
- Huang, X.; Men, Y.; Wang, J.; An, W.; Wang, Y. Highly active and selective binary MgO-SiO2 catalysts for the production of 1,3-butadiene from ethanol. Catal. Sci. Technol. 2017, 7, 168–180. [Google Scholar] [CrossRef]
- Taifan, W.; Baltrusaitis, J. In Situ Spectroscopic Insights on the Molecular Structure of the MgO/SiO2 Catalytic Active Sites during Ethanol Conversion to 1,3-Butadiene. J. Phys. Chem. C 2018, 122, 20894–20906. [Google Scholar] [CrossRef]
- Li, S.; Men, Y.; Wang, J.; Liu, S.; Wang, X.; Ji, F.; Chai, S.; Song, Q. Morphological control of inverted MgO-SiO2 composite catalysts for efficient conversion of ethanol to 1,3-butadiene. Appl. Catal. A Gen. 2019, 577, 1–9. [Google Scholar] [CrossRef]
- Abdulrazzaq, H.; Chokanlu, A.; Frederick, B.; Schwartz, T. Reaction Kinetics Analysis of Ethanol Dehydrogenation Catalyzed by MgO-SiO2. ACS Catal. 2020, 10, 6318–6331. [Google Scholar] [CrossRef]
- Thommes, M.; Kaneko, K.; Neimark, A.; Olivier, J.; Rodriguez-Reinoso, F.; Rouquerol, J.; Sing, K. Physisorption of gases, with special reference to the evaluation of surface area and pore size distribution (IUPAC Technical Report). Pure Appl. Chem. 2015, 87, 1051–1069. [Google Scholar] [CrossRef]
- Cui, H.; Wu, X.; Chen, Y.; Boughton, R. Synthesis and characterization of mesoporous MgO by template-free hydrothermal method. Mater. Res. Bull. 2014, 50, 307–311. [Google Scholar] [CrossRef]
- Thomas, A. Reaktionstechnische und Mechanistische Untersuchungen der Umsetzung von Ethanol zu 1,3-Butadien an Mischoxidkatalysatoren. Ph.D. Thesis, Dresden University of Technology, Dresden, Germany, 21 November 2015. [Google Scholar]


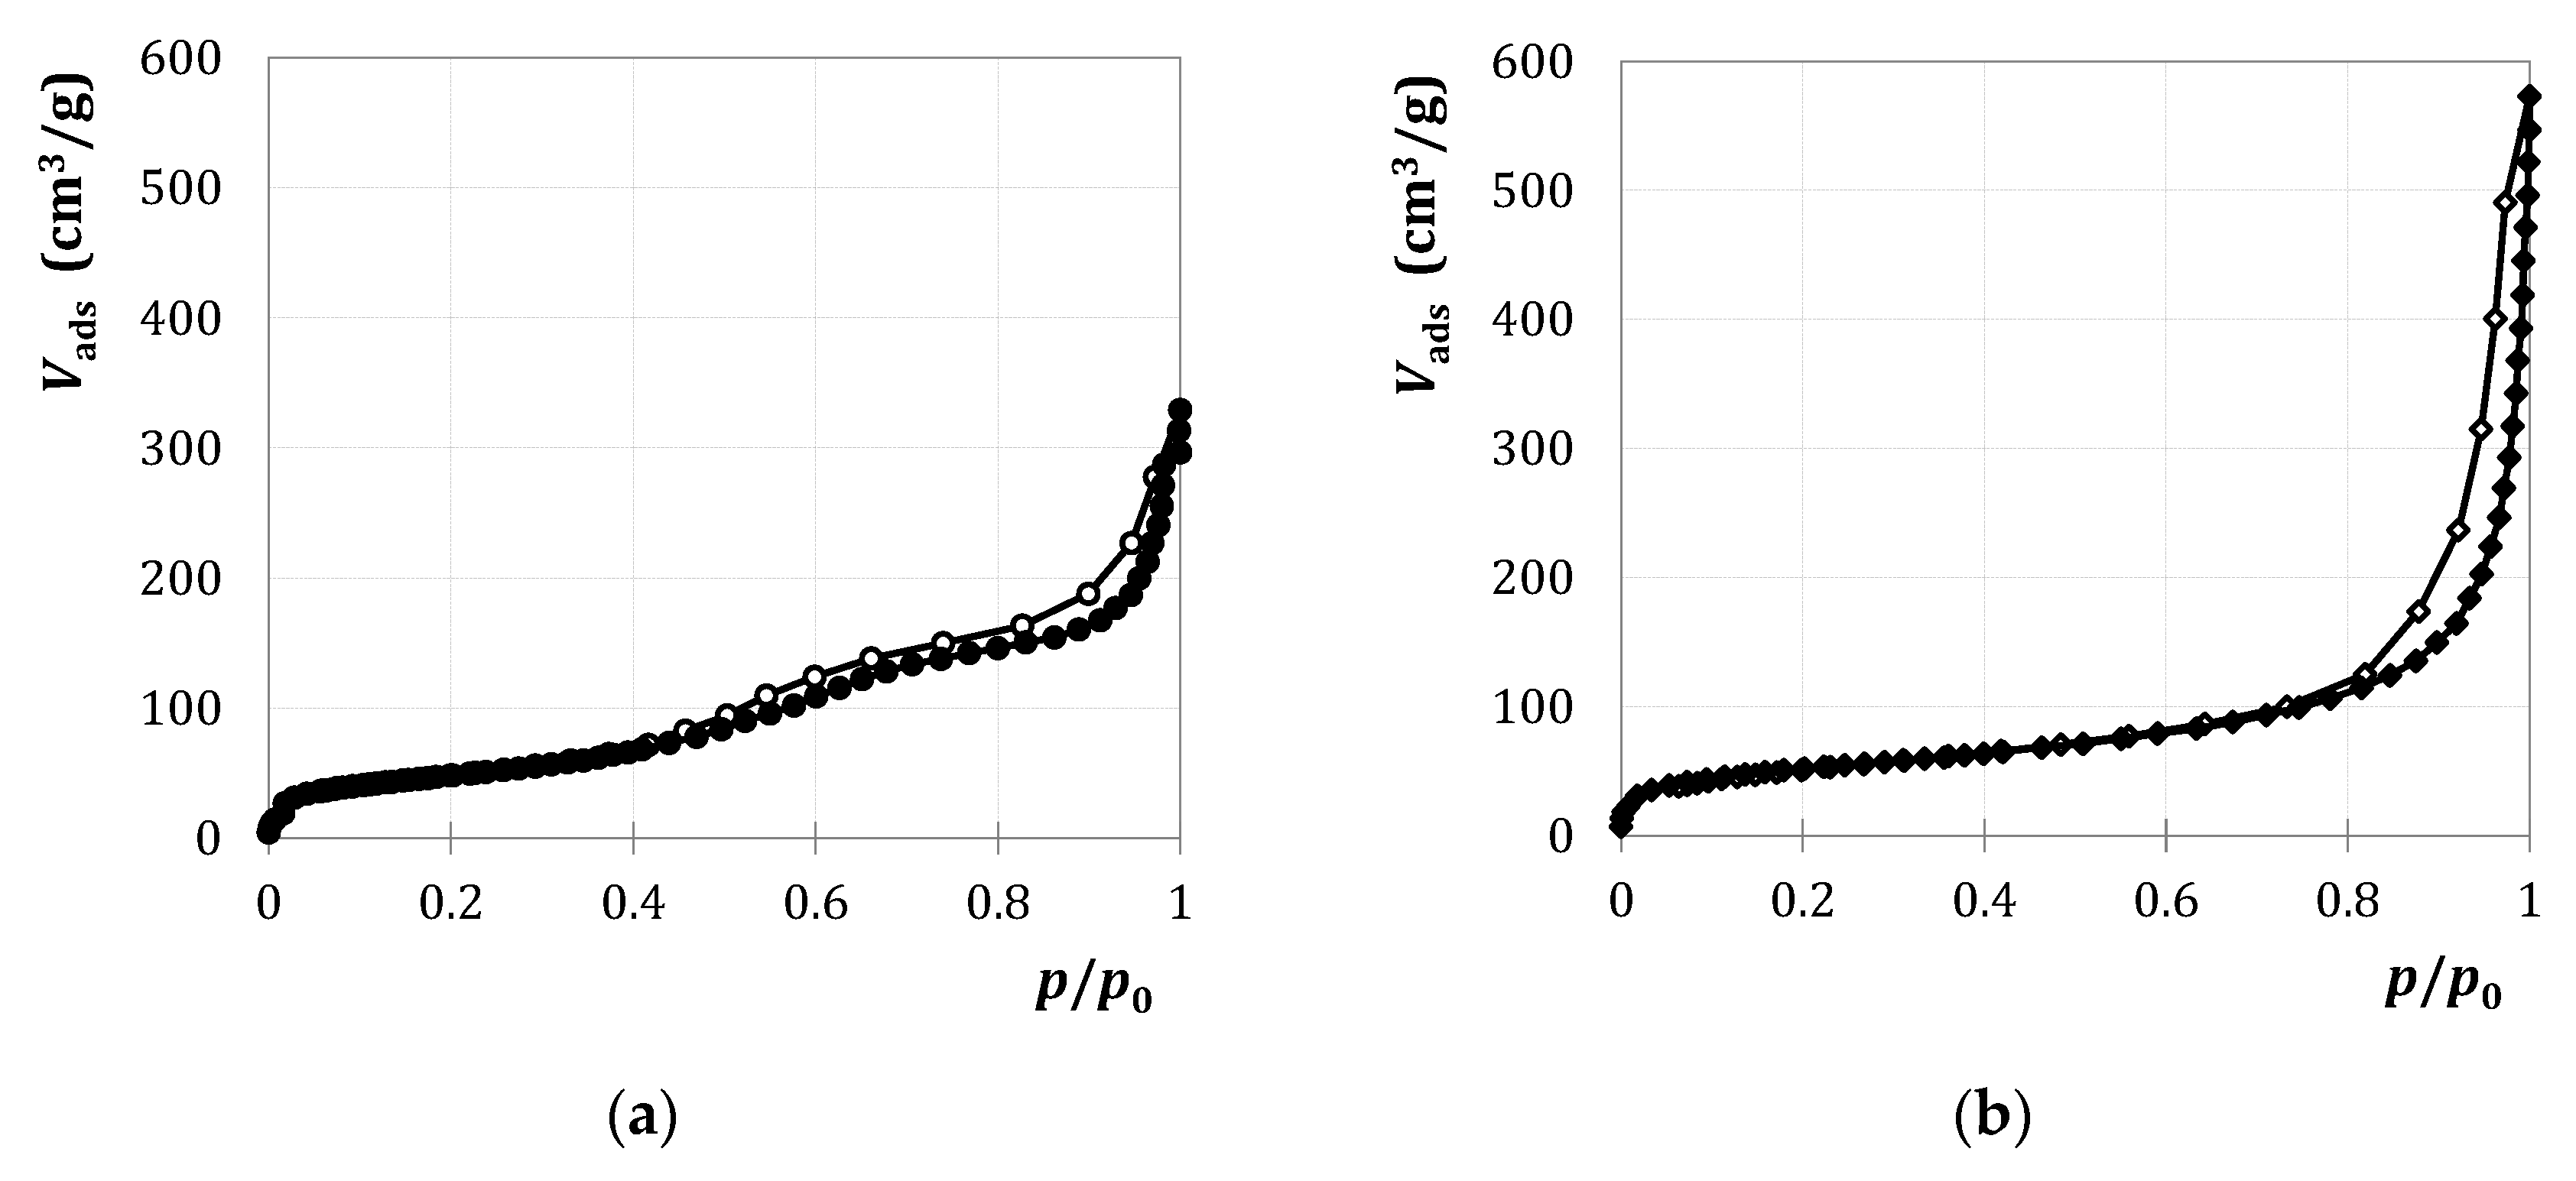
 ) and M3/SiO2 90:10 (
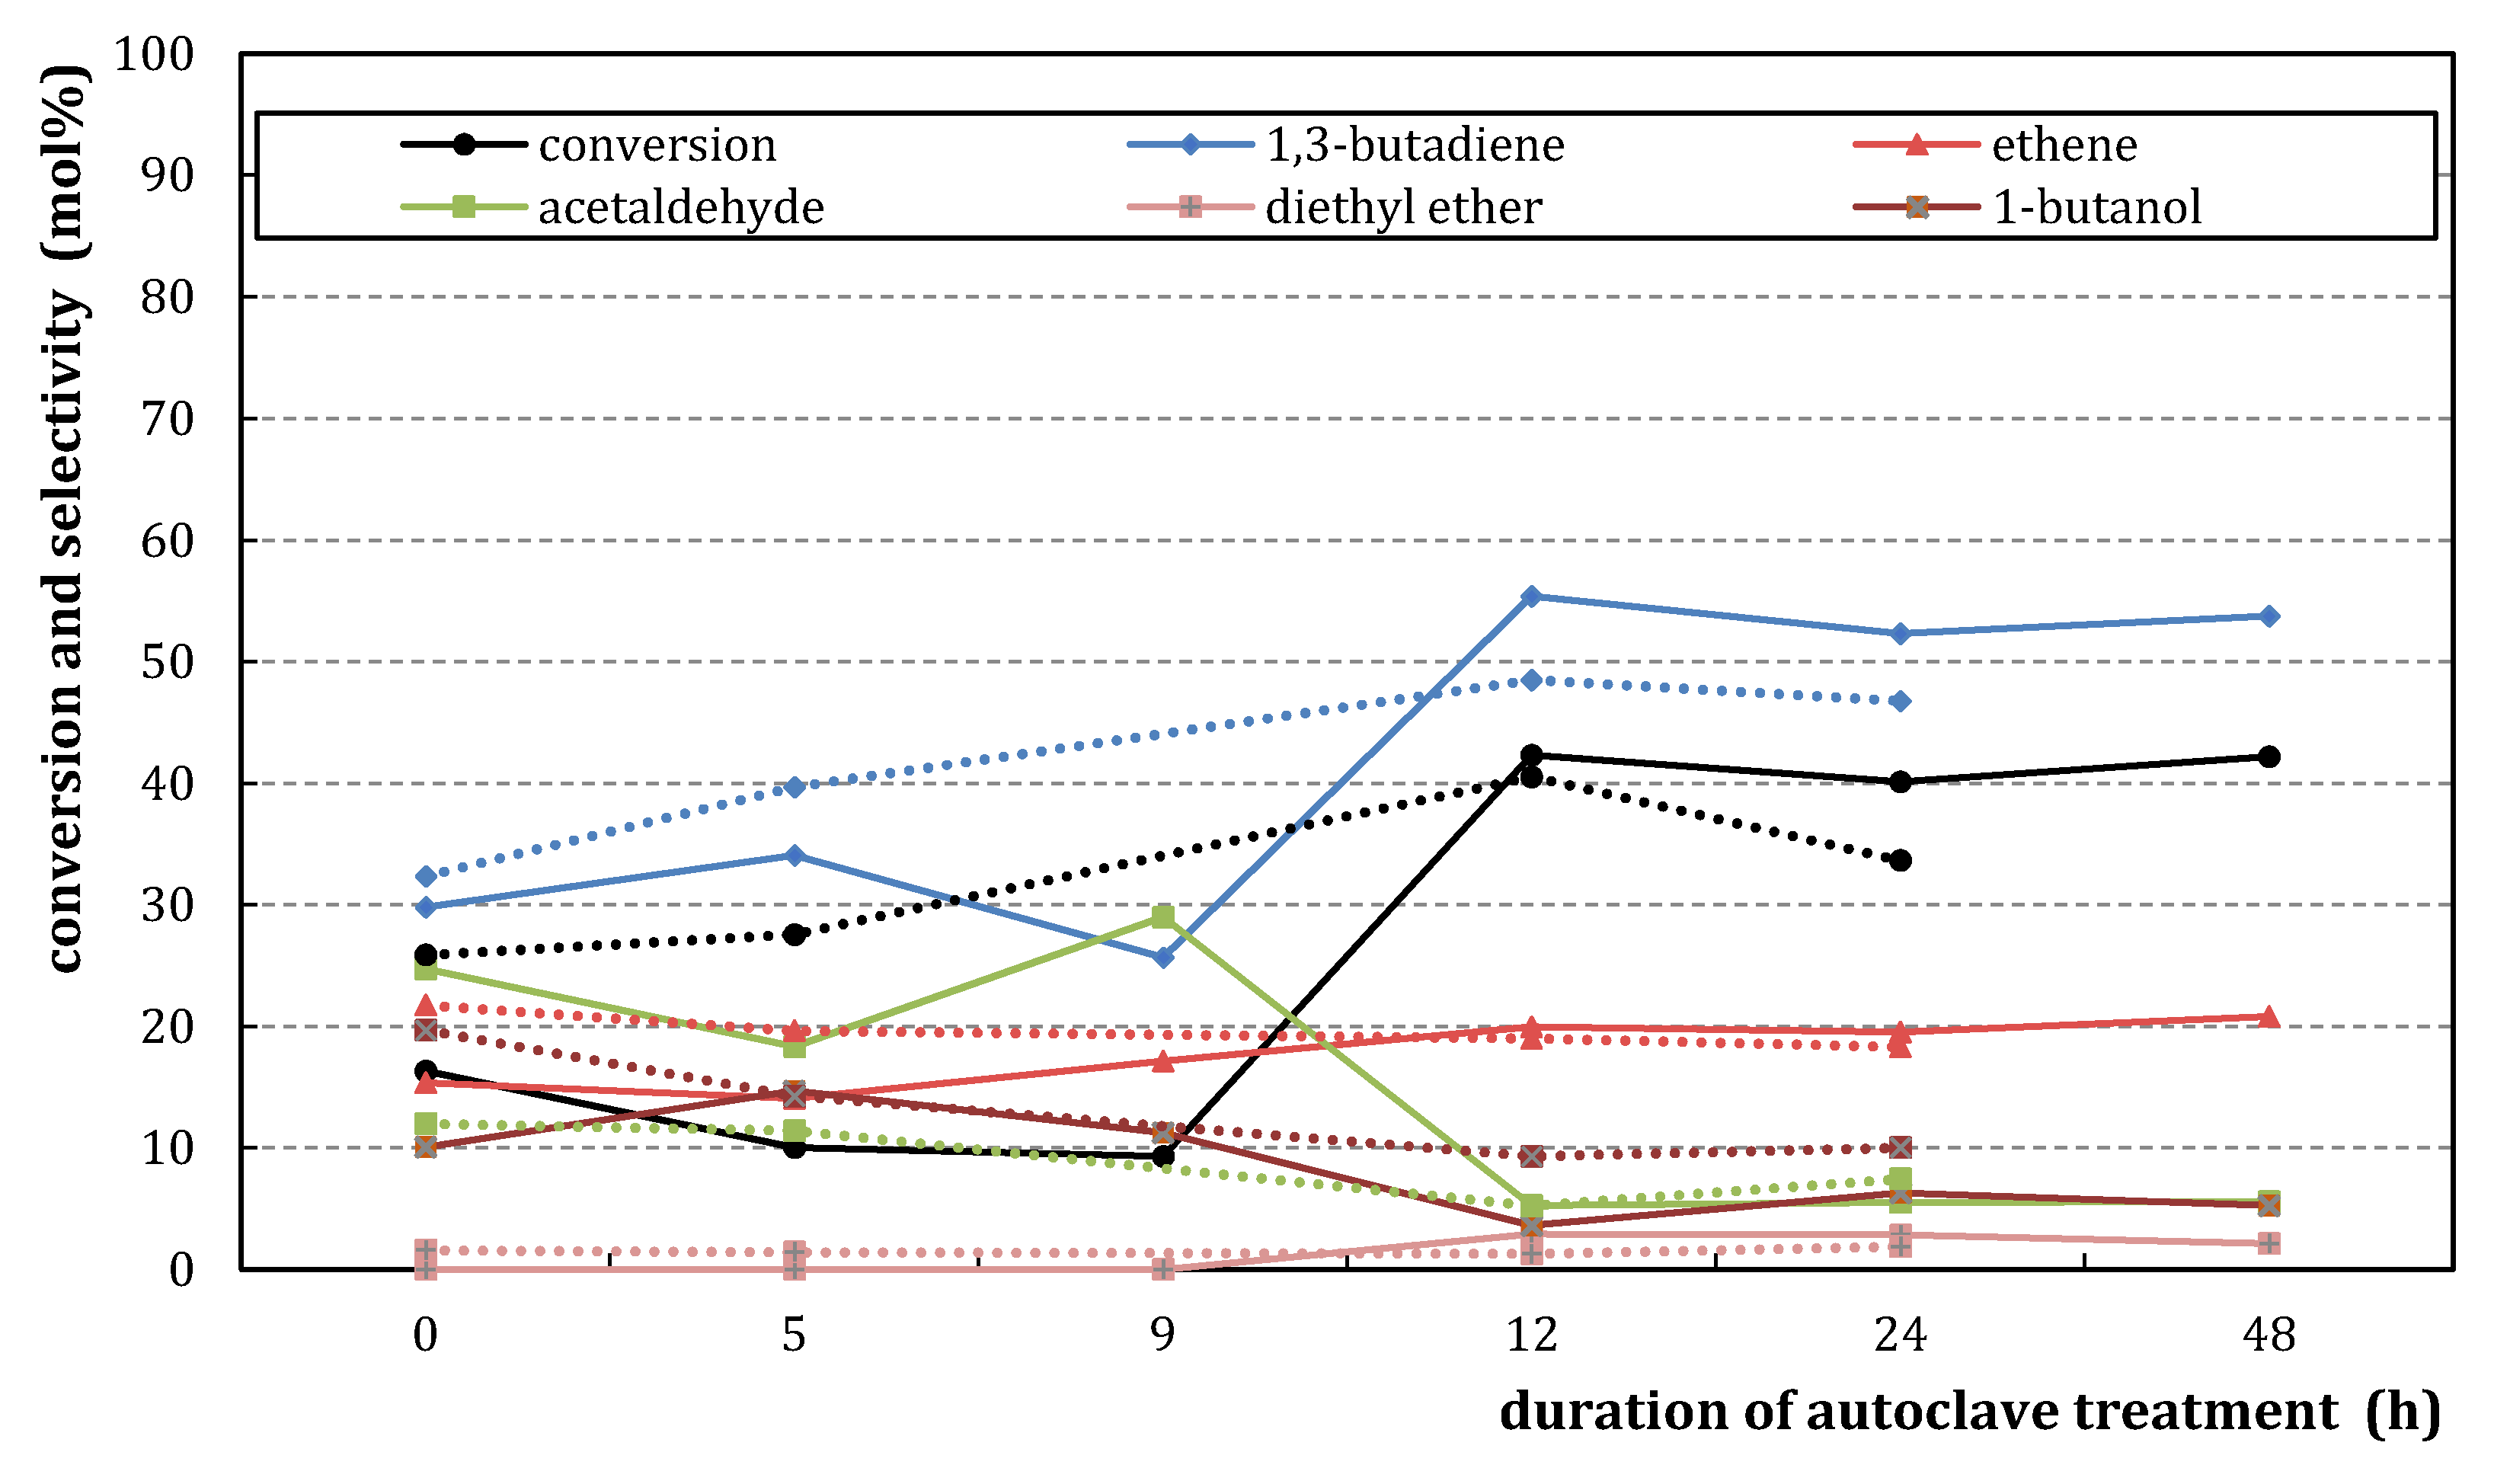
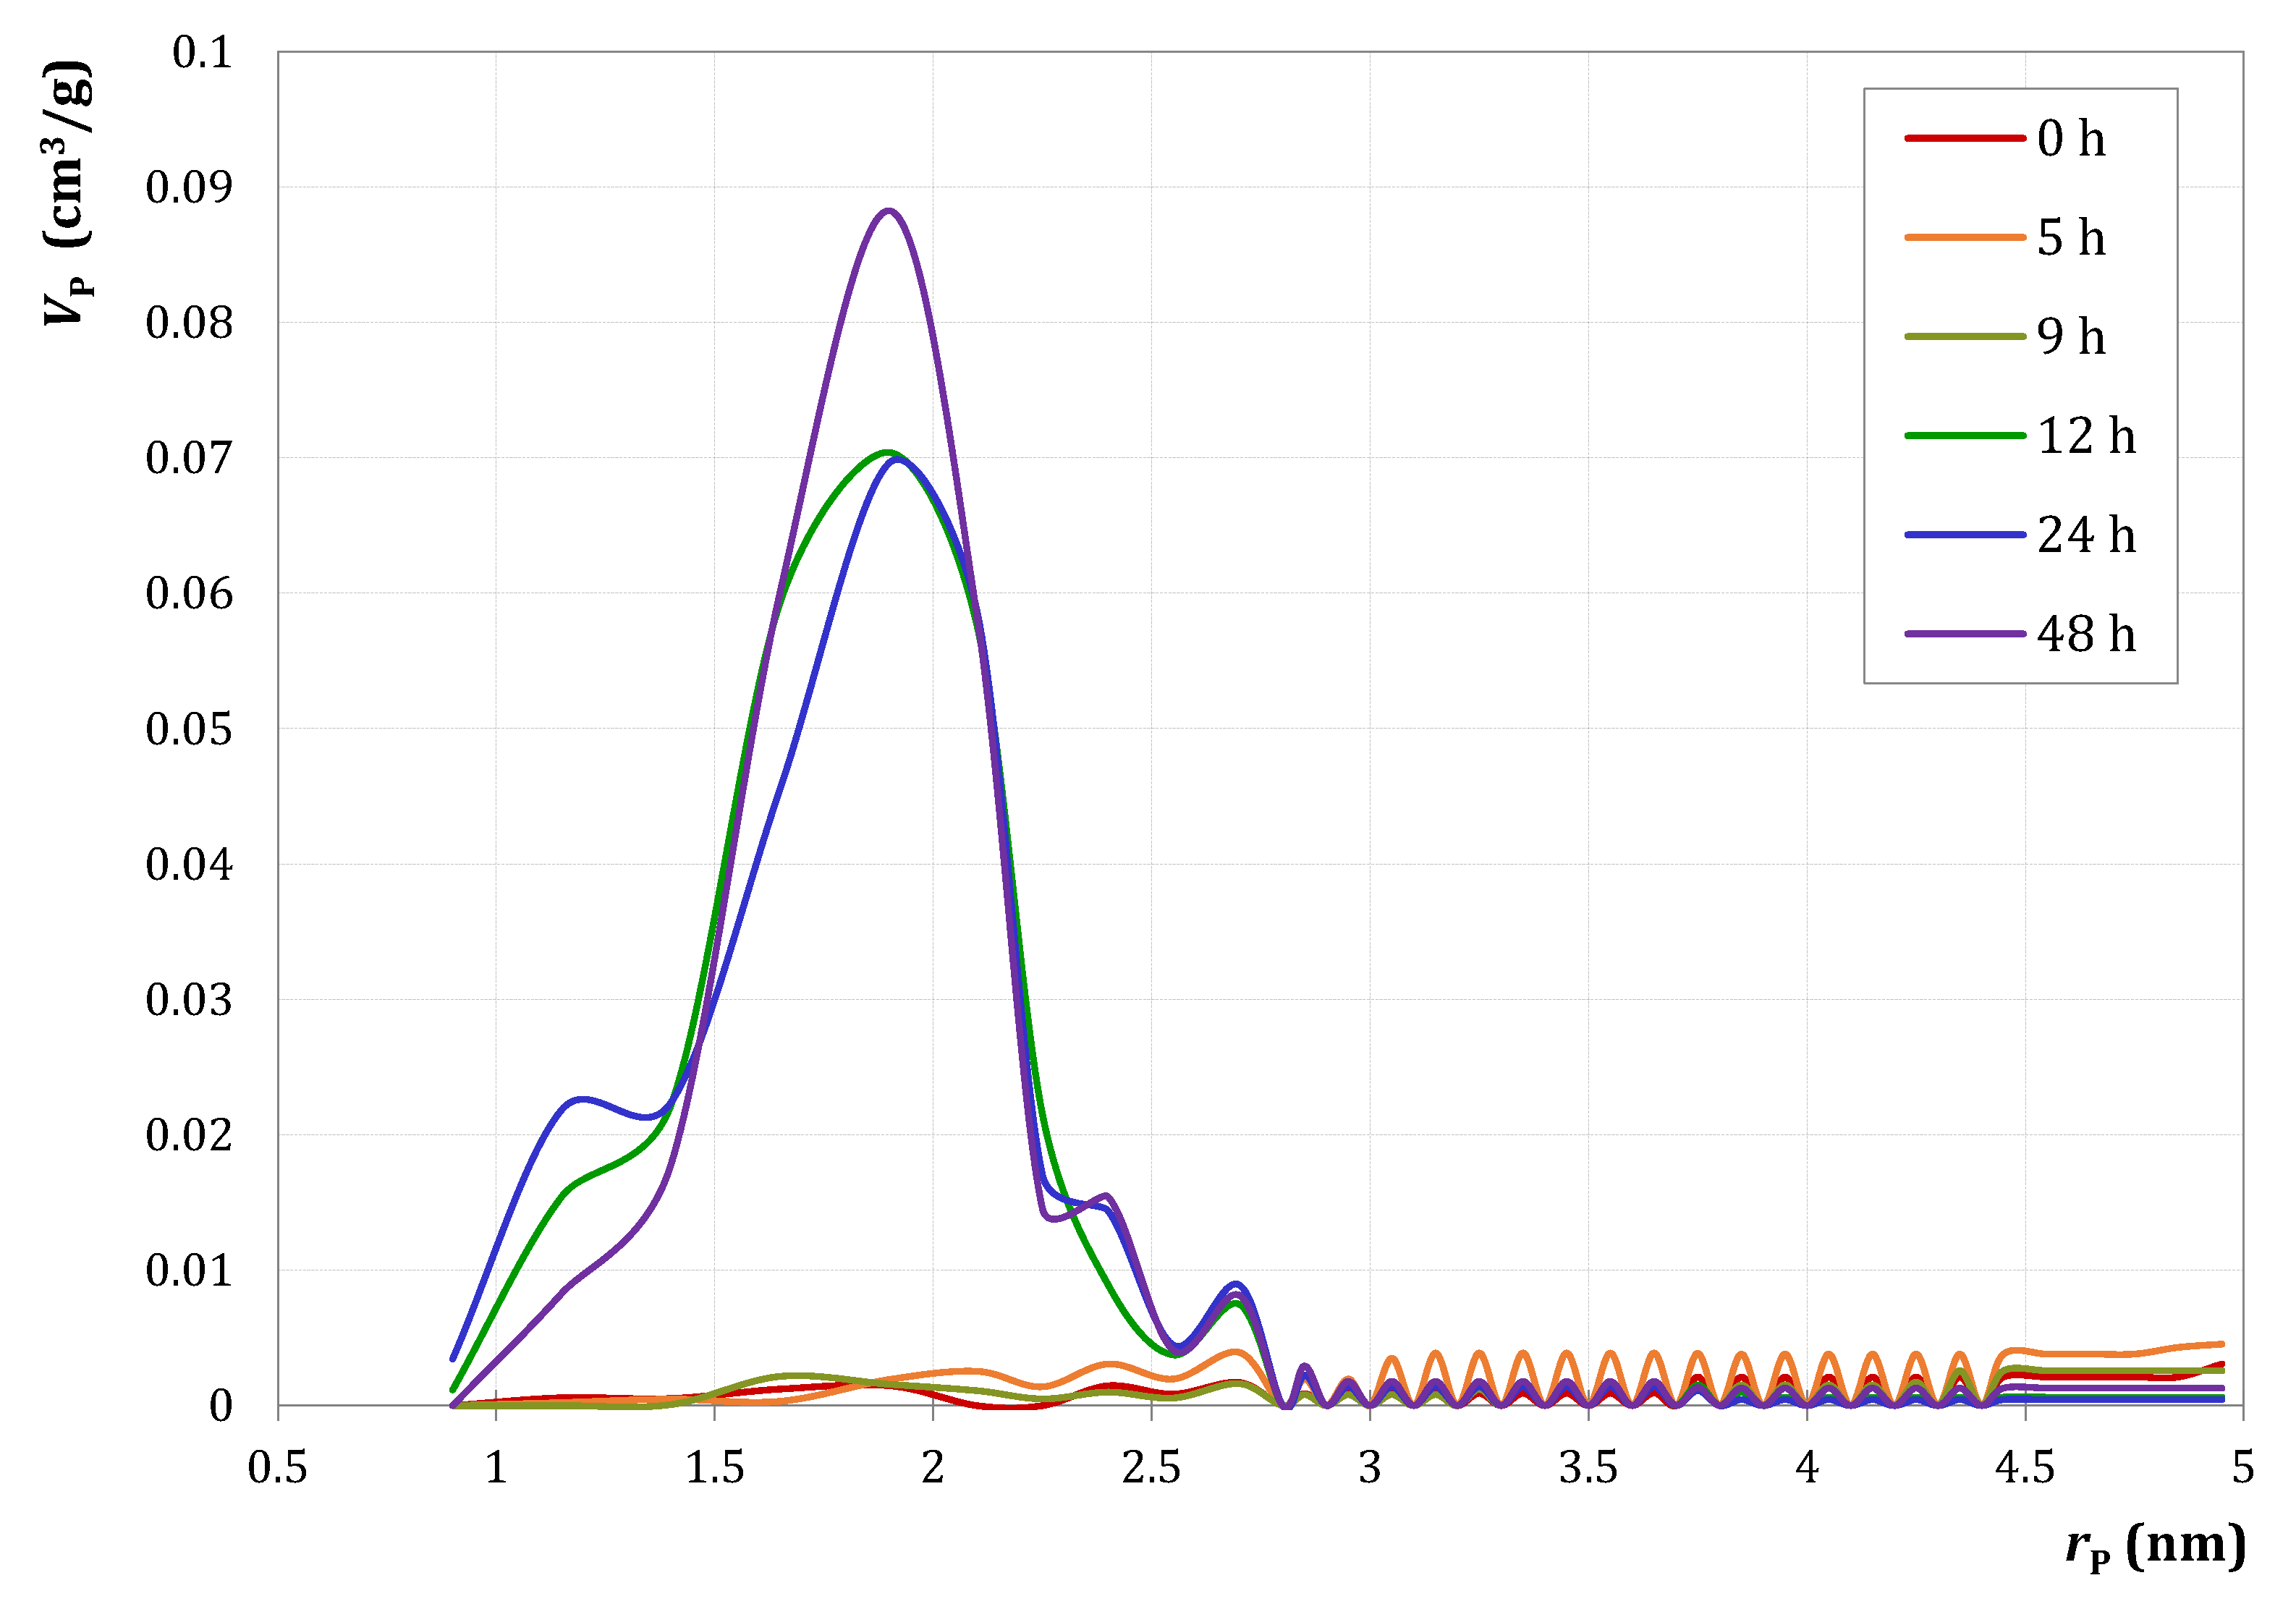
 ); produced according to Section 3.3. with different autoclave treatment durations (mcat = 500 mg; WHSV = 4.6–5.0 h−1; T = 450 °C; p = 5.5 bar(a); = 5 L/h). Error bars have been omitted in favor of clarity.
) and M3/SiO2 90:10 (); produced according to Section 3.3. with different autoclave treatment durations (mcat = 500 mg; WHSV = 4.6–5.0 h−1; T = 450 °C; p = 5.5 bar(a); = 5 L/h). Error bars have been omitted in favor of clarity.
); produced according to Section 3.3. with different autoclave treatment durations (mcat = 500 mg; WHSV = 4.6–5.0 h−1; T = 450 °C; p = 5.5 bar(a); = 5 L/h). Error bars have been omitted in favor of clarity.
) and M3/SiO2 90:10 (); produced according to Section 3.3. with different autoclave treatment durations (mcat = 500 mg; WHSV = 4.6–5.0 h−1; T = 450 °C; p = 5.5 bar(a); = 5 L/h). Error bars have been omitted in favor of clarity.
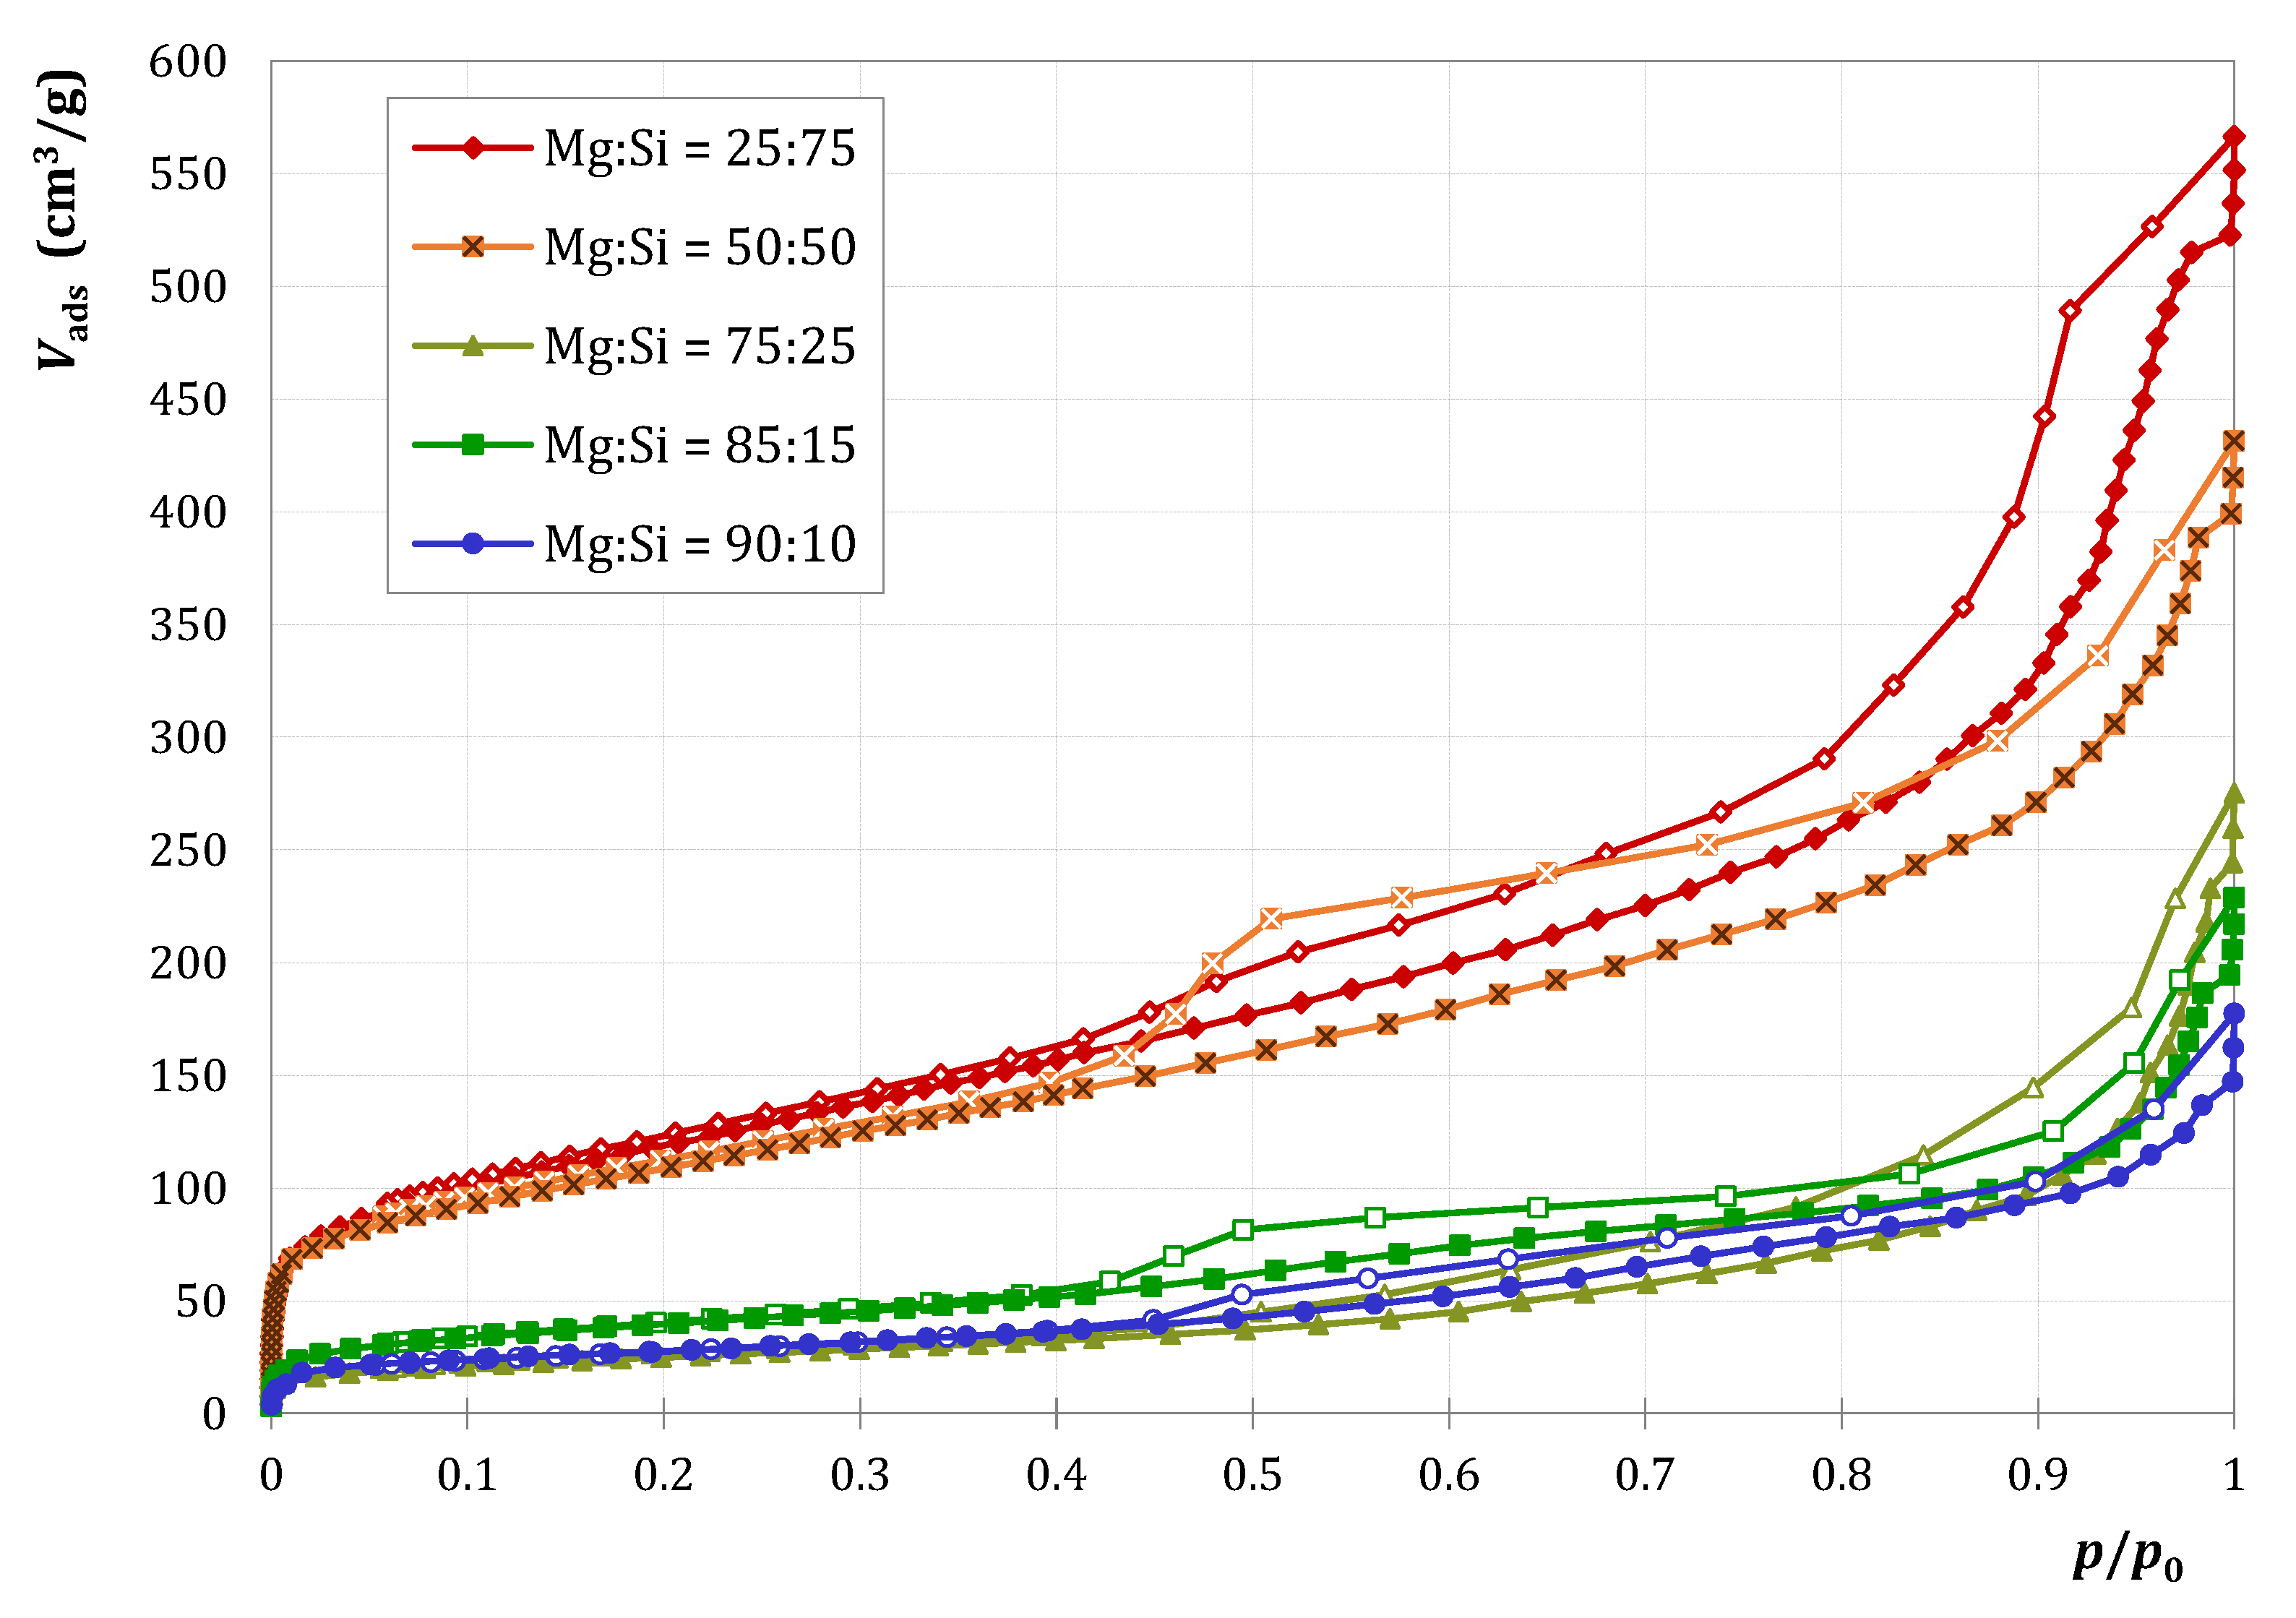
| MgO Content (mol%) | 0 | 25 | 50 | 75 | 85 | 90 | 100 |
|---|---|---|---|---|---|---|---|
| SBET (m2/g) | 185 | 432 | 391 | 90 | 143 | 98 | 174 |
| Vp (cm3/g) | 0.31 | 0.67 | 0.49 | 0.20 | 0.20 | 0.16 | 0.29 |
| Duration of Autoclave Treatment (h) | 0 | 5 | 12 | 24 |
|---|---|---|---|---|
| SBET (m2/g) | 210 | 216 | 222 | 234 |
| Vp (cm3/g) | 0.32 | 0.29 | 0.34 | 0.31 |
| Duration of Autoclave Treatment (h) | 0 | 5 | 9 | 12 | 24 | 48 |
|---|---|---|---|---|---|---|
| SBET (m2/g) | 99 | 105 | 73 | 245 | 247 | 235 |
| Vp (cm3/g) | 0.33 | 0.28 | 0.25 | 0.28 | 0.28 | 0.32 |
| Substance | Producer/Supplier (Product Number) | Application |
|---|---|---|
| Mg(OH)2 | Sigma-Aldrich, Taufkirchen, Germany (310093) | Synthesis of M1 |
| Mg(NO3)2∙6H2O | Grüssing, Filsum, Germany (12091250) | Synthesis of M2 and M3 |
| Na2CO3 | Grüssing, Filsum, Germany (12117) | Synthesis of M2 |
| K2CO3 | Grüssing, Filsum, Germany (12005) | Synthesis of M3 |
| SiO2 | Wacker Silicones, Burghausen, Germany (HDK N20) | SiO2 precursor |
© 2020 by the authors. Licensee MDPI, Basel, Switzerland. This article is an open access article distributed under the terms and conditions of the Creative Commons Attribution (CC BY) license (http://creativecommons.org/licenses/by/4.0/).
Share and Cite
Reschetilowski, W.; Hauser, M.; Alscher, F.; Klauck, M.; Kalies, G. Studies on the Binary MgO/SiO2 Mixed Oxide Catalysts for the Conversion of Ethanol to 1,3-Butadiene. Catalysts 2020, 10, 854. https://doi.org/10.3390/catal10080854
Reschetilowski W, Hauser M, Alscher F, Klauck M, Kalies G. Studies on the Binary MgO/SiO2 Mixed Oxide Catalysts for the Conversion of Ethanol to 1,3-Butadiene. Catalysts. 2020; 10(8):854. https://doi.org/10.3390/catal10080854
Chicago/Turabian StyleReschetilowski, Wladimir, Matthias Hauser, Felix Alscher, Mandy Klauck, and Grit Kalies. 2020. "Studies on the Binary MgO/SiO2 Mixed Oxide Catalysts for the Conversion of Ethanol to 1,3-Butadiene" Catalysts 10, no. 8: 854. https://doi.org/10.3390/catal10080854
APA StyleReschetilowski, W., Hauser, M., Alscher, F., Klauck, M., & Kalies, G. (2020). Studies on the Binary MgO/SiO2 Mixed Oxide Catalysts for the Conversion of Ethanol to 1,3-Butadiene. Catalysts, 10(8), 854. https://doi.org/10.3390/catal10080854