Article

Elucidation of Water Promoter Effect of Proton Conductor in WGS Reaction over Pt-Based Catalyst: An Operando DRIFTS Study

by
Lole Jurado
1,2,*,
Nuria García-Moncada
1,3,
Luis F. Bobadilla
1,
Francisca Romero-Sarria
1 and
José A. Odriozola
1,*
1
Instituto de Ciencia de Materiales de Sevilla and Departamento de Química Inorgánica, Centro Mixto CSIC Universidad de Sevilla, Av. Américo Vespucio 49, 41092 Sevilla, Spain
2
Institut de chimie et procédés pour l’énergie, l’environnement et la santé (ICPEES), département de Catalyse et Matériaux, Université de Strasbourg, CNRS, 25 rue Becquerel, CEDEX 02, 67087 Strasbourg, France
3
Laboratoire Catalyse et Spectrochimie, ENSICAEN, Université de Caen, CNRS, 6 Boulevard Maréchal Juin, 14050 Caen, France
*
Authors to whom correspondence should be addressed.
Catalysts 2020, 10(8), 841; https://doi.org/10.3390/catal10080841
Submission received: 29 June 2020 / Revised: 21 July 2020 / Accepted: 23 July 2020 / Published: 25 July 2020
(This article belongs to the Special Issue Catalysts for Water-Gas Shift Reaction)

Abstract

:
A conventional Pt/CeO2/Al2O3 catalyst physically mixed with an ionic conductor (Mo- or Eu-doped ZrO2) was tested at high space velocity (20,000 h−1 and 80 L h−1 gcat−1) under model conditions (only with CO and H2O) and industrial conditions, with a realistic feed. The promoted system with the ionic conductor physically mixed showed better catalytic activity associated with better water dissociation and mobility, considered as a rate-determining step. The water activation was assessed by operando diffuse reflectance infrared fourier transformed spectroscopy (DRIFTS) studies under reaction conditions and the Mo-containing ionic conductor exhibited the presence of both dissociated (3724 cm−1) and physisorbed (5239 cm−1) water on the Eu-doped ZrO2 solid solution, which supports the appearance of proton conductivity by Grotthuss mechanism. Moreover, the band at 3633 cm−1 ascribed to hydrated Mo oxide, which increases with the temperature, explains the increase of catalytic activity when the physical mixture was used in a water gas shift (WGS) reaction.

Graphical Abstract

1. Introduction

The applicability of a water gas shift (WGS) reaction (Equation (1)) in fuel cells and mobile devices as important step to remove CO pollutants and produce clean H2 is still challenging This arises because the reaction is thermodynamically favored at low temperatures and implies low space velocities and kinetics which require large volume reactors [1,2].
CO + H2O ⇆ CO2 + H2 ΔH0298K = −41.1 kJ mol−1
During the last decades, numerous efforts have been made to design better catalysts which work at high space velocity, keeping high activity and reducing the reactor volume significantly. In this sense, noble metals such as Pt, Pd, Ru or Au have shown optimal performances at low-intermediate temperatures, good behavior in start-up/shut-down cycles and good tolerance to impurities [3,4,5,6,7]. Despite no agreement about the WGS reaction mechanism [8,9,10,11], also influenced by the experimental conditions and the used active metal as catalyst, it seems clear the water activation and diffusion to the active sites is a rate-determining step [12,13]. Particularly, noble metals supported on reducible oxides like CeO2 have shown better performances than those on unreducible oxides like Al2O3 or SiO2 [14,15,16,17], since the redox cycles of the reducible supports develop the water activation. For instance, Vignatti et al. [18] observed that the catalytic activity in WGS reaction increased in the order Pt/SiO2 < Pt/CeO2 < Pt/TiO2. Likewise, Panagiotopoulou et al. [16] studied different noble metal-support combinations and identified Pt-based catalysts were more active, exhibiting higher activity when supported on reducible oxides. Accordingly, in order to improve the kinetics at low temperatures and work at high space velocity, it is mandatory to promote the water activation step.
In this context, a physical mixture between a typical noble-based WGS catalyst and a ZrO2-based ionic conductor to promote water activation and mobility was studied in our group, obtaining in all cases higher activity with the promoted system in respect to the bare catalyst without the ionic conductor, whatever the catalyst or the ionic conductor [19]. Particularly, we demonstrated that Eu-doped ZrO2 mixed oxide as an ionic conductor exhibited proton conductivity via Grotthuss mechanism [20,21,22] in the WGS reaction temperature range [23]. The Eu doping creates oxygen vacancies in the formed solid solution (EuyZr1−yO2−0.5y) which are able to activate the water molecules, confirmed by in situ diffuse reflectance infrared fourier transformed spectroscopy (DRIFTS) measurements under WGS reaction conditions. The higher activity in WGS reaction was observed in the same temperature range that this proton conductivity occurred. The optimal Eu content according to better mobility of the oxygen vacancies and higher conductivity measured by impedance spectroscopy (95:5 mol.% of ZrO2:Eu2O3) also agreed with the best catalyst-ionic conductor mixture’s performance in the catalytic tests in the WGS reaction.
Mo-containing compounds have been reported as excellent ionic conducting materials. In general, Mo-doped oxides present mixed ionic-electronic conductivity (MIEC), where the temperature and the Mo content shift the conducting character [24,25,26,27]. Thus, high Mo content decreases the crystal symmetry performing electronic conductivity mainly, but decreasing the Mo loading the proton conductivity is favored [28,29]. In addition, Eu-doped Mo oxide is reported to form bronze-type structures capable to retain H2 or water molecules [30,31,32]. In bronze formation, H2 is dissociated and bonded as –OH or –OH2 groups, depending on the H2 concentration [30,33,34]. This hydrogen addition disturbs the crystal structure affecting the hydrogen mobility, where protons can diffuse through the oxide lattice and where –OH or –OH2 groups are the bridges on the surface inducing the proton conductivity [34,35,36,37].
In the present work, a typical Pt/CeO2/Al2O3 catalyst was physically mixed with a Zr-based ionic conductor and tested in a WGS reaction under realistic conditions at high space velocity. The formed species during the reaction were analyzed by operando DRIFTS measurements mainly focused on studying the water activation step. The used ionic conductor is based on the optimal Eu-doped ZrO2 solid solution (95:5 mol.% of ZrO2:Eu2O3) already studied in our group, which has been prepared by doping with a small amount of Mo in order to increase the water activation effect.

2. Results and Discussion

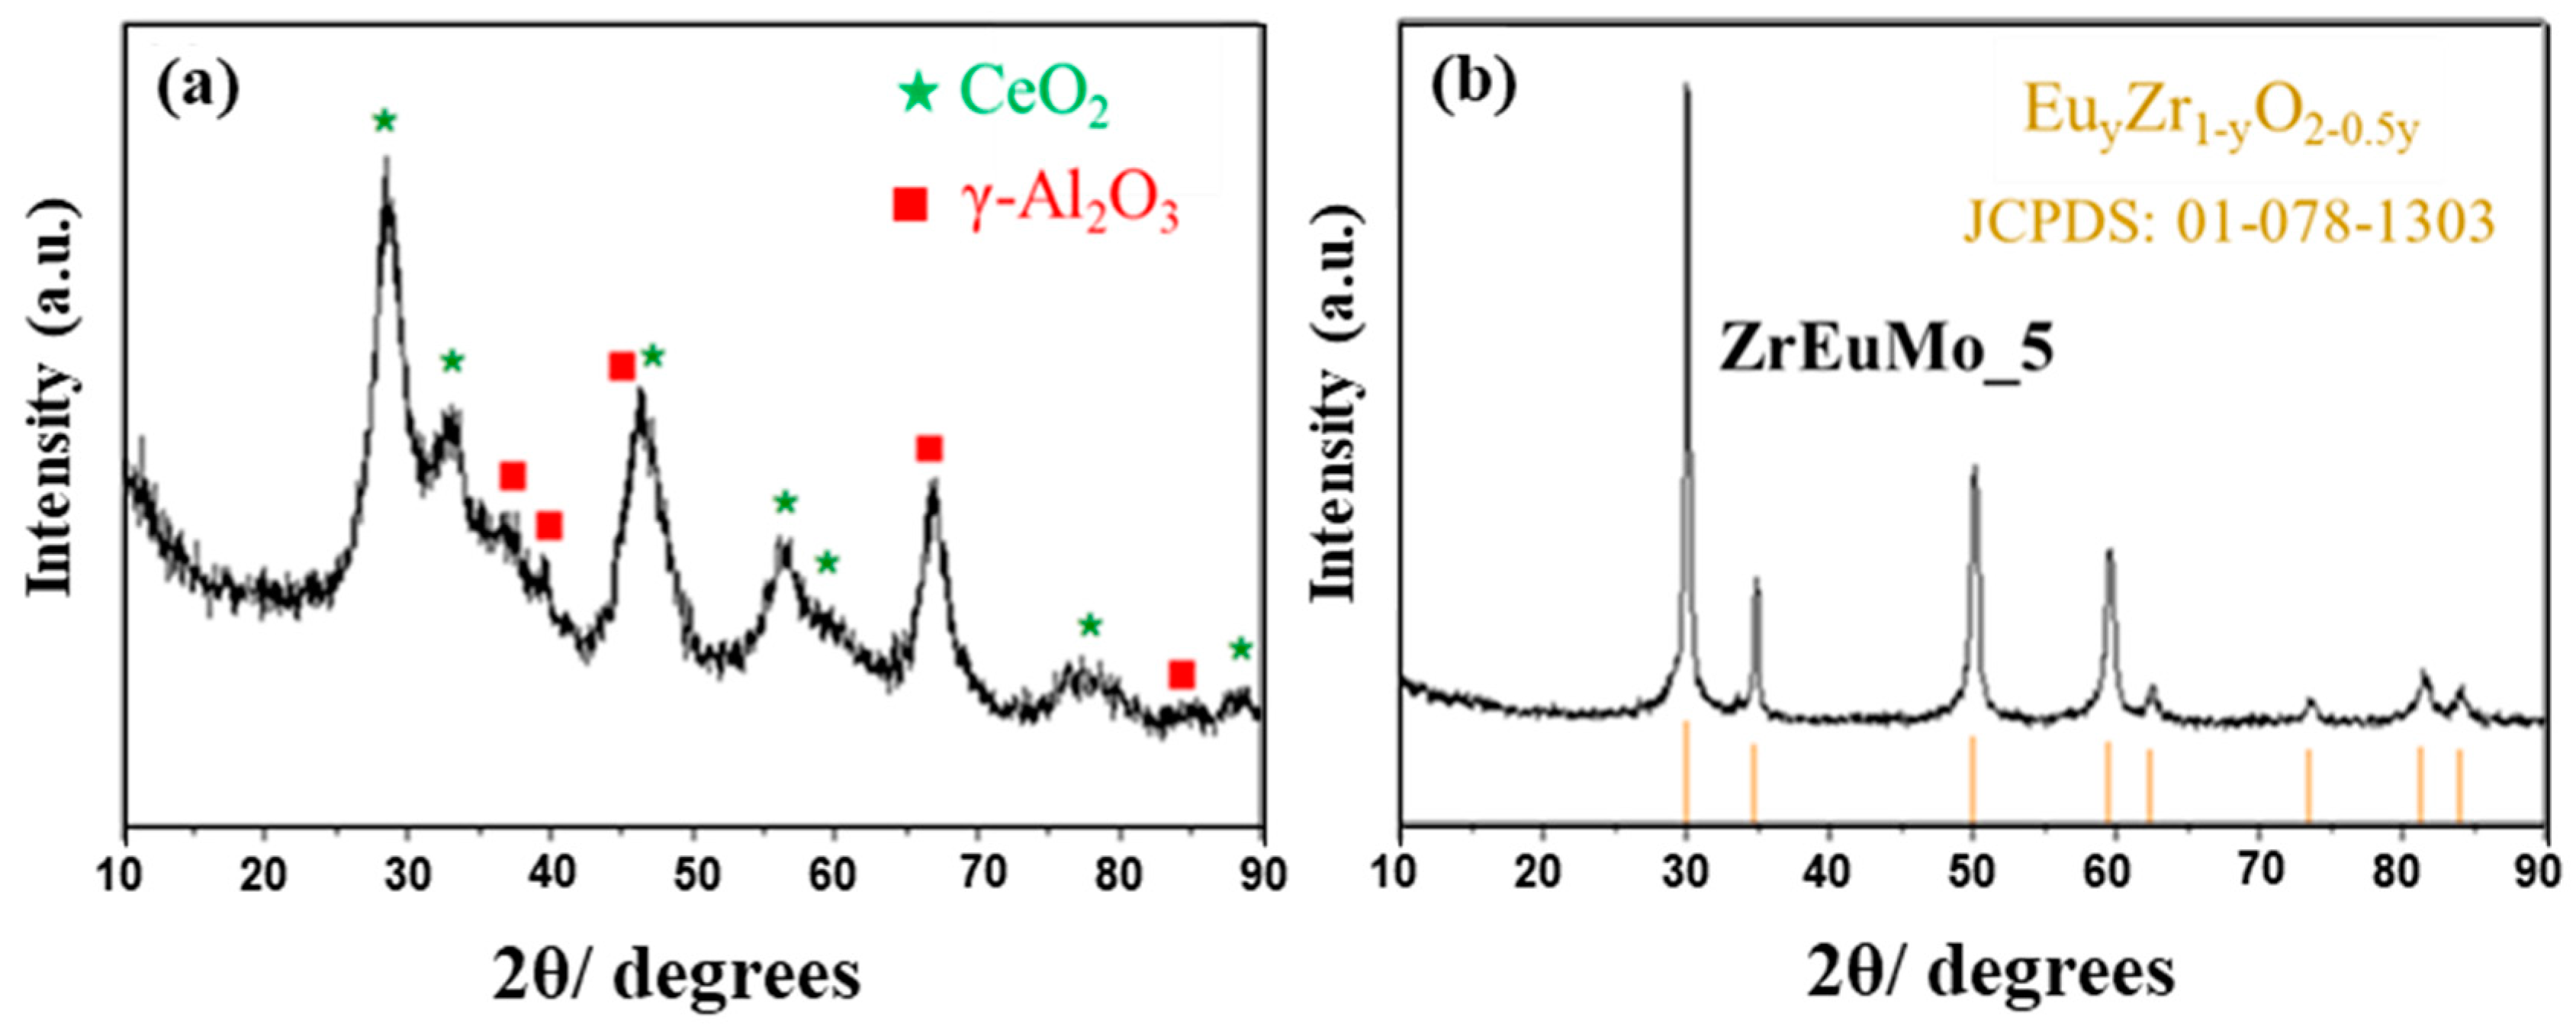
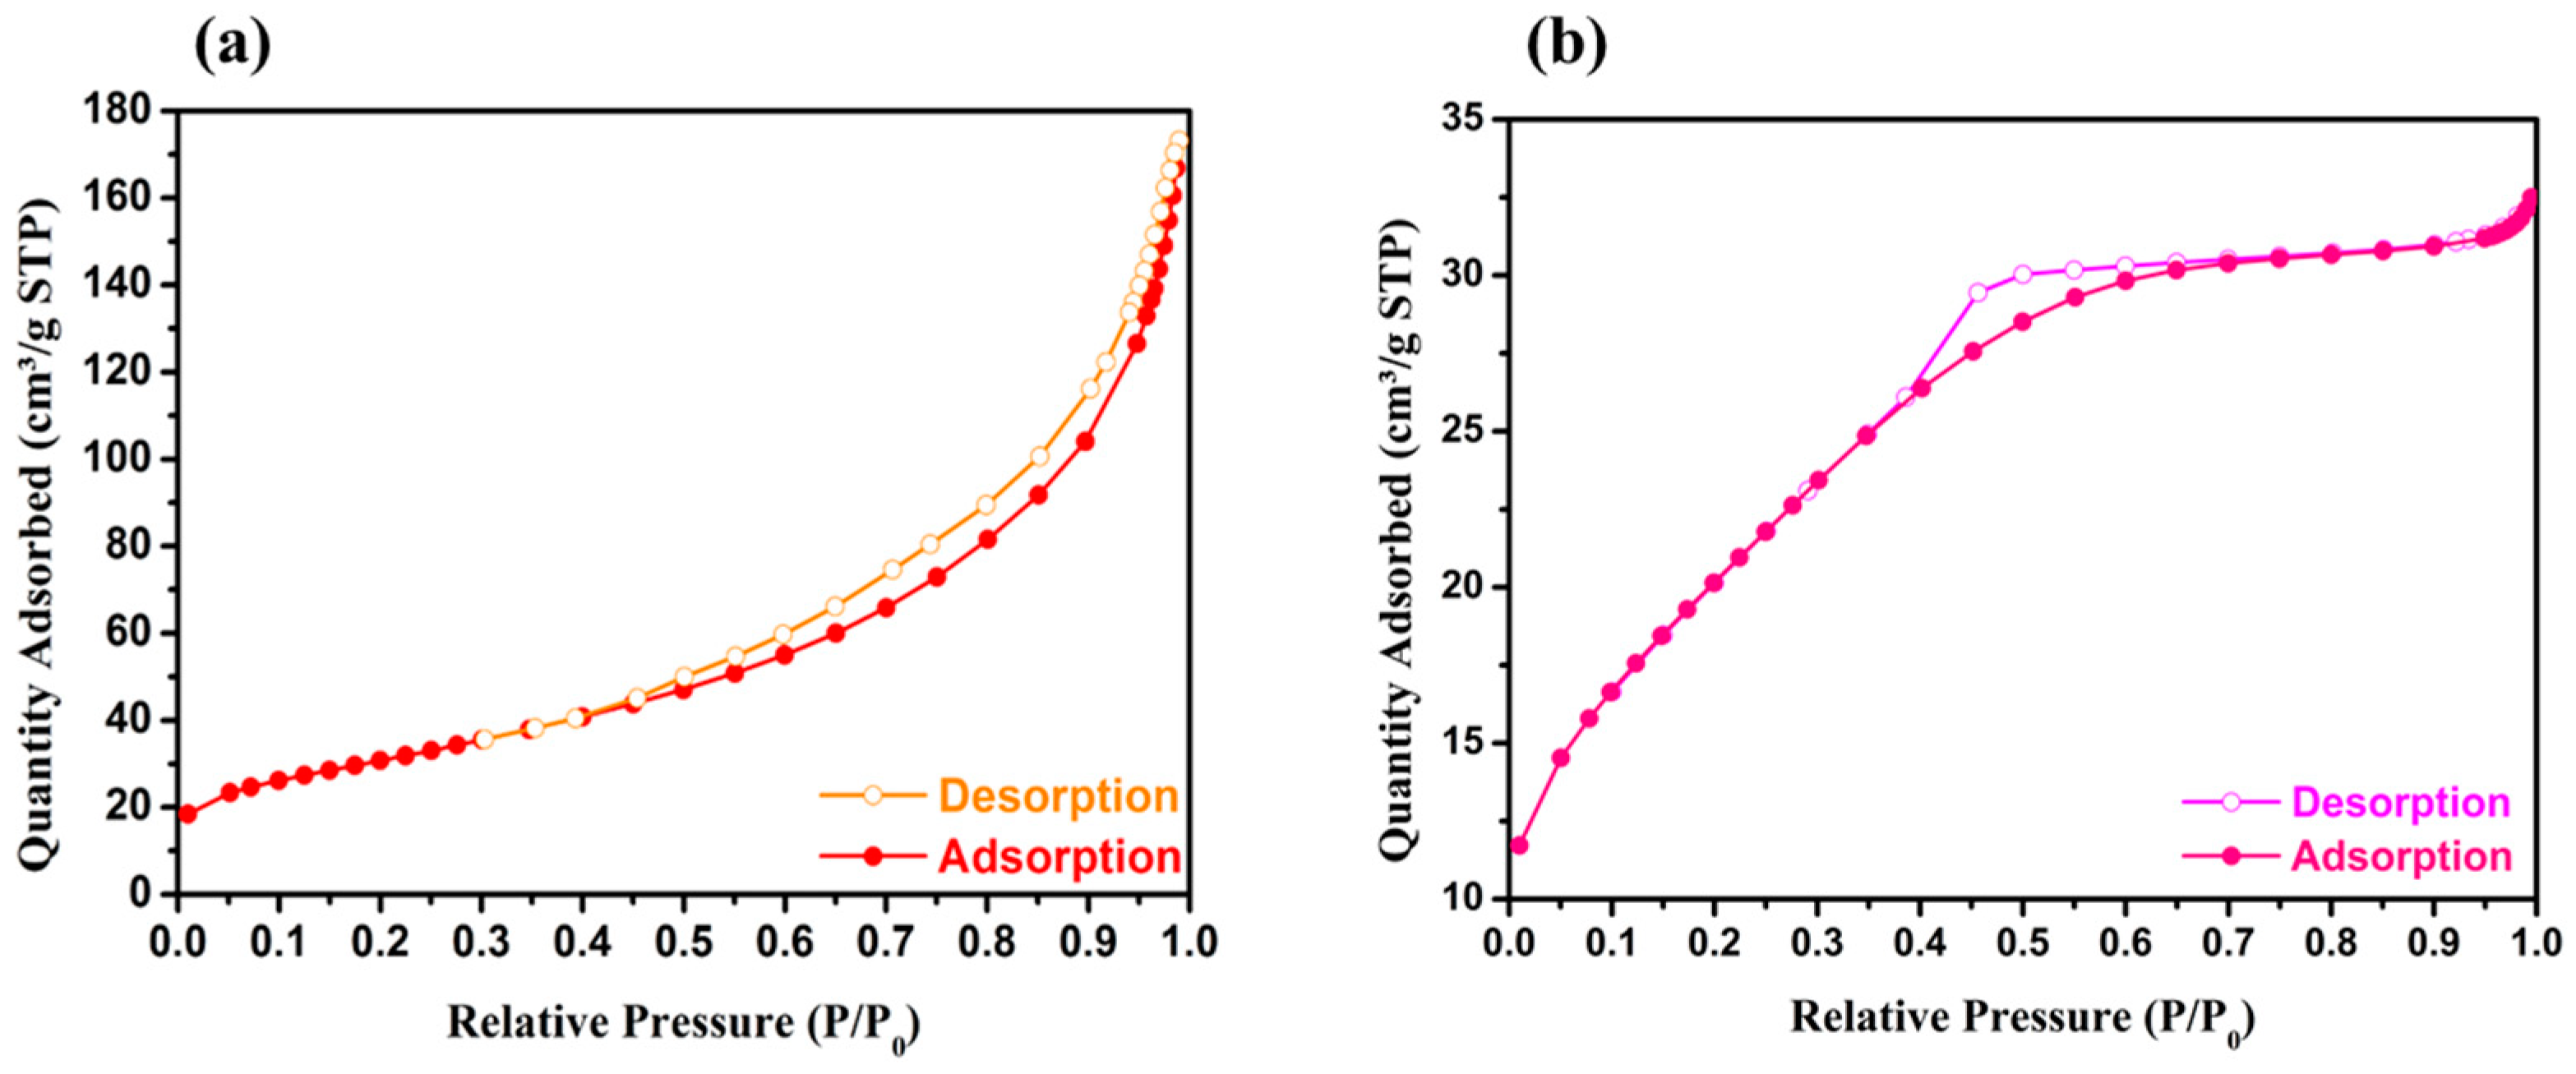
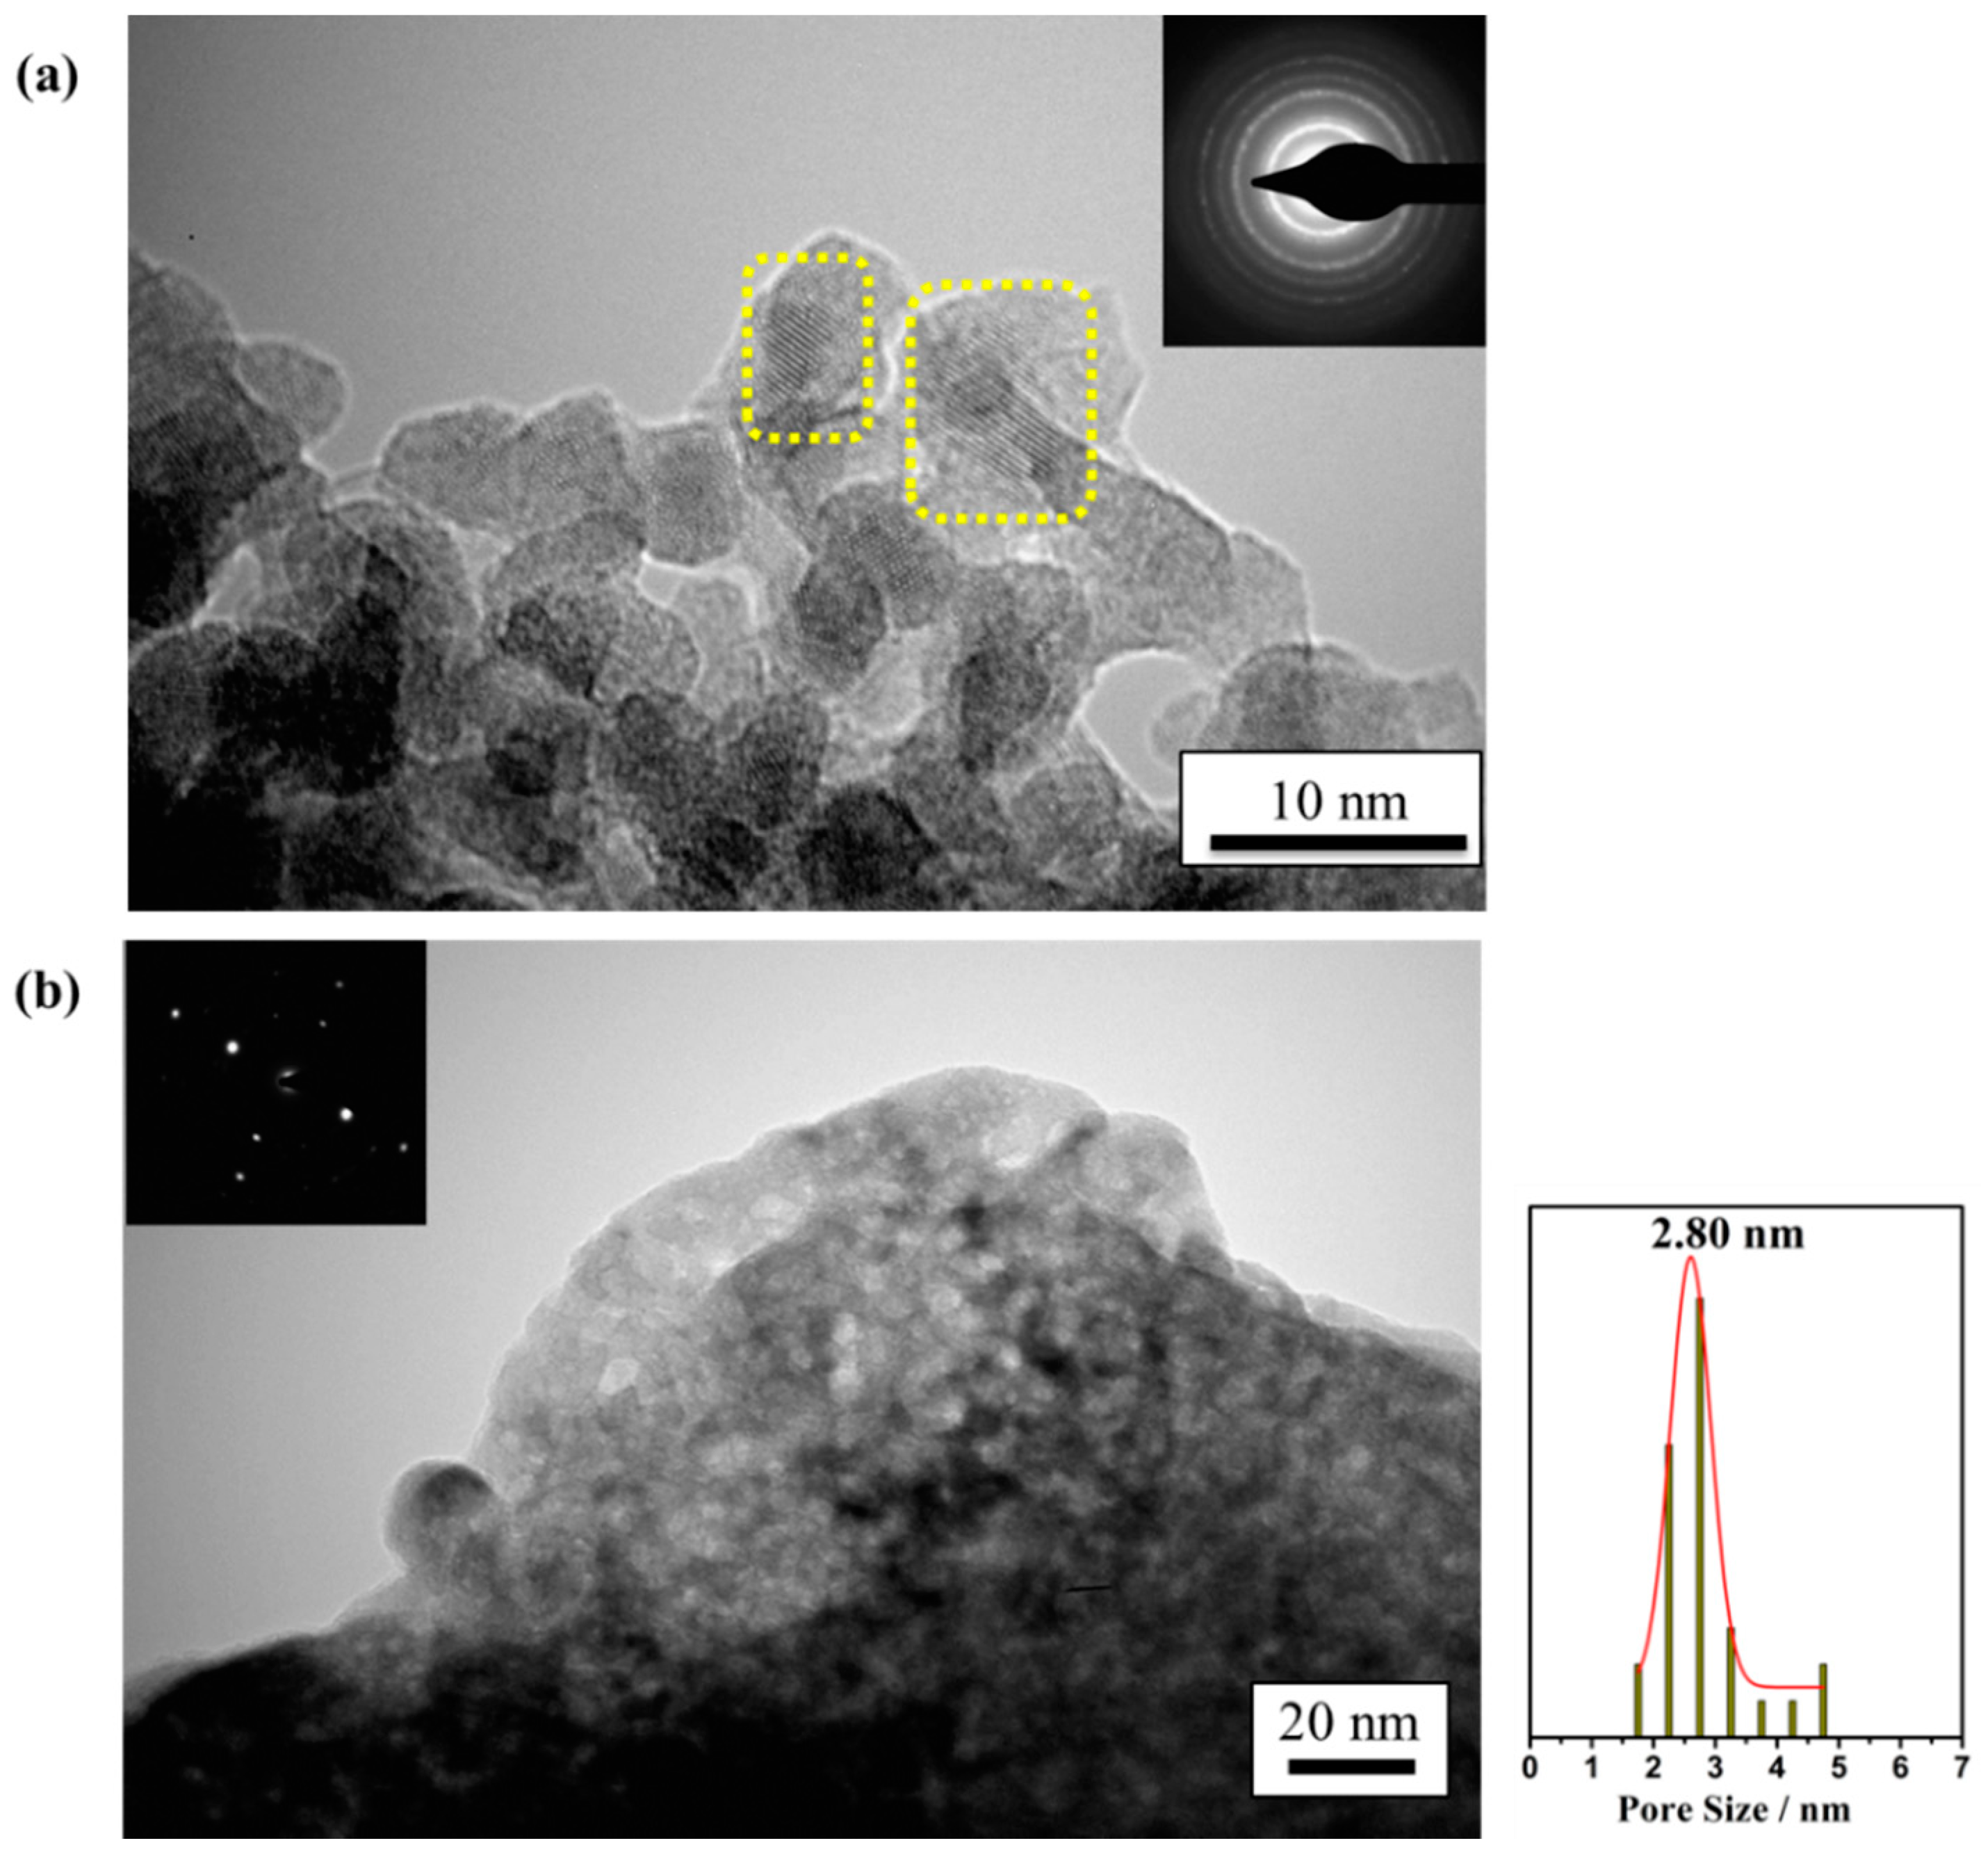
2.1. Physicochemical and Textural Properties

Figure 1 shows the diffractograms of the prepared samples. As can be observed in Figure 1a, both γ–Al2O3 (JCPDS: 01-077-0396) and CeO2 (JCPDS: 00-034-0394) phases were identified on the Pt/CeAl catalyst. However, Pt phases were hardly detected, likely due to Pt particles being very small and highly dispersed. On the other hand, Figure 1b includes the diffractogram of the ZrEuMo_5 sample and the X-ray diffraction (XRD) pattern of a cubic Fm 3 ¯ m structure associated to EuyZr1−yO2−0.5y solid solution (JCPDS: 01-078-1303) for comparison. The ZrEuMo_5 sample contains a loading of 5 mol.% of Eu2O3 (y ≅ 0.1 in the solid solution), and it is noticeable that the diffractogram (Figure 1b) exhibits all peaks associated to Eu-doped ZrO2 solid solution phase whereas any phase of molybdenum was evidenced. Moreover, molybdenum presence does not modify the diffraction pattern of the solid solution, which indicates Mo is not entering in the lattice or disturbing the Eu-doped ZrO2 solid solution structure. Further analysis on Mo addition to the Eu-doped ZrO2 solid solution using different amounts of Mo by García-Moncada et al. showed that molybdenum is not incorporated in the mixed oxide but forms highly dispersed small clusters of MoOx which preferentially are located on Eu sites [38].
Figure 2 evidences the adsorption-desorption N2 isotherm of the synthesized materials. The N2 isotherm related to Pt/CeAl catalysts (Figure 2a) can be described as type IV according to Brunauer-Deming-Deming-Teller (BDDT) classification [39] or, as pseudo-type II with a type H3 loop according to International Union of Pure and Applied Chemistry (IUPAC) classification, characteristic of slit-shaped type pores or materials with a low degree of pore curvature [40,41]. This pseudo-type II character is related to the metastability of the absorbed multilayer and delayed capillary condensation. Concerning the ionic conductor, ZrEuMo_5, the resulting isotherm (Figure 2b) can be classified as type IV characteristic of mesoporous solids (2–50 nm) [40]. Additionally, the high convexity of the curve for relative pressures (P/P0) below 0.5 might suggest the existence of pores with a radius close to that of micropores. Likewise, the textural properties of the catalyst and the ionic conductor have been summarized in Table 1. The catalyst possesses a high Brunauer-Emmett-Teller (BET) specific surface area attributed to the γ–Al2O3 phase, and Pt loading keeps the same order of magnitude of the pores’ volume and size with respect to the bare CeO2/Al2O3 [42], suggesting that metal is highly dispersed on the porous support. Regarding to the ZrEuMo_5 sample (Table 1), the BET surface area is increased by Mo addition onto the bare Eu-doped ZrO2 (42 m2/g, reported by García-Moncada et al. [23]), and monomodal pore size distribution centered in 2.4 nm. The chemical composition of the ionic conductor as well as the Pt loading on the catalyst determined by X-ray fluorescence spectrometry (XRF) have been also shown in Table 1. Thus, the desired amount of Pt (2 wt.%) was achieved by the wet impregnation method. Furthermore, the composition of the commercial Puralox CeO2/Al2O3 reported in its technical data [42] (mass ratio of 20:80 in CeO2:Al2O3) was confirmed. The XRF analysis of the ZrEuMo_5 sample shows that the desired composition is achieved during co-precipitation synthesis.
Figure 3 shows the transmission electron microscopy (TEM) images of the studied materials. The inspection of the TEM image of Pt/CeAl catalyst (Figure 3a) does not evidence Pt particles, which could suggest a high dispersion of the Pt phase. However, it has to be highlighted that Pt cannot be distinguished due to the low contrast between Ce and Pt signals in TEM. As can be noted in Figure 3a, two areas (dotted yellow boxes) allow to measure the interplanar spacing of 3.1 Å associated to the (111) planes of the cubic Fm 3 ¯ m phase of the CeO2. The cubic phase and the polycrystalline character of the Pt/CeAl catalyst can be also distinguished by the electron diffraction pattern (Figure 3a, inset). The ZrEuMo_5 mixed oxide (Figure 3b) evidences monocrystalline and polycrystalline zones as well as cubic structure. In addition, the pore size distribution of the prepared ionic conductor determined by the Barrett-Joyner-Halenda (BJH) method is confirmed by TEM, where a high porosity of the sample with a homogeneous pore diameter between 2–3 nm is clearly seen in Figure 3b.

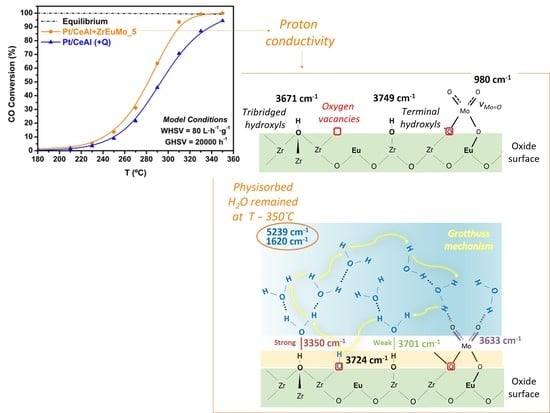
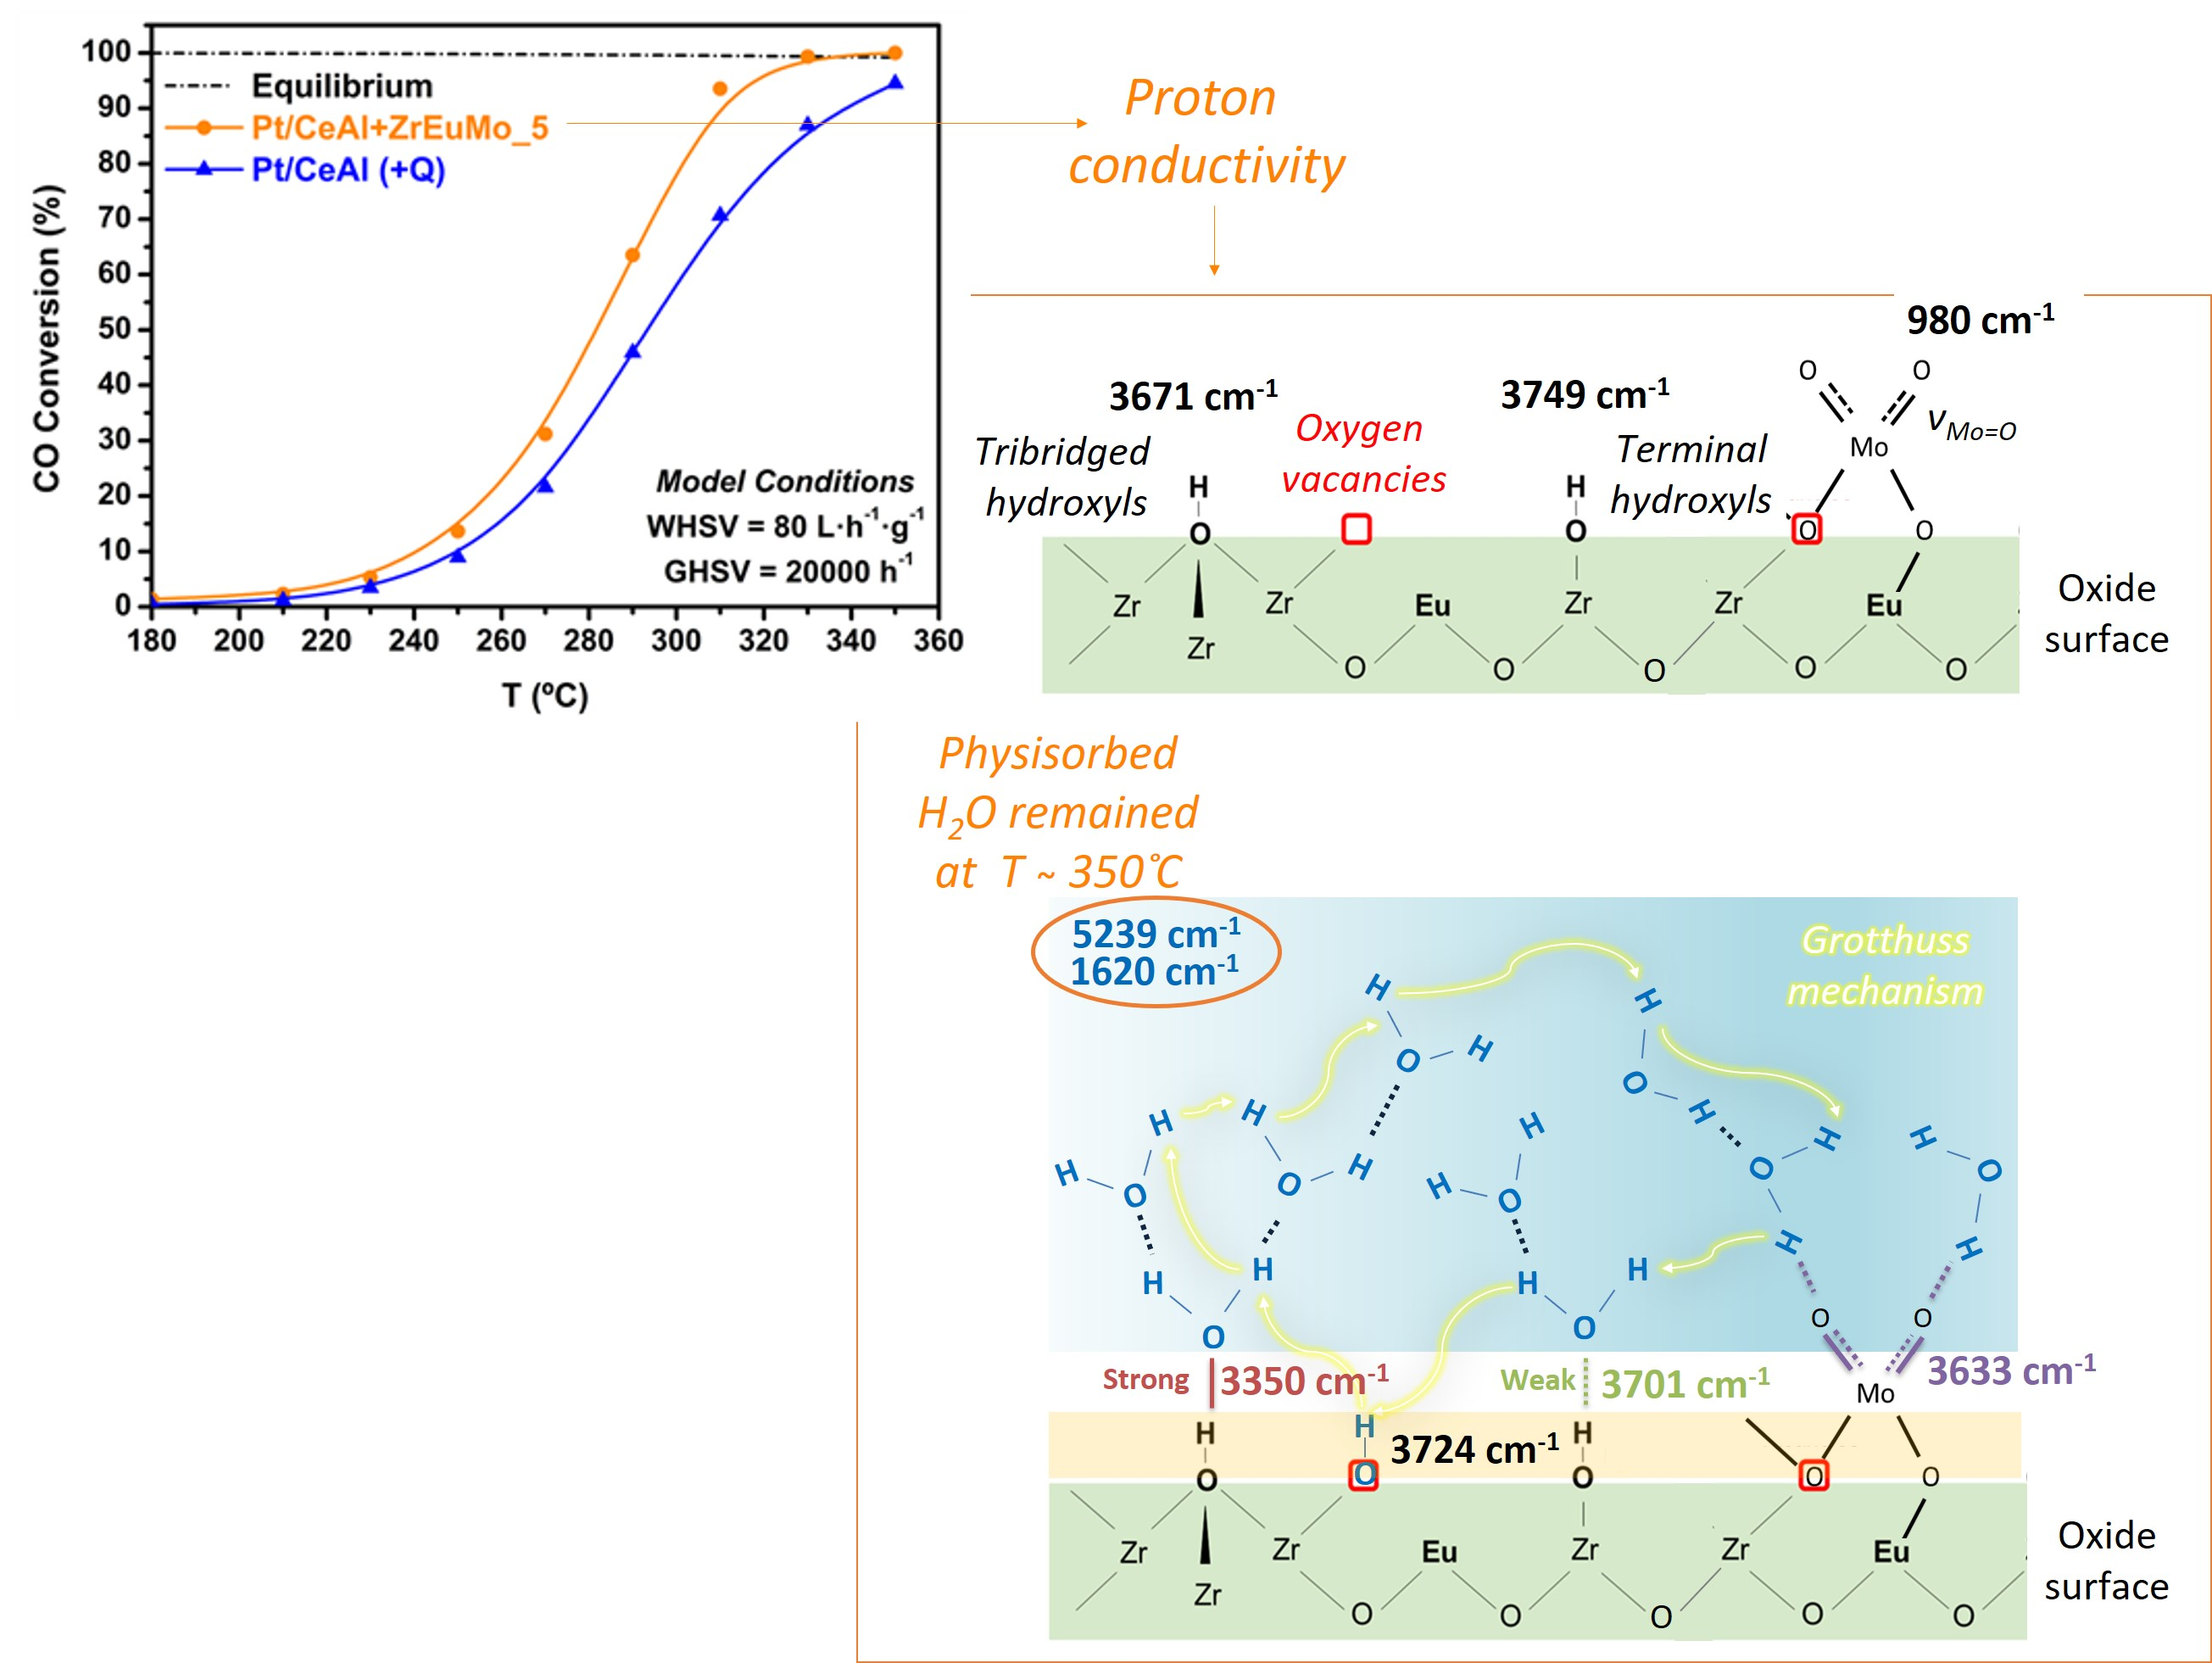
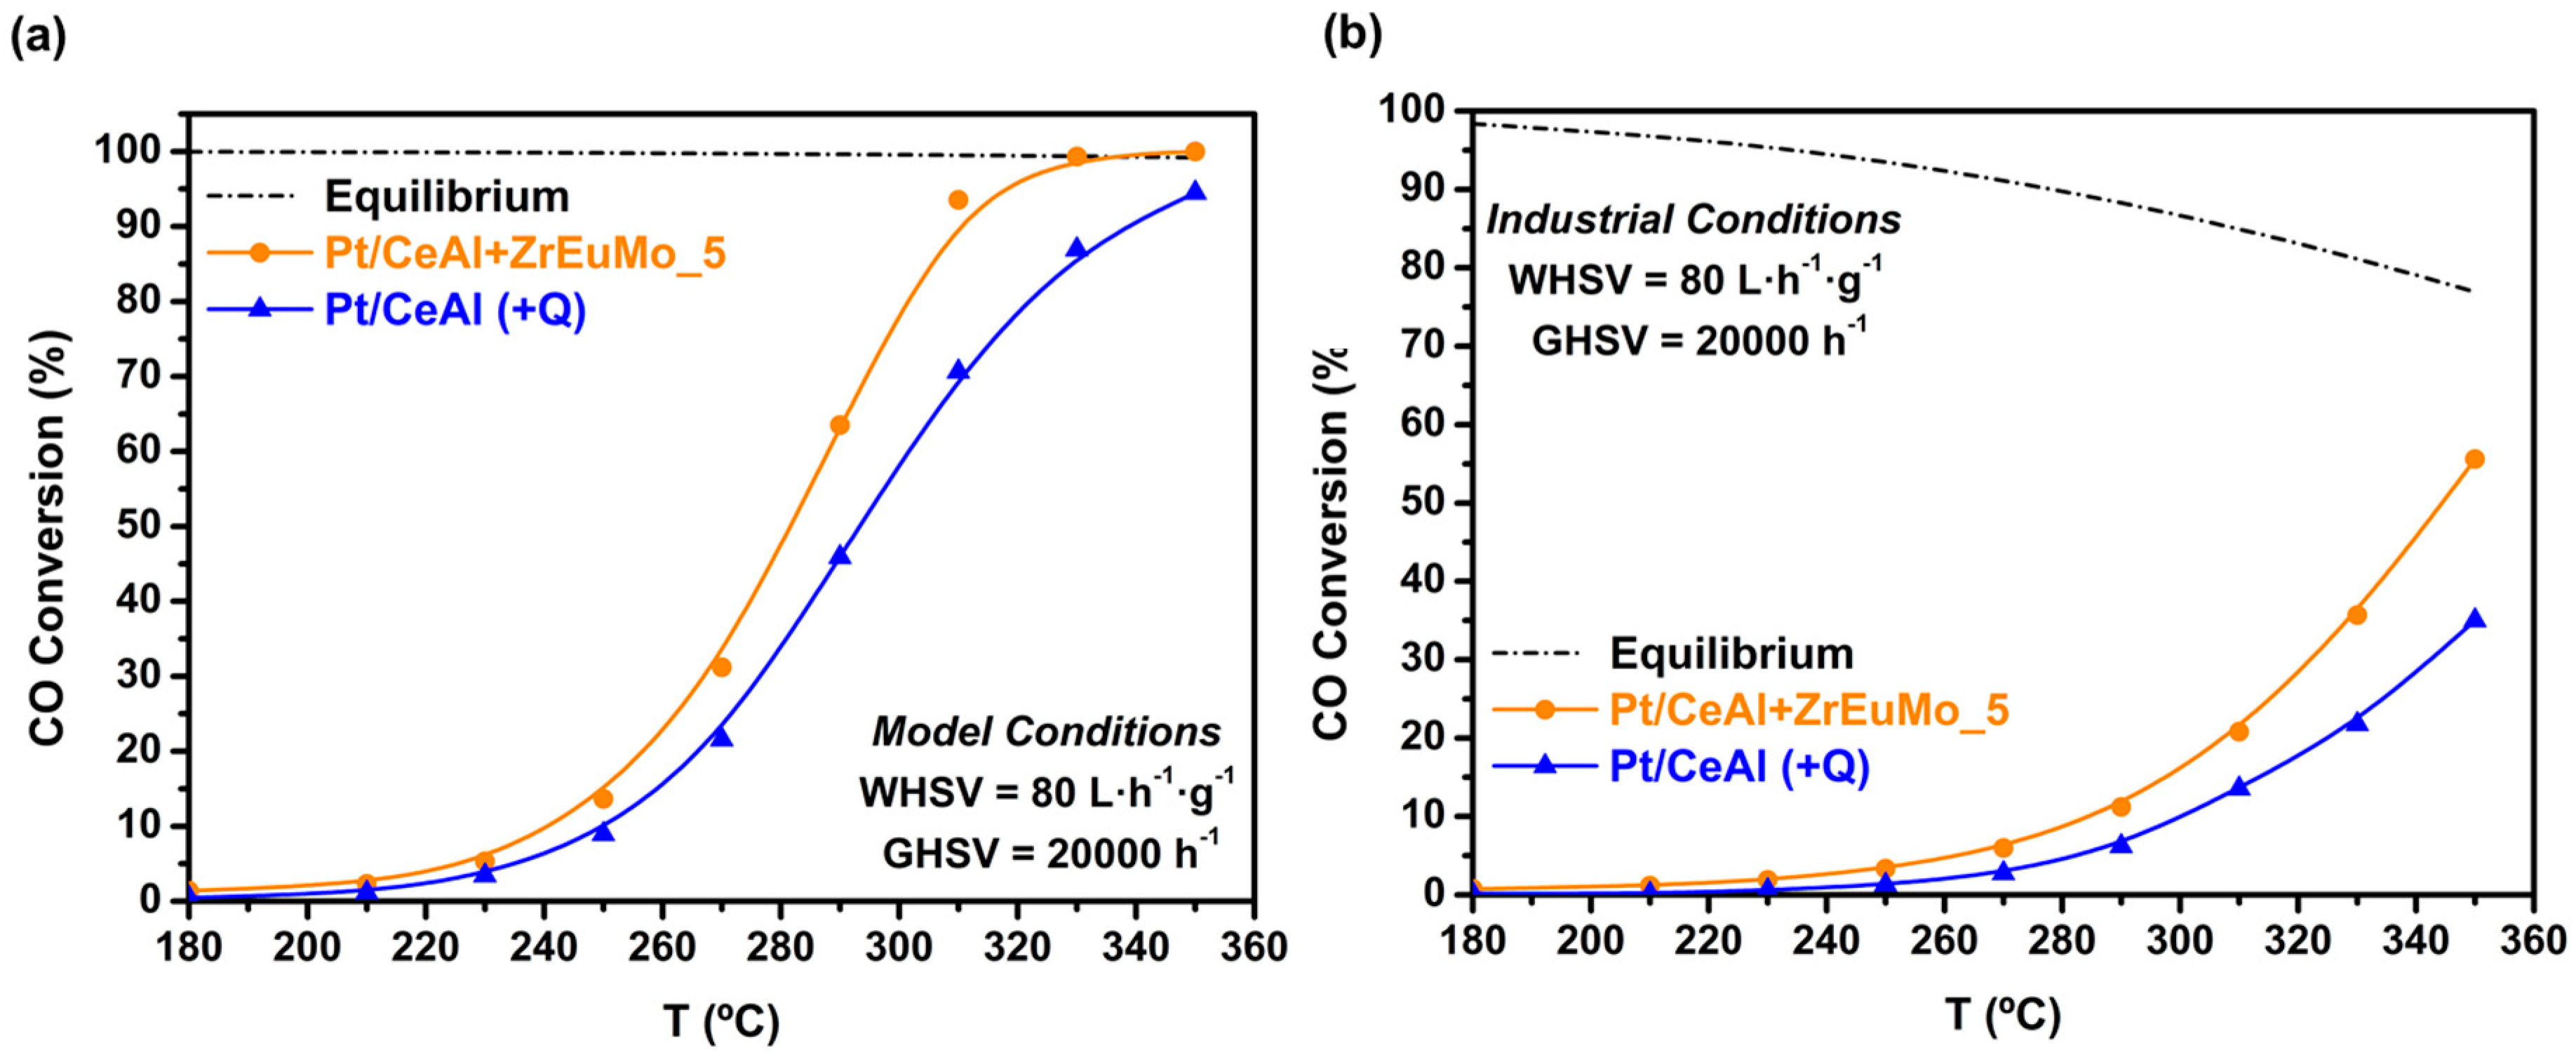
2.2. Catalytic Performance

Two catalytic systems were tested: (i) Pt/CeAl diluted with inert quartz and (ii) a physical mixture of Pt/CeAl and ZrEuMo_5 (mass ratio of 1:5 Pt/CeAl:ZrEuMo_5) to verify the promoting effect of the ionic conductor on the catalyst. The catalytic activity of these systems was assessed using two different feeds: model conditions (4.5% CO, 30% of H2O and N2 as balance) and industrial conditions (9% CO, 30% H2O, 11% CO2, and 50% H2).
Figure 4 shows the catalytic activity in terms of CO conversion versus temperature for both catalytic systems under model (Figure 4a) and industrial (Figure 4b) conditions. It is noteworthy that the promoted system formed by the physical mixture of Pt/CeAl catalyst and ZrEuMo_5 ionic conductor provides higher activity in terms of CO conversion in both feeding conditions. For comparison, the ionic conductor (ZrEuMo_5) alone was also tested in both feed conditions confirming that this material is catalytically inactive for WGS reaction (data not shown). Nevertheless, it is worth mentioning that CO2 concentration slightly decreased at low temperatures under industrial conditions without changes in the other components of the feed and returning to its initial value above 300 °C, suggesting that a small capture of CO2 molecules occurs into the pores of the ionic conductor.
Apparently, the differences observed in both catalytic systems could be associated to higher thermal diffusion by the presence of a dilutant. However, the Pt catalyst was diluted in both systems, either ionic conductor or quartz, using the same amount of catalyst (0.1g of Pt/CeAl) and sieved in the same particle sizes. Thereby, both systems were tested in the same weight and volumetric space velocities (same catalyst weight and catalytic bed volume). This indicates that an additional feature exists for explaining the superior activity of Pt/CeAl + ZrEuMo_5 promoted catalyst. As can be underlined, the effect by ZrEuMo_5 presence is observable from ~250–270 °C, which is in good agreement with the temperature from which the Eu-doped zirconia ionic conductor starts to show proton conductivity, according to impedance spectroscopy measurements reported by García-Moncada et al. [23]. In the literature, Pt-based catalysts for WGS reaction have been reported to provide high CO coverage, with water activation as one of the slowest steps [43,44]. In this context, ceria support improves the fast oxygen storage/release cycles via a reversible conversion between Ce4+ and Ce3+ [45,46,47]. The reduction process from Ce4+ to Ce3+ provides a high mobility of oxygen/hydroxyl groups promoting the hydroxyl groups formation on the surface. Thus, the higher activity obtained by the proposed catalytic system including the ionic conductor, can be explained by higher concentration and mobility of hydroxyl groups and molecular water on the surface. Hence, the ionic conductor does not catalyze the reaction itself, but from temperatures (250–270 °C) where the proton conductivity starts to happen according to Grotthuss mechanism [20,22], ZrEuMo_5 acts as a promoter of Pt catalyst increasing water activation and mobility. Moreover, it should be pointed out that the incremental effect by ZrEuMo_5 observed in industrial conditions was more pronounced than in model conditions. This could be related to the capacity of MoOx to create hydrated bronzes from 300 °C, since the industrial conditions feed includes 50% H2, in contrast to model conditions [38], and the presence of these structures could enhance the water activation.

2.3. Operando DRIFTS Study

In order to gain insights into the mechanistic aspects of WGS reaction on Pt/CeAl surface catalyst and elucidate the promoter role of ionic conductor, both solids were independently studied under reaction conditions by means of DRIFT spectroscopic measurements.

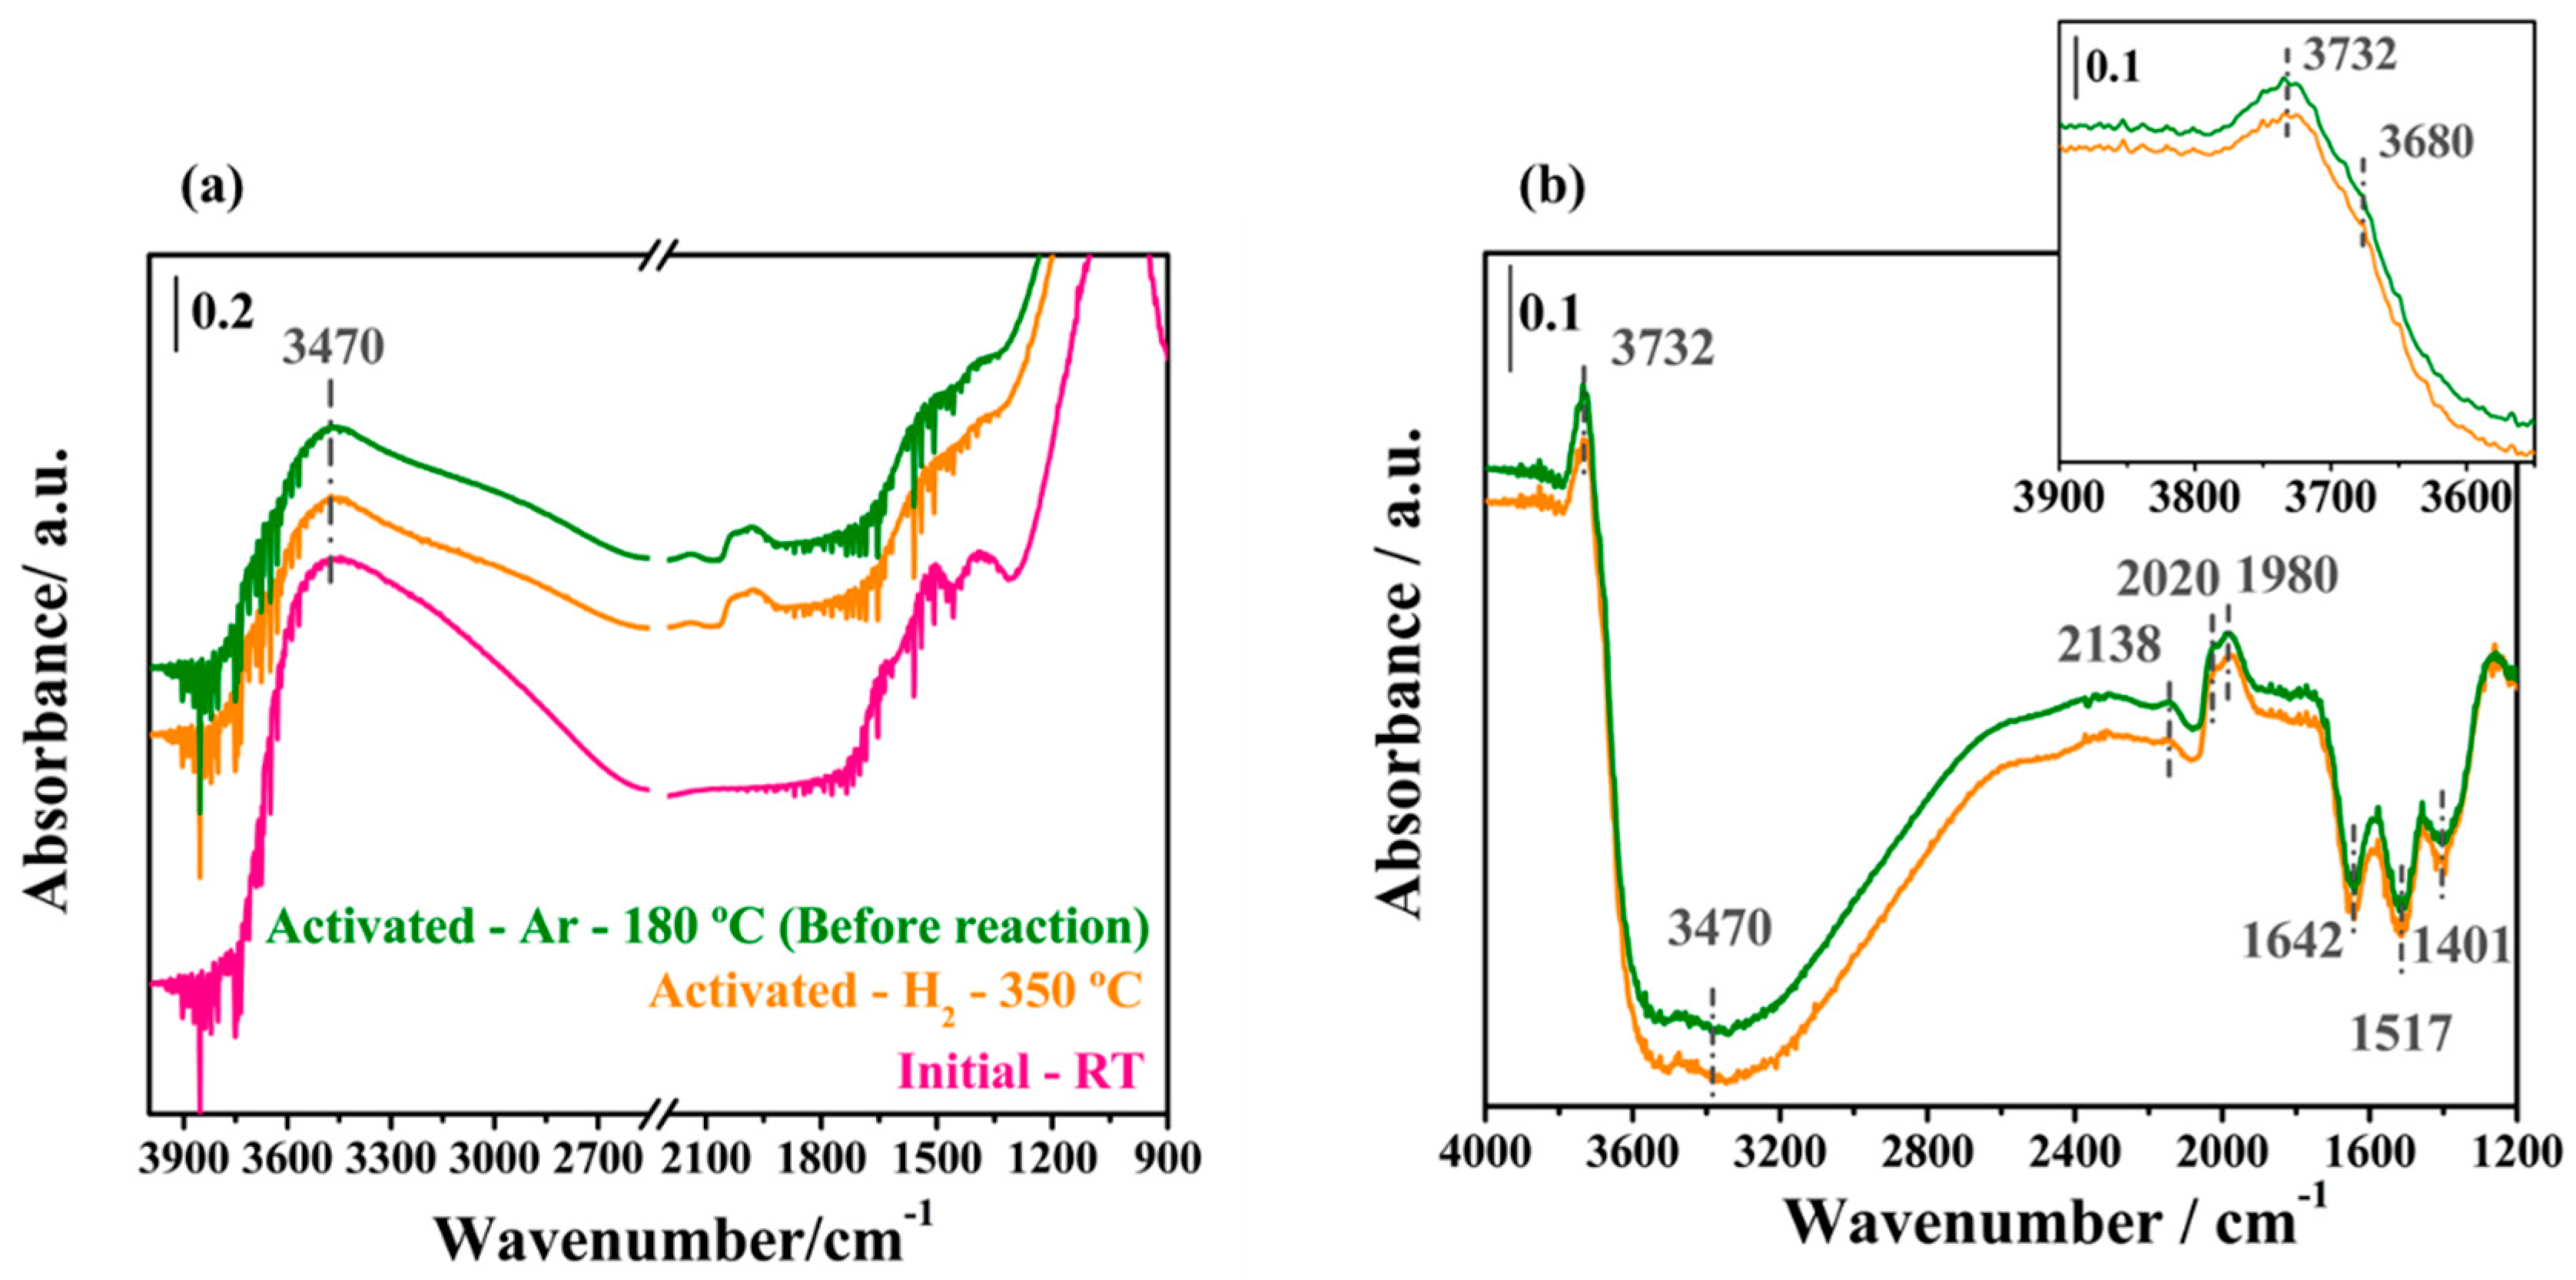
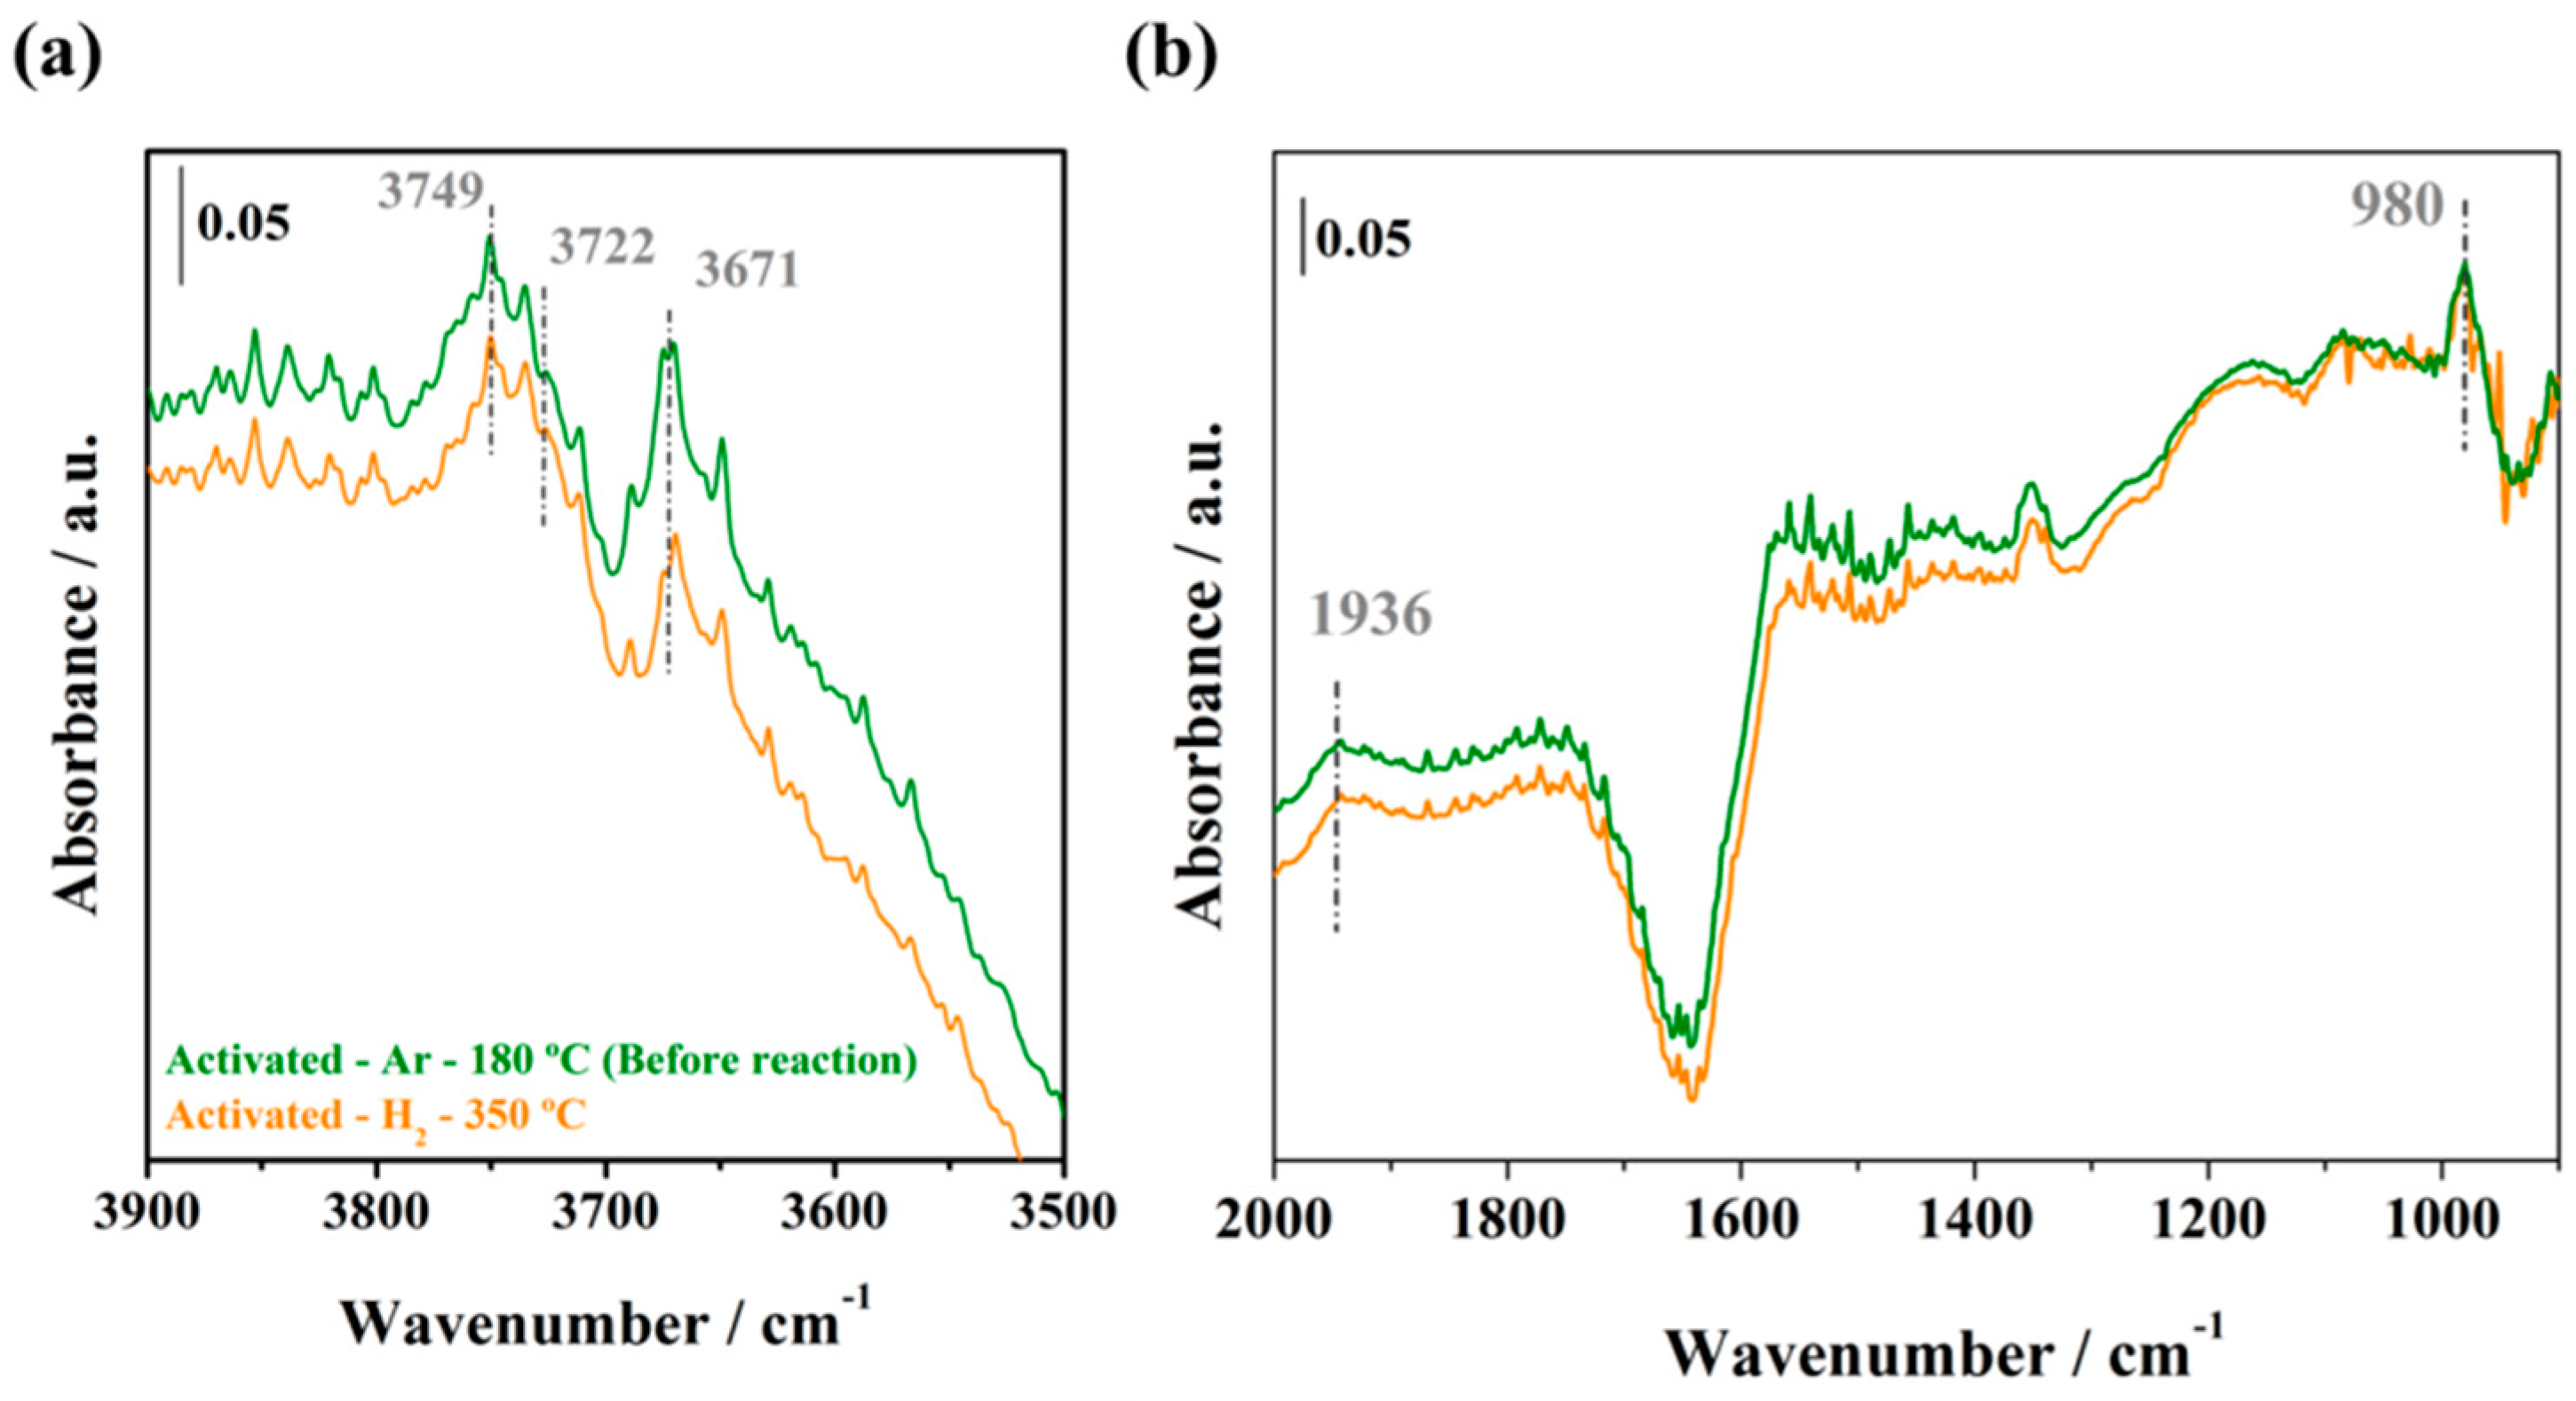
2.3.1. Initial Pretreatment of the Samples

Prior to reaction, the catalyst was in situ pretreated as described in Materials and Methods (Section 3.). Figure 5a displays the initial spectrum at RT, the spectrum of the activated sample at 350 °C in H2/Ar, and the spectrum of the solid after activation at 180 °C in Ar before starting reaction. Figure 5b also includes the difference spectra of the latter two with respect to the former one. Herein, the positive bands indicate the formed species whereas the negative ones are associated to species that disappear during the activation step. Consequently, the disappearance of the broad band centered at 3470 cm−1 coupled to the peak at 1642 cm−1, and the appearance of two new features at 3732 and 3680 cm−1 clearly indicate the desorption of physisorbed water during the activation step, whose vanishing leads to the observation of stretching vibrations of hydroxyl groups over the ceria/alumina support [48].
On the other side, the bands appearing at 2020 and 1980 cm−1 are associated with the creation of Pt–CO species, which are formed upon decomposition of carboxylates whose disappearance is assessed by the intensity decrease of the bands at 1517 and 1401 cm−1 assigned to υOCO vibrations [49]. Not surprisingly, an intensity increase of a band at 2138 cm−1 in H2 atmosphere is also observed. This is attributed to the typical 2F5/22F7/2 electronic transition of Ce3+ [48,50].
Identical activation pre-treatment was carried out on the ZrEuMo_5 proton conductor. Similarly, the spectra before and after the activation process, and the respective difference spectra in respect to that at RT before the activation step are shown in Figure 6. Prior to activation step, the spectrum is dominated by a broad band placed at 3438 cm−1 caused by the stretching vibration (υOH) of species resulting from the interaction between molecular water and hydroxyl groups via hydrogen bonds. Moreover, this feature is related with the bands at 1636 and 5162 cm−1 corresponding to the scissoring bend (δHOH) and combination band (υOH + δHOH), respectively, and both typical of physisorbed water (Figure 6a). After H2 treatment, it is noticeable the disappearance of the broad band associated to non-dissociated water and the appearance of vibrations in the 3900–3500 cm−1 region corresponding to hydroxyl species (shown in the difference spectra, Figure 6b). The interaction via hydrogen bonds between the water molecules and the hydroxyl species is responsible for the non-appearance of these hydroxyl related bands before activation.
To facilitate the analysis of hydroxyl species, the 3900–3500 cm−1 region is displayed in Figure 7a. The new bands appearing at 3749, 3722, and 3671 cm−1 are assigned to monodentate (linear, type I) and tricoordinate bridged OH groups over ZrO2 [51]. These observations are in agreement with that found for Eu-doped zirconia solid solution, without Mo addition, as previously reported [23]. Furthermore, the region from 2000 to 900 cm−1 has been also magnified (Figure 7b), where besides the negative band at 1636 cm−1 due to the elimination of the physisorbed water, two other bands appear at 980 cm−1 and 1936 cm−1, both associated to Mo=O bond stretch and its overtone, respectively [52]. The increase of these bands after the activation step may be related to the dehydration of superficial Mo oxide of the sample according to Scheme 1.
On the other side, there are also some bands between 1600 and 1100 cm−1 (Figure 7b) which can be ascribed to residual carbonates/carboxylates like compounds. The presence of these species is unavoidable due to the atmospheric CO2 adsorption on Eu-doped zirconia during the calcination process, forming thereby these carbon-species which remain occluded into the pores according to the high porosity of the material [53].
Finally, the new bands also formed during the activation in the range of 2400–2150 cm−1 are more detailed in Figure 8. At these vibrational frequencies can be observed low-energy f-f transitions of Eu3+ [54]. In particular, the band at 2236 cm−1 is attributed to 7F07FJ transition, which is shifted on reducing temperature to 2228 cm−1, since these transitions are highly sensitive to temperature changes [23]. Moreover, in this region are bands (between 2400–2300 cm−1) associated to occluded CO2 inside the pores of the sample. Hence, O=C=O····Mn+ interactions produce splitting of the bands [55]. In addition, due to the molecular CO2 presence, the attribution of these bands result complex.
After the activation pre-treatment, the WGS reaction was performed under model and industrial conditions in both solids.

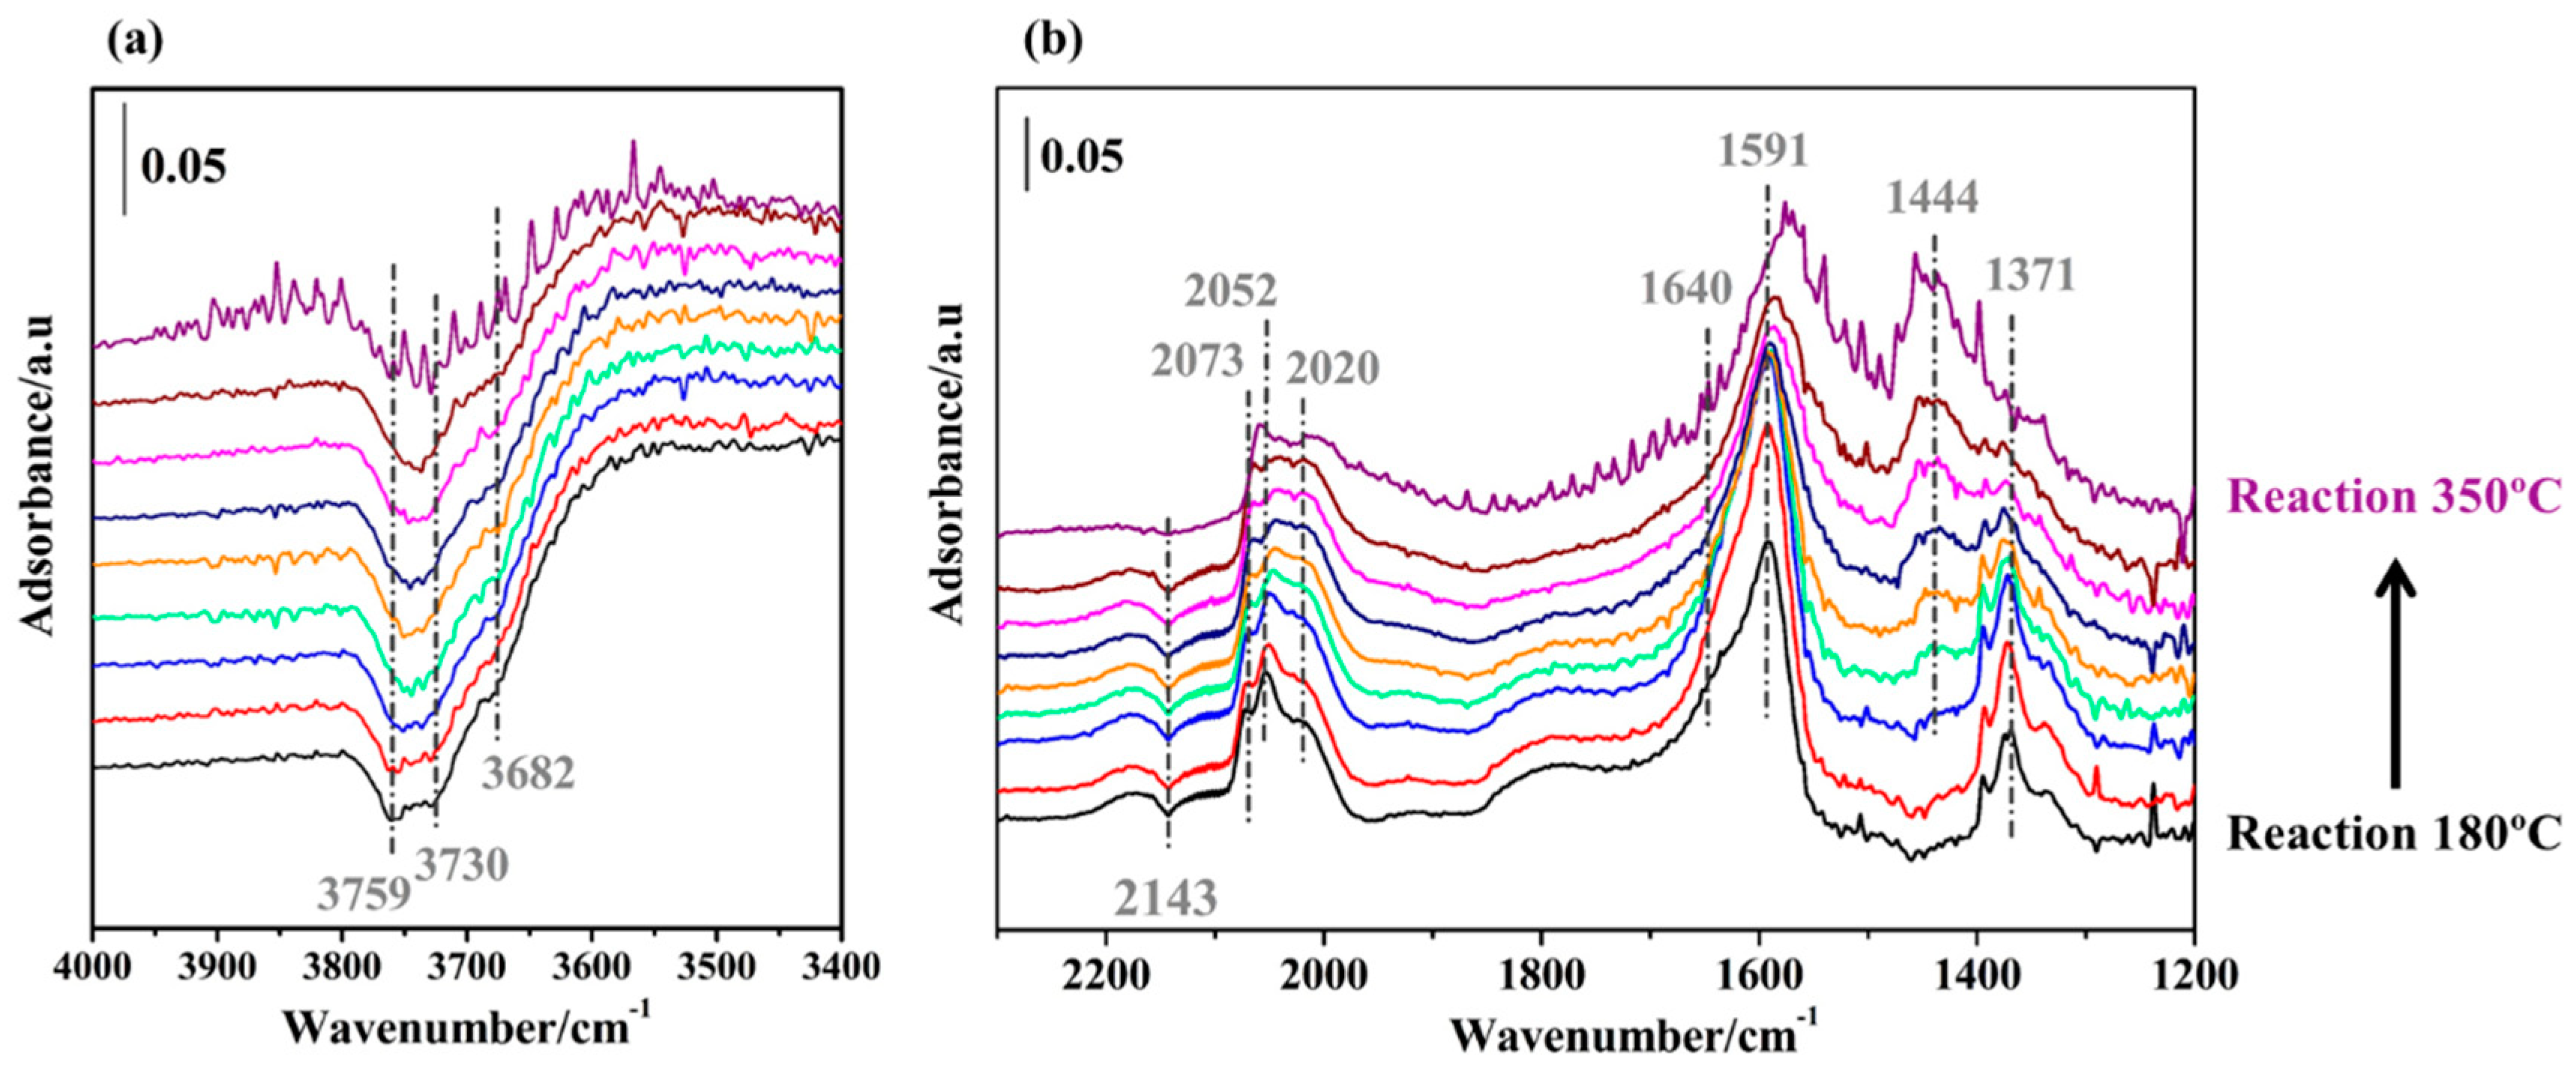
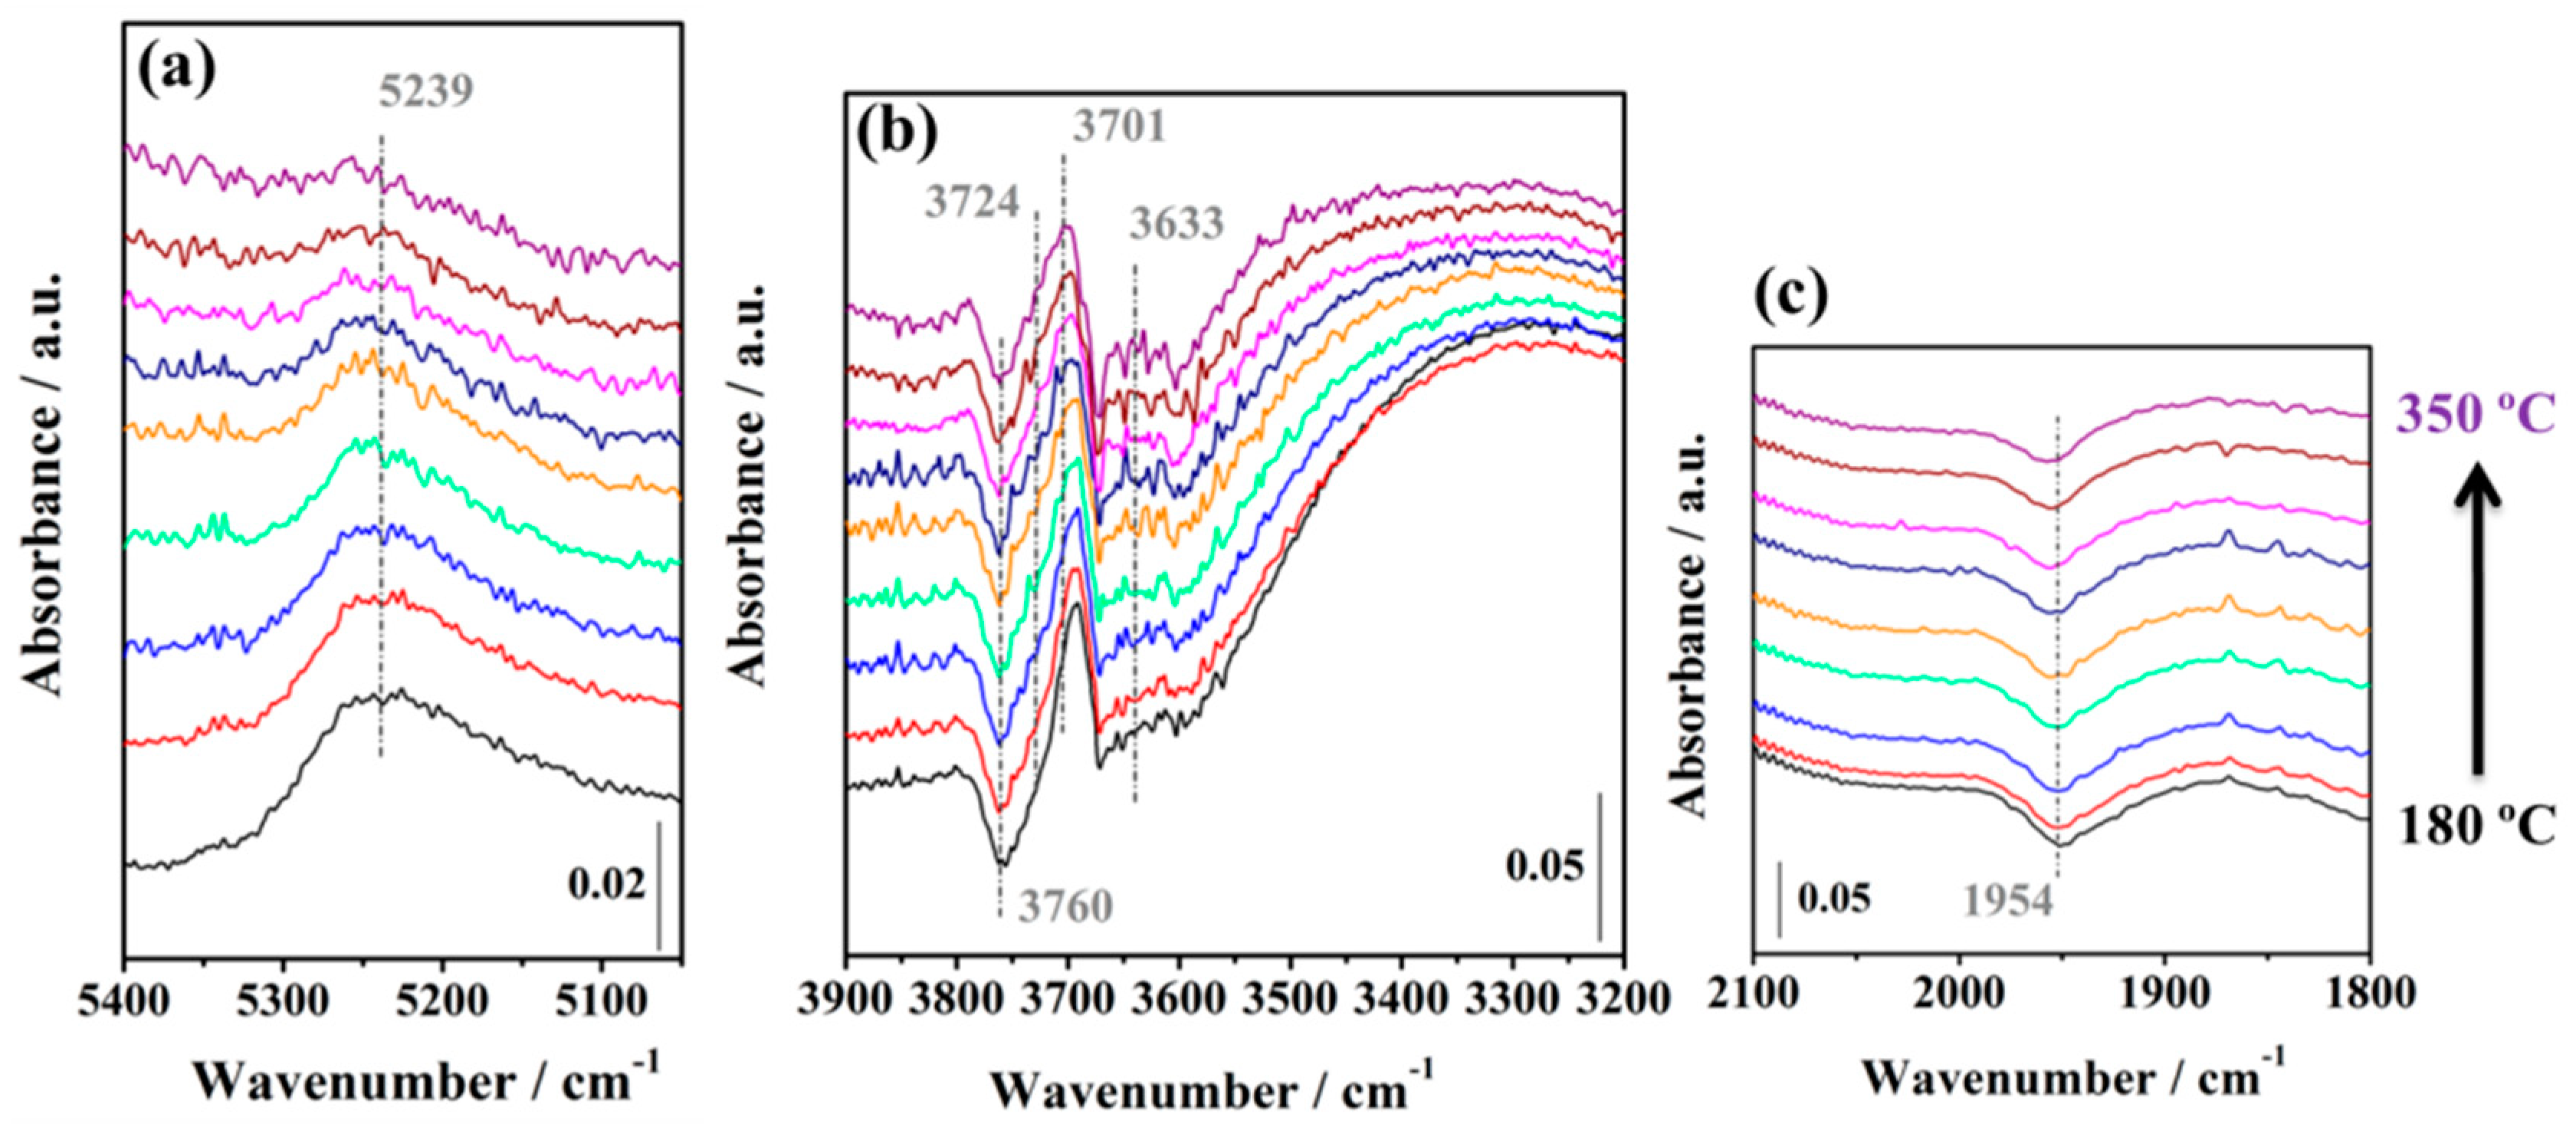
2.3.2. WGS Reaction under Model Conditions

Figure 9 shows the evolution of the spectra during WGS reaction under model conditions from 180 to 350 °C on Pt/CeAl catalyst. As can be noticed, the evolution of bands associated to OH groups are displayed in the 4000–3400 cm−1 region. In particular, negative bands are observed at 3759, 3730, and 3682 cm−1 corresponding to isolated OH groups bonded to the ceria/alumina support [48], which means that these species disappear once the reaction starts. At the same time a broad band peaking at ca. 3400 cm−1 appears. This indicates H-bonded molecular water to the initially isolated OH species. This supports the important role of the support hydroxyl groups in the reaction mechanism. On increasing the reaction temperature these negative bands become less intense and the positive broad band almost disappears. This likely means that free OH groups regenerate, which also indicates that molecular water no longer remains adsorbed on the support surface.
On the other side, the interaction of CO with Pt during the reaction as well as the formation/elimination of carbonate-carboxylate species are also considered (Figure 9). The minimum observed at 2143 cm−1 corresponds to gaseous CO present in the infrared (IR) cell volume. In addition, bands at 2073, 2052, and 2020 cm−1 are associated to the stretching vibration (υCO) of carbonyl species formed on metallic Pt. The presence of several bands indicates that CO molecules are adsorbed on Pt with different electron density which also depends on the Pt particle sizes. The chemical bond between CO and Pt involves the 5σ and 2π* orbitals of the CO molecule. When the coordination of Pt particles is low, its electron density is high, which increases the 2π*, the back-donation phenomenon that consequently debilitates the C–O bond. Hence, the associated υCO band shifts to lower frequencies [56]. Accordingly, the observed band at 2073 cm−1 corresponds to Pt particles with low electron density, which can be associated to bigger particle sizes or particles with higher coordination. In the same sense, the intense band at 2052 cm−1 is assigned to reduced Pt particles (Pt0) with a small particle size around 1.5 nm or the CO is adsorbed on terrace sites. The band at 2020 cm−1 can be related to the linear CO adsorbed on the smallest reduced Pt particles (dp < 1.5 nm) [57]. However, this band at 2020 cm−1 can also be explained by the adsorption of terminal CO on metallic Pt in contact with the Ce3+ in the metal-support interface (Pt-□s-Ce3+) [58]. Furthermore, band shifts and changes in intensities are noticeable when increasing the temperature during the WGS reaction. This may indicate a variation of the Pt electron density, a different Pt coordination, a different Pt oxidation state or a variation of Pt particle size. Actually, at 350 °C (Figure 9), a new band at 2007 cm−1 is observed. This band can be related to a shift from the band at 2020 cm−1 by a reduction of Pt particles (dp < 1.5 nm) [56] or can be attributed to adsorbed CO in presence of superficial carbon on Pt; this latter caused by CO dissociation [49].
On the other side, in the region of 1700–1300 cm−1 are shown the symmetric and asymmetric stretching modes characteristic of superficial carbonates, formates or carboxylates. The bands at 1591 and 1371 cm−1 have been attributed to monodentate carbonates [59,60], whereas the shoulder at 1640 cm−1 is associated to physisorbed water. The intensities of both bands decrease on increasing the temperature during the reaction as is expected. Nevertheless, it is observed the appearance and increase with the temperature of a band at 1444 cm−1, which can be assigned to C–H vibrational mode (υC–H) and/or C=C bond stretch (υC=C) due to the slightly amorphous adsorbed carbon as cyclic system on Pt from the CO dissociation [49]. The increase of this band during the reaction indicates an increment of generated superficial carbon amount. This phenomenon could lead to the usual deactivation observed for these Pt/CeO2-based catalysts reported elsewhere [61].
In the case of the ZrEuMo_5 ionic conductor, interesting and meaningful variations occur by water adsorption/desorption processes. As can be observed in Figure 10b, a negative band was observed at 3760 cm−1 indicating the disappearance of the monodentate OH groups when the reaction starts. However, on increasing the temperature this disappearance becomes smaller at the same time as the band at 3701 cm−1 increases. As was reported for ZrO2 [62], monodentate hydroxyls (type I) of monoclinic ZrO2 present higher basicity with respect to the multi-coordinated hydroxyls. Then, these monodentate OH groups interact weakly with water molecules since they have a lower capacity to accept electrons, which provokes a shift to lower wavenumbers. These data permit to attribute the band at 3701 cm−1 to type (I) hydroxyls weakly interacting with water molecules. However, the interaction of hydroxyls at 3671 cm−1 (tribridged, more acidic ones) with water is stronger and generates a broad band at lower wavenumbers (3350 cm−1). The new band appearing in the presence of water at 3724 cm−1 is attributed to dissociated water in the oxygen vacancies created by doping zirconia with Eu3+ as it was reported for the bare Eu-doped ZrO2 sample [23]. In the same way, Figure 11a shows the band at 5239 cm−1 associated to physisorbed water which reappears when the water is feeding but decreases on increasing the temperature. The presence of both dissociated (3724 cm−1) and physisorbed (5239 cm−1) water is mandatory for the proton conductivity by Grotthuss mechanism. This configuration was already observed by the bare Eu-doped ZrO2 mixed oxide. The novelty here is the presence of Mo, which is responsible for the appearance of the band at 3633 cm−1, which can be attributed to hydrated of Mo=O bond under wet atmosphere according to Scheme 1 [63]. In order to verify this Mo oxide hydration, the band at 1954 cm−1 corresponding to the disappearance of the Mo=O overtone by the hydration phenomenon was analyzed (Figure 10c). In addition, the band at 3633 cm−1 could be associated to υOH of hydrogen carbonates instead of hydrated Mo oxide. However, the absence of the associated band at ~1218 cm−1 (assigned to δOH vibration of hydrogen carbonates) rejects this possibility [64]. Therefore, the band at 3633 cm−1 is ascribed to hydrated Mo oxide, which increases with the temperature, supporting the increment of activity observed above for catalytic physical mixture (see Figure 4). Moreover, the Mo atoms are mainly located over Eu atoms [38], around which the oxygen vacancies are created. Consequently, a close contact between dissociated water in the oxygen vacancies and the adsorbed water on Mo oxide is expected to promote the proton conductivity.

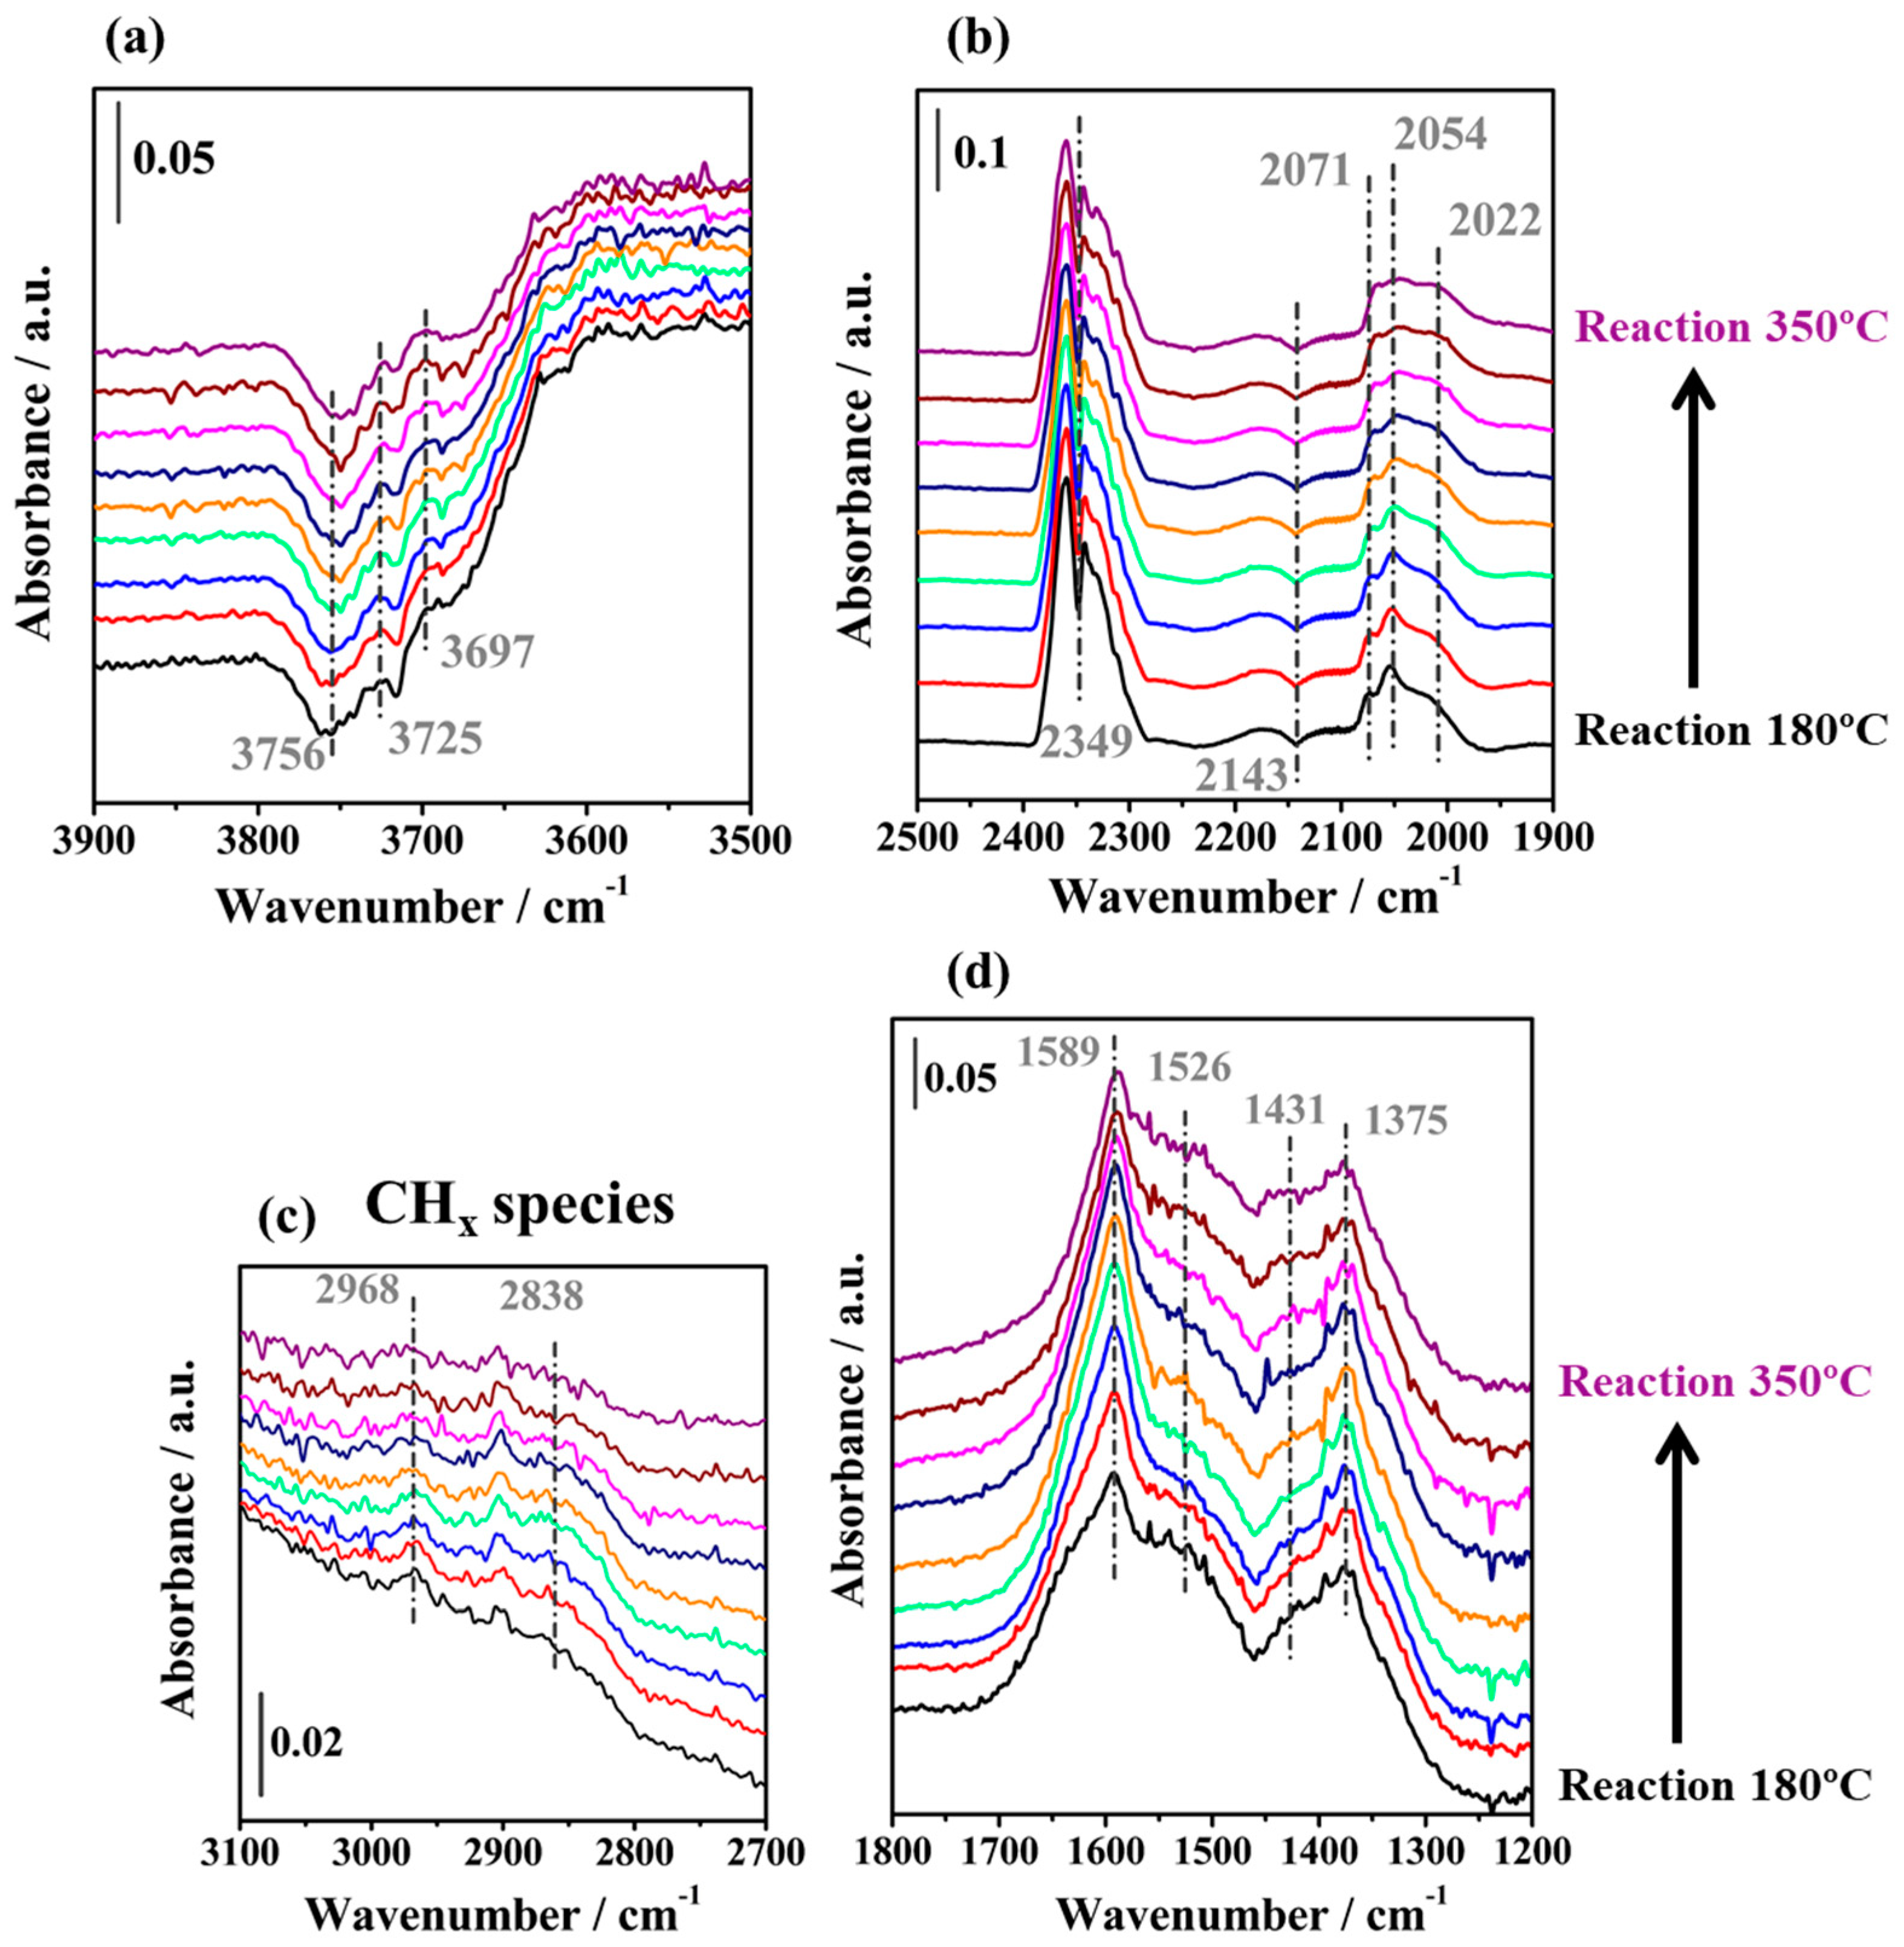
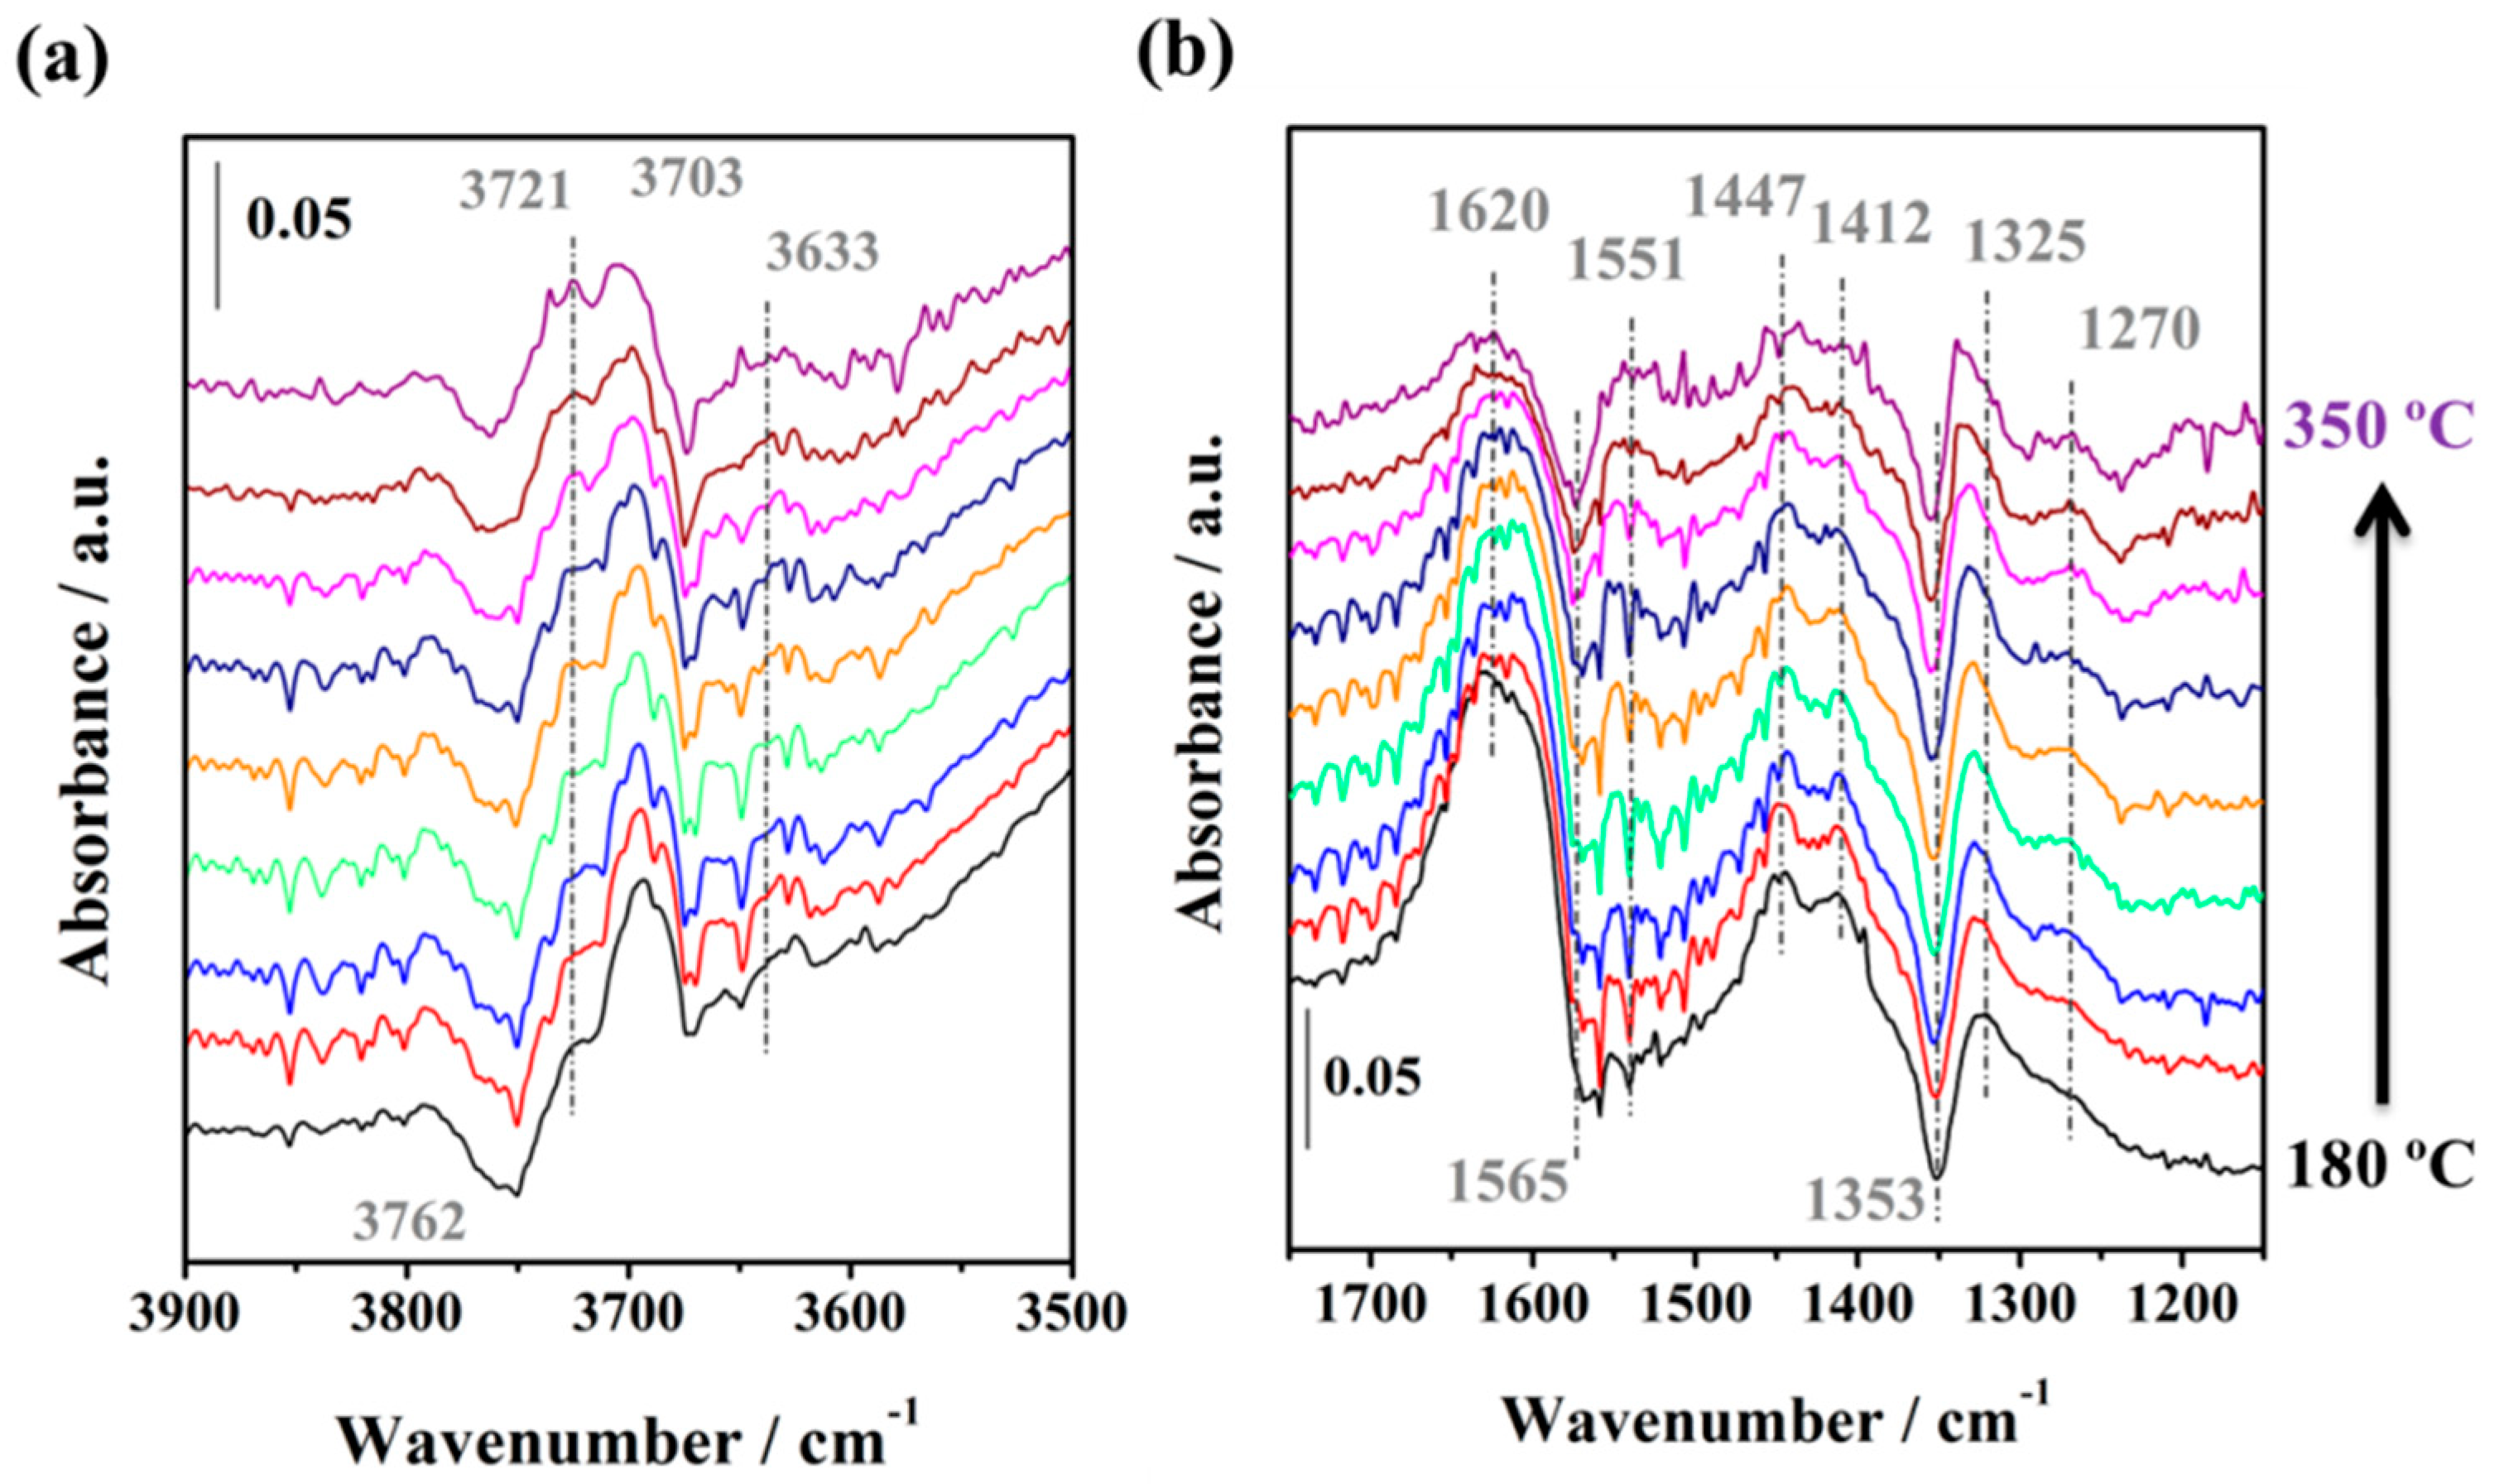
2.3.3. WGS Reaction under Industrial Conditions

Figure 11 displays the evolution of the spectra during WGS reaction under industrial conditions from 180 to 350 °C on Pt/CeAl catalyst. Analogously to model conditions, the bands associated to OH groups at 3756, 3725 and 3697 cm−1 follow the same behaviour discussed above (Figure 9a). In the same way, the bands attributed to CO adsorbed on Pt (2071, 2054, and 2022 cm−1) are again formed and their variation on increasing the temperature present similar behavior (Figure 11b). This fact indicates that Pt active sites are not strongly modified by the different feed. This supports the reported high CO coverages for Pt-based catalysts independently of the feeding conditions [58,61]. In this region is also observed bands at 2349 and 2143 cm−1 associated to gaseous CO2 and CO, respectively. Regarding the region between 3100 and 2700 cm−1 (Figure 11c), bands around 2968 and 2838 cm−1 are formed. These new bands can be assigned to υCH of partially hydrogenated carbon formed by dissociation of CO over Pt discussed above [49] in coherence with the amount of H2 introduced in this experiment. On the other hand, the region between 1800 and 1200 cm−1 corresponding to carbonate/carboxylate species show again similar bands than those found in model conditions (Figure 11d).
For ionic conductor ZrEuMo_5, the spectra observed under industrial conditions are quite similar to those obtained in model conditions. Essentially, it is remarkable the higher intensity of the band ascribed to dissociated water in the oxygen vacancies (3721 cm−1, Figure 12a) as well as the band at 1620 cm−1 (Figure 12b) assigned to physisorbed water (δHOH). The higher amount of both species could lead to higher proton conductivity even at temperatures above 300 °C. Moreover, the better capacity of dissociating and adsorbing water may be related to the presence of hydrogen in these conditions, since the interaction between Mo oxide and H2 creates reduced Mo species and/or bronze-type structures capable of accumulating water and provides ion exchange [34,36]. The observed bands between 1600 and 1200 cm−1 are the same as exhibited in model conditions (data not shown). Different (bi)carbonates species formed on zirconia support during the reaction are in good agreement with those reported in the literature [65]. The υas(CO32) of polydentate (~1551 cm−1) and bridged (1353 cm−1) carbonates increases during the reaction on increasing the temperature. Contrary, the bicarbonates seem to be reduced (~1440–1450 cm−1) indicating a loss of H species.

3. Materials and Methods

3.1. Preparation of Materials

The Pt/CeO2/Al2O3 catalyst with 2 wt.% of Pt loading was prepared by wet impregnation. Accordingly, the appropriate amount of tetrammine platinum (II) nitrate solution (Pt(NH3)4(NO3)2 purchased from Johnson Matthey) was mixed with an acetic acid solution 1 M in a Pt:acid molar ratio of 1:1.1. The obtained Pt solution was added over commercial CeO2/Al2O3 support (Puralox, ceria:alumina mass ratio of 20:80) and vigorously stirred at room temperature. Then, the solvent was evaporated at reduced pressure in a rotary evaporator and the remained solid was dried at 100 °C for 12 h. Finally, the dried solid was calcined at 350 °C for 8 h with a heating ramp of 5 °C min−1. This catalyst was labeled as Pt/CeAl.
The co-precipitation from nitrates precursors at room temperature was used for the synthesis of the ionic conductor. Particularly, molybdenum and europium doped zirconia oxide with a fix composition of 95:5 molar ratio of ZrO2:Eu2O3 and additional 5 mol.% of MoO3 was prepared (labeled as ZrEuMo_5). Thus, the appropriate amount of 0.1 M aqueous solution of europium (III) nitrate pentahydrate (Sigma-Aldrich) (Merck KGaA, Darmstadt, Germany) was slowly added to a 0.1 M aqueous solution of zirconium (IV) oxynitrate hydrate (Sigma-Aldrich) under continuous stirring. Secondly, the suitable amount of 0.1 M aqueous solution of ammonium molybdate tetrahydrate ((NH4)6Mo7O24, Alfa Aesar) (Thermo Fisher GmbH, Kandel, Germany) was also slowly added to Eu-Zr solution under continuous stirring. Afterwards, the pH was increased until 8 by adding ammonia solution (30 vol.%, Panreac) (Panreac Química SLU, Barcelona, Spain) and the solution was aged for 1.5 h at room temperature under continuous stirring. The obtained precipitate was filtered, washed with distilled water and submitted to dryness at 100 °C overnight. Finally, the solid was calcined in air at 500 °C for 5 h to remove the nitrate leftovers obtaining a pale-yellow powder.

3.2. Characterization Techniques

The structural analysis of the synthesized samples was conducted by XRD (X-ray diffraction) on an X’Pert Pro PANalytical instrument (Malvern PANalytical Ltd, Malvern, UK). X-ray diffractograms were recorded using Cu Kα radiation (40 mA, 45 kV) in the 10–90° 2θ range, using step size and step time of 0.05° and 80 s, respectively. Diffraction patterns were analyzed using X’Pert HighScore Plus software (Version 4.9, Malvern PANalytical Ltd, Malvern, UK). Textural properties of the prepared samples were determined by N2-physisorption at 77 K with a Micromeritics Tristar II instrument (Micromeritics GmbH, Munich, Germany). Previous degasification of the samples was carried out in vacuum at 250 °C for 4 h. The chemical composition of the prepared materials was determined by X-ray fluorescence spectrometry (XRF) using an AXIOS PANalytical spectrometer (Malvern PANalytical Ltd, Malvern, UK) with Rh source of radiation. Further characterization of these materials can be found in a previous work in our group [38], where more Mo-based mixed oxides compositions were synthesized and studied. The TEM micrographs were recorded on a Philips CM-200 instrument (ThermoFisher Scientific- FEI Deutschland GmbH, Frankfurt, Germany). The electron diffraction diagrams were acquired with a diffraction camera length of 440 mm. Powered samples were supported on a holey carbon-coated copper grid without using any liquid.

3.3. Catalytic Activity Tests

The WGS reaction was performed in a homemade setup using a fixed-bed quartz reactor of 9 mm i.d. An on-line ABB gas analyzer (AO2020) (ABB, Seville, Spain) equipped with an IR detector was coupled to the gas outlet. The catalytic tests were studied at atmospheric pressure in the temperature range of 180–350 °C using two different feeds labeled as model conditions (4.5% CO, 30% of H2O and N2 as balance) and industrial conditions (9% CO, 30% of H2O, 11% CO2, and 50% H2) to simulate the outgoing stream of a typical industrial reformer. Two catalytic systems were studied: Pt/CeAl catalyst physically mixed with Mo-based ionic conductor (mass ratio of catalyst:ionic conductor equal to 1:5) and Pt/CeAl alone, adding inert quartz in the same particle size to keep the same amount of Pt-based catalyst (0.1 g) and achieve the same bed volume as the promoted catalytic system with the physical mixture. Thus, weight space velocity was 80,000 mL h−1 gcat−1 and volumetric space velocity was 20,000 h−1, in both catalytic systems. The samples were sieved between 600 and 800 µm and the catalysts were previously activated in situ by passing a flow of 100 mL min−1 of 10% H2/N2 at 350 °C for 30 min with a heating rate of 10 °C min−1.

3.4. Operando DRIFTS Measurements

In order to elucidate the possible intermediates formed during the WGS reaction and to obtain some insights into the mechanism, operando DRIFTS experiments with Pt/CeAl catalyst in WGS reaction conditions were performed. Analogously, the same experiments were also carried out on ZrEuMo_5 to analyze the role of the proton conductor in the reaction mechanism, getting information about water and hydrogen adsorption phenomena.
Due to instrumental requirements, model and industrial feeding conditions described above for catalytic tests were slightly modified. A total flow rate of 50 mL min−1 with 4% CO and 10% H2O, balanced with Ar, was used as model conditions, whereas 4% CO, 5% CO2, 10% H2O, and 25% H2, balanced with Ar, were used as industrial conditions. The adequate amount of water was fed continuously by using a HPLC pump and vaporizing the liquid in a homemade evaporator. Prior to measurements in the 180–350 °C temperature range, as for the catalytic tests, an activation step in 50 mL min−1 of 10% of H2/Ar at 350 °C for 30 min was performed. Afterwards, the system was cooled until 180 °C in Ar flow to start the reaction. Spectra were collected before the activation at RT, after activation in H2/Ar at 350 °C, before reaction in Ar at 180 °C and during the WGS reaction on increasing the temperature when steady-state reaction conditions were achieved.
The experiments were carried out in a THERMO/Nicolet model iS50 spectrometer (ThermoFisher Scientific, Munich, Germany) equipped with a MCT detector and a Praying Mantis High Temperature Reaction chamber with ZnSe windows (purchased from Harrick) (Harrick Scientific Products Inc., New York, N.Y., USA). Spectra were obtained by averaging 32 scans with a resolution of 4 cm−1. Typically, 70 mg of catalyst or 250 mg of ionic conductor were placed in the Harrick reaction chamber. The spectrophotometer bench was continuously purged with pure nitrogen to eliminate CO2 and water vapor contributions to the spectra. The background spectrum was collected without sample using an aluminum mirror.

4. Conclusions

The physical mixture of an ionic conductor to a typical Pt-based catalyst for WGS has shown higher CO conversion than the bare Pt-based catalyst tested in the same conditions, using a model and an industrial feed composition at high space velocity (80,000 mL h−1·gcat−1). The XRD analysis indicated the formation of a solid solution between Eu and Zr oxides, which creates oxygen vacancies able to activate water. The addition of Mo creates MoOx clusters on the surface which provided a higher amount of hydroxyls and physisorbed water according to operando DRIFTS analysis. Accordingly, this mixed oxide can provide proton conductivity by Grotthuss mechanism in the temperature range of WGS reaction. Thus, the Mo-based ionic conductor promotes the catalysts’ activity from 250–350 °C by providing more activated water molecules to the Pt-based catalyst, which is reported as a rate-determining step in WGS reaction.

Author Contributions

Data curation, L.J. and N.G.-M.; formal analysis L.J., N.G.-M., and L.F.B.; supervision L.F.B., F.R.-S., and J.A.O.; writing–original draft, L.J. and N.G.-M.; writing—review and editing, N.G.-M., L.F.B., F.R.-S., and J.A.O. All authors have read and agreed to the published version of the manuscript.

Funding

This research received no external funding.

Acknowledgments

Financial support for this work has been obtained from the Spanish Ministerio de Ciencia, Innovación y Universidades co-financed by FEDER funds from the European Union (ENE2015-66975-C3-2-R and RTI2018-096294-B-C33).

Conflicts of Interest

The authors declare no conflicts of interest.

References

  1. Ratnasamy, C.; Wagner, J.P. Water gas shift catalysis. Catal. Rev. Sci. Eng. 2009, 51, 325–440. [Google Scholar] [CrossRef]
  2. Farrauto, R.J.; Liu, Y.; Ruettinger, W.; Ilinich, O.; Shore, L.; Giroux, T. Precious Metal catalysts supported on ceramic and metal monolithic structures for the hydrogen economy. Catal. Rev. Sci. Eng. 2007, 49, 141–196. [Google Scholar] [CrossRef]
  3. Andreeva, D.; Ivanov, I.; Ilieva, L.; Sobczak, J.W.; Avdeev, G.; Petrov, K. Gold based catalysts on ceria and ceria-alumina for WGS reaction (WGS Gold catalysts). Top. Catal. 2007, 44, 173–182. [Google Scholar] [CrossRef]
  4. Gonzalez Castaño, M.; Reina, T.R.; Ivanova, S.; Centeno, M.A.; Odriozola, J.A. Pt vs. Au in water-gas shift reaction. J. Catal. 2014, 314, 1–9. [Google Scholar] [CrossRef]
  5. Kam, R.; Scott, J.; Amal, R.; Selomulya, C. Pyrophoricity and stability of copper and platinum based water-gas shift catalysts during oxidative shut-down/start-up operation. Chem. Eng. Sci. 2010, 65, 6461–6470. [Google Scholar] [CrossRef]
  6. Luengnaruemitchai, A.; Osuwan, S.; Gulari, E. Comparative studies of low-temperature water-gas shift reaction over Pt/CeO2, Au/CeO2, and Au/Fe2O3 catalysts. Catal. Commun. 2003, 4, 215–221. [Google Scholar] [CrossRef]
  7. Panagiotopoulou, P.; Kondarides, D.I. Effect of morphological characteristics of TiO2-supported noble metal catalysts on their activity for the water-gas shift reaction. J. Catal. 2004, 225, 327–336. [Google Scholar] [CrossRef]
  8. Meunier, F.C.; Goguet, A.; Hardacre, C.; Burch, R.; Thompsett, D. Quantitative DRIFTS investigation of possible reaction mechanisms for the water-gas shift reaction on high-activity Pt- and Au-based catalysts. J. Catal. 2007, 252, 18–22. [Google Scholar] [CrossRef]
  9. Gokhale, A.A.; Dumesic, J.A.; Mavrikakis, M. On the mechanism of low-temperature water gas shift reaction on copper. J. Am. Chem. Soc. 2008, 130, 1402–1414. [Google Scholar] [CrossRef]
  10. Kalamaras, C.M.; Americanou, S.; Efstathiou, A.M. “Redox” vs “associative formate with -OH group regeneration” WGS reaction mechanism on Pt/CeO2: Effect of platinum particle size. J. Catal. 2011, 279, 287–300. [Google Scholar] [CrossRef]
  11. Saeidi, S.; Fazlollahi, F.; Najari, S.; Iranshahi, D.; Klemeš, J.J.; Baxter, L.L. Hydrogen production: Perspectives, separation with special emphasis on kinetics of WGS reaction: A state-of-the-art review. J. Ind. Eng. Chem. 2017, 49, 1–25. [Google Scholar] [CrossRef]
  12. Clay, J.P.; Greeley, J.P.; Ribeiro, F.H.; Delgass, W.N.; Schneider, W.F. DFT comparison of intrinsic WGS kinetics over Pd and Pt. J. Catal. 2014, 320, 106–117. [Google Scholar] [CrossRef] [Green Version]
  13. González-Castaño, M.; Ivanova, S.; Laguna, O.H.; Martínez, T.L.M.; Centeno, M.A.; Odriozola, J.A. Structuring Pt/CeO2/Al2O3 WGS catalyst: Introduction of buffer layer. Appl. Catal. B Environ. 2017, 200, 420–427. [Google Scholar] [CrossRef]
  14. Carter, J.H.; Hutchings, G.J. Recent advances in the gold-catalysed low-temperature water–gas shift reaction. Catalysts 2018, 8, 627. [Google Scholar] [CrossRef] [Green Version]
  15. Kugai, J.; Miller, J.T.; Guo, N.; Song, C. Role of metal components in Pd–Cu bimetallic catalysts supported on CeO2 for the oxygen-enhanced water gas shift. Appl. Catal. B Environ. 2011, 105, 306–316. [Google Scholar] [CrossRef]
  16. Panagiotopoulou, P.; Kondarides, D.I. Effect of the nature of the support on the catalytic performance of noble metal catalysts for the water-gas shift reaction. Catal. Today 2006, 112, 49–52. [Google Scholar] [CrossRef]
  17. Plata, J.J.; Graciani, J.; Evans, J.; Rodriguez, J.A.; Sanz, J.F. Cu deposited on CeOx-Modified TiO2(110): Synergistic effects at the metal-oxide interface and the mechanism of the WGS reaction. ACS Catal. 2016, 6, 4608–4615. [Google Scholar] [CrossRef]
  18. Vignatti, C.; Avila, M.S.; Apesteguía, C.R.; Garetto, T.F. Catalytic and DRIFTS study of the WGS reaction on Pt-based catalysts. Int. J. Hydrog. Energy 2010, 35, 7302–7312. [Google Scholar] [CrossRef]
  19. García-Moncada, N.; González-Castaño, M.; Ivanova, S.; Centeno, M.Á.; Romero-Sarria, F.; Odriozola, J.A. New concept for old reaction: Novel WGS catalyst design. Appl. Catal. B Environ. 2018, 238, 1–5. [Google Scholar] [CrossRef]
  20. Kreuer, K.-D. Proton conductivity: Materials and applications. Chem. Mater. 1996, 8, 610–641. [Google Scholar] [CrossRef]
  21. Kreuer, K.-D.; Rabenau, A.; Weppner, W. Vehicle mechanism, a new model for the interpretation of the conductivity of fast proton conductors. Angew. Chem. Int. Ed. Engl. 1982, 21, 208–209. [Google Scholar] [CrossRef]
  22. Malavasi, L.; Fisher, C.A.J.; Islam, M.S. Oxide-ion and proton conducting electrolyte materials for clean energy applications: Structural and mechanistic features. Chem. Soc. Rev. 2010, 39, 4370–4387. [Google Scholar] [CrossRef] [PubMed]
  23. García-Moncada, N.; Bobadilla, L.F.; Poyato, R.; López-Cartes, C.; Romero-Sarria, F.; Centeno, M.Á.; Odriozola, J.A. A direct in situ observation of water-enhanced proton conductivity of Eu-doped ZrO2: Effect on WGS reaction. Appl. Catal. B Environ. 2018, 231, 343–356. [Google Scholar] [CrossRef]
  24. Morozov, V.; Arakcheeva, A.; Redkin, B.; Sinitsyn, V.; Khasanov, S.; Kudrenko, E.; Raskina, M.; Lebedev, O.; Van Tendeloo, G. Na2/7Gd4/7MoO4: A modulated scheelite-type structure and conductivity properties. Inorg. Chem. 2012, 51, 5313–5324. [Google Scholar] [CrossRef]
  25. El Khal, H.; Cordier, A.; Batis, N.; Siebert, E.; Georges, S.; Steil, M.C. Effect of porosity on the electrical conductivity of LAMOX materials. Solid State Ion. 2017, 304, 75–84. [Google Scholar] [CrossRef]
  26. Muñoz-García, A.B.; Pavone, M.; Ritzmann, A.M.; Carter, E.A. Oxide ion transport in Sr2Fe1.5Mo0.5O(6-δ), a mixed ion-electron conductor: New insights from first principles modeling. Phys. Chem. Chem. Phys. 2013, 15, 6250–6259. [Google Scholar] [CrossRef]
  27. Aguadero, A.; Perez-Coll, D.; Alonso, J.A.; Skinner, S.J.; Kilner, J.A. A new family of Mo-doped SrCoO3-delta perovskites for application in reversible solid state electrochemical cells. Chem. Mater. 2012, 24, 2655–2663. [Google Scholar] [CrossRef]
  28. Vega-Castillo, J.E.; Ravella, U.K.; Corbel, G.; Lacorre, P.; Caneiro, A. Thermodynamic stability, structural and electrical characterization of mixed ionic and electronic conductor La2Mo2O8.96. Dalton Trans. 2012, 41, 7266–7271. [Google Scholar] [CrossRef]
  29. Amsif, M.; Magrasó, A.; Marrero-López, D.; Ruiz-Morales, J.C.; Canales-Vázquez, J.; Núñez, P. Mo-substituted lanthanum tungstate La28-yW4+yO54+delta: A competitive mixed electron-proton conductor for gas separation membrane applications. Chem. Mater. 2012, 24, 3868–3877. [Google Scholar] [CrossRef]
  30. Chippindale, A.M.; Cheetham, A.K. Chapter 3. The oxide chemistry of molybdenum. In Molybdenum: An Outline of its Chemistry and Uses; Braithwaite, E.R., Haber, J., Eds.; Elsevier Science B.V: Amsterdam, The Netherlands, 1994; pp. 146–184. [Google Scholar]
  31. Pan, Q.; Huang, L.; Li, Z.; Han, J.; Zhao, N.; Xie, Y.; Li, X.; Liu, M.; Wang, X.; Liu, J.M. A first-principles study on the hydrogenation of acetone on HxMoO3 surface. Int. J. Hydrog. Energy 2019, 44, 10443–10452. [Google Scholar] [CrossRef]
  32. Fei, S.; Xia, K.; Tian, X.; Mei, P.; Yan, H.; Cheng, H. Fabrication of ordered mesoporous MoO3 for olefin catalytic hydrogenation. Int. J. Hydrog. Energy 2016, 41, 5652–5660. [Google Scholar] [CrossRef]
  33. Schöllhorn, R.; Kuhlmann, R.; Besenhard, J.O. Topotactic redox reactions and ion exchange of layered MoO3 bronzes. Mater. Res. Bull. 1976, 11, 83–90. [Google Scholar] [CrossRef]
  34. Adams, S. CDW superstructures in hydrogen molybdenum bronzes HxMoO3. J. Solid State Chem. 2000, 149, 75–87. [Google Scholar] [CrossRef]
  35. Bollapragada, P.K.S. Chemical Transformations Using Tungsten and Molybdenum Hydrogen Bronzes. Master’s Thesis, Oklahoma State University, Stillwater, OK, USA, 2003. [Google Scholar]
  36. Seguin, L.; Figlarz, M.; Cavagnat, R.; Lassègues, J.-C. Infrared and Raman spectra of MoO3 molybdenum trioxides and MoO3·xH2O molybdenum trioxide hydrates. Spectrochim. Acta Part A 1995, 51, 1323–1344. [Google Scholar] [CrossRef]
  37. Pajonk, G.M.; Teichner, S.J.; Germain, J.E. (Eds.) Spillover of Adsorbed Species; Elsevier Science Publishers B.V: Amsterdam, The Netherlands, 1983; Volume 17, ISBN 9780444422248. [Google Scholar]
  38. García-Moncada, N.; Jurado, L.; Martínez-Tejada, L.M.; Romero-sarria, F.; Odriozola, J.A. Boosting water activation determining-step in WGS reaction on structured catalyst by Mo-doping. Catal. Today 2020. [Google Scholar] [CrossRef]
  39. Brunauer, S.; Emmett, P.H.; Teller, E. Adsorption of Gases in multimolecular layers. J. Am. Chem. Soc. 1938, 60, 309–319. [Google Scholar] [CrossRef]
  40. Thommes, M.; Kaneko, K.; Neimark, A.V.; Olivier, J.P.; Rodriguez-Reinoso, F.; Rouquerol, J.; Sing, K.S.W. Physisorption of gases, with special reference to the evaluation of surface area and pore size distribution (IUPAC Technical Report). Pure Appl. Chem. 2015, 87, 1051–1069. [Google Scholar] [CrossRef] [Green Version]
  41. Sing, K.S.W.; Williams, R.T. Physisorption hysteresis loops and the characterization of nanoporous materials. Adsorpt. Sci. Technol. 2004, 22, 773–782. [Google Scholar] [CrossRef]
  42. Doped Aluminas, Silica-Aluminas, Mixed Metal Oxides, Hydrotalcites; Sasol Performance Chemicals. Available online: https://docplayer.net/64892116-Doped-aluminas-silica-aluminas-mixed-metal-oxides-hydrotalcites.html (accessed on 20 June 2020).
  43. Phatak, A.A.; Koryabkina, N.; Rai, S.; Ratts, J.L.; Ruettinger, W.; Farrauto, R.J.; Blau, G.E.; Delgass, W.N.; Ribeiro, F.H. Kinetics of the water-gas shift reaction on Pt catalysts supported on alumina and ceria. Catal. Today 2007, 123, 224–234. [Google Scholar] [CrossRef]
  44. Phatak, A.A.; Delgass, W.N.; Ribeiro, F.H.; Schneider, W.F. Density functional theory comparison of water dissociation steps on Cu, Au, Ni, Pd, and Pt. J. Phys. Chem. C 2009, 113, 7269–7276. [Google Scholar] [CrossRef]
  45. Wang, Y.-G.; Mei, D.; Li, J.; Rousseau, R. DFT+U study on the localized electronic states and their potential role during H2O dissociation and CO oxidation processes on CeO2 (111) surface. J. Phys. Chem. C 2013, 117, 23082–23089. [Google Scholar] [CrossRef]
  46. Guild, C.J.; Vovchok, D.; Kriz, D.A.; Bruix, A.; Hammer, B.; Llorca, J.; Xu, W.; El-Sawy, A.; Biswas, S.; Rodriguez, J.A.; et al. Water-Gas-Shift over metal-free nanocrystalline ceria: An experimental and theoretical study. ChemCatChem 2017, 9, 1373–1377. [Google Scholar] [CrossRef]
  47. Li, P.; Chen, X.; Li, Y.; Schwank, J.W. A review on oxygen storage capacity of CeO 2 -based materials: Influence factors, measurement techniques, and applications in reactions related to catalytic automotive emissions control. Catal. Today 2019, 327, 90–115. [Google Scholar] [CrossRef]
  48. Andonova, S.; Ok, Z.A.; Ozensoy, E.; Hadjiivanov, K. Effects induced by interaction of the Pt/CeO x /ZrO x /γ-Al 2 O 3 ternary mixed oxide DeNO x catalyst with hydrogen. Catal. Today 2019. [Google Scholar] [CrossRef]
  49. Romero-Sarria, F.; Garcia-Dali, S.; Palma, S.; Jimenez-Barrera, E.M.; Oliviero, L.; Bazin, P.; Odriozola, J.A. The role of carbon overlayers on Pt-based catalysts for H2-cleanup by CO-PROX. Surf. Sci. 2016, 648, 84–91. [Google Scholar] [CrossRef]
  50. Tabakova, T.; Boccuzzi, F.; Manzoli, M.; Andreeva, D. FTIR study of low-temperature water-gas shift reaction on gold/ceria catalyst. Appl. Catal. A Gen. 2003, 252, 385–397. [Google Scholar] [CrossRef]
  51. Köck, E.-M.; Kogler, M.; Klötzer, B.; Noisternig, M.F.; Penner, S. Structural and electrochemical properties of physisorbed and chemisorbed water layers on the ceramic oxides Y2O3, YSZ, and ZrO2. ACS Appl. Mater. Interfaces 2016, 8, 16428–16443. [Google Scholar] [CrossRef]
  52. Heracleous, E.; Lemonidou, A.A.; Lercher, J.A. Mechanistic features of the ethane oxidative dehydrogenation by in situ FTIR spectroscopy over a MoO3/Al2O3 catalyst. Appl. Catal. A Gen. 2004, 264, 73–80. [Google Scholar] [CrossRef]
  53. Daturi, M.; Binet, C.; Bernal, S.; Pérez Omil, J.A.; Lavalley, J.C. FTIR study of defects produced in ZrO2 samples by thermal treatment. Residual species into cavities and surface defects. J. Chem. Soc. Faraday Trans. 1998, 94, 1143–1147. [Google Scholar] [CrossRef]
  54. Binnemans, K. Interpretation of europium(III) spectra. Coord. Chem. Rev. 2015, 295, 1–45. [Google Scholar] [CrossRef] [Green Version]
  55. Fitzgerald, S.A.; Schloss, J.M.; Pierce, C.J.; Thompson, B.; Rowsell, J.L.C.; Yu, K.; Schmidt, J.R. Insights into the anomalous vibrational frequency shifts of CO2 adsorbed to metal sites in microporous frameworks. J. Phys. Chem. C 2015, 119, 5293–5300. [Google Scholar] [CrossRef]
  56. Bazin, P.; Saur, O.; Lavalley, J.C.; Daturi, M.; Blanchard, G. FT-IR study of CO adsorption on Pt/CeO2: Characterisation and structural rearrangement of small Pt particles. Phys. Chem. Chem. Phys. 2005, 7, 187–194. [Google Scholar] [CrossRef]
  57. Kalamaras, C.M.; Gonzalez, I.D.; Navarro, R.M.; Fierro, J.L.G.; Efstathiou, A.M. Effects of reaction temperature and support composition on the mechanism of water–gas shift reaction over supported-Pt catalysts. J. Phys. Chem. C 2011, 115, 11595–11610. [Google Scholar] [CrossRef]
  58. Kalamaras, C.M.; Dionysiou, D.D.; Efstathiou, A.M. Mechanistic studies of the water–gas shift reaction over Pt/CexZr1–xO2 catalysts: The effect of Pt particle size and Zr dopant. ACS Catal. 2012, 2, 2729–2742. [Google Scholar] [CrossRef]
  59. Goguet, A.; Meunier, F.C.; Tibiletti, D.; Breen, J.P.; Burch, R. Spectrokinetic investigation of reverse water-gas-shift reaction intermediates over a Pt/CeO2 catalyst. J. Phys. Chem. B 2004, 108, 20240–20246. [Google Scholar] [CrossRef] [Green Version]
  60. Schreiter, N.; Kirchner, J.; Kureti, S. A DRIFTS and TPD study on the methanation of CO2 on Ni/Al2O3 catalyst. Catal. Commun. 2020, 140, 105988. [Google Scholar] [CrossRef]
  61. García-Moncada, N.; Groppi, G.; Beretta, A.; Romero-Sarria, F.; Odriozola, J.A. Metal micro-monoliths for the kinetic study and the intensification of the water gas shift reaction. Catalysts 2018, 8, 594. [Google Scholar] [CrossRef] [Green Version]
  62. Cerrato, G.; Bordiga, S.; Barbera, S.; Morterra, C. Surface characterization of monoclinic ZrO2. I Morphology, FTIR spectral features, and computer modelling. Appl. Surf. Sci. 1997, 115, 53–65. [Google Scholar] [CrossRef]
  63. Du, X.; Dong, L.; Li, C.; Liang, Y.; Chen, Y. Diffuse reflectance infrared fourier transform and raman spectroscopic studies of MoO dispersed on CeO support. Langmuir 1999, 15, 1693–1697. [Google Scholar] [CrossRef]
  64. Binet, C.; Daturi, M.; Lavalley, J.-C. {IR} study of polycrystalline ceria properties in oxidised and reduced states. Catal. Today 1999, 50, 207–225. [Google Scholar] [CrossRef]
  65. Köck, E.-M.; Kogler, M.; Bielz, T.; Klötzer, B.; Penner, S. In situ FT-IR spectroscopic study of CO2 and CO adsorption on Y2O3, ZrO2, and Yttria-Stabilized ZrO2. J. Phys. Chem. C 2013, 117, 17666–17673. [Google Scholar] [CrossRef] [PubMed]
Figure 1. Diffractograms of (a) Pt/CeAl catalyst and (b) ZrEuMo_5 sample. Eu-doped ZrO2 solid solution pattern (EuyZr1−yO2−0.5y) is included for comparison.
Catalysts 10 00841 g001
Figure 2. Adsorption-desorption N2 isotherm of (a) Pt/CeAl catalyst and (b) ZrEuMo_5 sample.
Catalysts 10 00841 g002
Figure 3. TEM micrograph and electron diffraction of (a) Pt/CeAl catalyst and (b) ZrEuMo_5 sample. Pore size distribution was added for ZrEuMo_5 sample.
Catalysts 10 00841 g003
Figure 4. Catalytic activity in terms of CO conversion against temperature for water gas shift (WGS) reaction over Pt/CeAl catalyst and Pt/CeAl + ZrEuMo_5 promoted system at 80 L h−1 gcat−1 and 20,000 h−1 under (a) model conditions feed (4.5% CO, 30% H2O, balanced with N2) and (b) industrial conditions feed (9% CO, 11% CO2, 30% H2O, 50% H2).
Catalysts 10 00841 g004
Figure 5. (a) DRIFT spectra of Pt/CeAl catalyst: initial at RT (pink line), activated after 30 min in H2 atmosphere (orange line), and after activation at 180 °C in Ar before reaction conditions (green line); (b) difference spectra of activated sample at 350 °C in H2 (orange line) and at 180 °C in Ar before reaction (green line) with respect to the initial spectrum.
Catalysts 10 00841 g005
Figure 6. (a) Direct spectra of ZrEuMo_5 sample: initial at RT (pink line), activated after 30 min in H2 atmosphere (orange line), and after activation at 180 °C in Ar before reaction conditions (green line); (b) difference spectra of activated sample at 350 °C in H2 (orange line) and at 180 °C in Ar before reaction (green line) with respect to the initial spectrum.
Catalysts 10 00841 g006
Figure 7. Difference spectra of activated ZrEuMo_5 sample at 350 °C in H2 (green line) and at 180 °C in Ar before WGS reaction (orange line) in the (a) OH and (b) hydrated Mo oxide ranges.
Catalysts 10 00841 g007
Scheme 1. Hydration/dehydration process by activation in H2 at 350 °C on MoOx phase.
Catalysts 10 00841 sch001
Figure 8. Difference spectra of activated ZrEuMo_5 sample at 350 °C in H2 (green line) and at 180 °C in Ar before WGS reaction (orange line).
Catalysts 10 00841 g008
Figure 9. Evolution of difference spectra during WGS reaction under model conditions from 180 to 350 °C on Pt/CeAl in the (a) OH and (b) carbonates, formates and/or carboxylates ranges. The spectrum recorded at 180 °C after activation was used as reference.
Catalysts 10 00841 g009
Figure 10. Evolution of difference spectra during WGS reaction under model conditions from 180 to 350 °C on ZrEuMo_5 sample in the (a) physisorbed H2O, (b) OH and (c) Mo=O overtone ranges. The spectrum recorded at 180 °C after activation was used as reference.
Catalysts 10 00841 g010
Figure 11. Evolution of difference spectra during WGS reaction under industrial conditions from 180 to 350 °C on Pt/CeAl catalyst in the (a) OH, (b) absorbed CO, (c) CHx and (d) carbonates, formats and/or carboxylates ranges. The spectrum recorded at 180 °C after activation was used as reference.
Catalysts 10 00841 g011
Figure 12. Difference spectra during WGS reaction in industrial conditions on ZrEuMo_5 sample from 180 to 350 °C with respect to the activated spectrum at 180 °C in Ar in the (a) OH and (b) carbonates. formats and/or carboxylates ranges.
Catalysts 10 00841 g012
Table 1. Textural properties and chemical composition of the synthesized samples.
SampleSBET (m2 g−1)Vp (cm3 g−1)Dp (nm)Chemical Composition a (wt.%)
Pt/CeAl1100.268.841.8% Pt (2%)
18.8% CeO2 (19.6%)
79.4% Al2O3 (78.4%)
ZrEuMo_5740.062.458.4% Zr (60.9%)
11.9% Eu (10.7%)
4.5% Mo (3.6%)
25.2% O (26.8%)
a Nominal value between parentheses.

