Article

VOC Removal from Manure Gaseous Emissions with UV Photolysis and UV-TiO2 Photocatalysis

1
Department of Agricultural and Biosystems Engineering, Iowa State University, Ames, IA 50011, USA
2
Interdepartmental Toxicology Program, Iowa State University, Ames, IA 50011, USA
3
Institute of Soil, Water and Environmental Sciences, Newe Ya’ar Research Center, Agricultural Research Organization, Ramat Yishay 30095, Israel
4
Department of Civil, Construction and Environmental Engineering, Iowa State University, Ames, IA 50011, USA
5
Department of Food Science and Human Nutrition, Iowa State University, Ames, IA 50011, USA
6
Department of Chemistry, Iowa State University, Ames, IA 50011, USA
7
Department of Veterinary Diagnostic and Prod, Animal Medicine, Iowa State University, Ames, IA 50010, USA
8
Department of Environmental Science and Engineering, Fudan University, Shanghai 200438, China
9
Institute of Plant Sciences, Newe Ya’ar Research Center, Agricultural Research Organization, Ramat Yishay 30095, Israel
10
Faculty of Civil and Environmental Engineering, Technion, Haifa 32000, Israel
*
Author to whom correspondence should be addressed.
Catalysts 2020, 10(6), 607; https://doi.org/10.3390/catal10060607
Submission received: 1 May 2020 / Revised: 26 May 2020 / Accepted: 27 May 2020 / Published: 1 June 2020
(This article belongs to the Special Issue Catalysis for the Removal of Gas-Phase Pollutants)

Abstract

:
Control of gaseous emissions from livestock operations is needed to ensure compliance with environmental regulations and sustainability of the industry. The focus of this research was to mitigate livestock odor emissions with UV light. Effects of the UV dose, wavelength, TiO2 catalyst, air temperature, and relative humidity were tested at lab scale on a synthetic mixture of nine odorous volatile organic compounds (VOCs) and real poultry manure offgas. Results show that it was feasible to control odorous VOCs with both photolysis and photocatalysis (synthetic VOCs mixture) and with photocatalysis (manure offgas). The treatment effectiveness R (defined as % conversion), was proportional to the light intensity for synthetic VOCs mixtures and followed an order of UV185+254 + TiO2 > UV254 + TiO2 > UV185+254; no catalyst > UV254; no catalyst. VOC conversion R > 80% was achieved when light energy was >~60 J L−1. The use of deep UV (UV185+254) improved the R, particularly when photolysis was the primary treatment. Odor removal up to ~80% was also observed for a synthetic VOCs mixture, and actual poultry manure offgas. Scale-up studies are warranted.

1. Introduction

Public awareness of nuisance odor emissions from livestock facilities is growing. Confined animal feeding operations (CAFOs) are sources of aerial emissions of odorous volatile organic compounds (VOCs), ammonia (NH3), hydrogen sulfide (H2S), greenhouse gases (GHGs, e.g., CO2, CH4, N2O), and particulate matter (PM) including bioaerosols. The VOCs emitted by CAFOs have been characterized extensively. The 2007–2009 National Air Emissions Monitoring Study (NAEMS) was completed in the U.S. and resulted in several publications specifically focused on quantitative odor and VOC emissions from swine barns and dairy operations [1,2,3,4]. Multiple studies presented volatiles speciation and characterized key odorants in emissions from poultry and swine [5,6] and for VOC emissions from beef and dairy cattle [7,8,9,10].
Livestock odor is a global issue and is of interest to the international community of researchers. McGinn et al. [11] reported on NH3, volatile fatty acids (VFAs), and other odorants near beef feedlots in Canada. Emissions of VOCs from swine and dairy barns in Denmark and Germany were published by Feilberg et al. [12] and Ngwabie et al. [13]. A close relationship is now well established between VOCs and livestock odor [6,7,14,15,16,17,18]. Research studies on the relationship between VOCs and odor track back to the 1970s, when 10 compounds indicated as “interesting for the manure odor” were identified: indole, skatole, phenol, p-cresol, and carboxylic acids containing two to five carbons [19]. Indoles, VFAs, and methanethiols were determined as key compounds of pig odor [20].
Odor mitigation research: Researchers have been working on cost-effective and practical solutions to livestock odor emissions. Odor, VOCs, GHGs, NH3 and H2S mitigation technologies for livestock operations have been reviewed [21]. The main approaches for livestock housing include barriers, biofiltration, chimneys, diet modification, electrostatic precipitation, landscaping, oil sprinkling, manure pit additives and ventilation, scrubbers, siting, and setbacks, urine/feces separation, and UV light [22,23,24,25,26,27,28,29,30]. To date, however, these technologies, save for biofilters and scrubbers, have a limited on-farm implementation and performance record in the U.S. due to complex regulatory and socioeconomic factors. Nevertheless, comprehensive solutions to livestock odor that have potential for field adaptation will be needed in the foreseeable future as the global demand for animal-based protein increases in parallel to increasingly stringent air pollution and odor regulations worldwide.
UV and livestock farming: The treatment of air with UV has many potential benefits for livestock housing. Incoming air could be treated to inactivate airborne pathogens. Air quality inside the barn might be improved, and the pathogen load reduced. Perhaps more obviously, gaseous emissions could also be treated with an “end-of-the-pipe”-type system. A potential advantage of UV is that it could easily be synchronized with atmospheric conditions and environmental management at the farm. Another advantage is the minimal impact on ventilation, a key environmental parameter for animal well-being.
Photocatalysis: There is a growing interest in using photocatalysis for the treatment of odor and gases from livestock operations [31,32]. Studies have been carried out on odorous VOCs [33,34,35]; NH3 and GHGs [36,37,38,39,40]. To date, most studies focused on lab-scale treatments except those of Guarino et al. [36] and Costa et al. [37], carried out at a swine barn. This idea is based on the use of UV light to mineralize odorants to odorless or less odor-offensive compounds, ultimately converting them into CO2, H2O, and other inorganic compounds with or without a photolysis catalyst present. Interestingly, photolysis alone has been recognized as a potentially effective treatment for inactivation of livestock pathogens for addressing biosecurity issues, although it is well understood that pathogen inactivation does not require the complete chemical degradation or the organisms. Inactivation of aerosolized porcine respiratory and reproductive syndrome virus (PRRSV) and bovine viral diarrhea virus (BVDV) with UV254 was described by a two-stage inactivation model by Cutler et al. [41].
In this paper, we focus on chemical rather than biological pollutant mitigation. It should be understood that the photocatalytic degradation of gaseous pollutants is an example of heterogeneous catalysis. From a practical standpoint, the overall process for the classical heterogeneous catalysis can be visualized in five steps as described by Herrmann [42] (with graphical representation and generic reactions):
(1)
Transfer of the reactants to the surface;
(2)
Adsorption of at least one of the reactants to the catalytic site;
(3)
Reaction or reactions in the adsorbed phase;
(4)
Desorption of the product(s) from the active site(s);
(5)
Removal of the products from the interface.
Photocatalysis requires activation of the catalyst by photon absorption, which can generally be considered as occurring under the scope of Step 3, i.e., the reactions happening while the pollutants are adsorbed. It is clear that the rate of photocatalytic degradation can be increased through better adsorption or through changes that make those adsorbed reactions faster and/or more photochemically efficient.
Herrmann [42] provided a review of these concepts as they are applicable to photocatalysis, a full summary of which is beyond the scope of this paper. However, key results are that the rate of photocatalytic degradation of gas phase materials can be increased through increasing adsorption or by increasing the rate of reactions on the surface. Rational approaches to increase adsorption include increasing the surface area of the catalyst itself or making a composite material with another adsorbent such as activated carbon [43]. The rate or efficiency of the chemical processes can be affected by using a modified catalyst (e.g., doping with nitrogen) [42], but this is beyond the scope of our work, in which we rely on an inexpensive commodity (TiO2). Other approaches have been studied, which include the addition of electron acceptors, such as oxygen, ozone, and hydrogen peroxide (these work primarily by providing a very rapid reaction that reduces photon wastage [42]). Again, while useful under certain circumstances, for the practical, low-cost applications being studied here, the ambient conditions must be relied on. The parameters that are practical for examination here relate to light intensity, light wavelength, ambient temperature, and the effect of humidity.
Objectives In this paper, we report on a study evaluating the feasibility of direct UV photolysis and UV/TiO2 photocatalysis to treat synthetic air mixtures of key VOCs associated with livestock odor. As variables, we considered the effects of (i) UV light energy dose and wavelength, (ii) the presence of catalysts (TiO2), (iii) relative humidity, and air temperature. Additionally, we demonstrated the feasibility of UV/TiO2 photocatalysis to treat VOCs and odor of real poultry manure atmosphere. Specially designed flow-through photoreactors were built at Iowa State University (USA), for treating synthetic VOCs gas mixtures in a flowrate scale of hundreds of mL min−1 and at the Agricultural Research Organization, Israel for real poultry manure atmosphere testing in a flowrate scale of tens of L min−1. Experimental designs covered all features needed to simulate barn exhaust conditions, e.g., flowing air, short treatment times, and the presence of other gaseous compounds and moisture.
Our working hypothesis is that advanced oxidation processes (UV/TiO2 catalytic oxidation) can eventually be applied to treat odorants emitted from confined animal feeding operations (CAFOs). We suggest criteria indicating the feasibility of such treatment approaches: (1) Malodors of relevant VOCs, NH3 and H2S mixtures can be substantially reduced and that the reduction is statistically significant; (2) The required time scale of treatment is short enough to warrant the design of full-scale treatment systems.

2. Results and Discussion

2.1. UV Treatment of Odorous VOCs in Synthetic Mixture

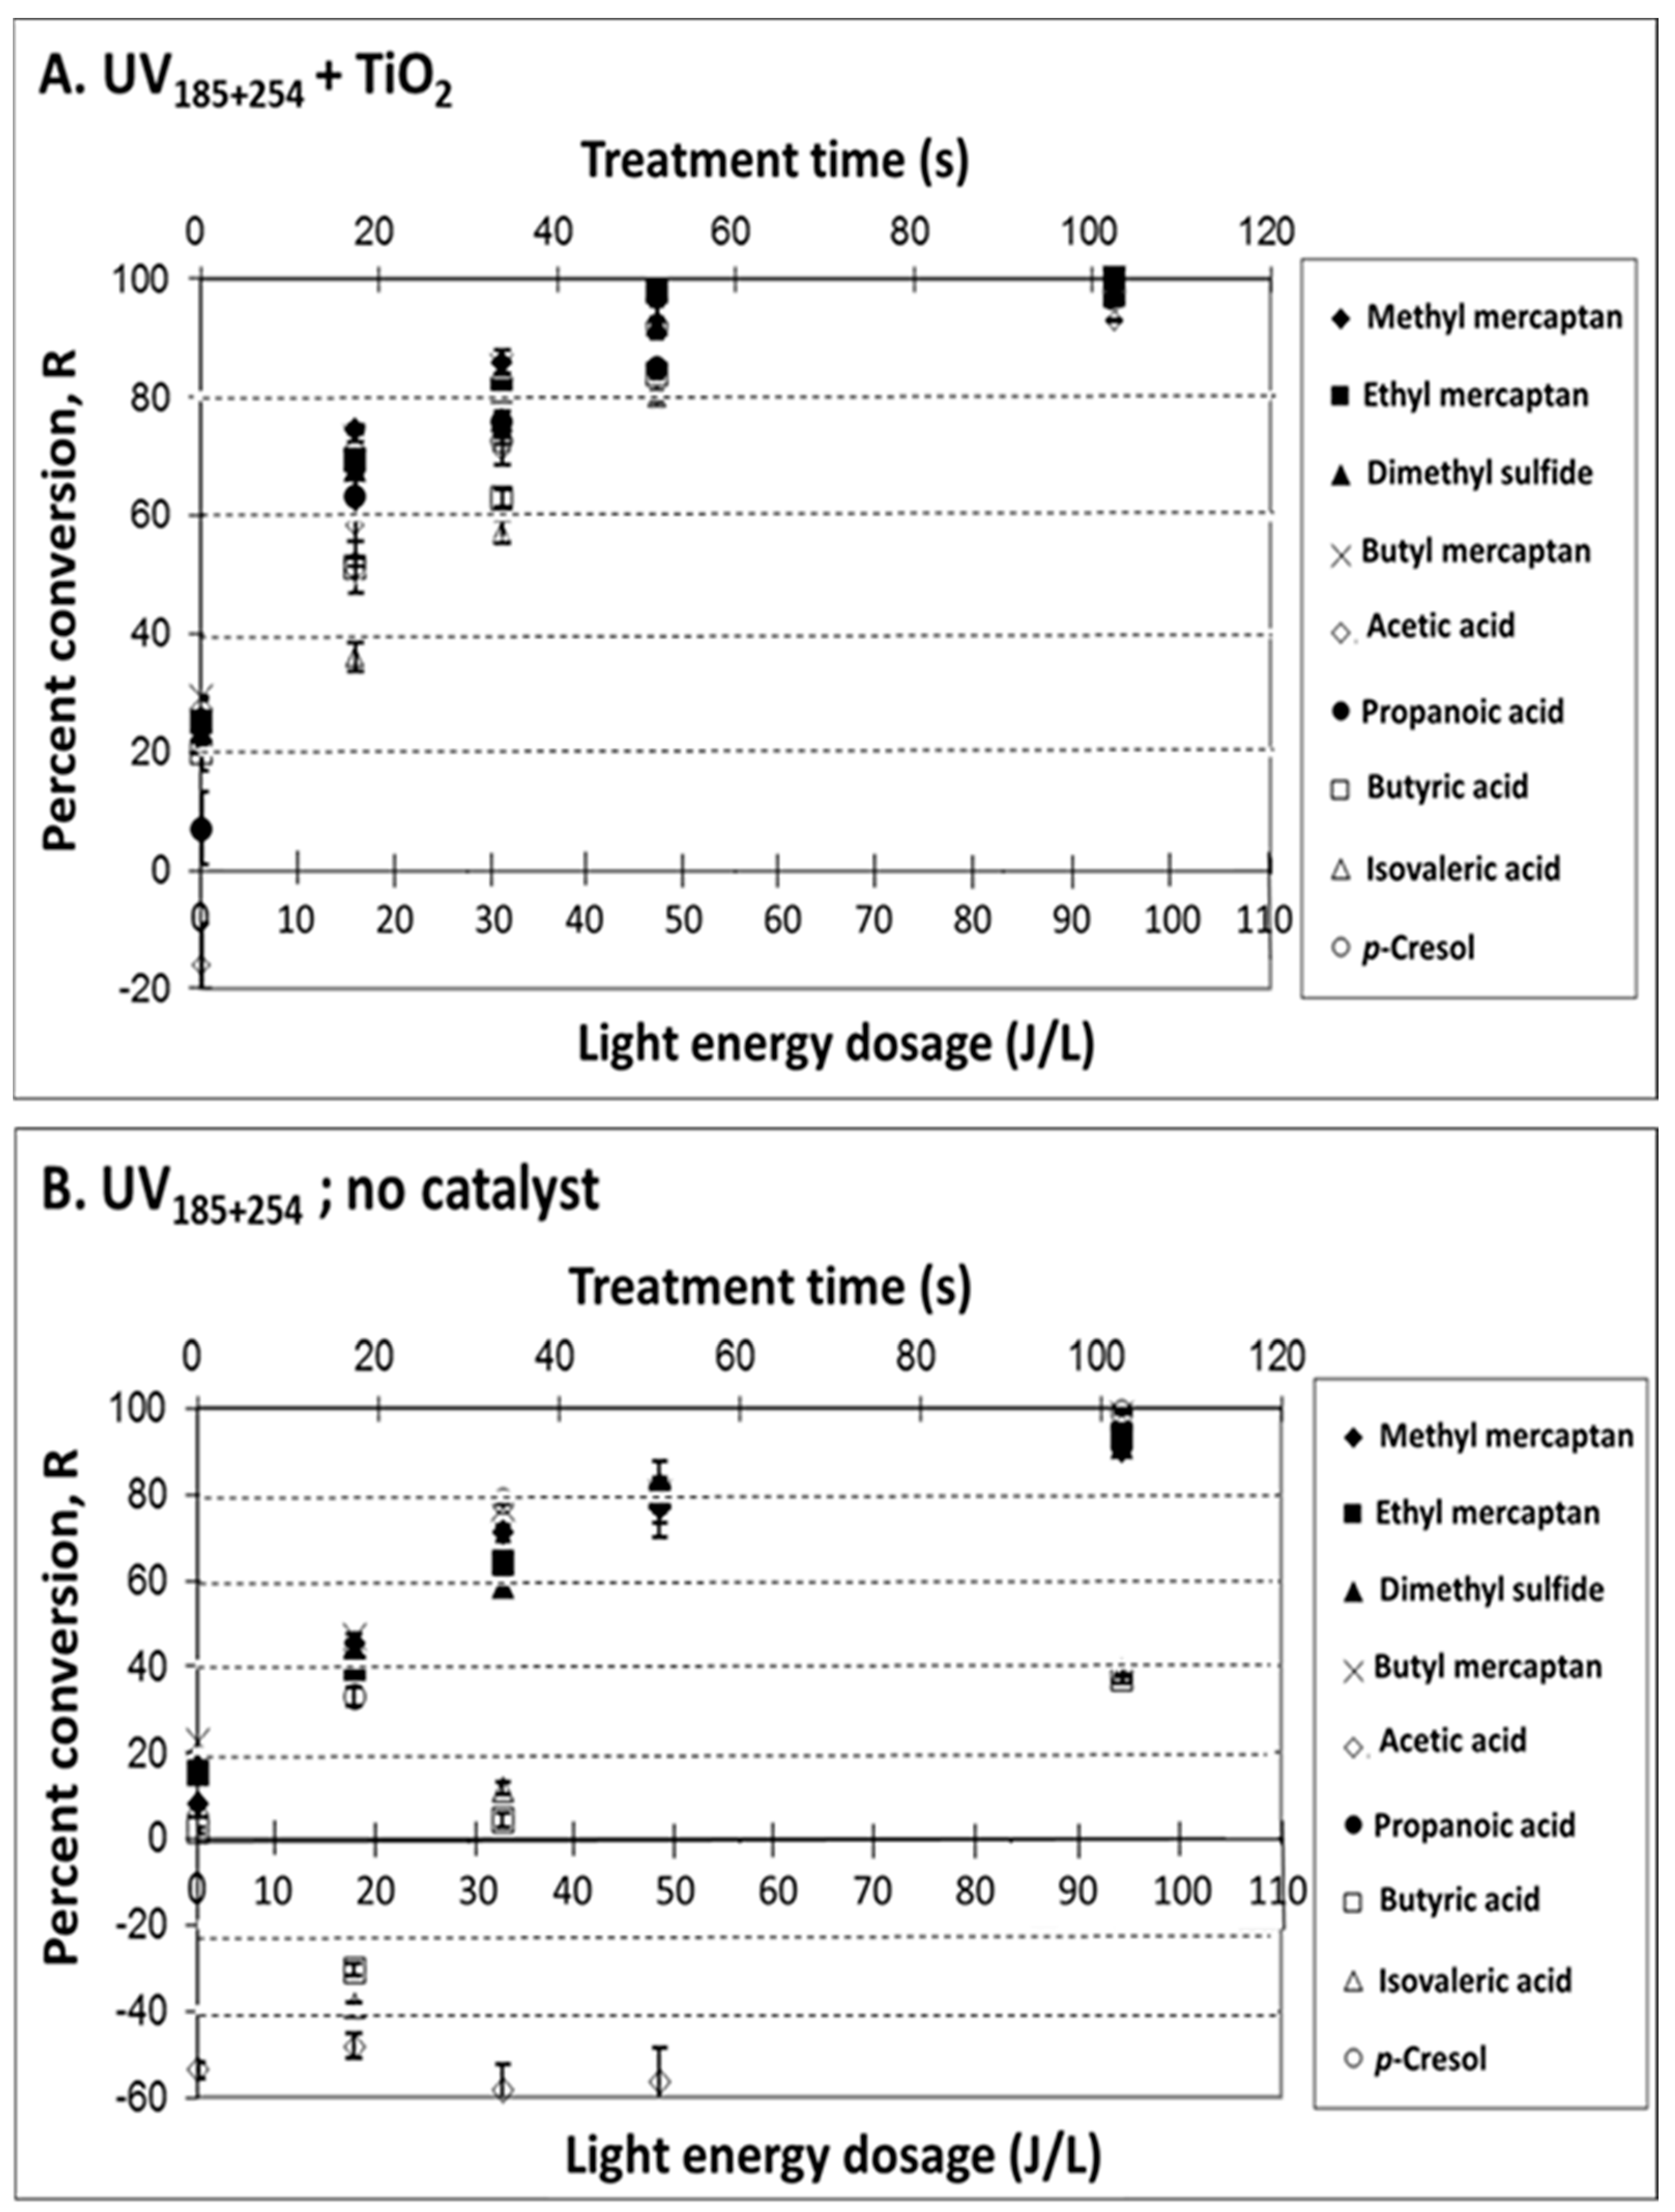
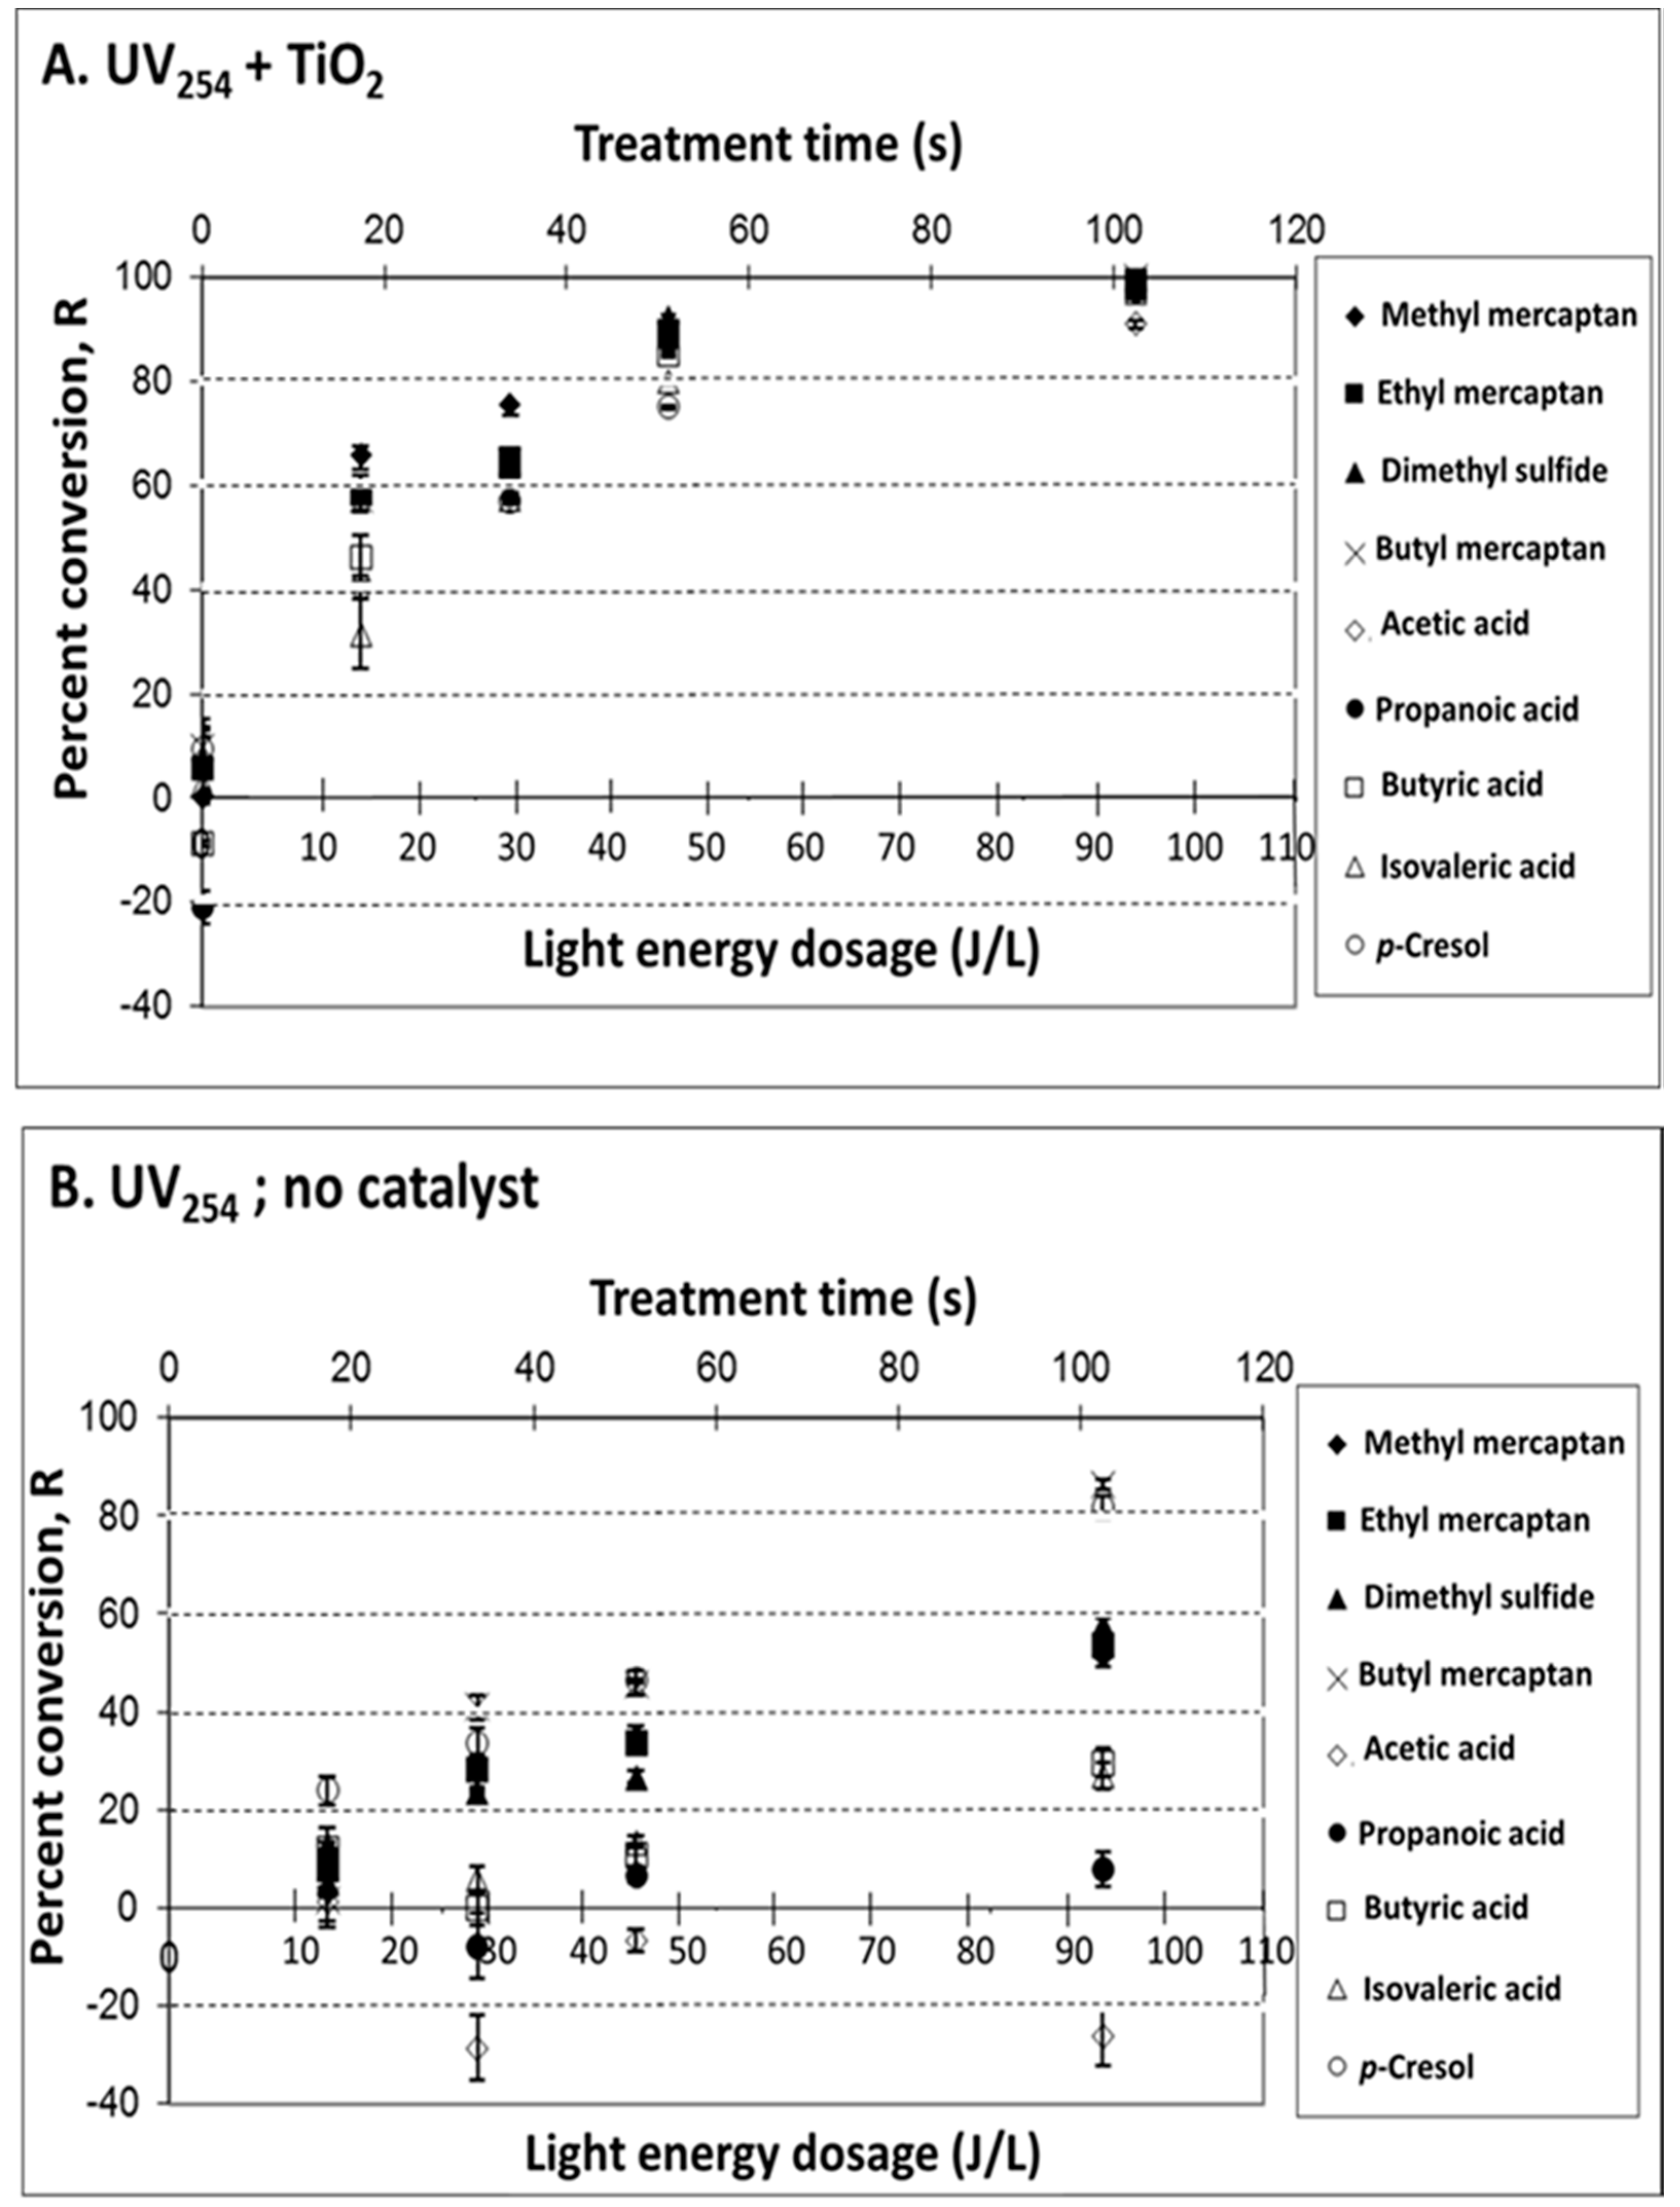
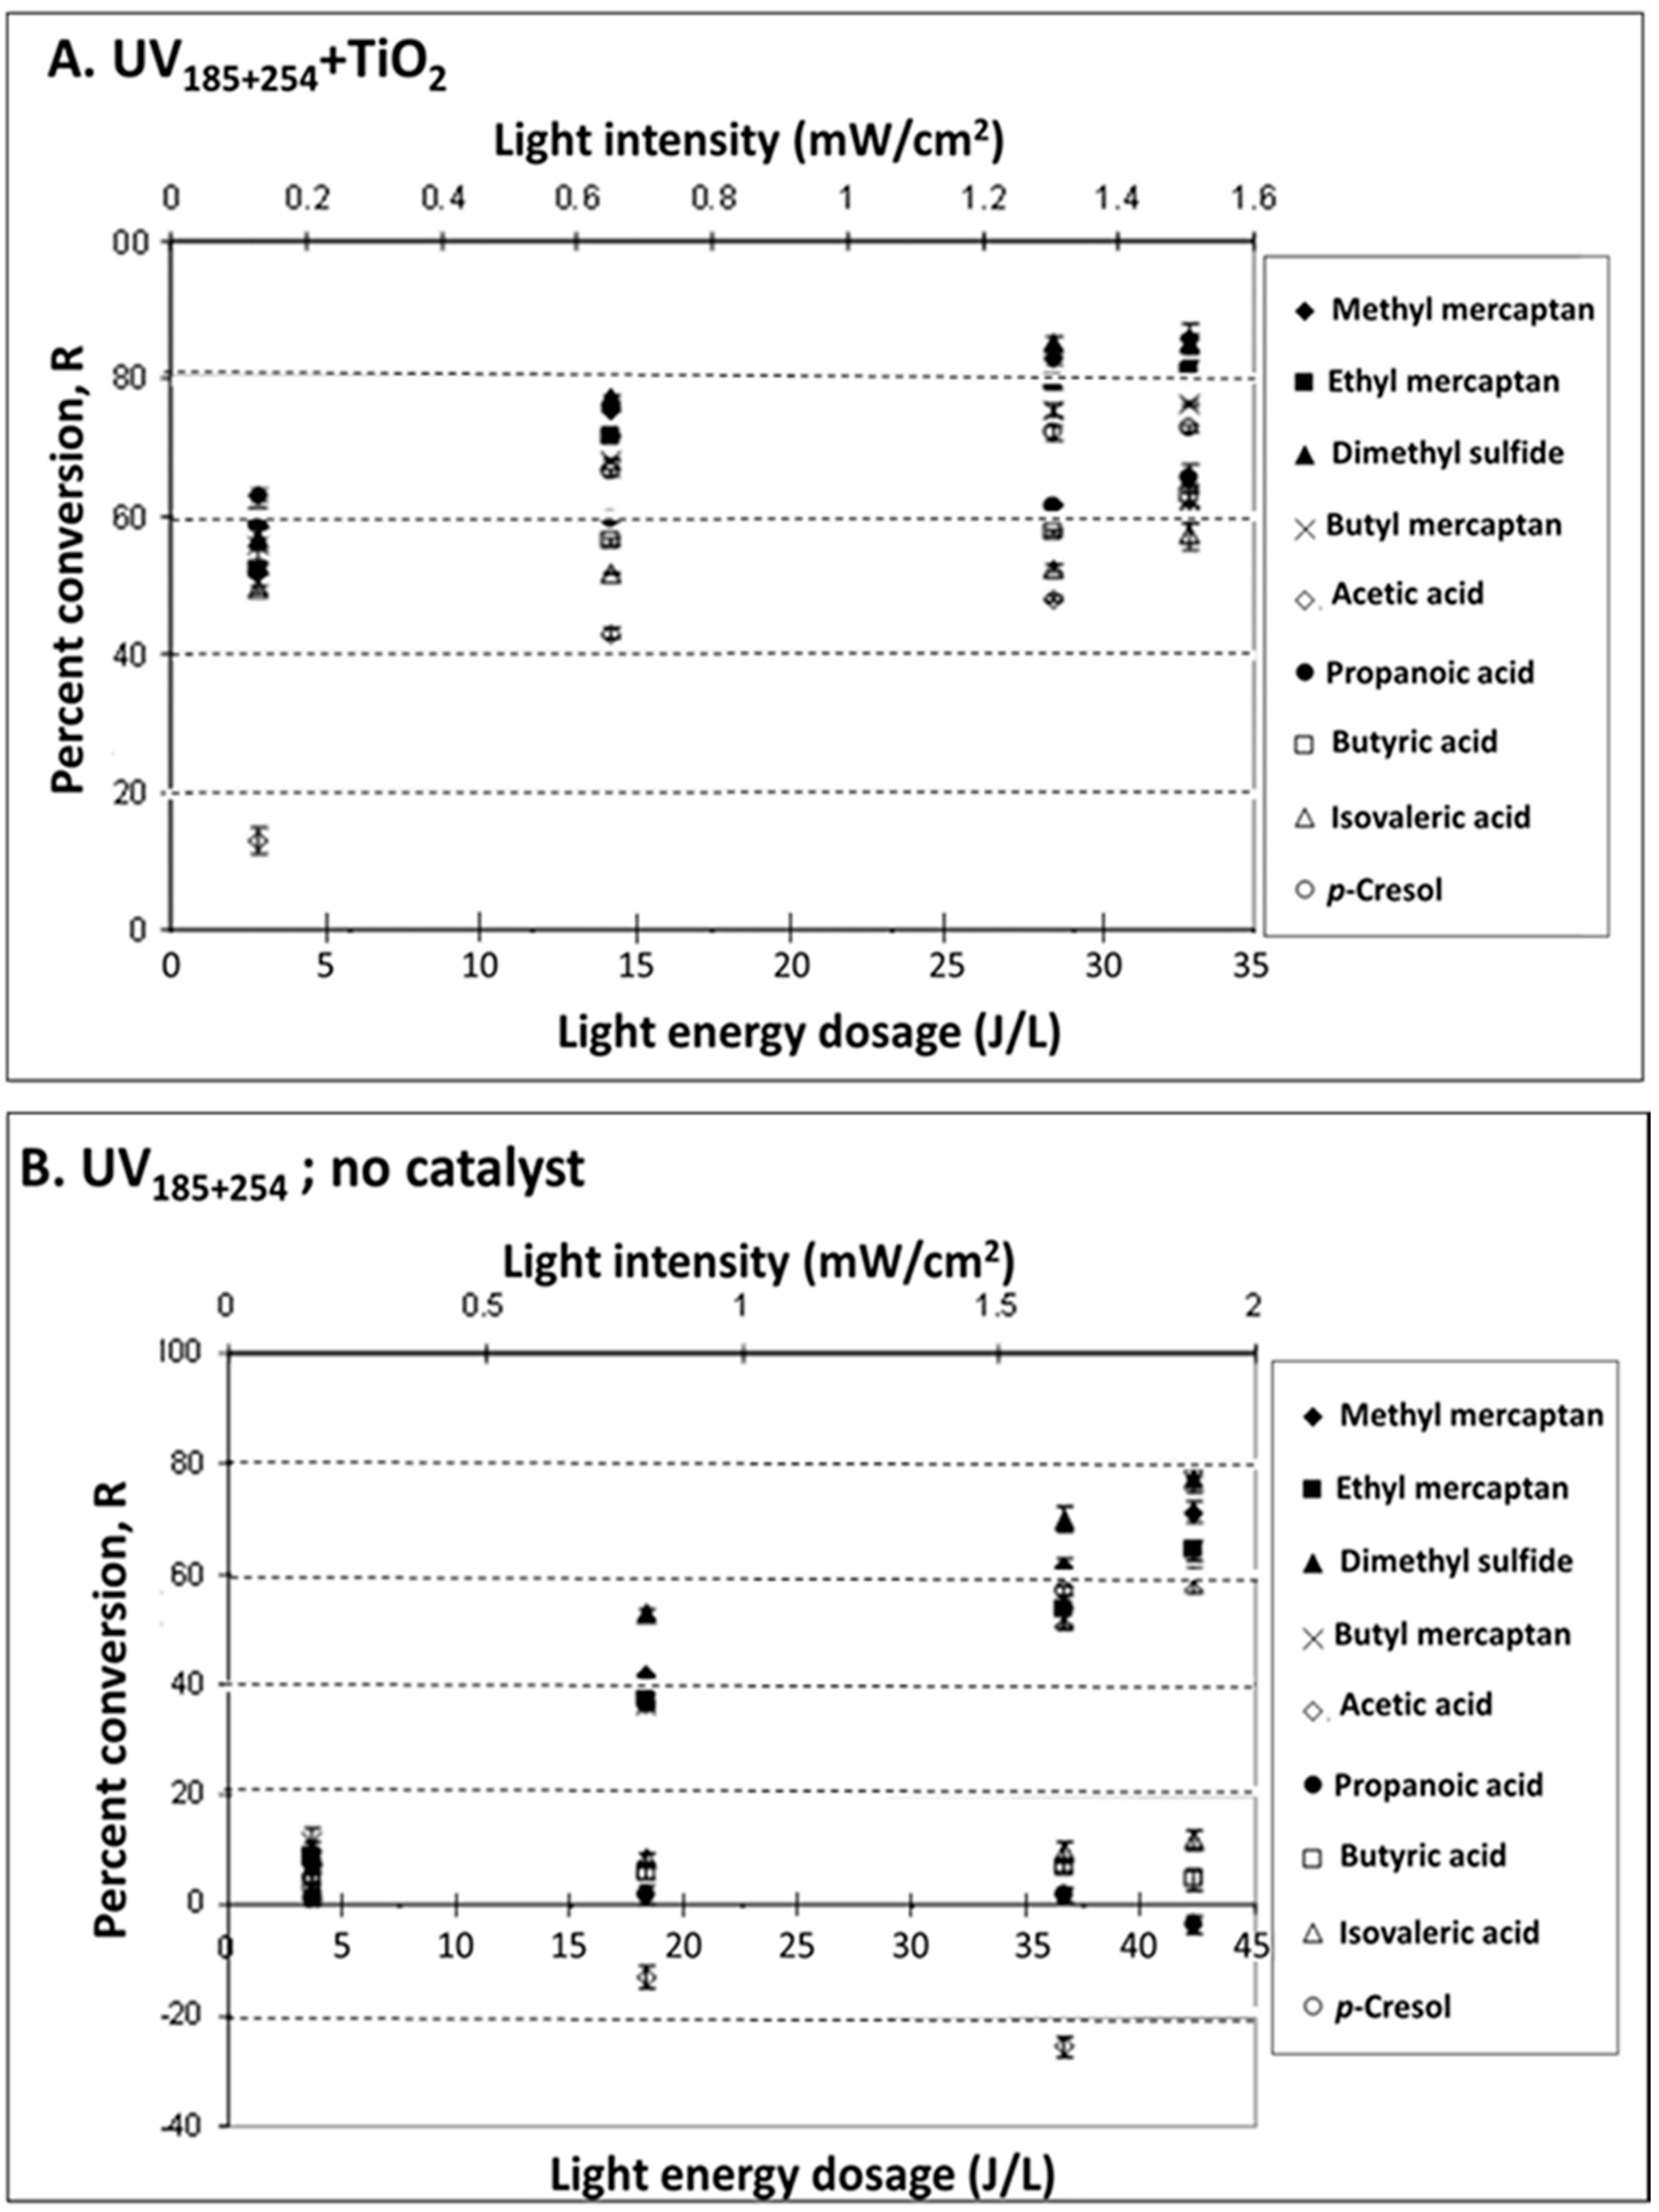
2.1.1. Effects of UV Light dose, Wavelength, and Catalyst on VOC Conversion

The effect of light energy dose at 254 nm was evaluated by varying exposure times through variation of flow rates of the synthetic VOC mixture through the reaction chamber (at a relatively low light intensity, i.e., I < 0.084 mW cm−2). Percent conversion, R (defined in Equation (1), in Methods), is presented in Figure 1 and Figure 2 for UV185+254 lamps, and for UV254 lamps, respectively. The difference between the UV254 and UV185+254 lamps is only the grade of quartz used on the outer sleeve. The latter use a purer quartz material that transmits the 185 nm emission, though >90% of the light is still at 254 nm.
The effects of TiO2 use were compared with and without a catalyst either at 185 + 254 nm (Figure 1A: UV185+254 + TiO2 vs. Figure 1B: UV185+254, no catalyst) and at 254 nm (Figure 2A: UV254 + TiO2 vs. Figure 2B: UV254, no catalyst). Positive R values indicate VOC removal, whereas negative values indicate the formation of target VOCs, presumably as intermediate byproducts during photodegradation of parent compounds [44]. Supporting data for Figure 1 and Figure 2, including measured gas concentrations, % VOC conversion, and VOC mass removed per unit of UV energy input (ng J−1) are presented in Tables S1–S4.
The results obtained for the synthetic VOCs mixture confirmed that it is feasible to control odorous VOCs with both photolysis and photocatalysis. The UV treatment effectiveness (expressed as R, Equation (1)) followed the general order of UV185+254 + TiO2 > UV254 + TiO2 > UV185+254, no catalyst > UV254, no catalyst, i.e., photocatalysis with deep UV being the most effective. Percent conversion increased with light energy dose up to ~60 s of treatment time and up to ~60 J/L. The linearity of R and light energy dose (summarized in Table S5) showed correlation coefficients R2 ranging from 0.79 to 1.0. Improved R2 (0.89–0.98 in Table S5) was observed when linearity was expressed as VOC mass removed as a function of light energy dose. The reproducibility of treatment effectiveness expressed as the average relative standard deviations (RSDs) ranged from 1.76% to 6.37% for target VOCs (Table S6). A significant (p ≥ 0.05) percent conversion of VOCs (>80%) was achieved when light energy was >60 J L−1.
The use of deep UV (UV185+254) was found to improve R, particularly when the photolysis was the primary treatment (Figure 3B and Figure 4B). This is to be expected, in that additional photochemical mechanisms are available with 185 nm photolysis, and TiO2 is not the primary light absorber. Still, acetic and propanoic acids were generated when UV185+254 was used. Apparent generation of low MW VFAs was likely a result of the partial breakdown of heavier MW VFAs into intermediates such as acetic and propanoic acids.
The use of a catalyst (TiO2) resulted in increased R for all VOCs and VFAs. The contribution of TiO2 to treatment effectiveness was most apparent at UV254 and evident when deep UV (UV185+254) was used. The contribution of TiO2, in general, can be explained by the electron–hole pairs generated on the catalyst surface, producing more radicals that, in turn, are available to oxidize VOCs, compared to relatively inefficient direct absorption of the UV light. The use of catalysts lowered the resulting acetic acid concentration, which is a desirable outcome.
A paired t-test was conducted for assessing the contribution of deep UV (UV185+254 vs. UV254 nm; with and without catalyst) and the contribution of catalyst (with TiO2 vs. no TiO2; at UV185+254 and UV254 nm). The p-values obtained for each comparison for all target compounds are presented in Table 1. The use of a catalyst improved R significantly (p ≥ 0.05) in most cases, while the use of deep UV (UV185+254) had a significant effect mainly without the catalyst. Several exceptions were observed for (i) VFAs with no significant improvement with the use of deep UV, both in the presence or absence of catalyst; except for acetic acid conversion via photolysis, (ii) dimethyl sulfide with no significant improvement with deep UV in the presence of the catalyst, and (iii) p-cresol with no significant improvement with the use of photocatalysis at deep UV. In some cases, there was even an increase in the concentration of some of these exceptional compounds, i.e., the generation of these substances.
Calculated mass VOCs converted (ng) per energy dose (J) for the four treatment processes are summarized in Table 2. Particularly interesting for future scale-up was the mass removal rate of p-cresol, a characteristic odor indicator associated with livestock operations [14,19], which was ~79 to ~110 ng J−1. UV lamps associated with specific wattage ratings can be selected to achieve desired mass removal fractions for key odorants based on the treatment time and their approximate concentration range. Herrmann [42] concluded that R generally increased with radiant flux (light energy). Mass removal rates have practical importance as the key input data needed to scale-up UV treatment, i.e., sizing a minimum UV energy input and cost to treat typical VOC emissions from livestock barn exhaust.
Light flux is reduced with distance from a source according to the inverse-square law. In this study, light intensity was manipulated by changing the distance between the UV lamps and the photoreactor (see Materials and Methods). The effects of light intensity on R is presented in Figure 3. The effects of catalyst were tested in this case for the more effective UV185+254 treatment only. The R conversion was proportional to the light intensity with R2 > 0.90 for all VOCs except for VFAs. Lower light intensity (i.e., I < 0.084 mW cm−2; Figure 1 and Figure 2) resulted in lower R. The absence of a catalyst (Figure 3B) resulted in poor or no conversion of VFAs. Specifically, concentrations of VFAs with low MW, i.e., acetic and sometimes also propanoic acid, increased. Notably, acetic acid concentrations increased linearly with the increase of light energy dose. This is presumably caused by the oxidation of aldehydes, alcohols, or the sequential decarboxylation of longer chain acids [44].

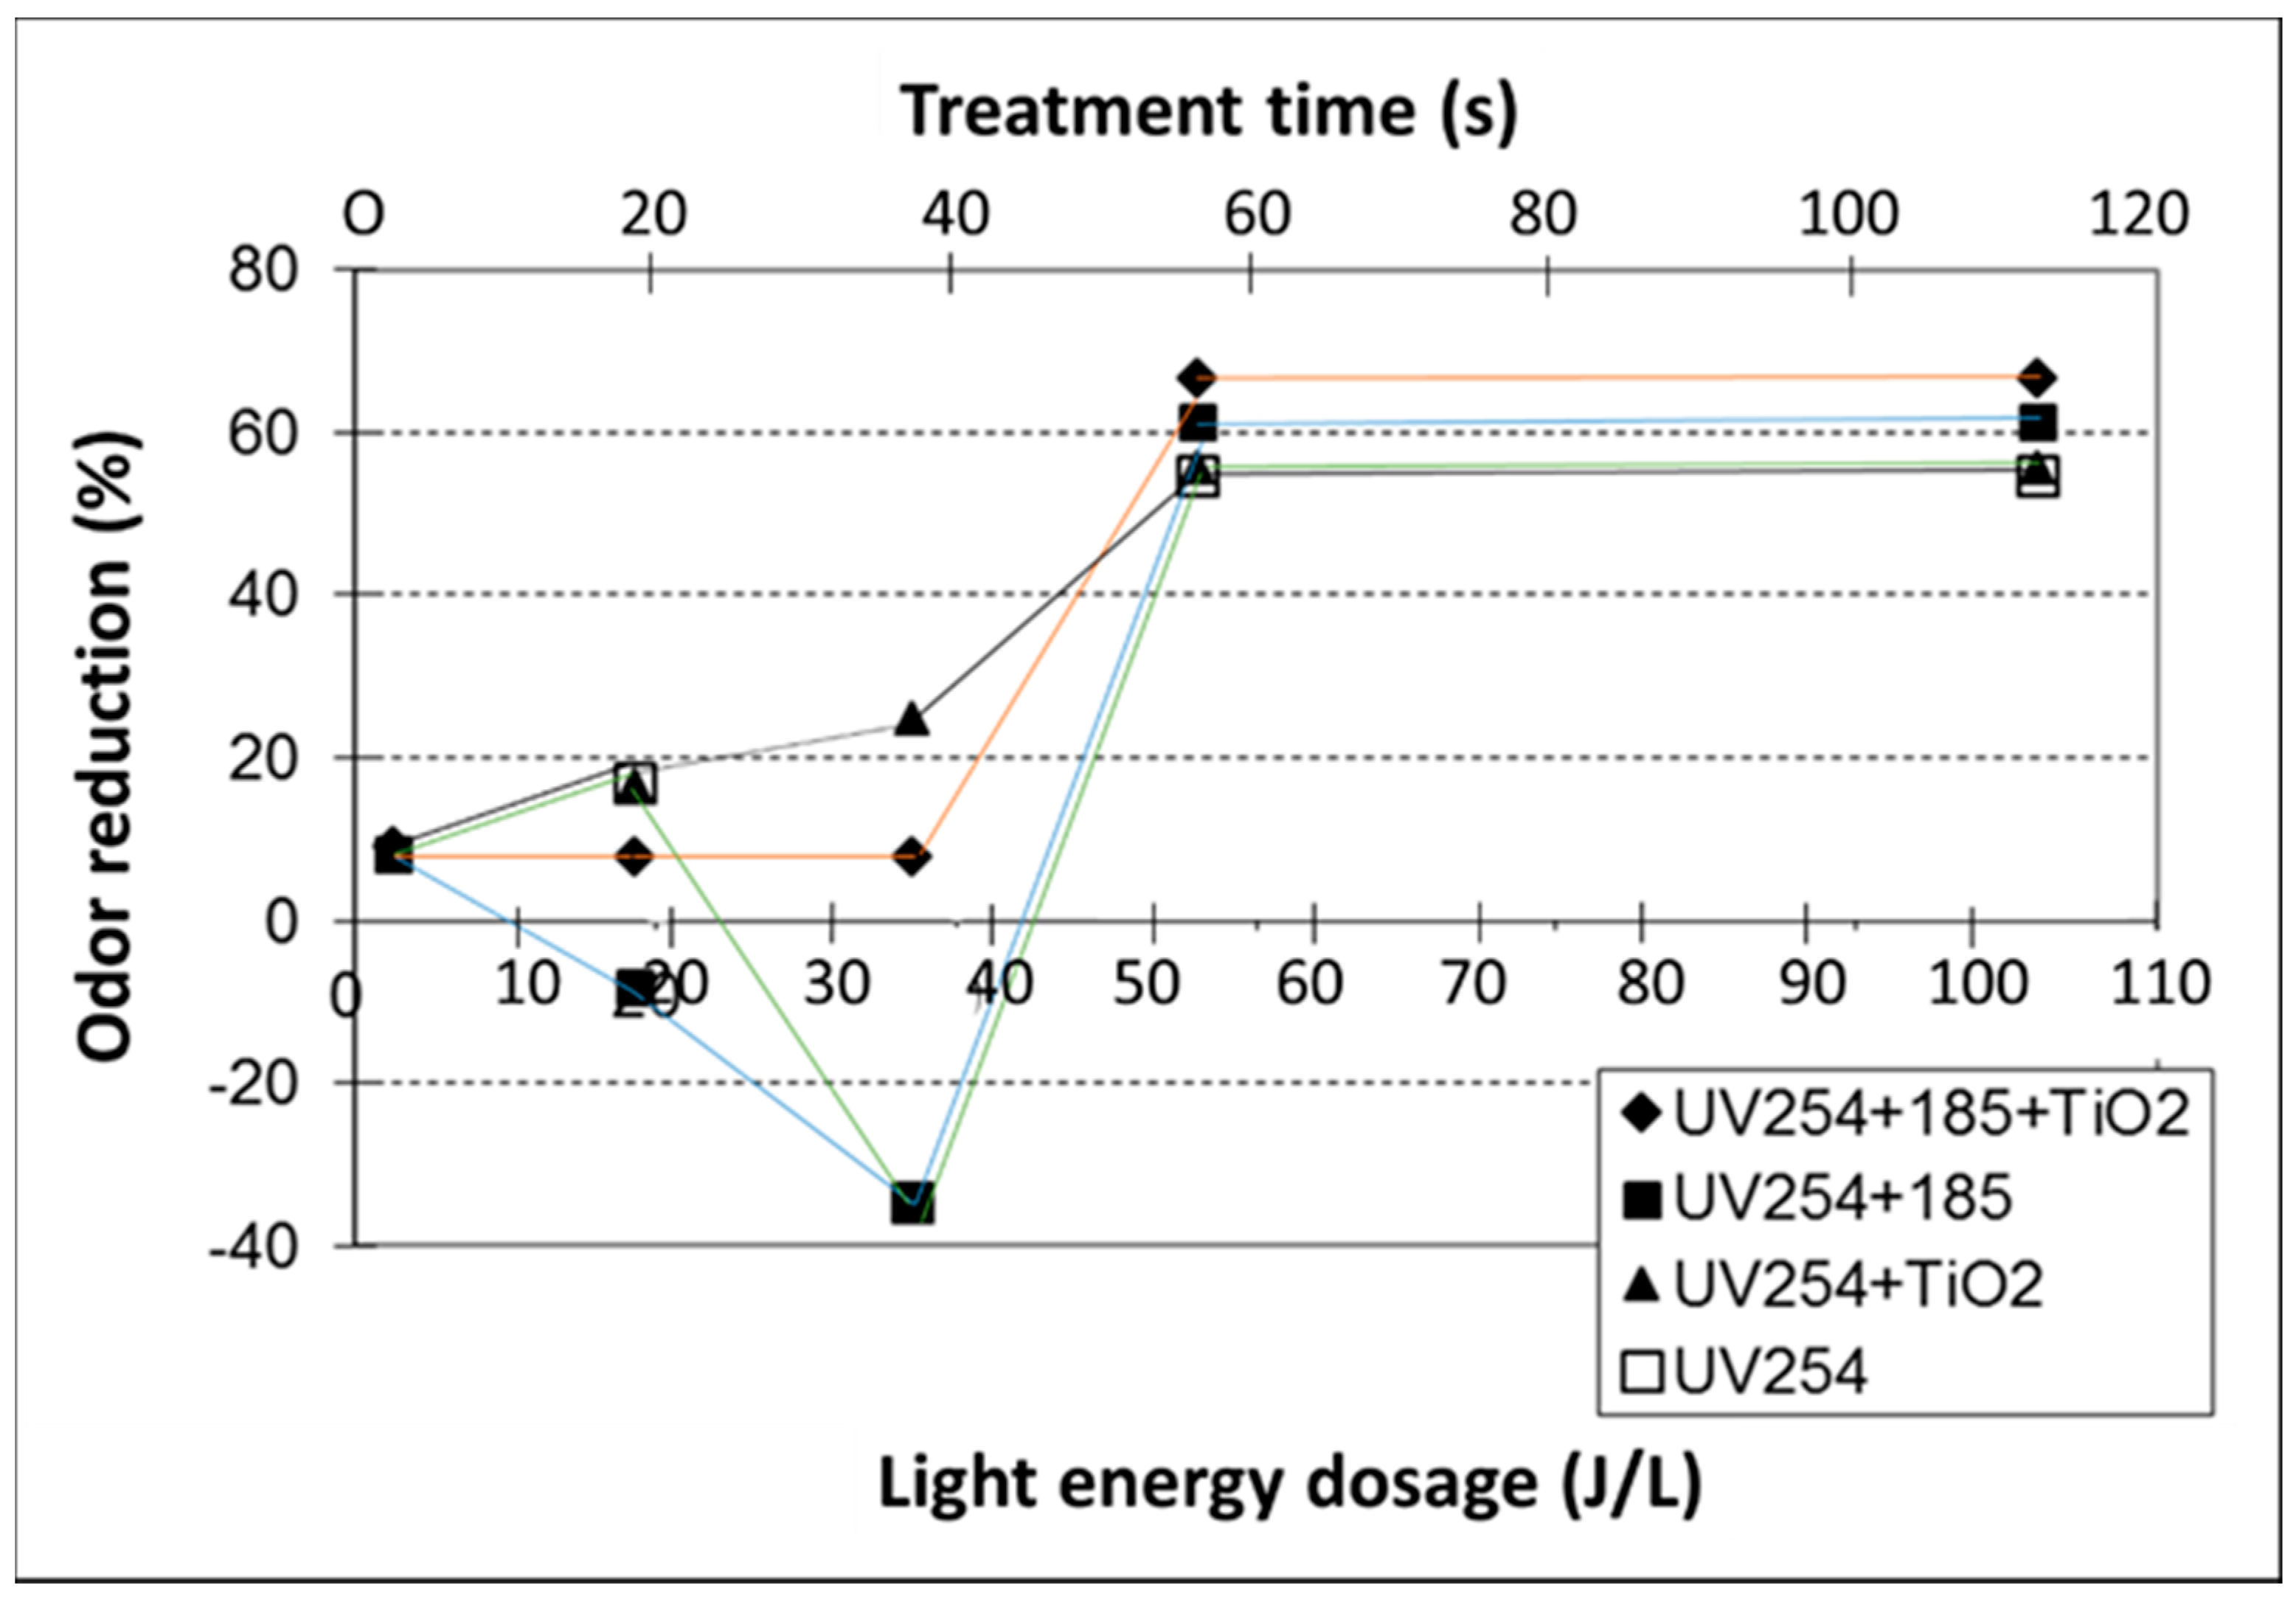
2.1.2. Effect of UV Treatment Time on Odor Reduction

Significant odor reduction (measured by dilution olfactometry) was observed in UV185+254 + TiO2 and UV254 + TiO2 treatment processes for light energy level >50 J L−1 (Figure 4). Odor generation was observed at low-energy-dose treatments (I < 40 J L−1) without a catalyst. This is likely due to the generation of low-molecular-mass fatty acids, as shown in Figure 1, Figure 2 and Figure 3 or less offensive odorants.

2.1.3. Effect of Relative Humidity and Air Temperature on UV Treatment

The effects of relative humidity (RH, 0 to 90%; at fixed T = 25 °C) and air temperature (from 5 to 40 °C; at fixed RH = 30%) were tested. Results were reproducible, i.e., associated with low relative standard deviations (RSDs, Tables S7 and S8). The effect of RH is summarized in Figures S1–S4. The UV treatment effectiveness followed the same general pattern as reported in Figure 1 and Figure 2, i.e., UV185+254 + TiO2 > UV254 + TiO2 > UV185+254, no catalyst > UV254, no catalyst. No apparent effects of RH on R were observed (Figures S1A–S4A). However, a significant decrease in VOC mass converted was observed with high RH (Figures S1A–S4A). This is consistent with Cao et al. [45] reporting on the excess moisture that could lead to slowing down the reaction rate due to the competitive adsorption of water with reactants on the TiO2 surface.
No apparent effect of temperature on R was observed for p-cresol and most of the VFAs (Figures S5A–S8A). An apparent increase of both R and mass converted was observed for mercaptans with a temperature increase to 25 °C. Further temperature above 25 °C did not have any significant trend/effect on R or mass converted (Figures S5–S8).

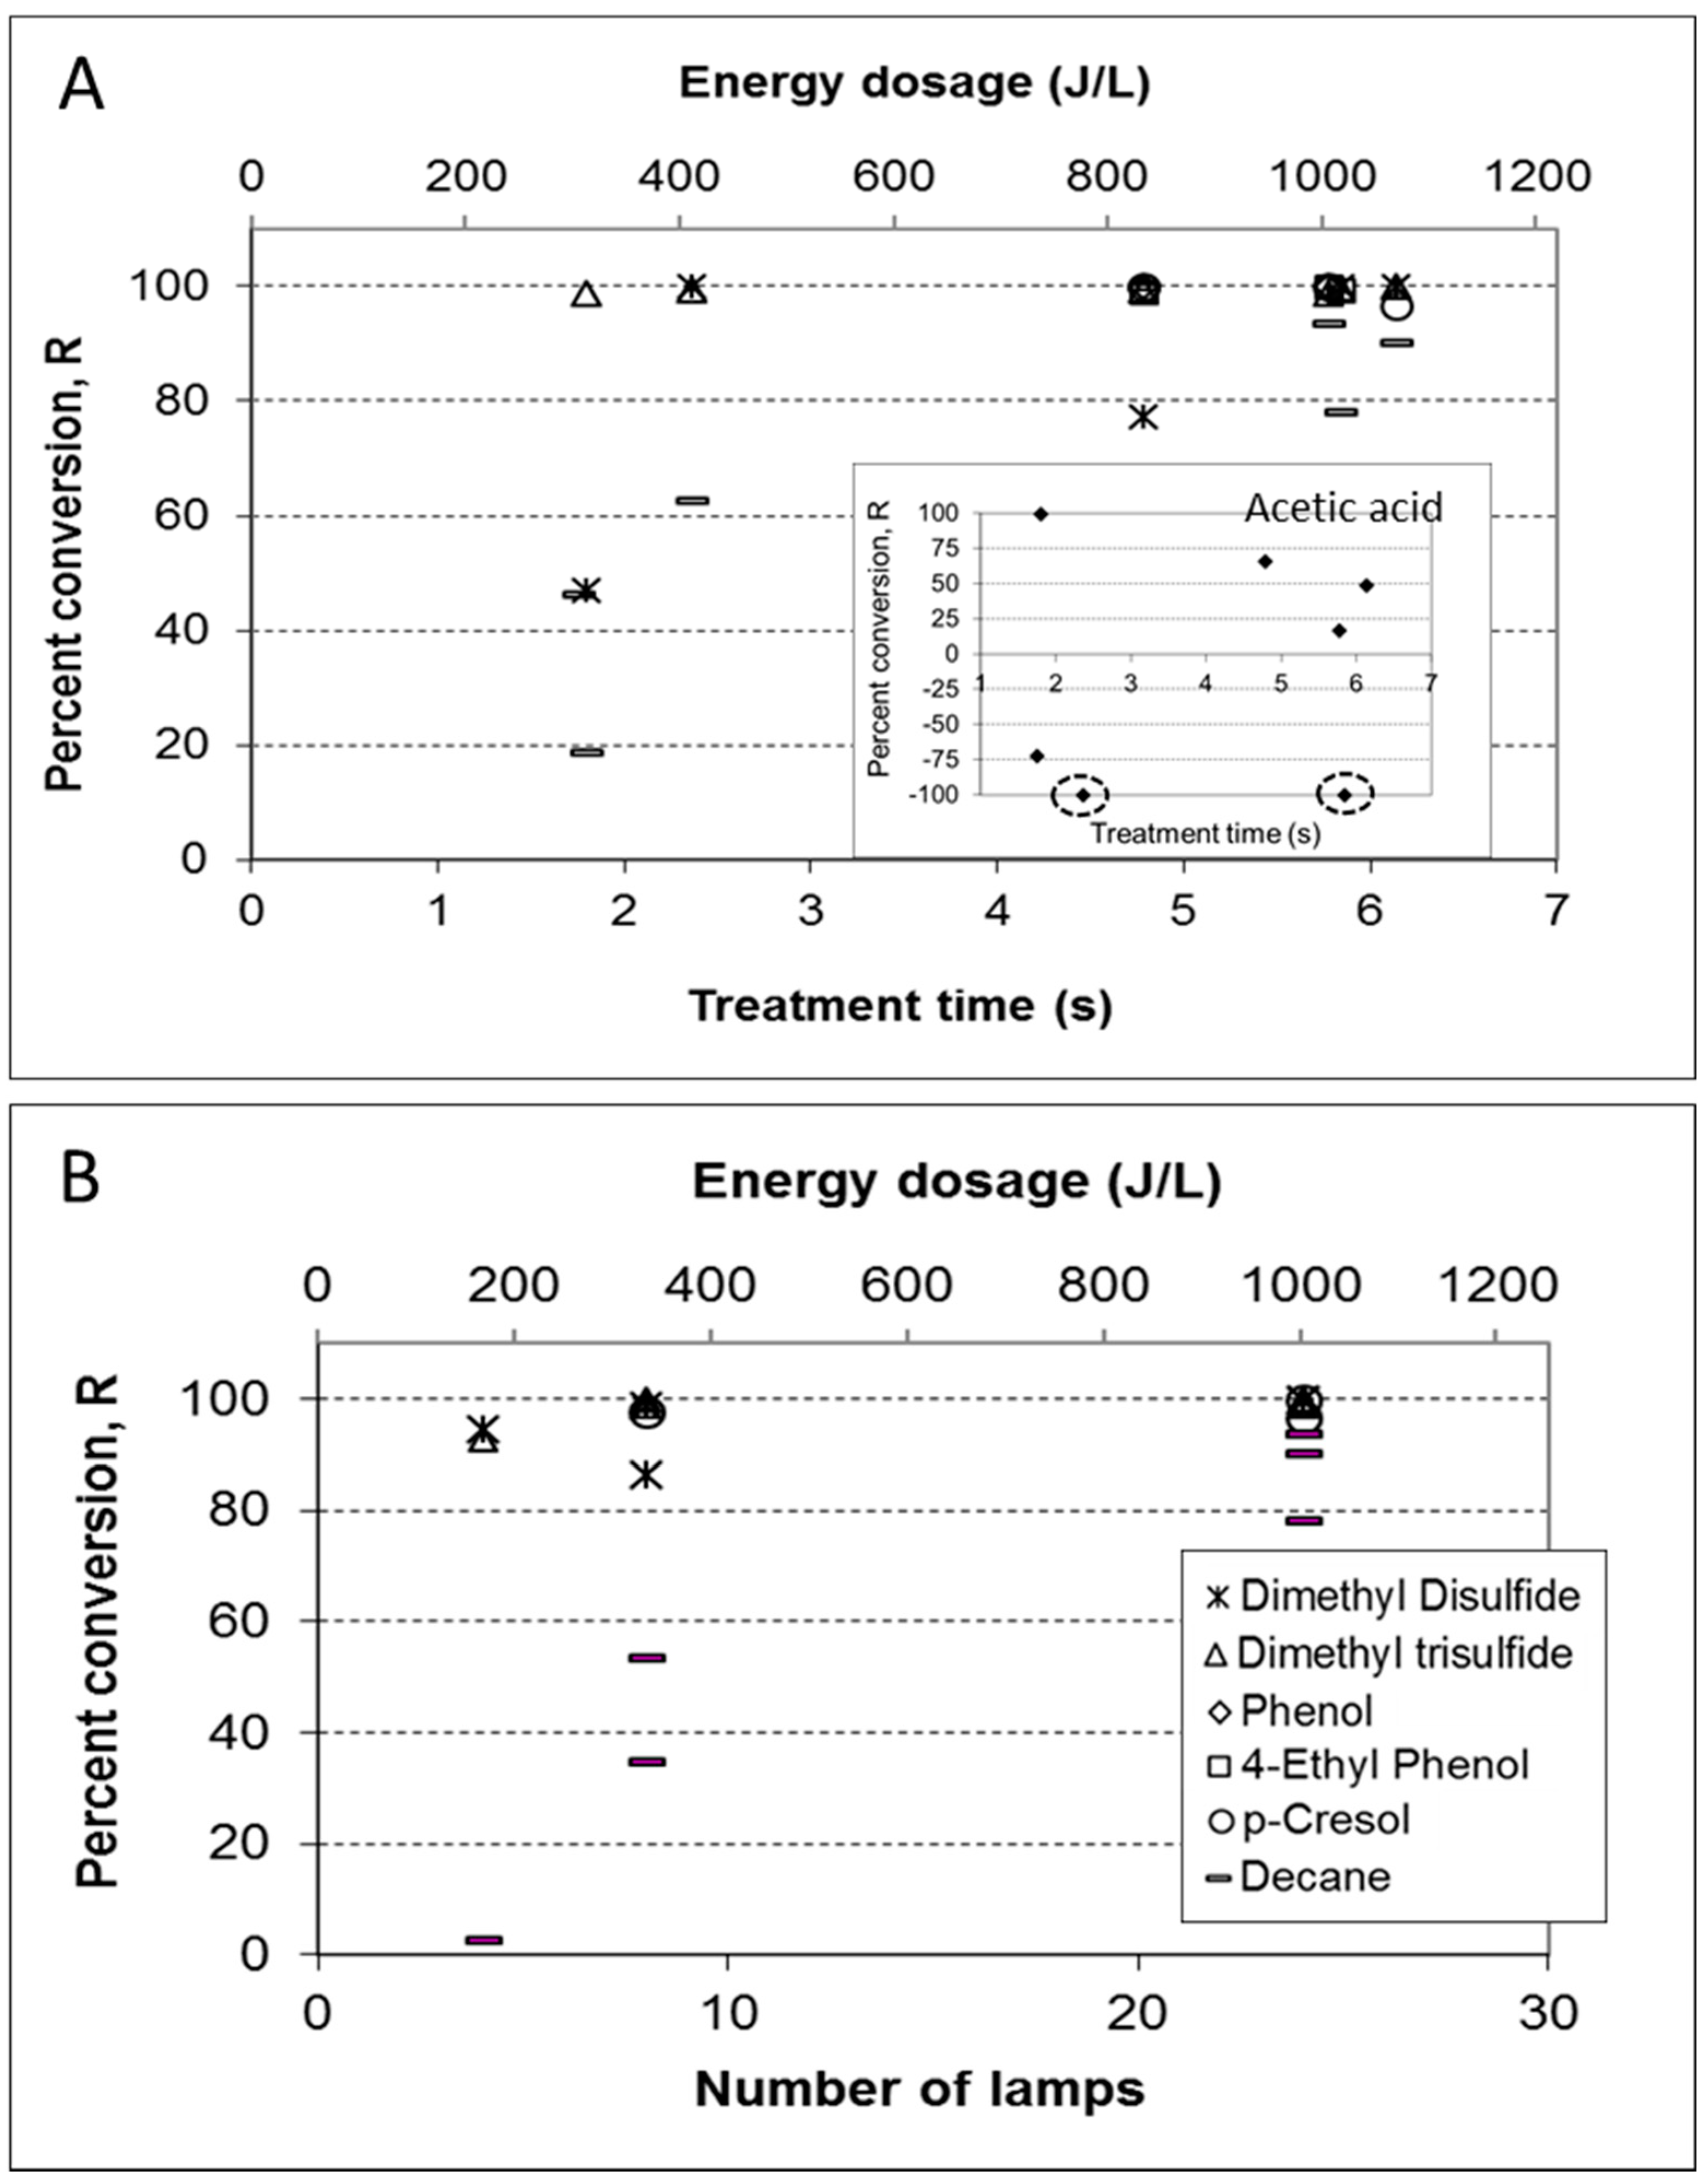
2.2. UV/TiO2 Photocatalysis of Real Poultry Atmosphere

The energy dose in these experiments was not calculated as it was impossible to measure light intensity at the reaction surface (a TiO2 coated brush was placed inside the reactor tube; see Material and Methods). Thus, the conversion of odorous compounds is discussed regarding potential treatment effectiveness. Moreover, since real manure suspensions served as the source of odorous compounds, the composition of the source atmosphere varied between experiments. The collective treatment data represent the results of seven individual runs done on different days using poultry manure suspensions in varying stages of decomposition.

2.2.1. Potential Effectiveness of VOCs Removal

Specific VOCs were selected for presentation if they were observed in multiple experiments and based on their detection quality (see Materials and Methods). Three preliminary experiments were conducted with no light energy to evaluate possible VOC removal through adsorption to the photoreactor walls and to the TiO2 coated brush. These experiments showed large variability with either increased or decreased peak areas at the exit of the photoreactor. Yet, on average, compound conversion without light source was minimal (average of R was nearly zero for the collective data). Then, when light energy was provided, all VOCs conversions were more consistent, and R was always positive (i.e., signifying the net reduction of the VOCs), except for acetic acid (discussed below).
The potential effect of energy dose on VOCs conversion rates was demonstrated either by (1) manipulating treatment time (applying airflow rates between 24 and 85 L min−1, which was equivalent to treatment time of 1.8 to 6.1 s; all 24 UV lamps were in use; Figure 5A) or by (2) manipulating light intensities (using a varying number of lamps at a fixed treatment time of 5.5–6.3 s; Figure 5B.
The results show the effective removal of key malodor compounds in poultry manure (dimethyl trisulfide (DMTS) and dimethyl disulfide (DMDS), p-cresol, phenol, and 4-ethyl phenol) in short treatment times. Decane (which appeared in most samples but is not considered as a key odorant) showed more dependence on energy dose, either at the shorter treatment times or lower light intensities. The results obtained for acetic acid (Figure 5A; inset) were not consistent and varied from positive (i.e., net removal) to negative (net formation) R, with no clear dependence on energy dose. These observations were consistent with the experiments done with synthetic VOCs mixture (where acetic acid was generated under certain conditions).

2.2.2. Potential Effectiveness of Ammonia Removal

As for VOCs, the concentrations of NH3 in the source atmosphere (real manure suspensions at varying stages of decomposition) varied between experiments. Values between 10 and 130 ppm were measured in seven individual experiments. However, in contrast to the potentially highly effective removal of VOCs, almost no removal was observed for NH3, except in one experiment in which NH3 was reduced by 60% with no clear reason. The single observed disappearance could be either an anomaly or possibly due to dissolution in water.

2.2.3. Coeffect of Spontaneously Produced Ozone

Ozone was not introduced intentionally into the system, and the first sign of its presence was the typical “swimming pool” odor perceived by the operator at the exit of the reactor. Ozone measurements then performed with and without the presence of the TiO2 catalyst. No ozone was detected without a catalyst; under these conditions (no catalyst), VOCs were not removed as effectively. Ozone was detected at concentrations in the range of 1–2 ppm after treatment, including a catalyst (none before treatment). Since some of the ozone presumably reacted with the VOCs in the photoreactor, this ozone is considered “residual”. Such levels of residual ozone produced under the UV365/TiO2 system might need to be treated before being released into the environment and deserves safety considerations.
UV light at 365 nm does not provide the energy needed to split molecular oxygen (O2); that is only available at 185 nm. However, under TiO2 photocatalytic conditions, a variety of reactive oxygen species can be produced, notably including hydroxyl radical and potentially, though indirectly, O3. Notably, spontaneously produced O3 was not reported in previous studies on VOC treatment by photocatalysis in the 365 nm/TiO2 systems. It may be that other mechanisms of O3 generation play a role in real manure offgas compared to synthetic air mixtures of a few compounds. As known from atmospheric chemistry, O3 is generated in the presence of NOx and other VOCs (NOx photodissociates at <420 nm) [46,47]. The poultry manure suspensions used in this study as the source atmosphere evidently contained many VOCs and possibly NOx (not measured). Ammonia, NOx, and other VOCs in the manure atmosphere were likely involved [48]. Thus, O3 formation was possibly a combination of both NOx and VOC photodissociation plus reactions with OH radicals that were formed in the 365 nm/TiO2 system [47]. Monge et al. (2010) [49] reported the possibility of O3 formation from illuminated TiO2 surfaces. If this is the case, then O3 becomes an inevitable byproduct in the 365 nm/TiO2 system treating barn emissions, and it would be difficult to elucidate the specific contribution of UV/TiO2 and that of O3 to the overall odor elimination process.

2.2.4. Total Odor Removal

Total odor reduction was analyzed twice. The first measurement included the conversion of VOCs from relatively fresh manure suspension with a strong odor (treatment time 4.8 s; all 24 lamps in use). Odor was reduced by 77% (from 60,312 to 13,615 odor detection thresholds (ODT)). The second measurement was completed with aged manure, which emitted much weaker odors (residence time 5.8 s; all 24 lamps in use), There was basically no odor reduction, i.e., from 684 to 641 ODT, but the odor character changed substantially from “sewage type” odor to “ozone odor.” This observation suggests that the smell associated with residual ozone has more impact on total odor measurements at lower initial odor emissions. Ozone residuals may be removed after treatment by an ozone destruction unit for health as well as odor concerns.

3. Materials and Methods

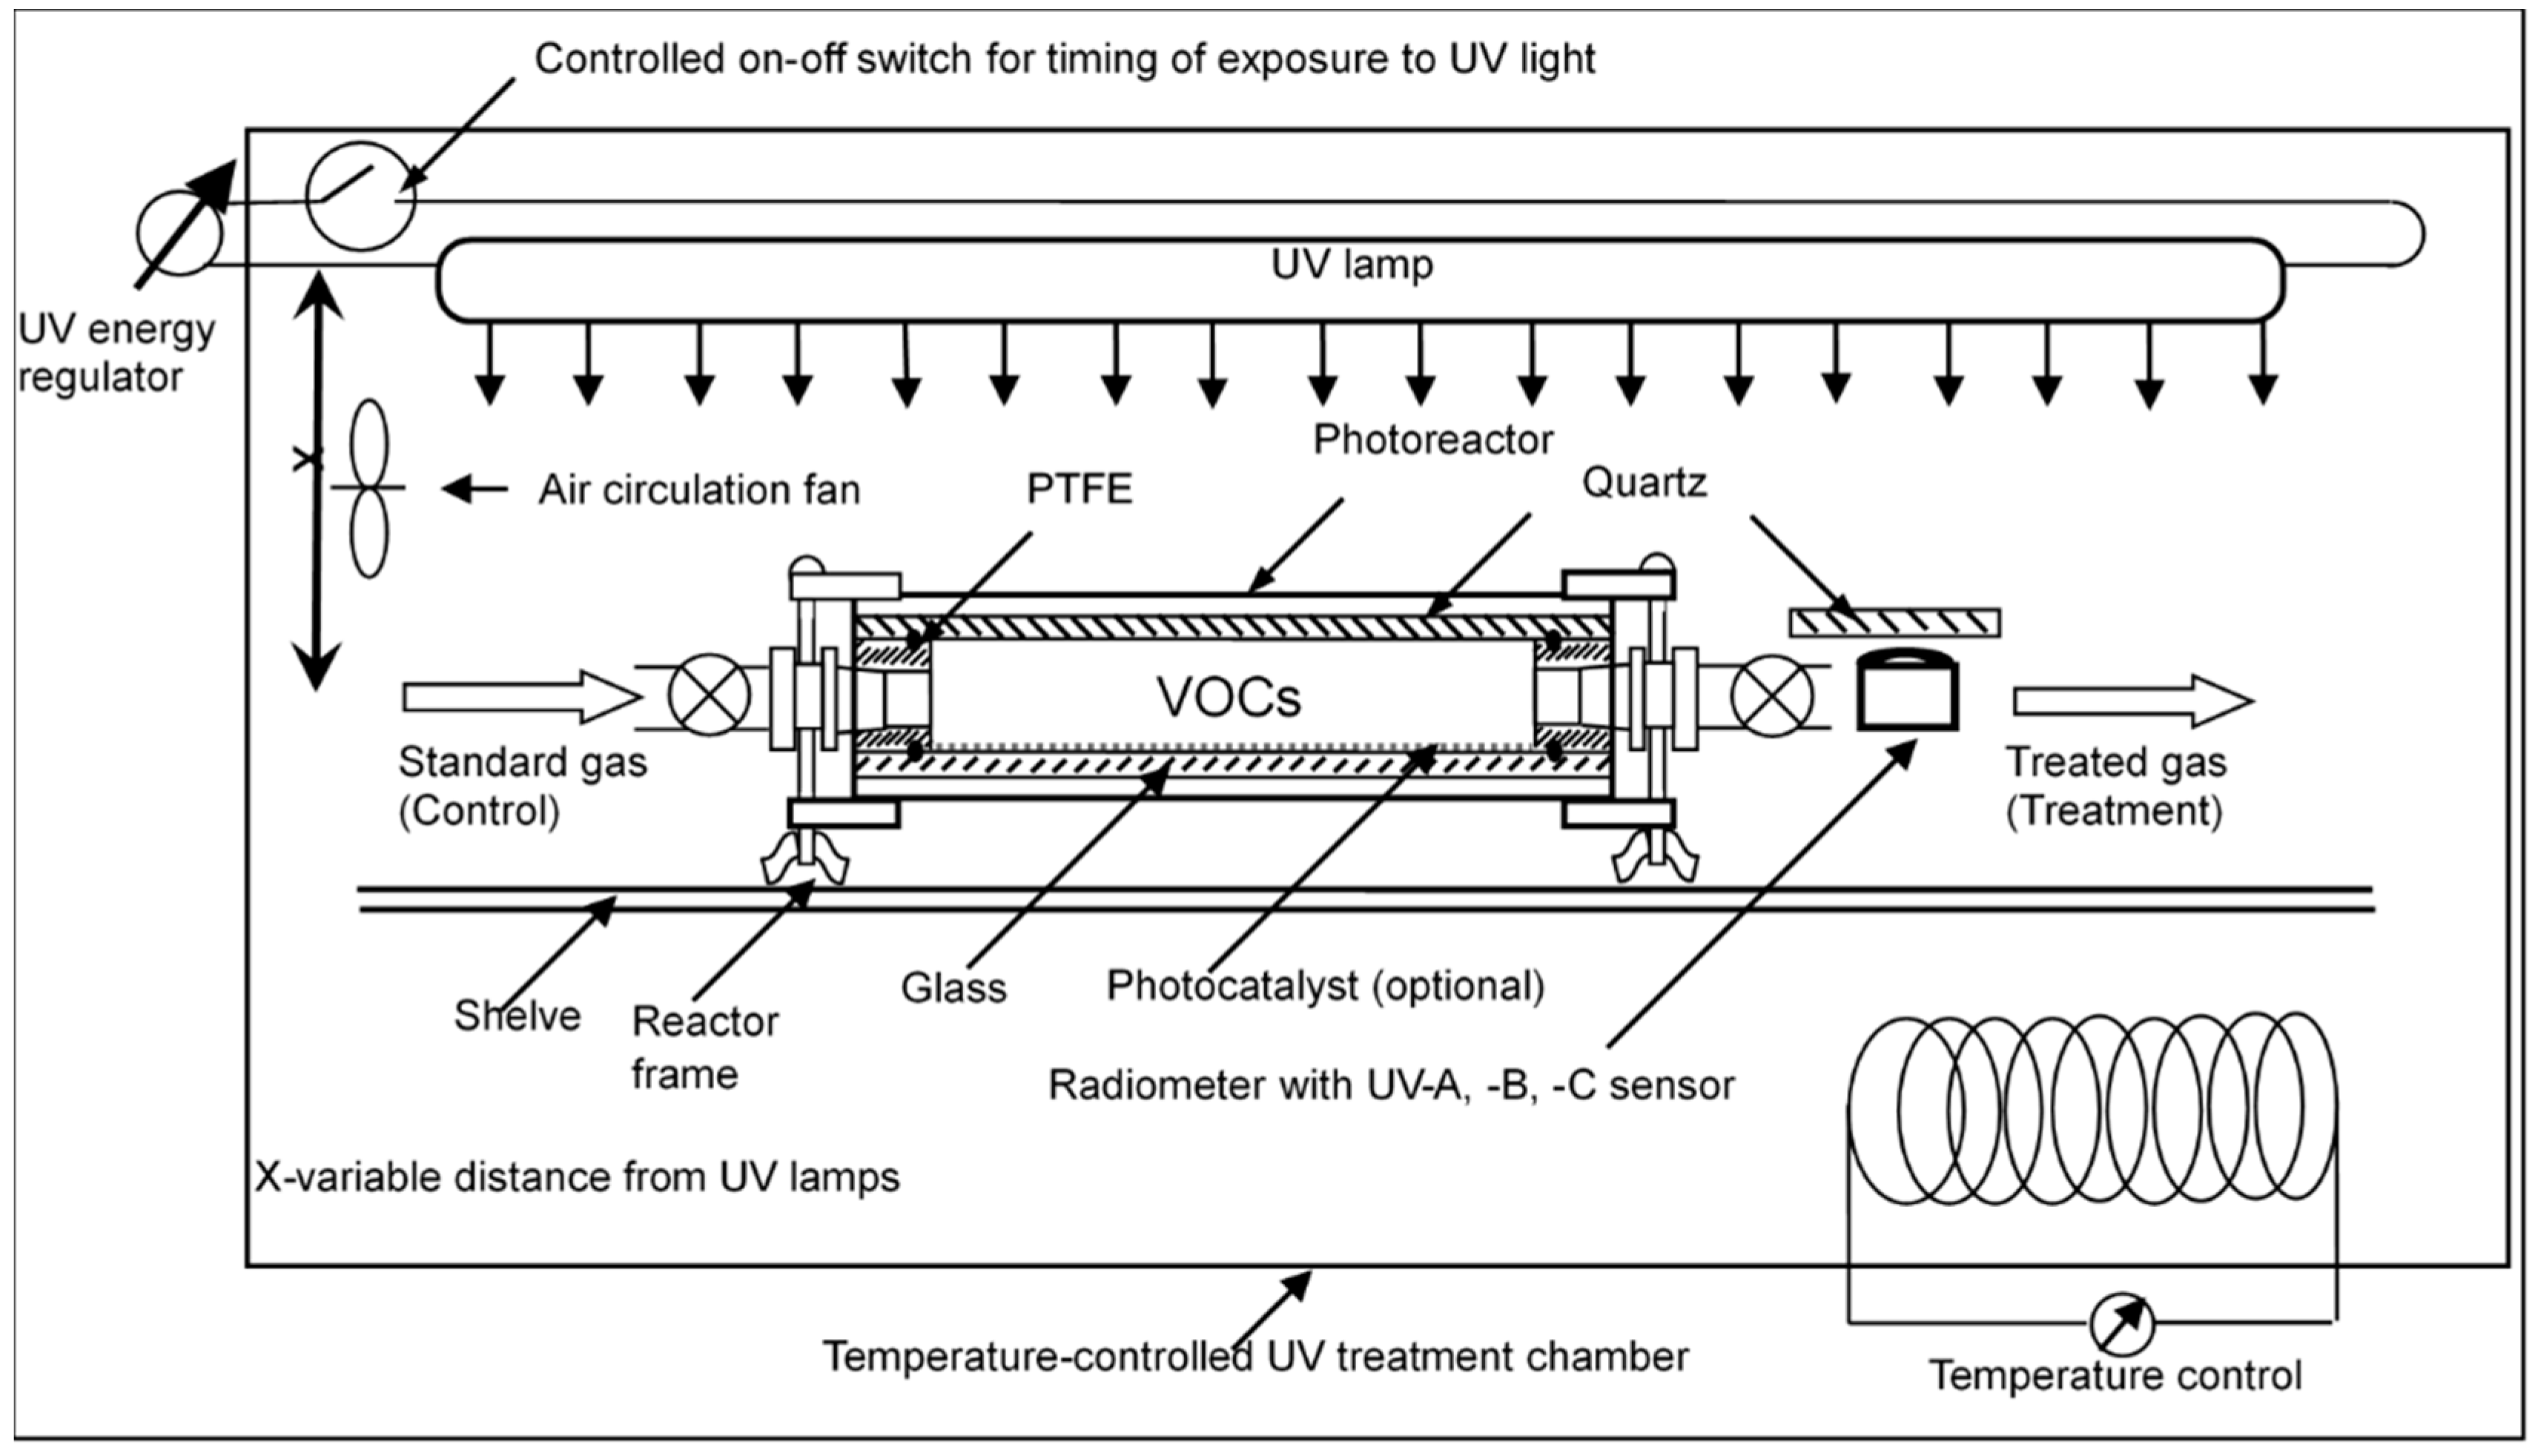
3.1. UV Photolysis and UV/TiO2 Photocatalysis of Target VOCs in a Synthetic Odorous Air Mixture

3.1.1. Generation of Synthetic Odorous Air Mixture

Nine odorous VOCs commonly cited as key compounds responsible for livestock odor were selected for preparing a synthetic air mixture [2,3,4,5,6]. These include reduced sulfur compounds (methyl mercaptan, ethyl mercaptan, dimethyl sulfide (DMS), butyl mercaptan), VFAs (acetic, propanoic, butyric and isovaleric acid), and p-cresol, all very offensive with odor detection thresholds (ODT) at the low ppbv levels (Table 3).
Concentrations of target VOCs were generated by a standard gas generation (SGG) system based on permeation technology, as described elsewhere [31,53]. A special air dilution system was assembled and tested to generate a wide range of concentrations.

3.1.2. Photolysis Treatment

A photoreactor was designed as a flow-through reaction chamber and used for the treatment of a synthetic odorous VOC air mixture (Figure 6 and a photo in Figure S9 in Supplemental Materials).
This reaction chamber was capable of testing the effects of several variables, including UV wavelength, light energy dose, relative humidity, temperature, and the presence of a catalyst. UV dose was measured with a radiometer with UV-A, -B, and -C (a.k.a. “deep” UV) sensors over the controlled treatment time. An on/off switch was used to precisely control the time of UV light-on operation. The chamber temperature was controlled at 25 ºC for all the experiments, except when the effect of temperature was tested. The synthetic gas mixture was routed from the SGG system to feed the photoreactor and remained in flow-through mode at a steady-state. The photoreactor was equipped with two toggle valves so that the photodegradation of static air tests could also be carried out. However, severe VOC adsorption and losses to the reactor surface during initial testing of static air scenarios were observed. Thus, all experiments were completed with dynamic airflows, a more realistic scenario for farm-scale applications. The dynamic airflow configuration was also easier to control per establishing steady-state conditions per the aforementioned sorption and losses. Light penetrated the reaction chamber through a quartz top side. Two sets of six 10 W UV mercury lamps (American UV Co., Lebanon, IN, USA) were used to test the effects of UV wavelength. The first group of lamps had a principal output of characteristic UV bands at 254, 312, and 365 nm, i.e., the typical output of germicidal lamps. The second set of lamps had a significant output in the 185 nm in addition to the 254, 312 and 365 nm bands. These two sets of wavelengths were designated “UV254” and “UV185+254” (“deep” UV) in this manuscript. The far UV lamps, of fused quartz, emit ultraviolet light with two peaks in the UVC band at 253.7 nm and 185 nm due to the mercury within the lamp, as well as some visible light. Ca. 90% of the UV produced by these lamps is at 253.7 nm, whereas only ca. 10% is at 185 nm [54].

3.1.3. Photocatalysis Treatment

Degussa P25 TiO2 powder (Degussa, Germany) consisting of 75% anatase and 25% rutile and a (BET) specific surface area of ~50 m2 g−1 was mixed in a proportion of 25 mg with 4 mL MeOH. The TiO2-MeOH suspension was then stirred using an ultrasonic cleaner for 5 min. After that, the suspension was transferred evenly to the bottom glass (0.127 m × 0.178 m) surface (Figure 6) using a thinly-drawn glass tube. The film-coated glass was air-dried at room temperature in a fume hood. Finally, the glass surface was irradiated with UV for 2 h to remove remaining impurities. Each time after UV treatment, photoreactors see-through “cassettes” were cleaned by desorption at high temperatures for future use. Assembled photoreactors were then checked for leaks, flushed with pure air, and connected to SGG. Constant and continuous synthetic VOC mixture flow was maintained and was long enough for adsorption of VOCs to reach equilibrium between the reactor wall, TiO2 surface, and the standard gas. This was confirmed with periodic gas sampling using solid-phase microextraction (SPME) [55]. UV lamps were used for ~4 h for the photochemical reactions to reach a steady-state.

3.2. UV Dosage and VOC Mass Conversion

The intensity of UV light (I) was measured with UV sensors capable of measuring light intensity at single wavelengths of 254, 312, and 365 nm in the experiments on synthetic VOCs mixture treatment. The light energy dose at 254 nm was selected since both sets of UV lamps had a maximum energy output at 254 nm. The UV dose (as energy per volume of treated gas, e.g., J/L) was estimated as below.
Energy used, in Joule, could be calculated from IAt, where I is the intensity in W cm−2, A the active area of the reactor in cm2, and t the time, in s. I at 254 nm is what has been used in calculations at the highest level. This was found to be 1.5 mW cm−2 (0.0015 W cm−2). The UV dose is expressed in J/L air treated, or IAt/volume, or IA/flow rate, the flow rate in L s−1. The flow rate through the lab unit was 300 mL min−1 (5 mL s−1, or 0.005 L s−1). The TiO2 coated active area of the reactor was 110 cm2 at 0.111 mg TiO2 cm−2. Substitution of IA/flow rate for a retention time of 120 s = [0.0015 W cm−2 × 110 cm2]/0.005 L s−1 = 33 J L−1, or 33 kJ m−3. Mass removed (ng) per unit of energy (J) for each target VOC was determined as a product of initial VOC concentration (ng mL−1), % VOCs removal, R (defined in Section 3.4), the photoreactor volume, divided by the dose.

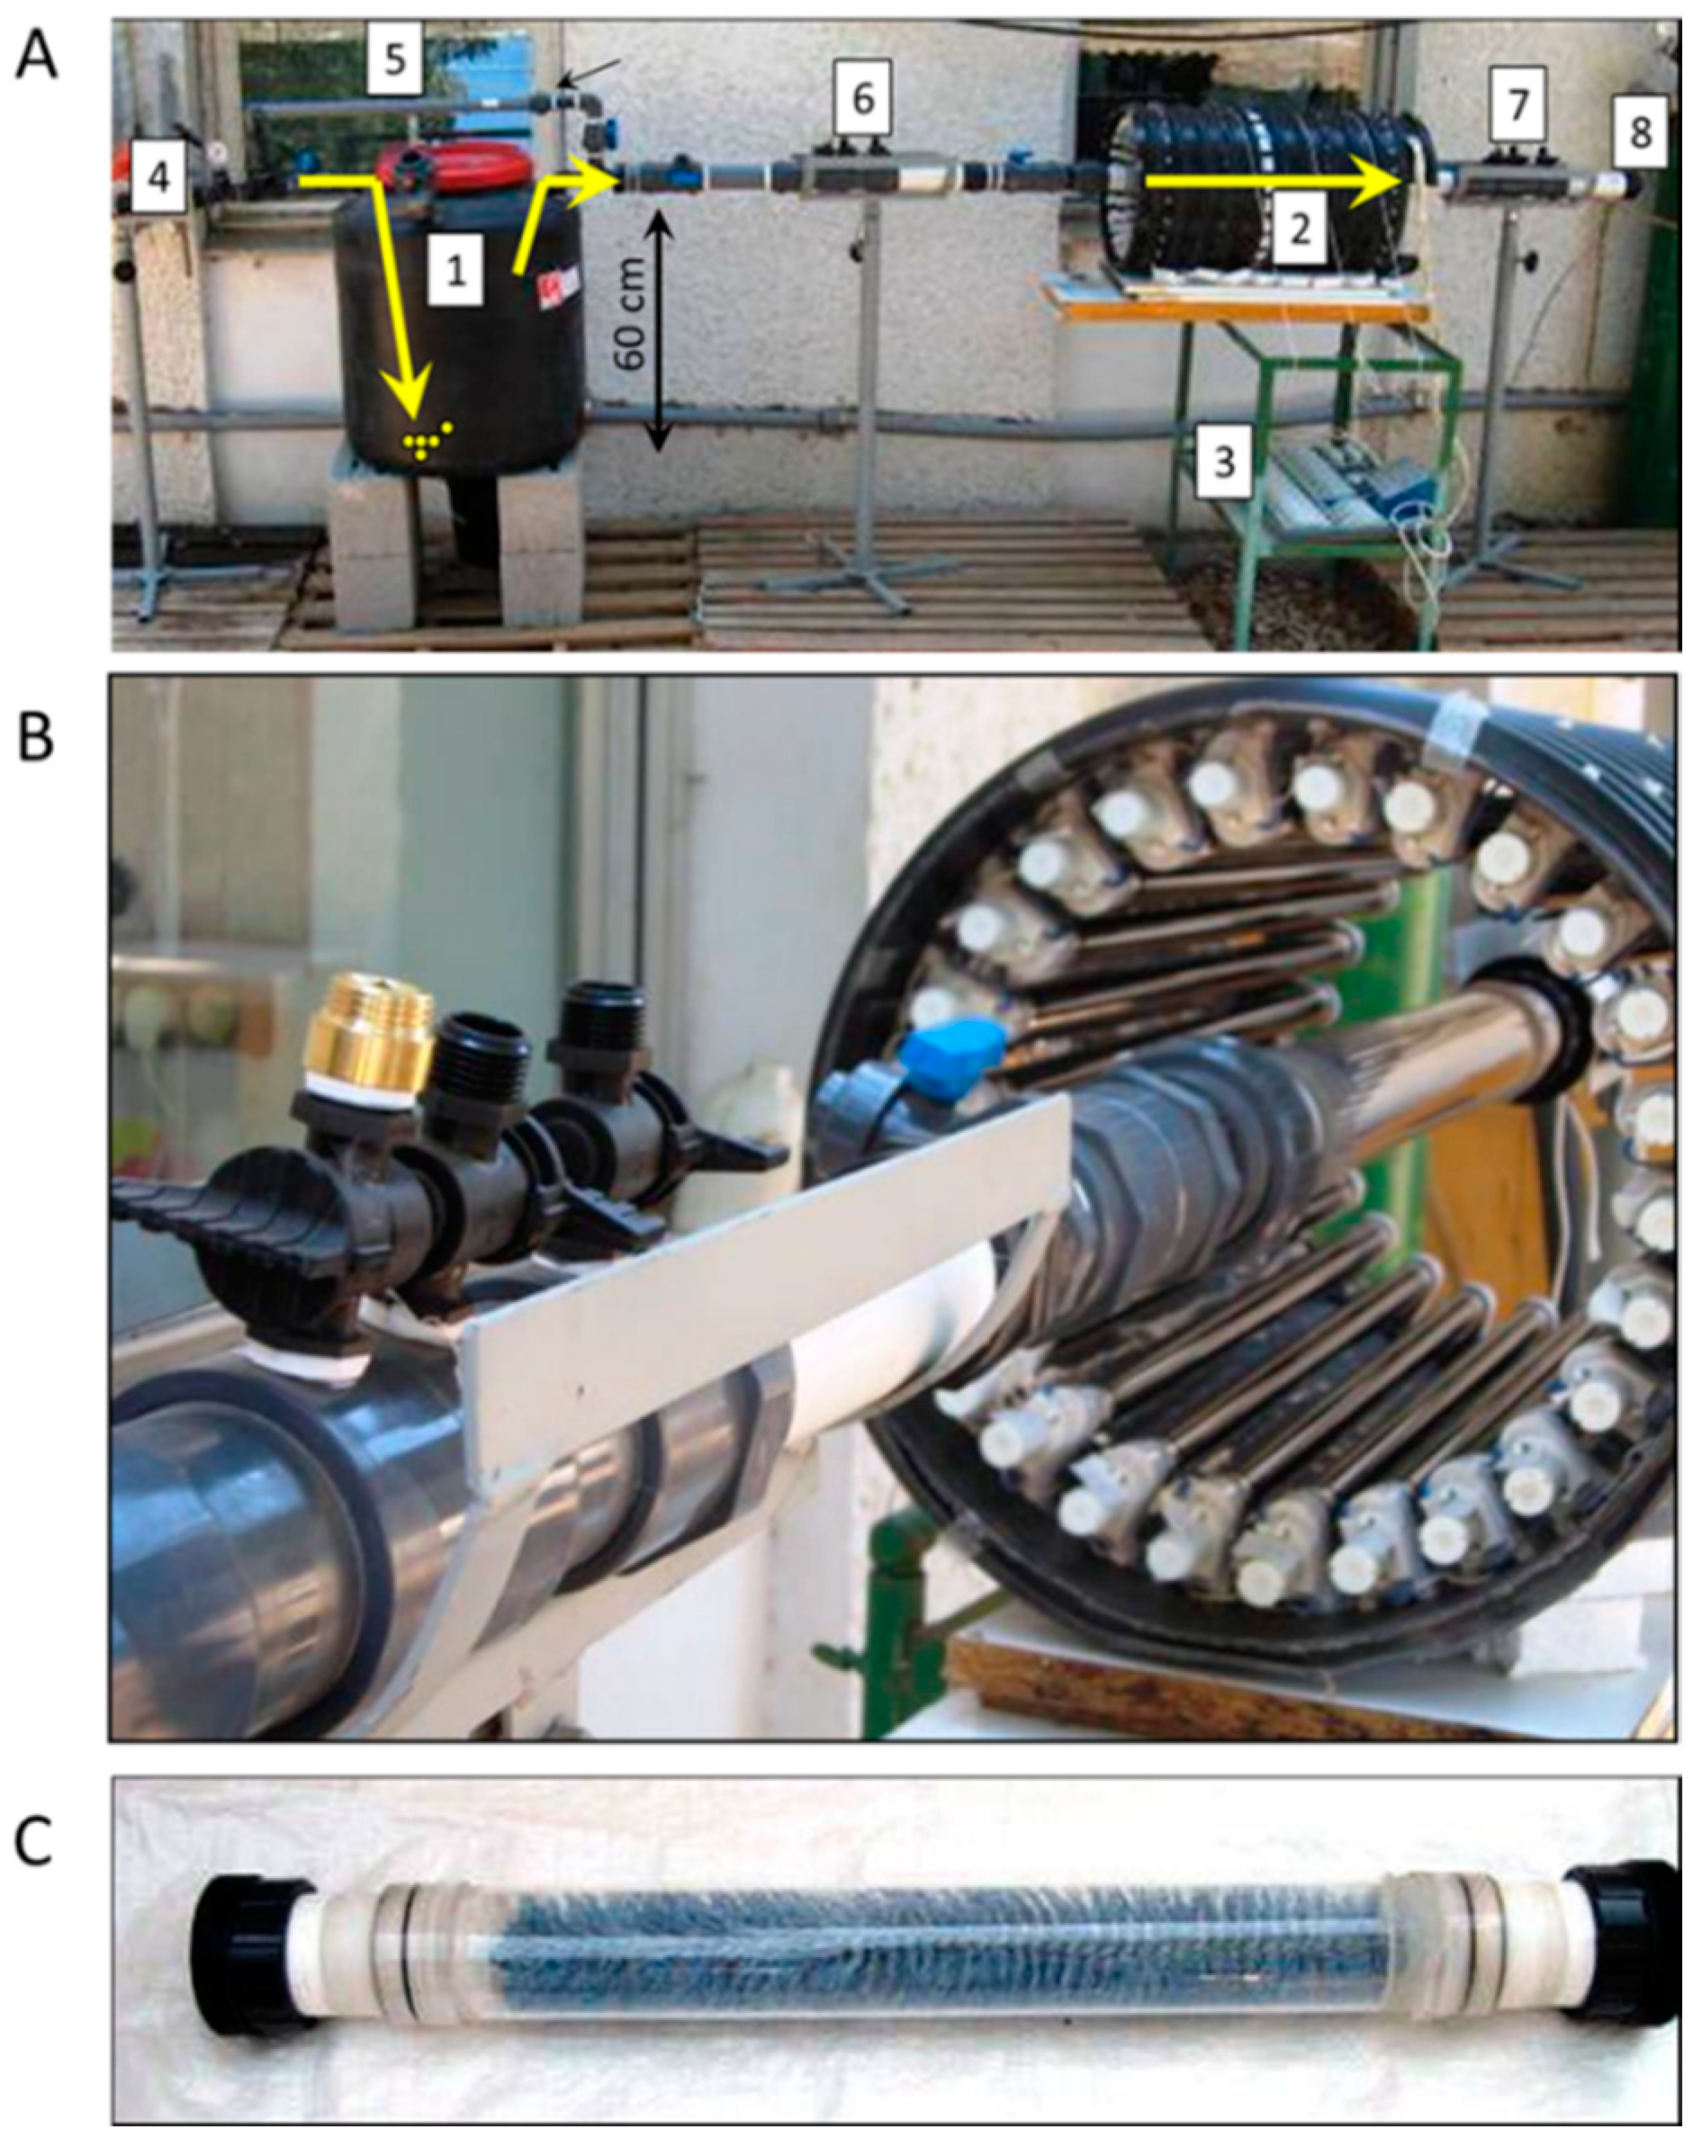
3.3. UV/TiO2 Photocatalysis of Real Poultry Atmosphere

A larger photoreactor was designed as a flow-through reaction chamber and used for the treatment of a real poultry manure atmosphere [35]. An air-purged liquid manure suspension served to prepare the desired flow-through atmosphere. Fresh manure suspensions were prepared as follows: 4 L of air-dried poultry manure (broiler farms; Ramat David and Alonim, northern Israel) were mixed with 40 L of tap water and stirred manually in a bucket. Large particles were then removed by using a 1 mm plastic mesh, and the rest of the suspension was transferred into a 200 L tank of the flow-through setup (Figure 7A). A new suspension was prepared every several weeks such that the source VOCs atmosphere varied from one experiment to another. A 60 cm long (2.5 L) photoreactor was assembled from a 5 cm diameter quartz tube surrounded by a ring of individually controlled 24 “black” UV lamps (18 W Philips TLD 18W/08; output range between 340 and 400 nm, with a peak at 365 nm; Figure 7B). An aqueous 2% TiO2 suspension (Anatase form; <10 nm particle size; HOMBIKAT UV 100; Sachtleben Chemie, Germany) was used as the catalyst. A round brush was selected to serve the large surface area for coating. The aqueous 2% TiO2 suspension was sprayed on the brush and dried using a hairdryer. This configuration was selected to enable light penetration through the hairs and to provide an extensive reacting surface for the flow-through air (Figure 7C).
Energy used for this reactor is evidently less attractive because of the geometry of the lamp layout. Thus, energy dosage was calculated from the actual irradiation received by the reactor per lamp, as follows: Each lamp distributes its light equally in all directions in cylinder shapes of increasing diameter. Of interest will be the power intensity at the distance of the reactor to the nearest light. This power intensity will be distributed over a cylinder of 0.1375 m radius (distance from lamp to the reactor) and 0.6 m (length of the lamp). Irradiated area would then be 2π × 0.1375 × 0.6 = 0.52 m2 = 5200 cm2. The input radiation intensity will be 18 W/(5200 cm2) = 0.0035 W cm−2. The radiation received will be over the projected area of the reactor = 0.6 × 0.05 m = 0.03 m2 = 300 cm2. Irradiation received by the reactor per lamp = 300 × 0.0035 W = 1.05 W. Considering output lamp efficiency of ca. 35%, the irradiation received by the reactor per lamp is 0.36 W. The much larger catalyst area obtained with the brushes (inside the reactor) is not easily determined, and this would increase the effective values of the energy input per volume of air treated. The results for this reactor have been used mainly to consider some practical aspects and how well real manure odors could potentially be removed rather than determine energy requirements.
Oil-free compressed air was used to purge the manure and flow through the system. Air sampling ports were installed before and after the reactor and included ports for SPME (VOCs), Kitagawa colorimetric tubes (NH3 and O3), and Tedlar bags (odor). The effects of energy dose were tested by manipulating either treatment time (controlled by flow rate) or light intensity (controlled by the number of lamps operated). The system was operated outside at ambient summer day temperatures (33 to 35 °C). The reactor itself was heated from the UV lamps during operation such that the air temperature at the exit of the reactor was several degrees higher than the ambient temperature. The RH of the flowing air (purged through manure suspension) was always near saturation. Before taking measurements, the setup was operated for 1 h of flow-through of the manure atmosphere. Then, lights turned on for 10 min, and measurements started.

3.4. Sampling and Analyses of Odorous VOCs and Odor

The effectiveness of treatment was defined as the percent conversion and assessed as follows:
R = (Control-Treatment)/Control × 100
where R is the percent conversion (or percent removal);
Control, Treatment = measured gas or odor concentrations for the untreated and treated gas, respectively.
Positive values of R signify removal (or conversion) while negative R signifies compound generation.
An analytical method was developed for quantification of VOCs using SPME and gas chromatography–mass spectrometry (GC-MS) [55]. Carboxen/polydimethylsiloxane (CAR/PDMS) 85 μm SPME fibers (Supelco), were used, and 5-min gas sampling time was selected based on the optimization of SPME conditions for target odorous VOCs. Untreated (control) and treated air was sampled and analyzed in triplicate to estimate the % conversion of target VOCs.
VOCs from real manure atmosphere was sampled for 30 min on a 50/30 μm divinylbenzene (DVB)/CAR/PDMS SPME (Supelco) and analyzed on a GC–MS system (GCD G1800B, Hewlett Packard) equipped with a 30 m × 0.25 mm ID capillary column (Rt-bDEXsm; Restek) [9]. Specific VOCs were identified using two criteria: (1) matching of observed retention times with those of pure compounds run as standards; (2) matching mass spectra of unknown compounds using ChemStation (version D.00.00.38) from the Agilent and National Institute for Standards and Technology 98 MS spectral library. If no standard existed, identifications were arbitrarily made for matching quality ≥ 70% [9,18]. Identified compounds were semi-quantified based on peak area counts obtained by the integration of MS response with ChemStation. Untreated (before entering the reactor) and treated air (exiting the reactor) were sampled and analyzed in duplicates to estimate the % conversion of VOCs. Kitagawa colorimetric gas detection tubes and sampling pump system were used to measure concentrations of NH3 (tubes range 5–260 ppm) and ozone (tube range 0.025–3 ppm) (Komyo Rikagaku Kogyo K.K., Kanagawa, Japan). Monitoring O3 could provide additional insight into the contribution of three processes that potentially were involved: UV photocatalysis, UV photolysis, and UV-induced ozonation.
Odor reduction was evaluated by forced-choice dynamic olfactometry. Air samples were collected with 10 L (Iowa, USA) or 60 L (ARO, Israel) Tedlar bags and analyzed within 24 h on AC’SCENT model (AC’SCENT International, St. Croix Sensory Inc., Stillwater, MN, USA) following ASABE method using four trained panelists (Iowa, USA) or on Odile 2510 (Odotech Inc., Canada) [56], using six trained panelists (ARO, Israel). Detection thresholds were calculated following the ASTM [57], Iowa State, or following the European standard EN13725 [58].

4. Conclusions

The following conclusions were drawn:
(1)
Experiments confirmed that it is feasible to substantially remove odorous VOCs with both photolysis and photocatalysis (synthetic VOCs air mixture) or photocatalysis (real manure atmosphere) during reaction times of only seconds.
(2)
For synthetic VOCs mixtures: (I) The treatment effectiveness of four treatment options followed an order of UV185+254 + TiO2 > UV254 + TiO2 > UV185+254; no catalyst > UV254; no catalyst. (II) Significant percent conversion (R) of VOCs (>80%) and linear dependence on UV dose was achieved when light energy was >60 J L−1. Up to ~80% of odor removal was also observed. (III) Deep UV (UV185+254) improved R, particularly when photolysis was the primary treatment. (IV) The use of photocatalyst (TiO2), especially at deep UV, resulted in increased R for all VOCs and VFAs particularly, whose concentrations increased from reaction intermediates. Still, the effect of catalysts and deep UV should be considered independently. (V) Mass conversion rate (mass per energy) of p-cresol, a characteristic offensive barn odor compound (78.8–111 ng J−1) among all nine odorous VOCs. (VI) No apparent effects of RH on R were observed. However, a significant decrease in VOC mass removed was observed with high RH. (VII) No apparent effects of air temperature on R were observed for p-cresol and most of the VFAs. An apparent increase of both R and mass converted was observed for mercaptans with a temperature increase to 25 °C.
(3)
For real manure atmosphere: (I) between ~80% and 100% removal of target VOCs at a treatment time of at least ~6 s was observed. (II) Ammonia removal was not effective. (III) Odor removal of 77% was observed for emission from fresh odorous manure, but no odor removal was detected at low emission from aged manure. Ozone was generated with photocatalysis. The determination of ozone contributions to the overall treatment is warranted.

Supplementary Materials

The following are available online at https://www.mdpi.com/2073-4344/10/6/607/s1, Figure S1: Effect of RH (%) on Part A) percent conversion; Part B) mass removed (ng) of target odorous VOCs and treatment with UV185+254 + TiO2. Experimental conditions: light intensity at 254 nm, 312 nm and 365 nm was 1.5, 0.230 and 0.084 mW cm−2, respectively; 25 mg TiO2; 400 mL min−1 airflow; treatment time = 28 s; CAR/PDMS 85 μm; 5 min sampling time; T = 25 °C. Figure S2: Effect of RH (%) on Part A) percent conversion; Part B) mass removed (ng) of target odorous VOCs treatment with UV185+254, no catalyst. Experimental conditions: light intensity at 254 nm, 312 nm and 365 nm was 1.5, 0.230 and 0.084 mW cm−2, respectively; 25 mg TiO2; 400 mL min−1 airflow; treatment time = 28 s; CAR/PDMS 85 μm; 5 min sampling time; T = 25 °C. Figure S3: Effect of RH (%) on Part A) percent conversion; Part B) mass removed (ng) of target odorous VOCs treatment with UV254 + TiO2. Experimental conditions: light intensity at 254 nm, 312 nm and 365 nm was 1.5, 0.230 and 0.084 mW cm−2, respectively; 25 mg TiO2; 400 mL min−1 airflow; treatment time = 28 s; CAR/PDMS 85 μm; 5 min sampling time; T = 25 °C. Figure S4: Effect of RH (%) on Part A) percent conversion; Part B) mass removed (ng) of target odorous VOCs treated with UV254, no catalyst. Experimental conditions: light intensity at 254 nm, 312 nm and 365 nm was 1.5, 0.230 and 0.084 mW cm−2, respectively; 25 mg TiO2; 400 mL min−1 airflow; treatment time = 28 s; CAR/PDMS 85 μm; 5 min sampling time; T = 25 °C. Figure S5: Effects of air temperature on Part A) percent conversion; Part B) mass removed (ng) of target odorous VOCs treated with UV185+254 + TiO2. Experimental conditions: light intensity at 254 nm, 312 nm and 365 nm was 1.5, 0.230 and 0.084 mW cm−2, respectively; 25 mg TiO2; 400 mL min−1 airflow; treatment time = 28 s; CAR/PDMS 85 μm; 5 min sampling time; RH = 30%. Figure S6: Effects of air temperature on Part A) percent conversion; Part B) mass removed (ng) of target odorous VOCs treated with UV185+254, no catalyst. Experimental conditions: light intensity at 254 nm, 312 nm and 365 nm was 1.5, 0.230 and 0.084 mW cm−2, respectively; 25 mg TiO2; 400 mL min−1 airflow; treatment time = 28 s; CAR/PDMS 85 μm; 5 min sampling time; RH = 30%. Figure S7: Effects of air temperature on Part A) percent conversion; Part B) mass removed (ng) of target odorous VOCs treated with UV254 + TiO2. Experimental conditions: light intensity at 254 nm, 312 nm and 365 nm was 1.5, 0.230 and 0.084 mW cm−2, respectively; 25 mg TiO2; 400 mL min−1 airflow; treatment time = 28 s; CAR/PDMS 85 μm; 5 min sampling time; RH = 30%. Figure S8: Effects of air temperature on Part A) percent conversion; Part B) mass removed (ng) of target odorous VOCs treated with UV254, no catalyst. Experimental conditions: light intensity at 254 nm, 312 nm and 365 nm was 1.5, 0.230 and 0.084 mW cm−2, respectively; 25 mg TiO2; 400 mL min−1 airflow; treatment time = 28 s; CAR/PDMS 85 μm; 5 min sampling time; RH = 30%. Figure S9: Flow-through photoreactor used for lab-scale UV treatment of odorous VOCs at Iowa State University. The reactor walls in contact with VOCs are made of Teflon, quartz, and glass. Table S1: UV185+254 + TiO2: summary of mass removal rates, measured gas concentrations in UV-treated gas, and percent VOC reduction. Table S2: UV185+254: summary of mass removal rates, measured gas concentrations in UV-treated gas, and percent VOC reduction. Table S3: UV254+TiO2: summary of mass removal rates, measured gas concentrations in UV-treated gas, and percent VOC reduction. Table S4: UV254: summary of mass removal rates, measured gas concentrations in UV-treated gas, and percent VOC reduction. Table S5: UV254+185 + TiO2. Linearity of percent conversion (y) and measured light energy (x) dosage at 254 nm. Table S6: Reproducibility of the effect of light energy dose on UV treatment: ranges of RSDs (%). Table S7: Reproducibility of the effect of relative humidity on UV treatment: ranges of RSDs (%). Table S8: Reproducibility of the effect of temperature on UV treatment: ranges of RSDs (%).

Author Contributions

Conceptualization, J.A.K. and Y.L.; methodology, J.A.K., Y.L., U.R., X.Y., S.Z., S.J.H., and R.A.; validation, J.A.K., J.v.L., Y.L., and W.S.J.; formal analysis, X.Y., J.A.K., J.v.L., Y.L. and W.Z.; investigation, X.Y. and S.Z.; resources, J.A.K., W.S.J., S.J.H. and J.Z.; writing—original draft preparation, X.Y. and J.A.K.; writing—review and editing, J.A.K., J.v.L., W.S.J. and Y.L.; visualization, X.Y.; supervision, J.A.K.; project administration, J.A.K. and Y.L.; funding acquisition, J.A.K., Y.L., U.R., J.Z. and W.S.J. All authors have read and agreed to the published version of the manuscript.

Funding

The authors gratefully acknowledge the financial support provided by National Pork Board (Project No. 07-091; Simultaneous treatment of odorants and pathogens by UV254 light) and the United States-Israel Binational Agricultural Research and Development (Project No. US-3999-07; Simultaneous treatment of odorants and pathogens emitted from CAFOs by catalytic photooxidation). Iowa Agriculture and Home Economics Experiment Station: Project No. IOW05556 (Future Challenges in Animal Production Systems: Seeking Solutions through Focused Facilitation) sponsored by Hatch Act and State of Iowa funds).

Acknowledgments

The technical support of Ibrahim Saadi and Yael Abbou, M.Sc. (Agricultural Research Organization, Israel) is highly appreciated.

Conflicts of Interest

The authors declare no conflict of interest. The funders had no role in the design of the study; in the collection, analyses, or interpretation of data; in the writing of the manuscript, or in the decision to publish the results.

References

  1. Akdeniz, N.; Jacobson, L.D.; Hetchler, B.P.; Bereznicki, S.D.; Heber, A.J.; Koziel, J.A.; Cai, L.; Zhang, S.; Parker, D.B. Odor and odorous chemical emissions from animal buildings: Part 2—Odor emissions. Trans. ASABE 2012, 55, 2335–2345. [Google Scholar] [CrossRef]
  2. Cai, L.; Koziel, J.A.; Zhang, S.; Heber, A.J.; Cortus, E.L.; Parker, D.B.; Hoff, S.J.; Sun, G.; Heathcote, K.Y.; Jacobson, L.D.; et al. Odor and odorous chemical emissions from animal buildings: Part 3—Chemical emissions. Trans. ASABE 2015, 58, 1333–1347. [Google Scholar] [CrossRef] [Green Version]
  3. Parker, D.B.; Koziel, J.A.; Cai, L.; Jacobson, L.; Akdeniz, N.; Bereznicki, S.; Lim, T.T.; Caraway, E.; Zhang, S.; Hoff, S.J.; et al. Odor and odorous chemical emissions from animal buildings: Part 6—Odor activity value. Trans. ASABE 2012, 55, 2357–2368. [Google Scholar] [CrossRef]
  4. Zhang, S.; Cai, L.; Koziel, J.A.; Hoff, S.; Schmidt, D.; Clanton, C.; Jacobson, L.; Parker, D.; Heber, A. Field air sampling and simultaneous chemical and sensory analysis of livestock odorants with sorbent tube GC-MS/Olfactometry. Sens. Actuators B Chem. 2010, 146, 427–432. [Google Scholar] [CrossRef]
  5. Trabue, S.; Scoggin, K.; Li, H.; Burns, R.; Xin, H.; Hatfield, J. Speciation of volatile organic compounds from poultry production. Atmos. Environ. 2010, 44, 3538–3546. [Google Scholar] [CrossRef] [Green Version]
  6. Lo, Y.C.; Koziel, J.A.; Cai, L.; Hoff, S.J.; Jenks, W.S.; Xin, H. Simultaneous chemical and sensory characterization of VOCs and semi-VOCs emitted from swine manure using SPME and multidimensional gas chromatography-mass spectrometry-olfactometry system. J. Environ. Qual. 2008, 37, 521–534. [Google Scholar] [CrossRef]
  7. Woodbury, B.L.; Gilley, J.E.; Parker, D.B.; Marx, D.B.; Eigenberg, R.A. VOC emissions from beef feedlot pen surfaces as affected by within-pen location, moisture and temperature. Biosyst. Eng. 2015, 134, 31–41. [Google Scholar] [CrossRef] [Green Version]
  8. Shaw, S.L.; Mitloehner, F.M.; Jackson, W.; Depeters, E.J.; Fadel, J.G.; Robinson, P.H.; Holzinger, R.; Goldstein, A. Volatile organic compound emissions from dairy cows and their waste as measured by proton-transfer-reaction mass spectrometry. Environ. Sci. Technol. 2007, 41, 1310–1316. [Google Scholar] [CrossRef]
  9. Laor, Y.; Koziel, J.A.; Cai, L.; Ravid, U. Enhanced characterization of dairy manure odor by time-increased headspace solid phase microextraction and multidimensional gas chromatography–mass spectrometry-olfactometry. J. Air Waste Manag. Assoc. 2008, 58, 1187–1197. [Google Scholar] [CrossRef] [Green Version]
  10. Hales, K.E.; Parker, D.B.; Cole, N.A. Potential odorous volatile organic compound emissions from feces and urine from cattle fed corn-based diets with wet distillers grains and solubles. Atmos. Environ. 2012, 60, 292–297. [Google Scholar] [CrossRef]
  11. McGinn, S.M.; Janzen, H.H.; Coates, T. Atmospheric ammonia, volatile fatty acids, and other odorants near beef feedlots. J. Environ. Qual. 2003, 32, 1173–1182. [Google Scholar] [CrossRef] [PubMed]
  12. Feilberg, A.; Liu, D.; Adamsen, A.P.; Hansen, M.J.; Jonassen, K.E. Odorant emissions from intensive pig production measured by on-line proton-transfer-reaction mass spectrometry. Environ. Sci. Technol. 2010, 44, 5894–5900. [Google Scholar] [CrossRef] [PubMed]
  13. Ngwabie, N.; Schade, G.; Custer, T.; Hinz, S. Abundance and fluxes estimates of volatile organic compounds from a dairy cowshed in Germany. J. Environ. Qual. 2008, 37, 565–573. [Google Scholar] [CrossRef] [PubMed]
  14. Bulliner, E.A.; Koziel, J.A.; Cai, L.; Wright, D. Characterization of livestock odors using steel plates, solid phase microextraction, and multidimensional—gas chromatography-mass spectrometry-olfactometry. J. Air Waste Manag. Assoc. 2006, 56, 1391–1403. [Google Scholar] [CrossRef] [PubMed] [Green Version]
  15. Cai, L.; Koziel, J.A.; Davis, J.; Lo, Y.C.; Xin, H. Characterization of VOCs and odors by in vivo sampling of beef cattle rumen gas using SPME and GC-MS-olfactometry. Anal. Bioanal. Chem. 2006, 386, 1791–1802. [Google Scholar] [CrossRef] [PubMed] [Green Version]
  16. Cai, L.; Koziel, J.A.; Nguyen, A.T.; Liang, Y.; Xin, H. Evaluation of zeolite for control of odorants emissions from simulated poultry manure storage. J. Environ. Qual. 2007, 36, 184–193. [Google Scholar] [CrossRef] [Green Version]
  17. Koziel, J.A.; Cai, L.; Wright, D.; Hoff, S.J. Solid-phase microextraction as a novel air sampling technology for improved, GC-Olfactometry-based, assessment of livestock odors. J. Chromatogr. Sci. 2006, 44, 451–457. [Google Scholar] [CrossRef] [Green Version]
  18. Varma, V.S.; Shabtay, A.; Yishay, M.; Mizrahi, I.; Shterzer, N.; Freilich, S.; Medina, S.; Agmon, R.; Laor, Y. Diet supplementation with pomegranate peel extract altered odorants emission from fresh and incubated calves’ feces. Front. Sustain. Food Syst. 2018, 2, 33. [Google Scholar] [CrossRef]
  19. Schaefer, J. Sampling, characterization and analysis of malodours. Agric. Environ. 1977, 3, 121–127. [Google Scholar] [CrossRef]
  20. Willig, S.; Lacorn, M.; Claus, R. Development of a rapid and accurate method for the determination of key compounds of pig odor. J. Chromatogr. A 2004, 1038, 11–18. [Google Scholar] [CrossRef]
  21. Maurer, D.; Koziel, J.A.; Harmon, J.D.; Hoff, S.J.; Rieck-Hinz, A.M.; Andersen, D.S. Summary of performance data for technologies to control gaseous, odor, and particulate emissions from livestock operations: Air Management Practices Assessment Tool (AMPAT). Data Brief 2016, 7, 1413–1429. [Google Scholar] [CrossRef] [PubMed] [Green Version]
  22. Wi, J.; Lee, S.; Kim, E.; Lee, M.; Koziel, J.A.; Ahn, H. Evaluation of Semi-Continuous Pit Manure Recharge System Performance on Mitigation of Ammonia and Hydrogen Sulfide Emissions from a Swine Finishing Barn. Atmosphere 2019, 10, 170. [Google Scholar] [CrossRef] [Green Version]
  23. Maurer, D.; Koziel, J.; Kalus, K.; Andersen, D.; Opalinski, S. Pilot-scale testing of non-activated biochar for swine manure treatment and mitigation of ammonia, hydrogen sulfide, odorous volatile organic compounds (VOCs), and greenhouse gas emissions. Sustainability 2017, 9, 929. [Google Scholar] [CrossRef] [Green Version]
  24. Parker, D.B.; Hayes, M.; Brown-Brandl, T.; Woodbury, B.; Spiehs, M.; Koziel, J.A. Surface application of soybean peroxidase and calcium peroxide for reducing odorous VOC emissions from swine manure slurry. Appl. Eng. Agric. 2016, 32, 389–398. [Google Scholar]
  25. Kalus, K.; Opaliński, S.; Maurer, D.; Rice, S.; Koziel, J.A.; Korczyński, M.; Dobrzański, Z.; Kołacz, R.; Gutarowska, B. Odour reducing microbial-mineral additive for poultry manure treatment. Front. Environ. Sci. Eng. 2017, 11, 7. [Google Scholar] [CrossRef] [Green Version]
  26. Maurer, D.L.; Koziel, J.A.; Bruning, K.; Parker, D.B. Farm-scale testing of soybean peroxidase and calcium peroxide for surficial swine manure treatment and mitigation of odorous VOCs, ammonia and hydrogen sulfide emissions. Atmos. Environ. 2017, 166, 467–478. [Google Scholar] [CrossRef] [Green Version]
  27. Parker, D.B.; Pandrangi, S.; Greene, L.; Almas, L.; Cole, N.; Rhoades, M.; Koziel, J. Rate and frequency of urease inhibitor application for minimizing ammonia emissions from beef cattle feedyards. Trans. ASAE 2005, 48, 787–793. [Google Scholar] [CrossRef]
  28. Parker, D.B.; Rhoades, M.B.; Koziel, J.A.; Baek, B.-H.; Waldrip, H.M.; Todd, R.W. Urease inhibitor for reducing ammonia emissions from an open-lot beef cattle feedyard in the Texas High Plains. Appl. Eng. Agric. 2016, 32, 823–832. [Google Scholar]
  29. Chen, L.; Hoff, S.; Cai, L.; Koziel, J.; Zelle, B. Evaluation of wood chip-based biofilters to reduce odor, hydrogen sulfide, and ammonia from swine barn ventilation air. J. Air Waste Manag. Assoc. 2009, 59, 520–530. [Google Scholar] [CrossRef]
  30. Chen, L.; Hoff, S.J.; Koziel, J.A.; Cai, L.; Zelle, B.; Sun, G. Performance evaluation of a wood-chip based biofilter using solid-phase microextraction and gas chromatography–mass spectroscopy–olfactometry. Bioresour. Technol. 2008, 99, 7767–7780. [Google Scholar] [CrossRef] [Green Version]
  31. Yang, X.; Koziel, J.A.; Cai, L.; Hoff, S.J.; Harmon, J.D.; van Leeuwen, H.; Jenks, W.S.; Jeffrey, J.; Zimmerman, J.J.; Cutler, T.D. Novel Treatment of VOCs and Odor Using Photolysis. In Proceedings of the 2007 ASABE Annual International Meeting, Minneapolis, MN, USA, 17–20 June 2007. Paper No. 074139. [Google Scholar]
  32. Yang, X.; Koziel, J.A.; Cutler, T.; van Leeuwen, H.; Zhang, S.; Hoff, S.J.; Jenks, W.; Zimmerman, J. Treatment of Livestock Odor and Pathogens with Ultraviolet Light. In Proceedings of the 2008 ASABE Annual International Meeting, Providence, RI, USA, 29 June–2 July 2008. Paper No. 085198. [Google Scholar]
  33. Laor, Y.; Ravid, U.; Amon, R.; Saadi, I.; Ozer, Y.; Koziel, J.A.; Yang, X. UV-TiO2 treatment of odorants and odors associated with poultry manure. Chem. Eng. Trans. 2010, 23, 321–326. [Google Scholar]
  34. Zhu, W.; Koziel, J.A.; Maurer, D.L. Mitigation of livestock odors using a black light and a new titanium dioxide-based catalyst: Proof-of-concept. Atmosphere 2017, 8, 103. [Google Scholar] [CrossRef] [Green Version]
  35. Maurer, D.L.; Koziel, J.A. On-farm pilot-scale testing of black ultraviolet light and photocatalytic coating for mitigation of odor, odorous VOCs, and greenhouse gases. Chemosphere 2019, 221, 778–784. [Google Scholar] [CrossRef]
  36. Guarino, M.; Costa, A.; Porro, M. Photocatalytic TiO2 coating-to reduce ammonia and greenhouse gases concentration and emission from animal husbandries. Bioresour. Technol. 2008, 99, 2650–2658. [Google Scholar] [CrossRef] [PubMed]
  37. Costa, A.; Chiarello, G.L.; Selli, E.; Guarino, M. Effects of TiO2 based photocatalytic paint on concentrations and emissions of pollutants and on animal performance in a swine weaning unit. J. Environ. Manag. 2012, 96, 86–90. [Google Scholar] [CrossRef] [PubMed]
  38. Rockafellow, E.M.; Koziel, J.A.; Jenks, W.S. UV treatment of ammonia for livestock and poultry barn exhaust applications. J. Environ. Qual. 2012, 41, 281–288. [Google Scholar] [CrossRef] [Green Version]
  39. Lee, M.; Wi, J.; Koziel, J.A.; Ahn, H.; Li, P.; Chen, B.; Meiirkhanuly, Z.; Banik, C.; Jenks, W. Effects of UV-A Light Treatment on Ammonia, Hydrogen Sulfide, Greenhouse Gases, and Ozone in Simulated Poultry Barn Conditions. Atmosphere 2020, 11, 283. [Google Scholar] [CrossRef] [Green Version]
  40. Liu, Z.; Murphy, J.P.; Maghirang, R.; DeRouchey, J. Mitigation of Air Emissions from Swine Buildings through the Photocatalytic Technology using UV/TiO2. In Proceedings of the ASABE 2015 Annual International Meeting, New Orleans, LA, USA, 26–29 July 2015. Paper No. 152189332. [Google Scholar]
  41. Cutler, T.; Wang, C.; Qin, Q.; Zhou, F.; Warren, K.; Yoon, K.-J.; Hoff, S.J.; Ridpath, J.; Zimmerman, J. Kinetics of UV254 inactivation of selected viral pathogens in a static system. J. Appl. Microbiol. 2011, 111, 389–395. [Google Scholar] [CrossRef] [Green Version]
  42. Herrmann, J.M. Heterogeneous photocatalysis: State of the art and present applications. Top. Catal. 2005, 34, 49–65. [Google Scholar] [CrossRef]
  43. Jo, W.K. Coupling of titania with multiwall carbon nanotubes for decomposition of gas-phase pollutants under simulated indoor conditions. J. Air Waste Manag. Assoc. 2013, 63, 963–970. [Google Scholar] [CrossRef]
  44. Hajimohammadi, M.; Schwarzinger, C.; Knör, G. Controlled multistep oxidation of alcohols and aldehydes to carboxylic acids using air, sunlight and a robust metalloporphyrin sensitizer with a pH-switchable photoreactivity. RSC Adv. 2012, 2, 3257–3260. [Google Scholar] [CrossRef]
  45. Cao, L.X.; Gao, Z.; Suib, S.L.; Obee, T.N.; Hay, S.O.; Freihaut, J.D. Photocatalytic oxidation of toluene on nanoscale TiO2 catalysts: Studies of deactivation and regeneration. J. Catal. 2000, 196, 253–261. [Google Scholar] [CrossRef]
  46. Haagen-Smit, A.J. Chemistry and physiology of LA smog. Ind. Eng. Chem. Res. 1952, 44, 1342–1346. [Google Scholar] [CrossRef]
  47. Seinfeld, J.H.; Committee on Tropospheric Ozone Formation and Measurement; Board on Environmental Studies and Toxicology; Board on Atmospheric Sciences and Climate; Commission on Geosciences, Environment, and Resources, National Research Council. Rethinking the Ozone Problem in Urban and Regional Air Pollution; National Academy Press: Washington, DC, USA, 1991; Available online: https://www.nap.edu/read/1889/chapter/1 (accessed on 22 April 2020).
  48. Kebede, M.A.; Varner, M.E.; Scharko, N.K.; Gerber, R.B.; Raff, J.D. Photooxidation of ammonia on TiO2 as source of NO and NO2 under atmospheric conditions. J. Am. Chem. Soc. 2013, 135, 8606–8615. [Google Scholar] [CrossRef] [PubMed]
  49. Monge, M.E.; George, C.; D’Anna, B.; Doussin, J.F.; Jammoul, A.; Wang, J.; Eyglunent, G.; Solignac, G.; Daele, V.; Mellouki, A. Ozone formation from illuminated titanium dioxide surfaces. J. Am. Chem. Soc. 2010, 132, 8234–8235. [Google Scholar] [CrossRef]
  50. Devos, M.; Patte, F.; Rouault, J.; Laffort, P.; Van Gemert, L.J. Standardized Human Olfactory Thresholds; Oxford University Press: New York, NY, USA, 1990. [Google Scholar]
  51. Flavornet. Available online: http://www.flavornet.org/ (accessed on 22 April 2020).
  52. LRI. Available online: http://www.odour.org.uk/ (accessed on 22 April 2020).
  53. Spinhirne, J.P.; Koziel, J.A. Generation and calibration of standard gas mixtures for volatile fatty acids using permeation tubes and solid phase microextraction. Trans. ASABE 2003, 46, 1639–1646. [Google Scholar] [CrossRef]
  54. Zoschke, K.; Börnick, H.; Worch, E. Vacuum-UV radiation at 185 nm in water treatment—A review. Water Res. 2014, 52, 131–145. [Google Scholar] [CrossRef]
  55. Yang, X.; Zhu, W.; Koziel, J.A.; Cai, L.; Jenks, W.; Laor, Y.; van Leeuwen, H.; Hoff, S.J. Improved quantification of livestock associated odorous volatile organic compounds in a standard flow-through system using solid-phase microextraction and gas chromatography—mass spectrometry. J. Chromatogr. A 2015, 1414, 31–40. [Google Scholar] [CrossRef] [Green Version]
  56. Laor, Y.; Parker, D.; Pagé, T. Measurement, prediction, and monitoring of odors in the environment: A critical review. Rev. Chem. Eng. 2014, 30, 139–166. [Google Scholar] [CrossRef]
  57. ASTM. E697-91 Standard practice for determining odor and taste thresholds by force-choice concentration series method of limits. In Annual Book of ASTM Standards; American Society for Testing and Materials (ASTM): Philadelphia, PA, USA, 2001. [Google Scholar]
  58. CEN. EN13725:2003 Determination of Odor Concentration by Dynamic Olfactometry; European Committee for Standardization: Brussels, Belgium, 2003. [Google Scholar]
Figure 1. Treatment of target odorous VOCs in a synthetic mixture with UV lights of 254 nm and 185 nm outputs. Effects of light energy dosage (at different treatment times) on VOC percent conversion, R: (A) UV185+254 + TiO2 (treatment mainly via photocatalysis); (B) UV185+254; no catalyst (treatment mainly via photolysis). Experimental conditions: UV intensity at 254, 312 and 395 nm was 1.5, 0.23, and 0.084 mW cm−2, respectively; 25 mg TiO2; T = 25 °C; dry air; sampling conditions: 5 min solid-phase microextraction (SPME) sampling time with CAR/PDMS 85 μm. The light energy dosage is based on the output at 254 nm only.
Catalysts 10 00607 g001
Figure 2. Treatment of target odorous VOCs in a synthetic mixture with UV lights of 254 nm principal output (i.e., no deep UV 185 nm output). Effects of measured light energy dosage (at different treatment times) on VOC percent conversion, R: (A) UV254 + TiO2 (treatment mainly via photocatalysis); (B) UV254, no catalyst (treatment mainly via photolysis). Experimental conditions: UV intensity at 254 nm, 312 nm and 365 nm was 1.5, 0.230, and 0.084 mW cm−2, respectively; 25 mg TiO2; T = 25 °C; dry air; sampling conditions: 5 min SPME sampling time with CAR/PDMS 85 μm. The light energy dosage is based on the output at 254 nm only.
Catalysts 10 00607 g002
Figure 3. Treatment of target odorous VOCs in a synthetic mixture with UV lights of 254 nm and 185 nm outputs. Effect of UV light intensity (obtained by the varying distance between the UV lamps and the photoreactor) on % conversion R of odorous VOCs in a synthetic mixture. (A) UV185+254 + TiO2 (treatment mainly via photocatalysis); (B) UV185+254; no catalyst (treatment mainly via photolysis). Experimental conditions: 25 mg TiO2 for UV185+254 + TiO2 treatment; T = 25 °C; dry air; sampling conditions: 5 min gas sampling time with CAR/PDMS 85 μm SPME.
Catalysts 10 00607 g003
Figure 4. Total odor reduction (expressed as odor detection thresholds (ODT)) as a function of measured UV energy dosage at 254 nm (obtained at different treatment time). The ODT of each air sample was assessed by at least 4 trained panelists using a forced-choice dynamic-dilution olfactometer at Iowa State University.
Catalysts 10 00607 g004
Figure 5. The effect of light energy dosage on VOC conversion rates (A) varying treatment time (s); (B) varying light intensity (number of UV lamps in use). Percent reduction represents the reduction in chromatographic peak area obtained by SPME-GC–MS (gas sampling time: 30 min). If peaks reduced below detection, they were considered as 1000 area counts for reduction calculations. For acetic acid (A; inset), data points in circles are for nondetected values before treatment (i.e., the peak area of 1000) and peak areas two orders of magnitudes larger after treatment (R is out of scale). Light energy dosage was calculated from the actual irradiation received by the reactor per lamp and ca. 35% lamp efficiency.
Catalysts 10 00607 g005
Figure 6. A scheme of the lab-scale UV photoreactor (0.57 L) in a temperature-controlled chamber. The system includes a data acquisition system for (1) UV lamp status and electric voltage and current; (2) UV light intensity; and (3) light intensity controlled with distance “x” between the lamp and treated air.
Catalysts 10 00607 g006
Figure 7. UV/TiO2 photocatalysis of real poultry atmosphere. (A) Pilot-scale setup: 1. A 200 L tank containing 40 L of poultry manure suspension; 2. Lamp cover; 3. UV lamp control board; 4. Compressed air inlet; 5. Manure bypass; 6 and 7. Gas sampling ports (before and after treatment); 8. Exit of treated air. (B) A 2.5 L (2” diameter) quartz tube reactor surrounded by individually controlled 24 UV lamps. (C) TiO2-coated brush inside the quartz reactor, shown in (B).
Catalysts 10 00607 g007
Table 1. Statistical analyses. Effects of UV wavelength and catalyst on treatment effectiveness (expressed as R). The table represents p-values of paired t-tests. Bold fonts indicate no statistical significance (p ≤ 0.05).
Compound Namep-Values of Paired t-Test
Effect of Deep UV (UV185+254)Effect of Catalyst
UV185+254 > UV254 (with TiO2)UV185+254 > UV254 (no catalyst)TiO2 > No TiO2 (UV185+254)TiO2 > No TiO2 (UV254)
Methyl mercaptan0.0230.0010.00330.000041
Ethyl mercaptan0.0190.001630.00770.0004
Dimethyl sulfide0.0520.00270.00790.0011
Butyl mercaptan0.0210.00720.0280.0093
Acetic acid0.210.00310.00370.0045
Propanoic acid0.100.170.00210.0081
Butyric acid0.240.170.00460.0041
Isovaleric acid0.120.230.00670.0013
p-Cresol0.0080.0070.0850.0022
Table 2. Summary of mass removal rates per unit of input UV energy (ng J−1; nmole J−1).
Compound NameUV185+254 + TiO2UV185+254,
No Catalyst
UV254 + TiO2UV254,
No Catalyst
ng J−1nmole J−1ng J−1nmole J−1ng J−1nmole J−1ng J−1nmole J−1
Methyl mercaptan4.720.1005.230.1114.430.09431.200.0255
Ethyl mercaptan14.60.23615.60.25213.60.2194.040.0652
Dimethyl sulfide4.940.07964.490.07244.320.06971.480.0239
Butyl mercaptan8.680.09659.370.1049.460.1053.760.0418
Acetic acid11.60.193−12.0−0.20011.30.188−3.61−0.0601
Propanoic acid8.650.117−0.326−0.004408.410.114−1.38−0.0186
Butyric acid15.70.1791.250.014216.20.184−0.299−0.00340
Isovaleric acid49.20.4829.990.097949.90.48912.00.1174
p-Cresol78.80.73098.00.9071111.0394.00.870
Experimental conditions: 25 mg TiO2 for treatment with a catalyst; 300 mL min−1 airflow (equivalent to treatment time of 1.9 min); T = 25 °C; dry air. Measured light intensity.
Table 3. Odor characteristics of target odorous VOCs used to prepare a synthetic air mixture.
VOCsODT a in Air
(ppbv) [50]
Odor Descriptor
Flavornet [51]LRI [52]
Methyl mercaptan1.05sulfur, gasoline, garlicrotten cabbage, sulfurous
Ethyl mercaptan1.07N/Aearthy, egg, garlic, onion
Dimethyl sulfide2.24cabbage, sulfur, gasolineasparagus, cabbage, sulfurous
Butyl mercaptan1.41N/Adiffusive, skunky, sulfurous
Acetic acid363souracetic, vinegar
Propanoic acid35.5pungent, rancid, soyN/A
Butyric acid3.89rancid, cheese, sweatbutter, cheese, musty, oily
Isovaleric acid2.45sweat, acid, rancidcheese, old hop, old socks, sweaty
p-Cresol1.86medicine, phenol, smokemedicinal, phenolic, smoky, tarry
a ODT, odor detection threshold, N/A = not available.

