1. Introduction
Catalytic cracking of light liquid feed to produce light olefins has emerged as a new technology to compete with existing thermal cracking, that is, capex and energy intensive, technology. Kellogg Brown & Root International (KBR), Inc. recently announced contracts awarded to license K-COT
TM technology to Lihuayi Lijin Refining and Chemical Co., Ltd. for a new olefins production unit [
1]. The catalytic cracking technology of light liquid feed has the versatility to produce light olefins with a different ethene to propene ratio depending on the feed composition and operating conditions. A solid acid catalyst, modified ZSM-5 based, is employed at a moderately high temperature (~650 °C) but much less than that of thermal cracking. Zeolites are microporous materials made of alumina [AlO
4]
− and silica tetrahedra known as primary building blocks. The catalytic activities stem from the Bronsted acid sites (BAS) generated when the negative charge on alumina is compensated by a proton at the oxygen connecting the aluminum with the silicon (Al–OH–Si) [
2]. The aluminum in the as-made zeolites has tetrahedral coordination but can be altered during the catalyst activation [
3,
4,
5,
6] steps or post treatment steps such as steaming and dealumination [
7,
8,
9]. Lewis acid sites (LAS) are formed after these treatments. The structure of LAS are not resolved without ambiguity and several molecular structures are proposed such as three-coordinated aluminum units and others non-framework aluminum moieties (AlO
+ and Al
2O
3) [
10,
11,
12,
13]. In addition to Lewis acid sites, redox sites with electron-hole pairs are suggested to be present due to BAS dehydroxylation after thermal treatment under inert or oxidative atmosphere [
3,
4,
14,
15,
16]. A temperature of 650 °C under steam is enough to cause dealumination.
It is established that BAS are responsible for the catalytic cracking (C–C) and dehydrogenation (C–H) activities via pentacoordinated carbonium ions (monomolecular routes) and carbenium ions (bimolecular routes). The monomolecular routes prevail the cracking of alkanes to produce small alkanes and olefins at low conversion [
2,
17,
18,
19]. The produced olefins could initiate the bimolecular pathways via hydrogen transfer reactions and form new carbenium ions. LAS, on the other hand, are suggested to activate alkanes by H
− abstraction and convert them into carbenium ions [
5,
20]. However, studies have shown that LAS do not activate alkane by themselves, rather they enhance the adsorption of reactants and hence the reaction rate or have an inductive effect by increasing the BAS acid strength [
15,
21]. Correlation between the turnover rates of cracking activity and selectivity and the LAS concentration are hard to establish [
22]. Zeolites are shown to extract an electron from naphthalene, for example, forming long-lived radical cations [
3,
15]. These electrons deficient sites (redox sites) are ascribed to Lewis and/or Redox sites. Propane is used as a model component to probe the reactivity of several zeolites before and after dehydroxylation and the studies are shown that selectivity toward dehydrogenation is enhanced and reached a ratio of cracking to dehydrogenation of one [
3,
4,
23]. Redox sites are suspected for the selectivity modification but become very difficult to confirm their structure because both redox and Lewis acid sites are very illusive when measured directly by spectroscopy (invisible Al by nuclear magnetic resonance (NMR)) [
24,
25].
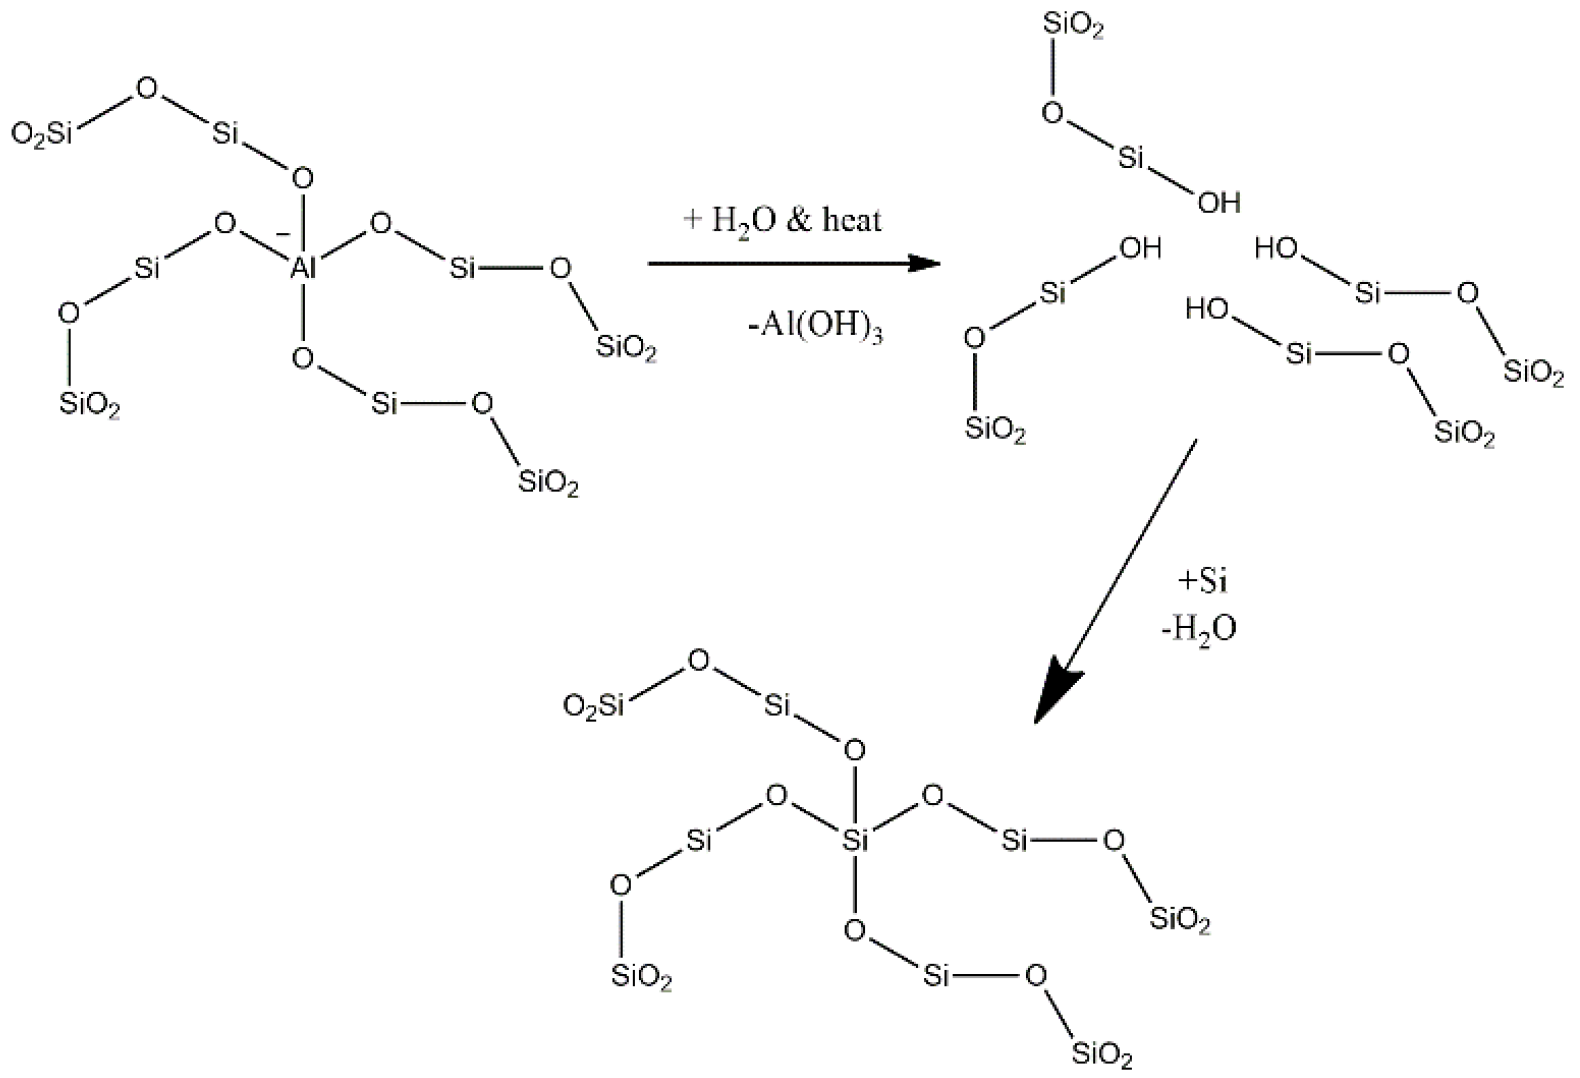
This paper articulates the dynamic evolution of the active sites in ZSM-5 after steaming using hexane as a probe molecule. The steaming causes dealumination and migration of the framework aluminum into an extraframework position, as depicted in
Scheme 1, and changes the BAS concentration, strength and catalytic activity. The dynamic data obtained from a riser simulator is compared with steady state data obtained from a fixed bed reactor at similar conditions. The study confirms that the BAS are not the exclusive sites responsible for the conversion of hexane and LAS take part in this process.
2. Results
The hexane cracking has been studied over hydrothermally deactivated ZSM-5 catalyst under N
2 diluted condition (3.6 mole% of hexane in the feed) to limit the side reactions. The main hexane cracking patterns from protolytic mechanism are depicted in
Scheme 2. Methane, hydrogen, ethane, propane and butane are produced from primary protolytic pathways and the other paraffins such as isobutane and pentanes are produced from hydride transfer reactions. Primary alpha olefins, such as propene and buene-1, are usually produced from cracking of hexane. Dehydrogenation of hexane may produce hexene-1, hexene-2 and hexene-3. The adsorbed (C
5–C
6) carbenium ions on the surface may undergo secondary reactions such as isomerization, hydride shift, -scission cracking to produce smaller olefins, and hydride transfer reactions with reactant molecules.
The hexane cracking product distribution and conversion from a fixed bed reactor at different operating conditions are shown in
Table 1. The data is taken after an hour of time on stream. The carbon and hydrogen closure are within 96% accuracy. The hexane conversion varies from 5% to 21% by changing the temperature and weighted hourly space velocity (WHSV). The hexane conversion via cracking and dehydrogenation pathways is controlled by protolytic mechanism in general as measured by the paraffins (C
1–C
4) concentration in the product. Hydride transfer reactions take also part in the hexane conversion because the measured pentanes and isobutane are not primary products from protolytic cracking. Based on these components, the contribution of hydride transfer reactions in converting hexane does not exceed 6% (in the range of 3.5 to 5.8%) and the remaining is purely protolytic contribution. Benzene is detected during the first 90 min at ~200 ppm then disappeared completely from the products irrespective of the conversion. No other aromatics are detected beside benzene. The olefins to paraffins ratios are ~1.5 and 1.7 at 500 and 550 °C, respectively, with high concentration of propene. The dehydrogenation pathway contributes considerably to the olefins production, particularly propene. The other observation is that the butenes are exclusively produced from the protolytic reaction (C–C rupture) as inferred from the ratio of butenes to ethane which is ~1.0. See
Scheme 2 for more details.
Figure 1 represents the selectivity of the products over extend time (70 h) at 500 °C and WHSV of 12 h
−1. The reaction products maintain their selectivity especially after five hours of time on stream indicating the reactions mechanism does not change and the responsible sites are not deactivated completely over the period of measurement. During the first five hours of time on stream, there is a transient variation in the products concentration before reaching asymptotic values at steady state. This behavior can be observed clearly in
Figure A1 in the
Appendix A at WHSV of 6 h
−1 (higher conversion). The conversion decreases by around 30% over the whole period of 70 h indicating a continuous deactivation that starts rapid then level off after that. The aromatics are not measured in the gas phase within the detection limit of FID detector as mentioned in the above paragraph.
The pulse (injection) experiments, representing the catalyst dynamic activity, show that the conversion increases with respect to the reaction time for all temperatures considered in this study (460 to 550 °C). For example, the conversion increases by ~4% when the reaction time increases from 5 s to 9 s as can be seen from
Figure 2. The conversion does not change with respect to the temperature over the range of 460 to 500 °C at all reaction time but it jumps at 550 °C. Please note that the conversion is calculated based on the average values from at least three consecutive pulses. The product distribution will be carefully examined to provide insight into the changing behavior of the catalyst dynamic reactivity.
The olefins to paraffins ratio, depicted in
Figure 3, increases with the temperature from a ratio of 0.5 at 460 °C to 0.8 at 500 °C which is quite low for catalytic cracking of hexane on ZSM-5. This ratio becomes ~1.5 at 550 °C. The ratio of C
3= to C
3 is much less than 1 at T = 460 and 500 °C but it reaches above 2.5 at 550 °C, a value that is similar to the steady state data from the fixed bed reactor. The ratio of olefins to paraffins and propene to propane should be more than one due to the cracking and dehydrogenation pathways (see
Scheme 2). The changes in the product distribution (or selectivities) with respect to temperatures, that cannot be explained by the protolytic mechanism alone, should include a considerable contribution from hydride transfer reactions at low temperature but not at a high temperature. These results may also imply the presence of different active sites with different activities, selectivities and stabilities that promote certain pathways.
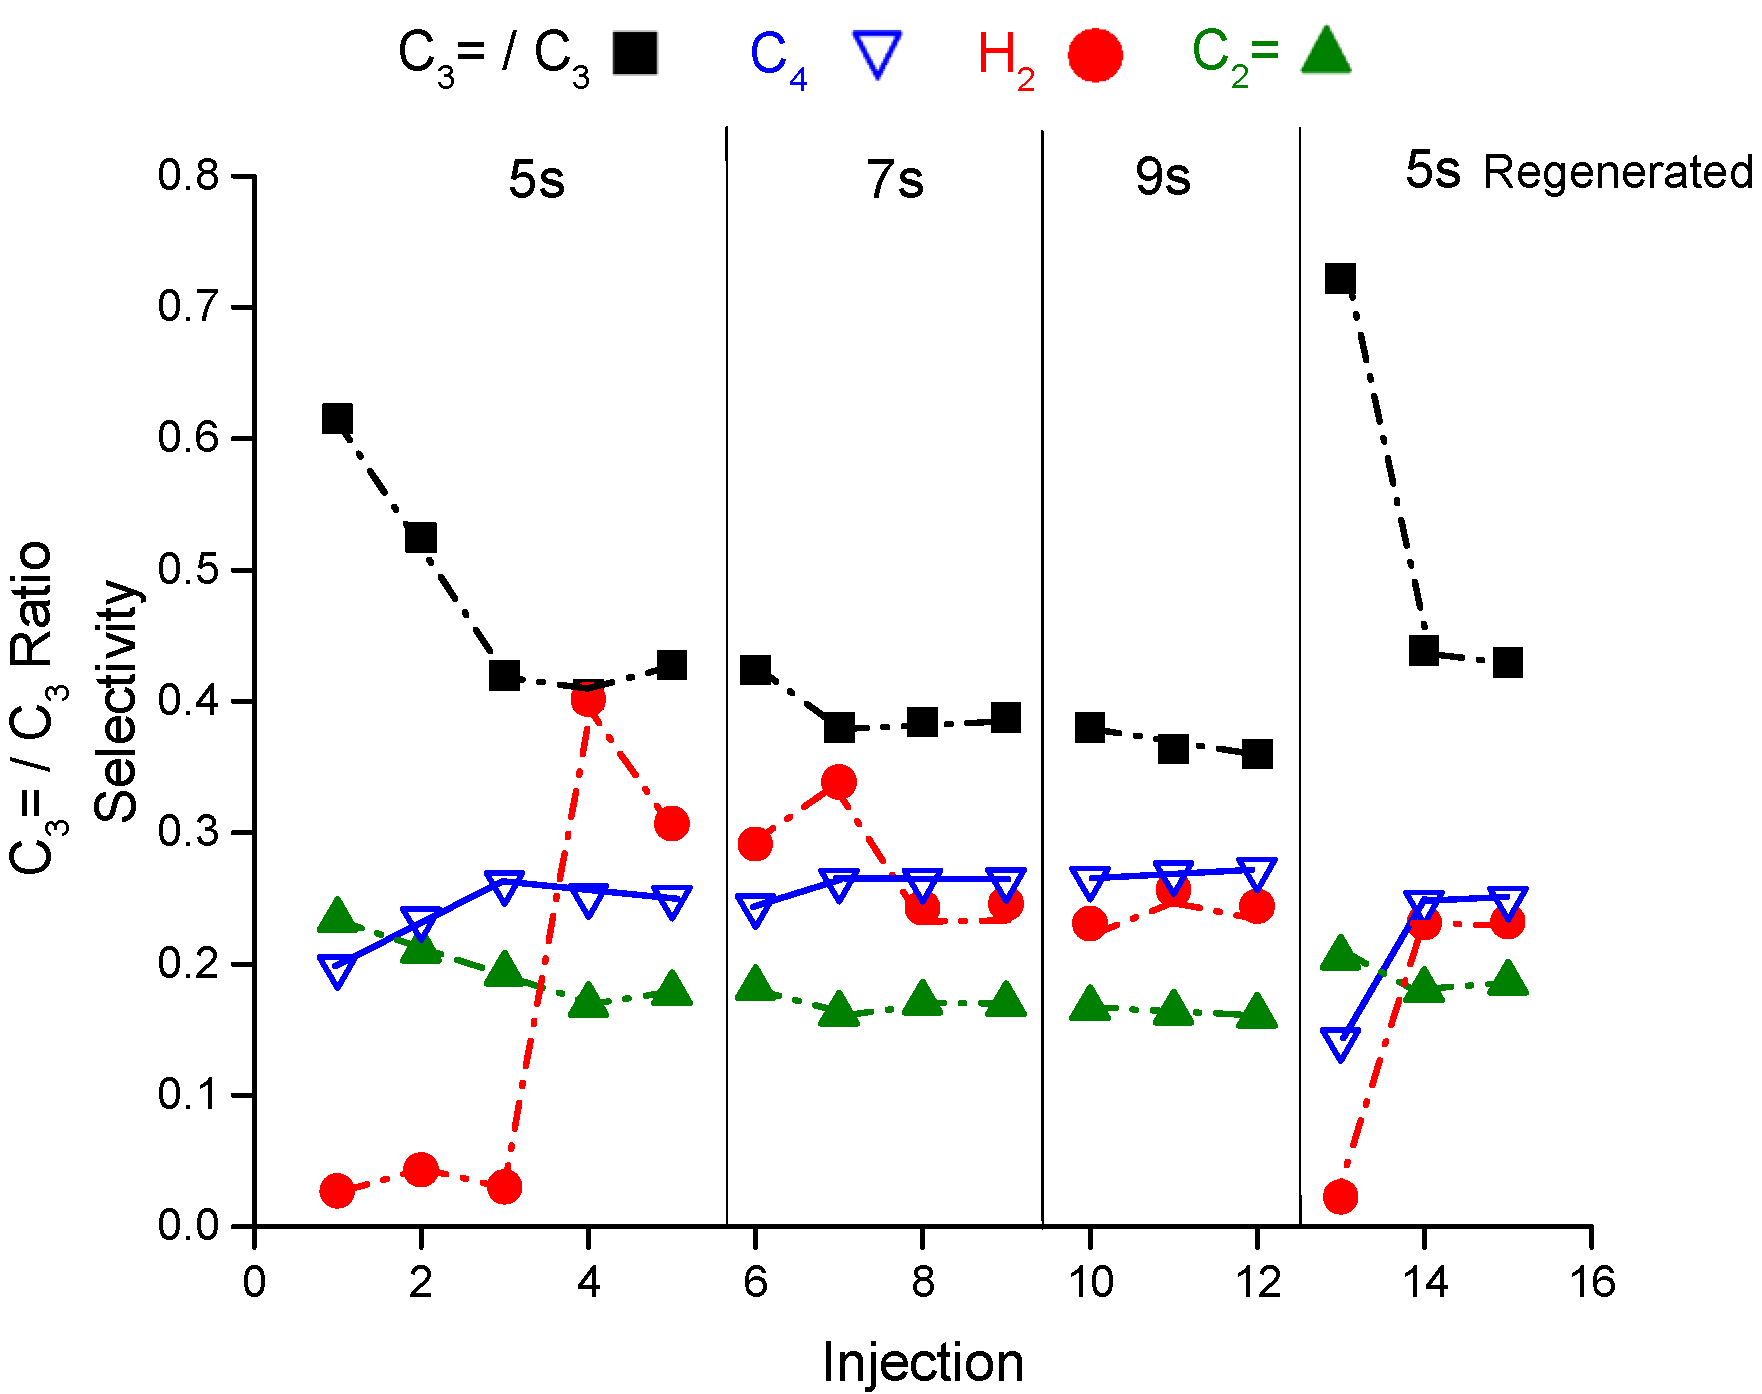
Figure 4 shows the selectivity of hydrogen, ethene, propene to propane ratio and butane as representative of the reaction products from the riser simulator as a function of pulses and reaction time at 460 °C. In addition, the figure presented the reaction products after regenerating the catalyst sample. Please refer to the
Appendix A for more supporting details. The hydrogen selectivity in the first three pulses (injections) at 5 s of reaction time is interestingly quite low at 0.03–0.04 that increases by an order of magnitude (0.3–0.4) after the third pulse. The same observation is noticed at the same conditions after regenerating the sample. The propene to propane ratio level off after the second injection reaching 0.42 from 0.61. Similar to propane, the butane selectivity increases with the number of pulses and becomes higher than ethene selectivity which is in contrary to the steady state data from the fixed bed reactor where ethene to butane molar ratio is above 1. The product selectivities experience a slight variation in the hydrogen, butane and propene to propane ratio at 7 seconds of reaction time and no variation at 9 seconds when measured as a function of injections. The change in product selectivities could be attributed to the deactivation after each injection. Note the catalyst regeneration is conducted after completing 13 consecutive injections where the catalyst loses around 15% from its initial activity after 13 injections. Injection number 13 is a control injection to measure the catalyst deactivation after coming back to the condition of 5 s at 460 °C.
Therefore, catalyst deactivation may explain the selectivity modification observed with the number of injections. This may imply the presence of short-lived sites that deactivate rapidly with few injections. For more about the conversion as a function of injection at 460 °C, refer to
Figure A2 in the
Appendix A. The conversion is almost constant at 7% and 8.3% when the reaction time is 7 and 9 s respectively but it has slight variation around 4.9% with sign of deactivation (after the third injection) at 5 s of reaction time. At this time, we do not have a solid explanation of why H
2 selectivity starts low then jumps after the second or third injections (induction time for hydrogen) but we can confirm its repeatability for the fresh and regenerated samples. We may also comment on the low olefins to paraffins ratio at 460 °C and suggest that the surface adsorbed species (that eventually turn into aromatics and coke) serves as a source of hydrogen to promote hydride transfer reactions. A similar trend is observed at 500 °C as can be seen in
Figure A3 in the
Appendix A.
The selectivity of the reaction products at 550 °C is shown in
Figure 5. The hydrogen selectivity does not change with the number of injections probably because the tests are conducted on used (not regenerated sample). The propene to propane ratio is averaged over two at all conversions matching roughly the ratio from fixed bed experiments at steady state. The butane selectivity is very low with ethene to butane ratio of more than nine compared to less than one at T = 460 °C indicating low contribution from hydride transfer reactions. The butylene to ethane ratio is about 0.83 that is less than 1.4 seen at T = 460 °C. The total selectivity of C
4 (paraffins and olefins) components at similar conversion (~8% but at different time of reaction) is 0.4 and 0.25 at 460 °C and 550 °C, respectively. The reduction of C
4 at 550 °C is compensated for by an increase in the ethene selectivity that surprisingly reaches the selectivity of propene. It is also observed that the ethane to methane and propane to methane ratio at 550 °C is less than one unlike the ratios observed at steady state conditions at the same temperature (more than one). The small alkanes signify the monomolecular contributions to hexane conversion and these ratios suggest that the high methane yield compared to ethane and propane is not trivial for ZSM-5. See
Table A1 in the
Appendix A for more details about the product distribution at 550 °C.
From the above experiments, the calculated average reaction rate of hexane from the riser simulator is ~6 times more than that of the fixed bed reactor at 500 °C. To understand the differences in the product distribution with respect to temperature and reactors, hard coke experiments as explained in the experimental section are conducted, to lower the catalyst activity over a temperature range of 460 to 500 °C.
Figure 6 depicts the conversion as a function of reaction time and temperature which shows that the conversion increases with reaction time and temperature but in the low side between 1% and 3%. The average reaction rate drops by a factor of 5.5 at 460 °C and 2.6 at 500 °C relative to the catalyst without coke. The olefins to paraffins ratio for the hard coke sample is interestingly almost constant 1.4–1.5 at all temperatures and reaction times, see
Figure 7. The propene to propane ratio starts at 4 to 4.5 at low conversion but drops to ~3–3.5 as the conversion increases (by increasing the reaction time). The olefin in C
4 fraction (paraffin C
4 and olefins C
4) represents ~ 90 mol% of the composition for the hard coke sample versus ~40 mol% for the fresh sample. The other observation is that the methane selectivity is higher than ethane and propane selectivity which is contrary to the results from the fresh sample in the same temperature range (460 to 500 °C). However, the methane selectivities with hard coke resemble the results from the coke free catalyst sample but at 550 °C. In typical catalytic cracking of hexane controlled by monomolecular cracking mechanism, the ethane and propane selectivity are higher than the methane selectivity.
Table 2 represents the full composition of the reaction products at selected reaction time for the experiments with and without hard coke.
The catalyst with hard coke has a lower reactivity, relative to the catalyst without coke, with a conversion of less than 3% and high olefins selectivities. To make sure that the observed high selectivity toward olefins is not due to low conversion, a comparison between sample with and without coke is made at similar conversion of ~5% (iso-conversion) by increasing the residence time to 19 s as can be seen in
Table 3. The product distribution from the hard coke catalyst did not follow the cracking patterns from the coke free catalyst as indicated by the methane concentration (1.3 vs. 0.5 mol%). The propene to propane ratio is 2.3 compared to 0.66 for the hard coke and fresh sample, respectively, at the same conversion (and temperature). In addition, the C
4 olefinicity is much higher than that of fresh sample. The light paraffins ratio with respect to methane, such as ethane to methane ratio, and olefins to paraffins ratio from the hard coke experiments shows a similar trend irrespective of the conversion. It looks like the hydride transfer function is minimized after coke formation and extending of the reaction time and hence increasing the conversion does not reproduce the product distribution from the fresh catalyst.
3. Discussion
The cracking reactions are very complex even at low conversion where secondary reactions such as hydride transfer present and affect the selectivity of the products. The hexane catalytic cracking over ZSM5 is extensively studied using a fixed bed reactor with data collected away from transient conditions [
18,
26,
27,
28]. The data reported by the above groups are very much consistent with the data reported in this article for the fixed bed reactor in term of product distribution. The monocracking of hexane is catalyzed by Bronsted acid sites (BAS) that proceeds via protonation of carbon-carbon bond and H–C bond at all positions to give as indicative H
2, CH
4, C
2H
6, C
3H
8 and C
4H
10 in addition to the associated olefin molecules.
Except for the short time in which transient in concentration is observed, the selectivity toward all products has constant values during the run length of 70 h at all testing conditions (variable WHSV and temperature) used in this work. The selectivity toward methane is quite low compared to the selectivity of ethane and propane because the rupture of terminal carbon-carbon bond is less favorable. To compare, the cracking of internal C–C to give ethane is approximately 3–3.5 times more that the rate of terminal carbon-carbon cracking. To decouple the monocracking contributions to the hexane conversion from the other contributions, hydrogen (methane also can be used) is used as a reference species for monocracking reactions since it is produced exclusively from this route. Methane to hydrogen ratio is constant at 0.42 and independent of temperature and conversion. The ethane to hydrogen ratio does not change with conversions at a given temperature but decreases when temperature increases. The propane, propene and butane to hydrogen ratio increases with conversion at a given temperature. This is consistent with the contribution from the hydride transfer reactions, which represents about 5% of the hexane conversion. To summarize the fixed bed experiments, Bronsted acid sites are responsible for the conversion of hexane either by monomolecular cracking reactions (contributing to ~95%) or by hydride transfer reactions.
The product distribution from the riser simulator showed a very complex behavior where selectivities shift (460–500 °C vs. 550 °C) and hydrogen induction are observed. We argue that the Bronsted acid sites are not enough to explain all of these observations especially when considering the changes in the product distribution and analyzing the conversion mechanisms. Similar conversions are observed in the temperature range from 460 to 500 °C where conversion is controlled by the hydride transfer reaction as indicated by the low olefins to paraffins ratio, low propene to propane ratio and butenes to butane ratio. The hydride transfer reactions contribution decreases as temperature increases from 460 to 500 °C being the highest at 460 °C. This conclusion is further supported by the methane formation that cannot form from hydride transfer pathways; where its concentration increases with temperature even at the same conversion. The hydride transfer reactions of C3H7+ or C4H9+ with hexane are exothermic and their reaction rates are expected to decrease with temperature. Note that the hydride transfer reactions should not change the olefins to paraffins ratio unless aromatics are formed as four moles of olefins are converted to paraffins per mole of aromatics formed. Therefore, when correcting for the aromatics to the consumption of olefins, the olefins to paraffins ratio is still below one for the temperature below 500 °C and one at 500 °C. The low olefins to paraffins ratio cannot be accounted for by considering the gas phase composition. The additional source of hydrogen could come from the surface adsorbed species that lead to aromatics and coke formation eventually, even though it is quite small as it requires about 13 injections to reduce the initial activity by 15%.
The other clear observations that distinguish the data from the pulse experiments is that the methane formation increases with temperature that reaches high yield at 550 °C with methane to ethane ratio of 1.3 when it is compared with steady state data (fixed bed) of 0.3. The big difference in the ratio indicates that there is a flipping behavior of the catalyst from promoting hydride transfer reactions at low temperature to methanation at high temperature. The high methane formation is associated with an increase in the ethene concentration reaching the concentration of propene (C
3=/C
2= ~ 1.04). This is not surprising because pentene is produced from the methanation reaction and then it is cracked to give propene and ethene. Nianhua Xue et al. studied recently the hydrolysis of framework aluminum by steaming ZSM-5 at mild conditions and reported that the activity enhancement in butane cracking reaction is attributed to the BAS located in the vicinity of extra framework aluminum [
9]. They concluded that the increase in the cracking activity is due to an increase in the entropy of activation. However, the reaction data is obtained from a fixed bed reactor at steady state conditions and low conversion. In another work by Anh T et al., the cracking of hexane and its isomers over dehydroxylated HY zeolite is investigated using a pulse but fixed bed reactor at a constant temperature for each molecule [
6]. Both catalyst enhancement and changes in product selectivities are observed and attributed to the synergetic interaction between the Bronsted and Lewis acid sites. The synergetic sites are deactivated very quickly. In this manuscript, the hexane cracking is investigated at different temperatures and the changes in the selectivities are attributed to the activation of the C–C bonds by Lewis acid sites because these changes are temperature dependence and come from energetic contribution not entropic contribution. It may be a challenge to explain the observed data by considering the synergetic interaction between BAS and LAS as energy (activation energy) modifier for the terminal and internal cracking of C–C bonds in hexane. To the best of the authors’ knowledge, the preexponential factor and reaction rate constant for the terminal C–C cracking published is less than internal C–C cracking. See, for example, References [
19,
29].
The final observation is that there is an induction period of hydrogen during the first two injections before its concentration jumps. This induction period is consistently observed in the fresh and regenerated experiments. The first two injections always have a higher olefins to paraffins ratio and propene to propane ratio.
The dynamic activity of the catalyst is modified by heating the catalyst sample at 650 °C under Argon flow in the presence of hexane to make hard coke on the catalyst. The deactivation is not selective and not uniform by any means but we believe the active sites with high reactivity will deactivate first. To fix the conversion, the reaction time for the sample with hard coke is allowed to extend longer. The results in terms of product distribution with and without coke at the same conversion and conditions are different indicating different conversion pathways where coke suppresses the hydride transfer reactions as calculated from the olefins to paraffins ratio and propene to propane ratio (see
Table 3). The methane formation with coke is quite high resembling the trend at 550 °C, unlike the data from the fixed bed at the same conversion and temperature (see
Table 1 and
Table 3). On the other hand, the ethane to propane ratio (indicative of monomolecular cracking) compares very well with the ratio from the fixed bed results.
By integrating the fixed bed data representing the steady state conditions and riser data representing the dynamic conditions of active sites, we suggested that Lewis acid sites are active in alkanes cracking and their activities change from promoting hydride transfer reactions, not elementary but concerted reactions, in the temperature range of 460 to 500 °C to promoting methanation at 550 °C. Another possibility is that Lewis acid sites promote hydrogenation or hydrocracking that saturate the olefins or hydrocrack the hexane at low temperature but no evidences can be provided to support this hypothesis. It may also be possible that steaming causes the formation of different alumina species and Lewis acid sites with different reactivities.
4. Materials and Methods
The catalyst is a spray dried ZSM-5 (SiO2/Al2O3 = 30) based material that has been steamed at 750 °C overnight using pure steam and divided into two batches. The first batch is used on fixed bed reactors at hte GmbH (high throughput experimentation) to study the steady state activities of the catalyst and the second one is used on a RECAT-CREC Riser Simulator reactor, a bench-scale internal recycle batch reactor produced by Recat Technologies to study the catalyst dynamic activities.
The steady state experiments are executed in a fully automated, parallel test system. The test system is equipped with four stainless steel reactors of the following dimensions: length 900 mm, outer diameter 10 mm, and inner diameter 4 mm. The four reactors; filled with different catalyst masses to vary the WHSV (6–12 h−1 at 3.5 mol % of hexane diluted in N2 and Ar); are connected to a common feed pipe. The particle size of the powder material is ranging from 100 to 160 µm. The samples are placed between two plugs of quartz wool inside the isothermal zone (+/−1 K at reaction temperature) of the reactor. The zones above and below the sample are completely filled with quartz of the same particle size. Prior each test the reactor is flushed with N2 (210 L/h) at 600 °C. For analysis, two Agilent GCs (6890A and 7890A) are equipped with three TCDs (Thermal Conductivity detector, used for permanent gases analysis) and two FIDs (Flame Ionization detector used for hydrocarbons analysis and isomer distribution). The calculated carbon recovery varies between 94–103%.
The dynamic experiments are conducted in a fluidized bed mode where catalyst (0.5 gram) with particle size of 60–90 µm is placed inside a basket equipped with frit having 20 µm openings at the bottom to support the bed and allow the feed and Argon to flow. The reactor impeller is rotated at 5300 RPM causing Argon flow to exceed the minimum fluidization. A calculated quantity of feed (n-Hexane, Carlo Erba Reagents) to maintain catalyst to oil ratio of 10 is injected directly to the reactor at atmospheric pressure. The data is collected at variable temperatures of 460–550 °C and residence time of 5 to 10 s. The cracking products are transferred automatically and rapidly from the reactor to the vacuum chamber to terminate the reactions and allow a precise control of the contact time though several automated valves. The mixture in the vacuum chamber has been analyzed by GC equipped with TCD and FID detectors. After each test, the setup was flushed with Ar at 300 °C until no hydrocarbons were detected. The carbon and hydrogen closure are accurate within ~96%. After each measurement series at the given temperature, the catalyst has been regenerated under air flow at 550 °C for 3 h. The regenerated catalyst has been used to repeat some of the measurements to investigate the data reproducibility. To understand the nature of the active sites, hard coke is generated to partially block them by heating the catalyst samples under Ar and low partial pressure of hexane at 650 °C for 3 h.
5. Conclusions
The hexane catalytic cracking over hydrothermally treated ZSM-5 is studied at steady state conditions using a fixed bed reactor and dynamic conditions where the catalyst is fresh and at its highest activity using a riser simulator reactor. The calculated reaction rate of hexane from the riser simulator is ~6 more than that of the fixed bed reactor. The data from the fixed bed are collected after at least 30 min of time on stream, a time that is enough to cause deactivation of highly active sites.
The product distribution from the fixed bed is controlled by monomolecular reactions with little contribution from hydrogen transfer reaction at steady state conditions. The olefins to paraffins ratio is above one. At short time on stream, aromatics formation is observed initially but disappeared later even at higher conversion. The product selectivities are consistence with the protolytic mechanism by Bronsted acid sites. However, the product distribution from the riser simulator shows that the olefins to paraffins ratio hardly exceeds one especially at low temperatures (460–500 °C) indicating the considerable contribution of the hydride transfer reactions even at low conversion. At 550 °C, methanation function is promoted to the point where its yield becomes higher than the yield of ethane and propane. The continuous increases of methane yield with respect to the temperature indicate that this is an energetic effect. In other words, the activation energy of terminal C–C bond cracking to produce methane is low compared to the internal C–C bond cracking to produce ethane and propane. The changes in selectivities become hard to explain by considering Bronsted acid sites alone and therefore are attributed to the presence of Lewis acid sites that activate C–C bonds rupture. These sites have very high activity with rapid deactivation. To verify, hard coke experiments are conducted and revealed that the contribution from hydride transfer reactions is mostly blocked and the olefins to paraffins ratio become more than 1.
The evolution of active sites in dealuminated zeolite is best studied using dynamic conditions in order to capture the activities of short-lived sites that may impact the product distribution in actual commercial process as in the case of FCC.

 ,
, 


