Article

The Effect of AgInS2, SnS, CuS2, Bi2S3 Quantum Dots on the Surface Properties and Photocatalytic Activity of QDs-Sensitized TiO2 Composite

1
Department of Environmental Technology, Faculty of Chemistry, University of Gdansk, 80-308 Gdansk, Poland
2
Department of Solid State Physics, Faculty of Applied Physics and Mathematics, Gdansk University of Technology, 80-233 Gdansk, Poland
3
Faculty of Chemistry, Nicolaus Copernicus University, 7 Gagarina str, 87-100 Toruń, Poland
*
Author to whom correspondence should be addressed.
Catalysts 2020, 10(4), 403; https://doi.org/10.3390/catal10040403
Submission received: 5 March 2020 / Revised: 25 March 2020 / Accepted: 4 April 2020 / Published: 7 April 2020
(This article belongs to the Special Issue Recent Advances in TiO2 Photocatalysts)

Abstract

:
The effect of type (AgInS2, SnS, CuS2, Bi2S3) and amount (5, 10, 15 wt%) of quantum dots (QDs) on the surface properties and photocatalytic activity of QDs-sensitized TiO2 composite, was investigated. AgInS2, SnS, CuS2, Bi2S3 QDs were obtained by hot-injection, sonochemical, microwave, and hot-injection method, respectively. To characterize of as-prepared samples high-resolution transmission electron microscopy (HRTEM), scanning electron microscopy (SEM), X-ray diffraction (XRD), UV-Vis spectroscopy and photoluminescence (PL) emission spectroscopy were applied. The size of AgInS2, SnS, CuS2, Bi2S3 QDs were 12; 2–6; 2–3, and 1–2 nm, respectively. The QDs and QDs-sensitized TiO2 composites obtained have been tested in toluene degradation under LEDs light irradiation (λmax = 415 nm and λmax = 375 nm). For pristine QDs the efficiency of toluene degradation increased in the order of AgInS2 < Bi2S3 < CuS < SnS under 375 nm and AgInS2 < CuS < Bi2S3 < SnS under 415 nm. In the presence of TiO2/SnS QDs_15% composite, 91% of toluene was degraded after 1 h of irradiation, and this efficiency was about 12 higher than that for pristine QDs under 375 nm. Generally, building the TiO2/AgInS2 and TiO2/SnS exhibited higher photoactivity under 375 nm than the pristine TiO2 and QDs which suggests a synergistic effect between QDs and TiO2 matrix.

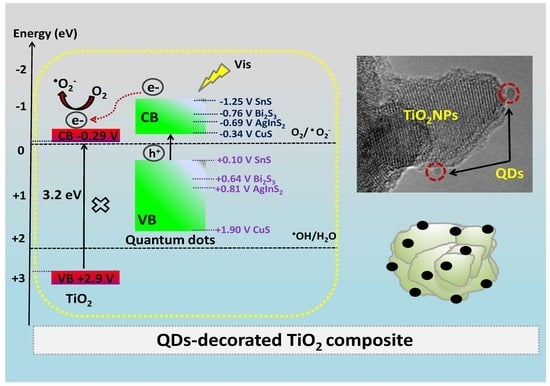
Graphical Abstract

1. Introduction

Air pollution poses a major threat to public health globally by virtue of its prevalence and emission by various sources. Among these sources, some volatile organic compounds (VOCs) become a prominent problem due to their toxicity even at low concentrations. Moreover, VOCs, along with inorganic oxides, can be transported over long distances producing secondary air pollutants, and can be responsible for acid rain and global warming [1,2,3]. In this regard, there is a high demand for an efficient, low-cost and eco-friendly technology, which can be implemented for air purification, even at low pollutant concentration levels. Application of solar light induced photocatalysis could be one of the technologies solving these problems [1,4]. Heterogeneous nano-semiconductor photocatalysis (e.g., TiO2 NPs) is an efficient method facilitating the degradation of air pollutants, inactivation of bacteria, hydrogen production and photoconversion CO2 into light hydrocarbon [5,6,7,8]. The recombination rate of photogenerated electron−hole pairs and the low visible light utilization of TiO2 limit its applications in these areas. In recent years, there has been significant interest in the application of metal sulfides (MxSy) for wide band semiconductors modification, because of their high charge separation efficiency and narrow band gaps, which possibly enable light harvesting at longer wavelengths [9]. Liu et al. studied the efficiency of AgInS2/TiO2 heterostructures in 1,2-dichlorobenzene (o-DCB) degradation under visible light [10]. They observed that AgInS2/TiO2 composites could expand the visible-light response range and greatly decreased the recombination of photogenerated electron−hole pairs in the composites. The degradation of o-DCB for the most active sample reaches about 50% after 8h of irradiation. Jang et al. prepared Ag–SnS–TiO2 nanocomposite for methylene blue and rhodamine B degradation under simulated sunlight [11]. The photoactivity of the produced photocatalysts was about 2–3 times higher than that of P25. Compared with bare TiO2 the CuS/TiO2 [12], CdS/TiO2 [13,14,15], SnS/TiO2 [16], Ag2S/TiO2 [17,18], CuInS2/TiO2 [19,20,21], Bi2S3/TiO2 [22,23,24] nanocomposites present a significant improvement on photocatalytic reactions due to the decreasing recombination of electron–hole pairs and the broadened light absorption spectra. However, the metal sulfides commonly employed for TiO2 modification have been used in nanoparticle sizes and not in quantum dots sizes. Further, it has been shown that the size of metal sulfides (MS) particles can have an impact on its physicochemical and optical properties. Recently, the literature data demonstrated that the decrease in particle size lowers the recombination of the electron-hole pair within the semiconductor particle. Quantum dots (QDs) with particles size in range from 2 to 20 nm exhibit distinctive properties owing to their high surface-to-volume ratio [25]. Band gap tailoring of QDs is contingent by controlling particle size. Thus, light absorption range and the energy of charge carriers can be modulated. So far, QDs decorated semiconductors particles have aroused attention due to high charge separation efficiency and quantum confinement effects of QDs. To date, the CdS QDs-decorated semiconductors NPs [26,27,28,29,30] a mostly investigated in photocatalytic reaction, but CdS QDs are not stable in the water splitting reaction, which are known to be toxic. Moreover, the use of CdS is restricted due to photocorrosion. To date, metal sulfides quantum dot (MS QDs)-sensitized TiO2 were not often studied in air purification process. Mazierski et al. synthesized the Ag NPs/Bi2S3 QDs/TiO2 nanotubes (NTs) with the improved photocatalytic efficiency in phenol and toluene degradation which was assigned to the notably increased the electron−hole separation/transfer and synergistic effect between the ordered structure of TiO2 NTs and the well-distributed Pt NPs and Bi2S3 QDs [31]. However, other types of composites, e.g., C QDs/Bi2WO6 NPs [32], N-doped C QDs/TiO2 NPs [33], CdTe QDs/KTaO3 NPs [34], CdTe QDs/SrTiO3 NPs [35], CdTe QDs/SrTiO3 NPs [35] were investigated in pollutants degradation in the gas phase.
Based on the above considerations, this paper focuses on the synthesis methods, surface properties and photocatalytic activity of MS QDs and MS QDs-decorated TiO2 composites. Herein, a series of non-toxic quantum dots (e.g., AgInS2, SnS, CuS2, Bi2S3) have been applied to investigate the effect of QD typeand amount (5, 10, 15 wt%) on the activity of obtained QDs-TiO2 hybrids. The proposed hybrid systems are discussed with respect photoactivity in air purification process in the presence of low-powered and low-cost irradiation sources (LEDs λmax = 415 nm and λmax = 375 nm), which reduce the costs of photocatalytic processes.

2. Results and Discussion

Sample labeling, preparation method and photocatalytic activity of prepared QDs and QDs-sensitized TiO2 are given in Table 1. Initially, we investigated the effect type (AgInS2, SnS, CuS2, Bi2S3) and amount of QDs (5, 10, 15 wt%) on the optical properties and efficiency of toluene degradation in the gas phase using the LEDs.

2.1. Morphology

To determine the morphology of the obtained TiO2, scanning electron microscopy (SEM) and high-resolution transmission electron microscopy (HRTEM) images have been performer (Figure 1). As clearly shown, TiO2 showed an irregular particles and porous surface morphology. The average size of TiO2 was in the range of 100−800 nm.
The HRTEM measurements were performer to characterize the morphology of obtained QDs (Figure 2). The average size of AgInS2 QDs was about 12 nm (Figure 2a). However, the accurate size of AgInS2 QDs was difficult to determine, due to the presence of an amorphous layer, indicating the presence of oleic acid, 1-octadecene, dodecanethiol and oleylamine (used during the synthesis) on surface of AgInS2 QDs QDs (Figure 2b). As clearly shown SnS QDs were small in size and have spherical shape with average size from 2 to 6 nm (after 15 min. in ultrasonic bath) (Figure 2c–d). Cheraghizade et al. obtained SnS QDs by applying different sonication times of 10, 15, and 20 min. They observed that the sizes of the SnS QDs decreased from 7.15 to 3.66 nm with the times of sonication were enhanced [36]. Based on Figure 1e–f, the average size of CuS QDs obtained by microwave method during 9 min. were in the range of 2–3 nm. Chaudhary et al. also obtained CuS QDs with size of 2–3 nm in 2 min using microwave and water as medium [37]. The Figure 2g–h clearly shows very small Bi2S3 quantum dots embedded on the surface of TiO2 NPs. Bi2S3 QDs were spherical with size in the range of 1–2 nm. In addition, Table S1 presents the transmission electron microscopy energy-dispersive X-ray spectroscopy (TEM-EDX) analysis. These results show the combination of QDs and the TiO2 NPs which have resulted in the formation of heterojunction structure between these two components. Furthermore, this composed interaction between TiO2 and QDs may play an crucial role in accelerating the separation of the photogenerated charge carriers [34,38].

2.2. UV-Vis Spectra

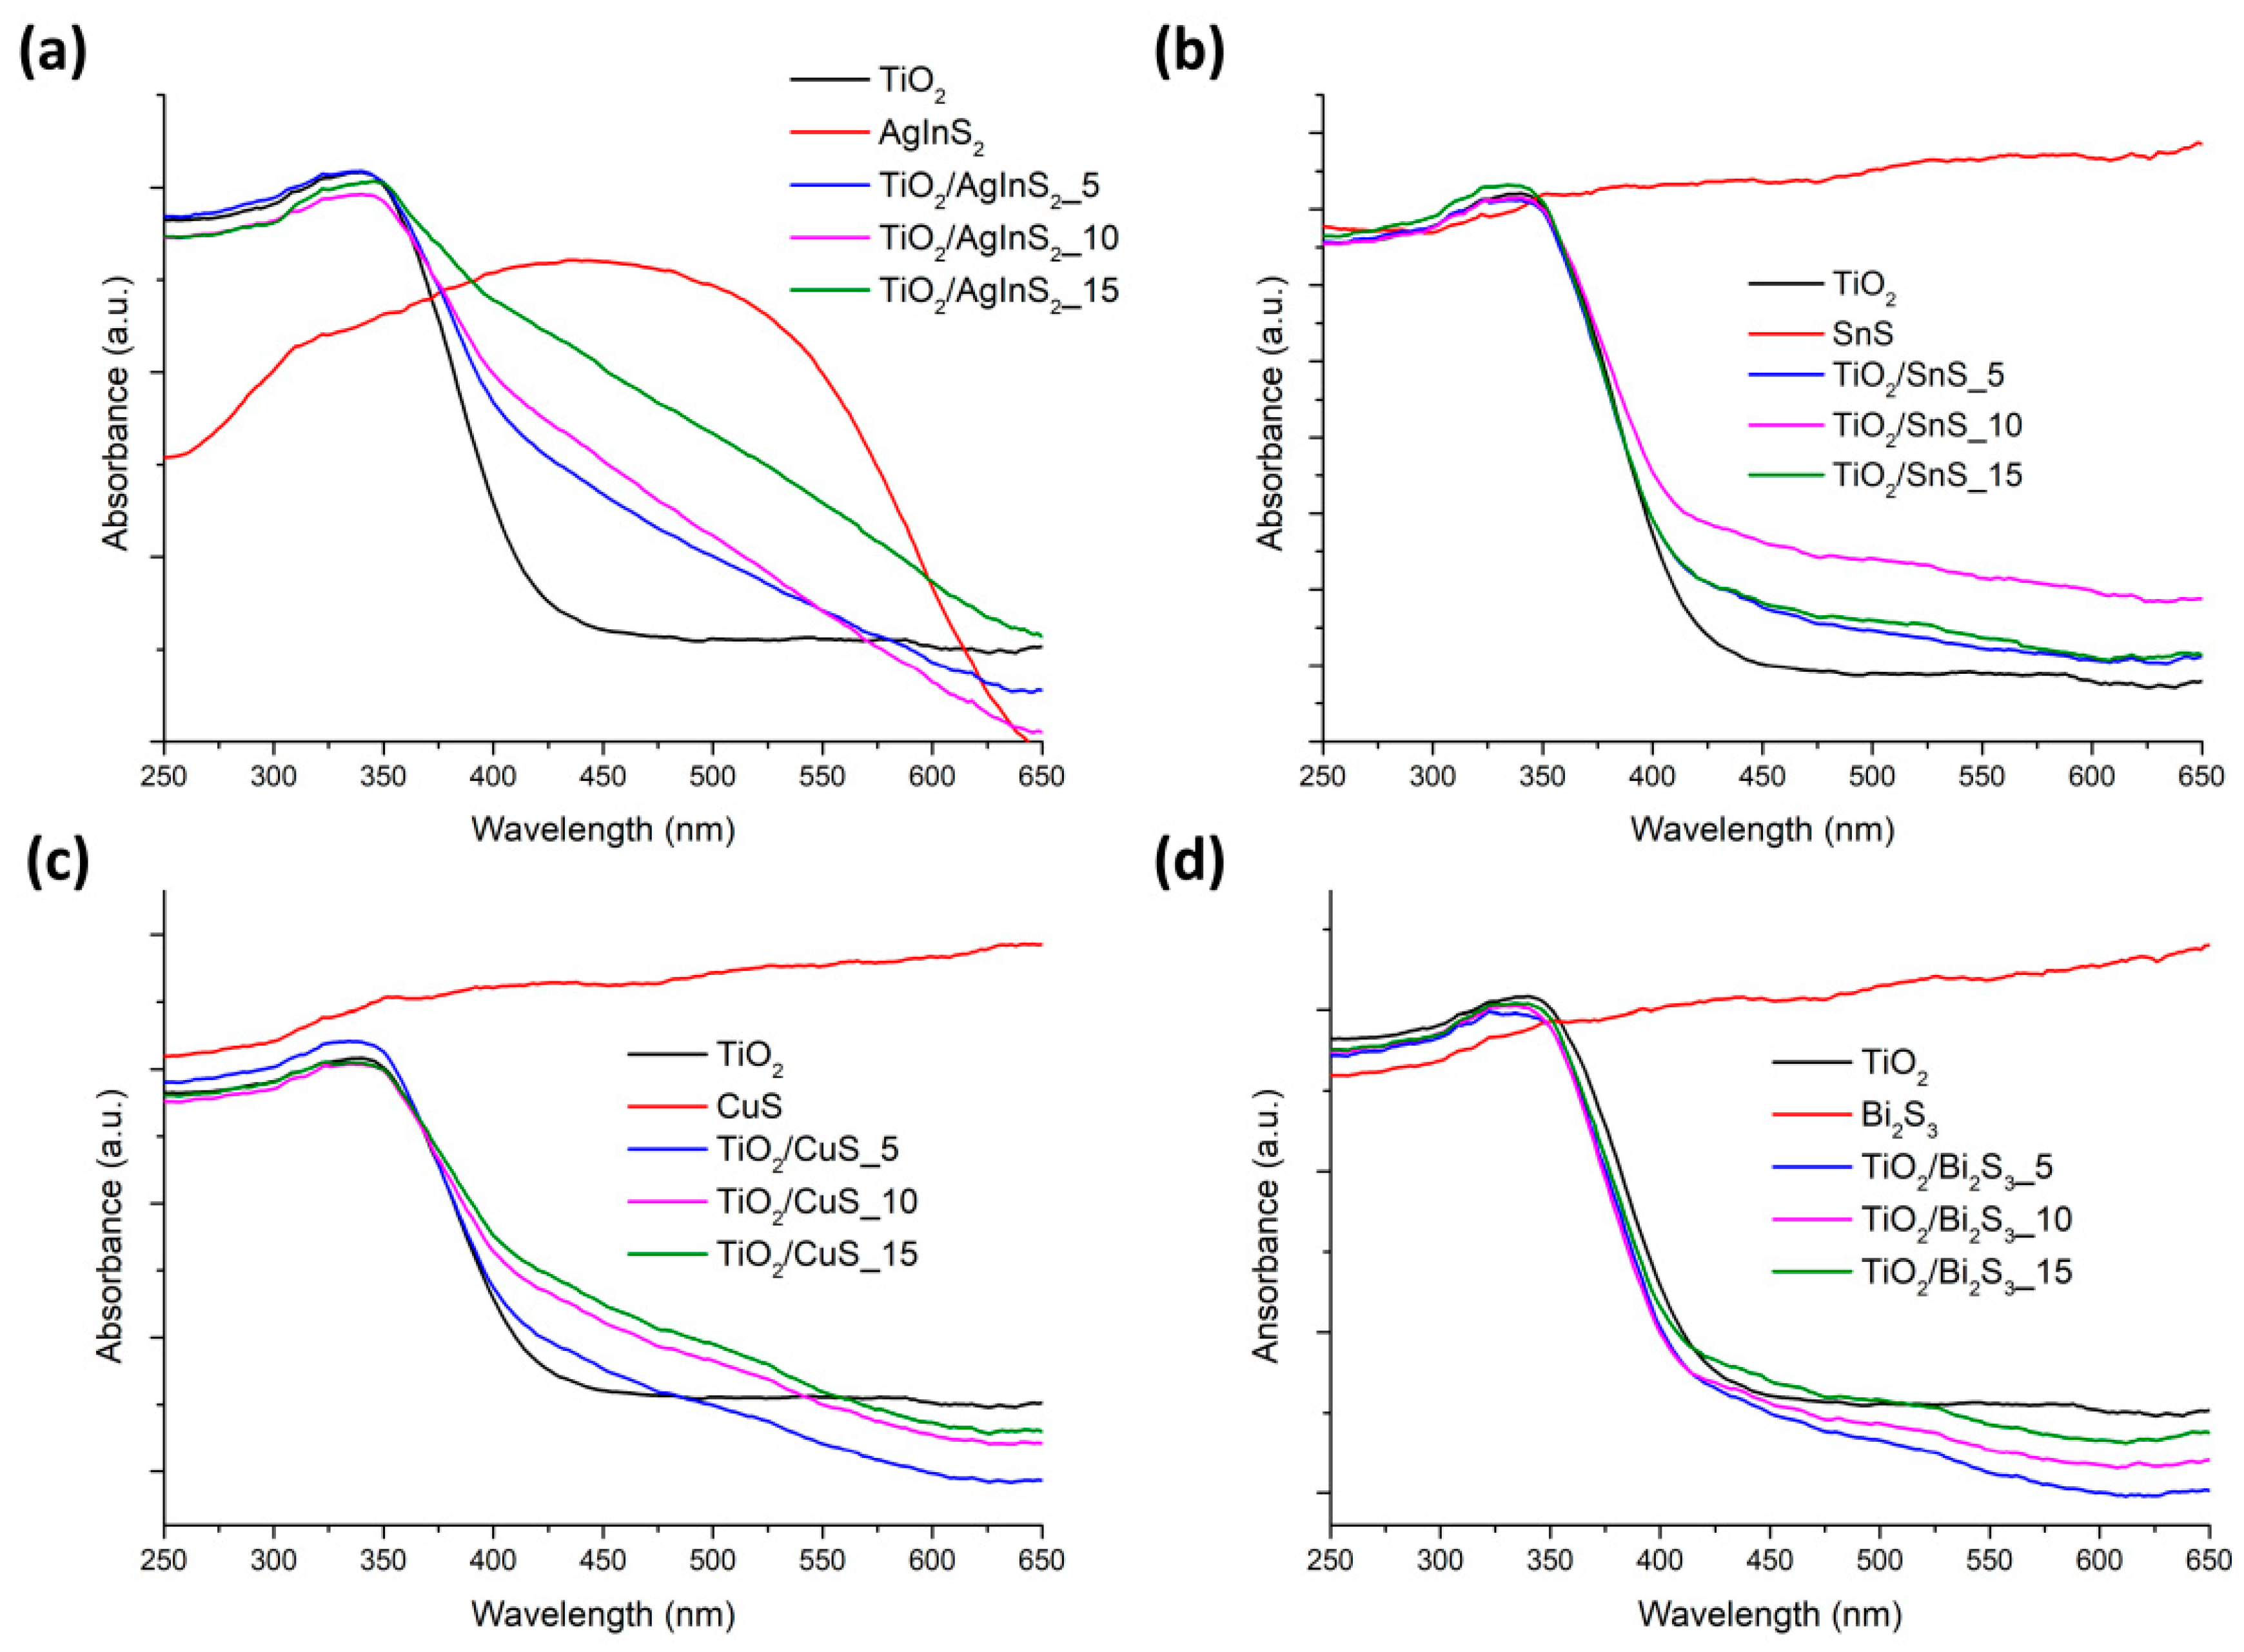
The optical properties for all prepared photocatalysts were investigated by UV–vis spectra analysis with the wavelength from 250 to 650 nm (Figure 3). The characteristic sharp edge was observed at 390–400 nm which is in agreement with the intrinsic band-gap absorption of anatase TiO2 (3.2eV). For AgInS2 the onset of absorption peak was observed at 600 nm with a maximum at 450 nm (Figure 3a). All TiO2 modified with AgInS2 QDs exhibit enhanced absorption in the visible light spectrum, in comparison with the pure TiO2. Furthermore, the increased absorption in the visible range with increasing amount (from 5 to 15%) of AgInS2 QDs can be seen. It is worth mentioning that the highest amount of AgInS2 QDs (15 wt%) onto TiO2 surface led to induced absorption in range from 400 to 650 nm. Therefore, these results confirm that QDs have been successfully combined with the TiO2 NPs and the heterojunctions in the fabricated composites were formed. Significantly widened absorption spectrum into the visible region has been achieved by introducing SnS QDs onto TiO2 NPs, due to the photosensitizing effect of the incorporated SnS QDs with TiO2 NPs matrix (Figure 3b). For TiO2 modified with CuS QDs, it can also be seen that the absorbance peaks were shifted to longer wavelengths, compared with pristine TiO2 (Figure 3c). The bare SnS QDs and CuS QDs have shown remarkable absorption in both the UV and visible regions. No significant effect was observed on absorption properties by coupling TiO2 NPs with the black colored Bi2S3 QDs in comparison to pristine TiO2 [24]. (Figure 3d).

2.3. Photoluminescence Properties

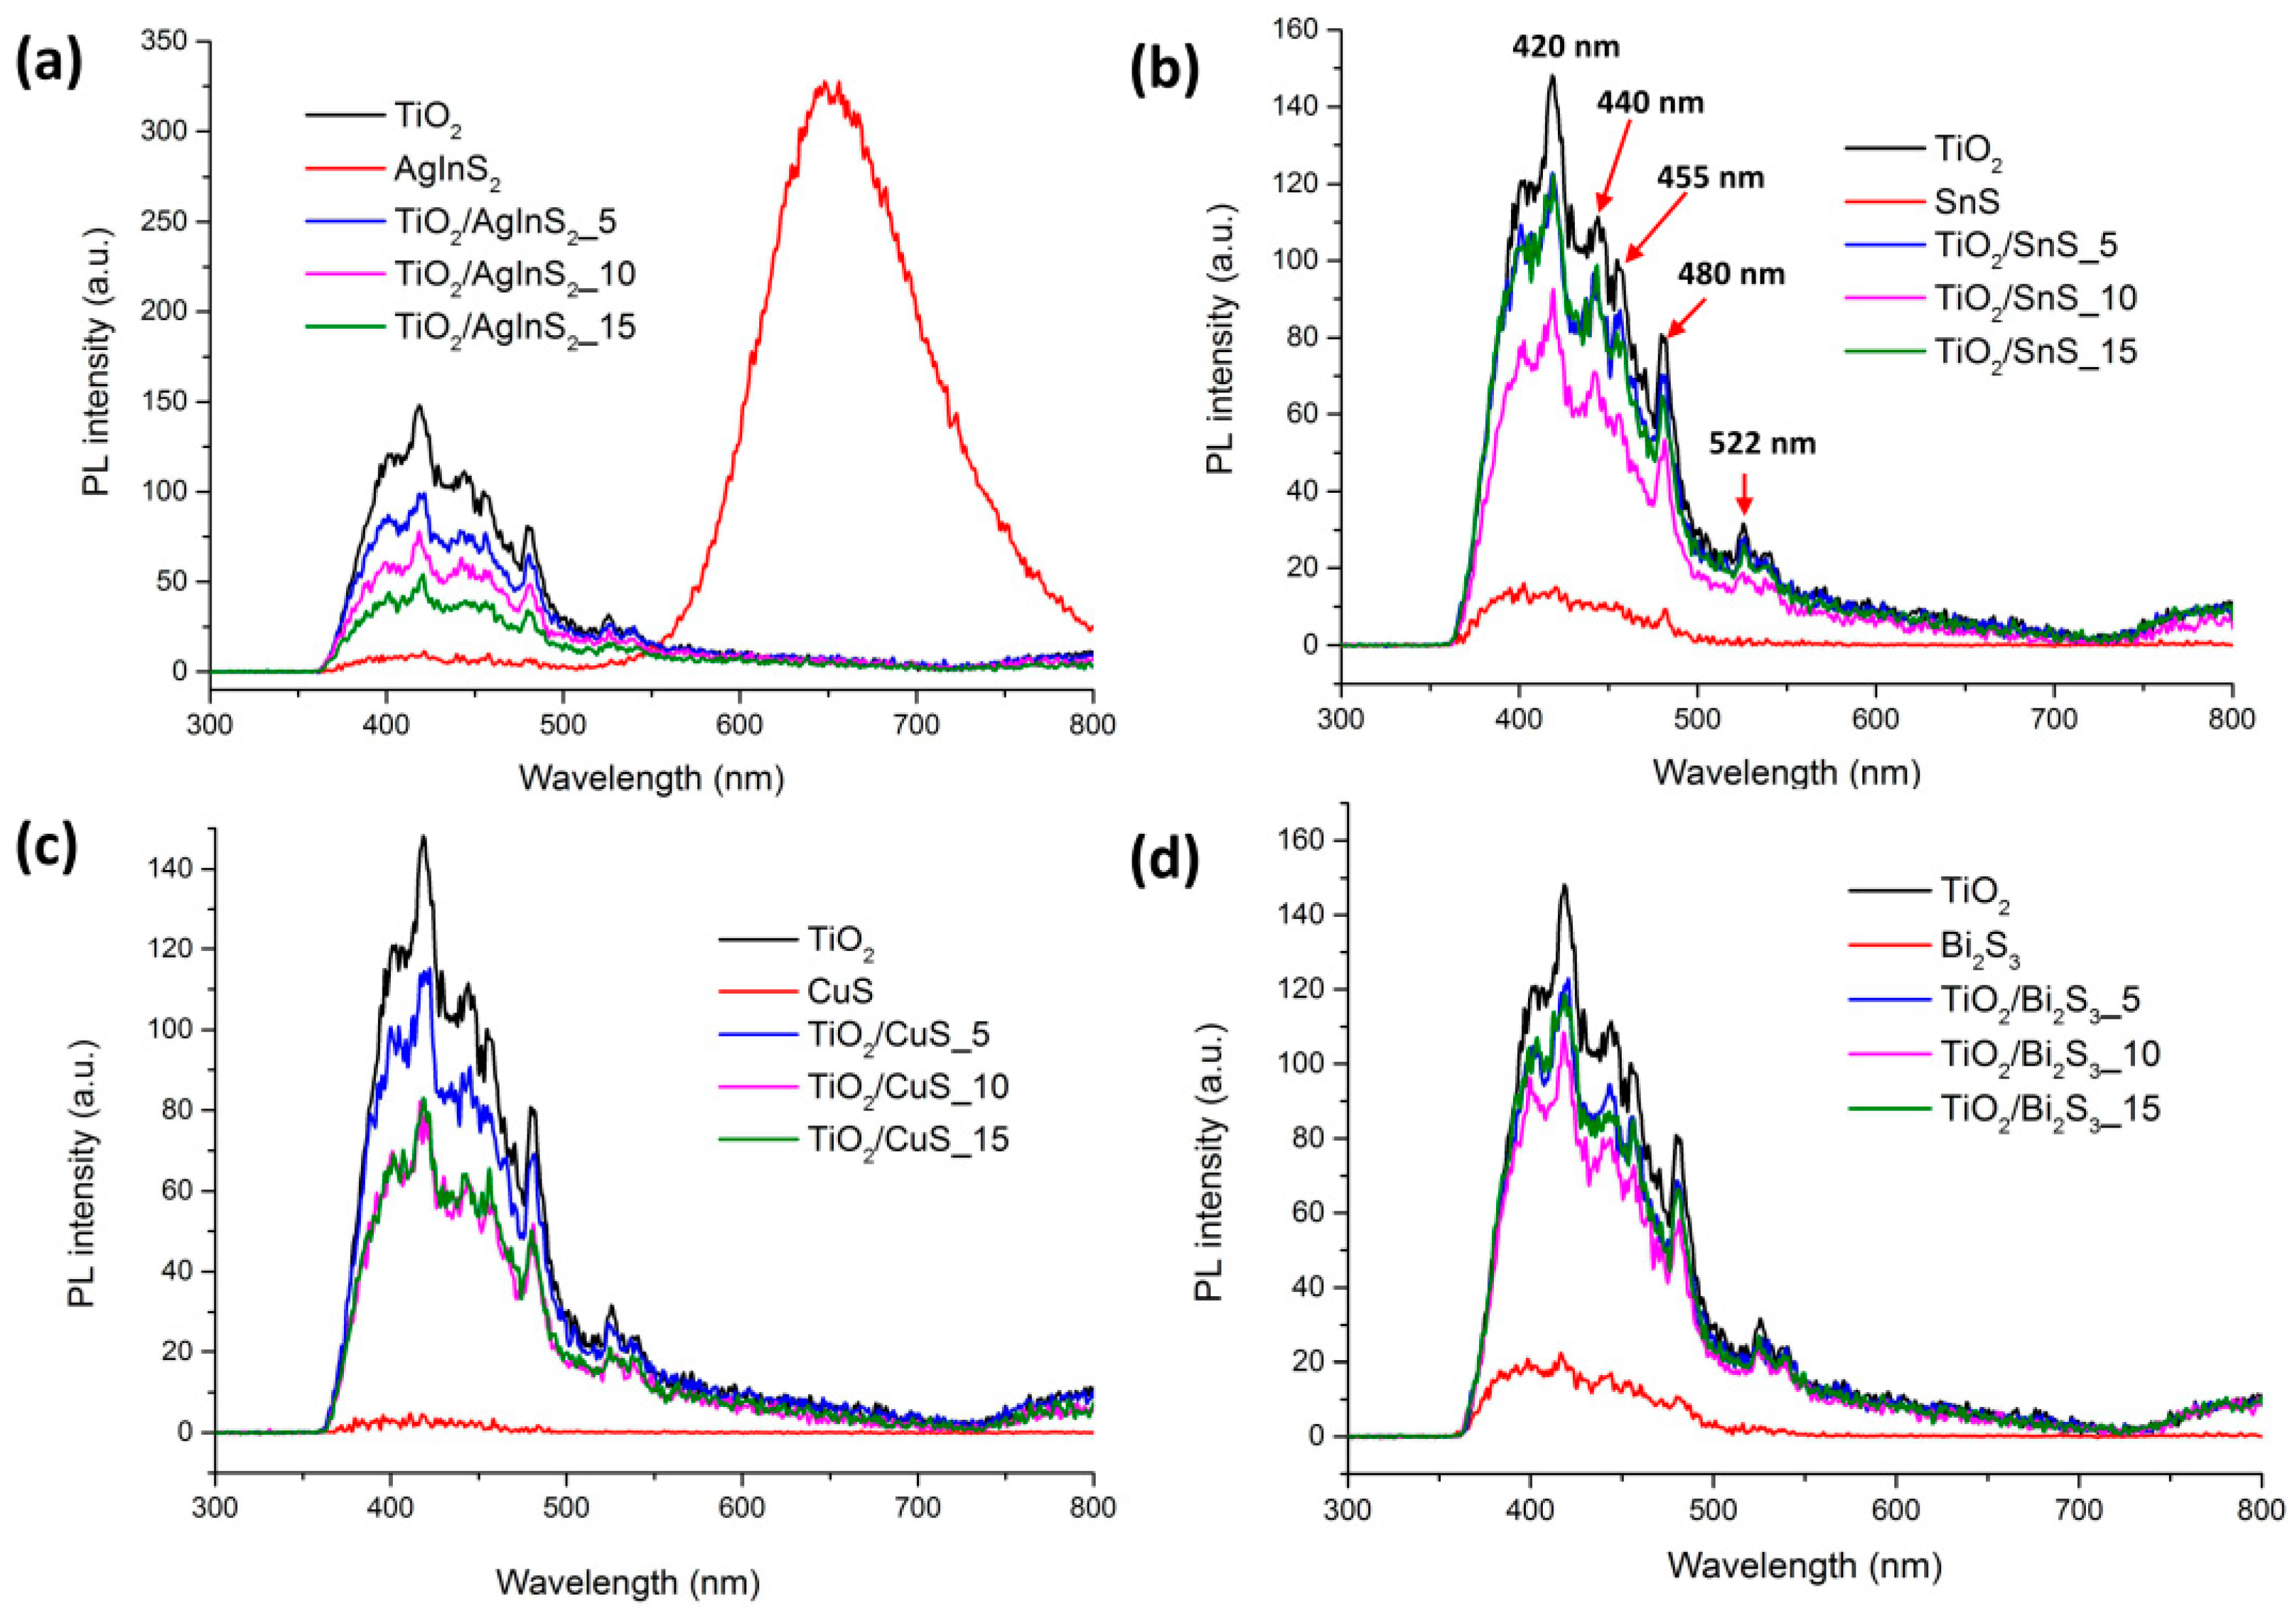
It is essential to study the photoluminescence (PL) emission spectra of semiconductor photocatalysis, which can provide information regarding electron-hole recombination processes. The PL signal is obtained from emitted photons by electron-hole pair recombination in a photocatalysis [39].The higher PL emission signal the more efficient the recombination process, and the lower the activity for photocatalysis [40]. Figure 4 displays PL emission spectra of prepared photocatalysts at an excitation wavelength of 330 nm. Pristine TiO2 exhibited the highest PL intensity due to its low separation efficiency. PL spectra of anatase TiO2 materials are attributed to three kinds of physical origins: Self-trapped excitons (420 nm), oxygen vacancies (420, 440 and 455) and surface states/defects (480, 522 nm) [39]. The emission around 480 nm has been observed for all prepared samples, which can be attributed to the charge transfer from Ti3+ to oxygen anion in a TiO68− complex associated with oxygen vacancies at the surface [41,42]. The maximum of emission band of AgInS2 QDs synthesized by hot-injection method at 130°C for 6 min is located around 650 nm (Figure 4a). Along with the increase in the AgInS2 QDs content, the PL intensity dropped down and achieved its lowest level at 15 wt% QDs content, suggesting the highest separation and transfer efficiency of photogenerated electron-hole pairs. Among the TiO2/SnS and TiO2/ Bi2S3 photocatalysts, the lowest PL was observed for the sample containing 10 wt% of QDs (Figure 4b,d). Based on a comparison of changes in PL intensity of all TiO2 modified with CuS, it can be observed that the luminescence intensity decreased with increasing amount of CuS QDs (Figure 4c). Considering these results, the proposed QDs can raise the effective separation of the photogenerated electrons and holes in TiO2/QDs heterojunction, thus promoting the charge separation and improving the photocatalytic performance.

2.4. XRD Analysis

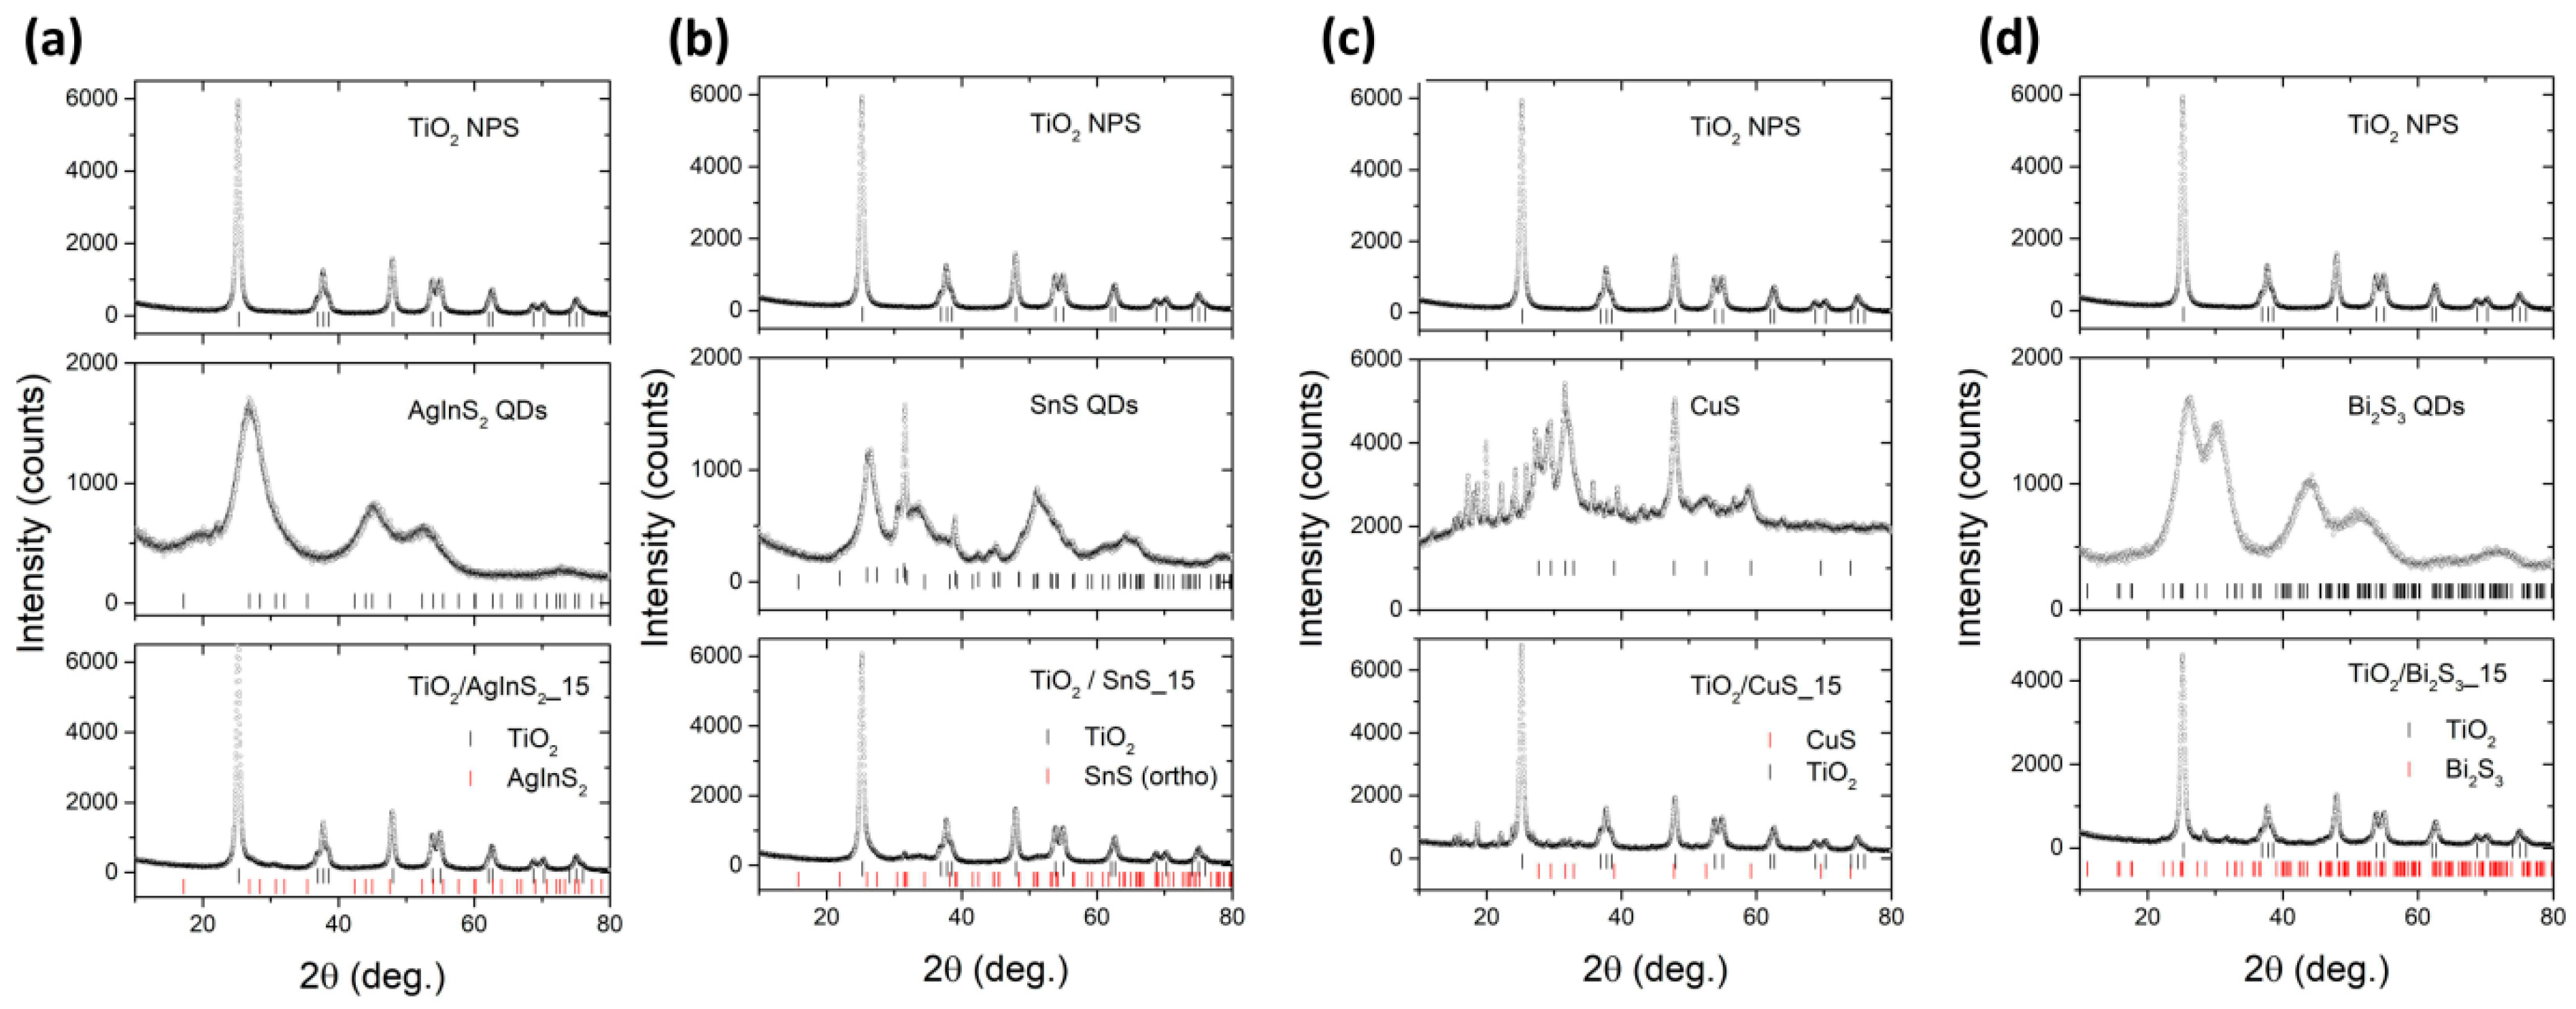
Figure 5 shows the X-ray diffraction (XRD) patterns of pristine TiO2, QDs and TiO2/QDs_15 composites. The peak diffraction observed at the 2θ values of 25, 37.8, 48.1, and 53.9° can be assigned to (101), (004), (200), and (105) crystallographic plane of anatase TiO2 with tetragonal crystal structure [31,43]. Three peaks at 2θ values of 26.5, 44.7, and 52.3° corresponding to the (112), (220), and (312) indices of the tetragonal crystal structure of AgInS2 QDs, respectively (Figure 5a) [44]. The broad diffraction peaks show the fine grains of the AgInS2 QDs. Orthorhombic structured SnS QDs is identified from the XRD pattern in Figure 5b. Three peaks at 2θ values of 25.9, 31.48 and 44.4° corresponds to planes (120), (111) and (141) [45]. For CuS QDs peaks around 27.7, 29.3, 31.8, and 47.9° can be assigned to the corresponding (100), (102), (103) and (110) crystal planes of CuS, which can be indexed as a hexagonal structure [46] (Figure 5c). The diffraction peaks that were matched to the orthorhombic structure of Bi2S3 QDs can be observed (Figure 5d) [47]. The very broad diffraction peaks show the fine grains of the Bi2S3 QDs. After loading 15 wt% of QDs, the XRD patterns of the QDs-sensitized TiO2 composite were almost the same as that of pure TiO2 confirming that surface modification did not influence the crystalline properties of TiO2.

2.5. FT-IR Analysis

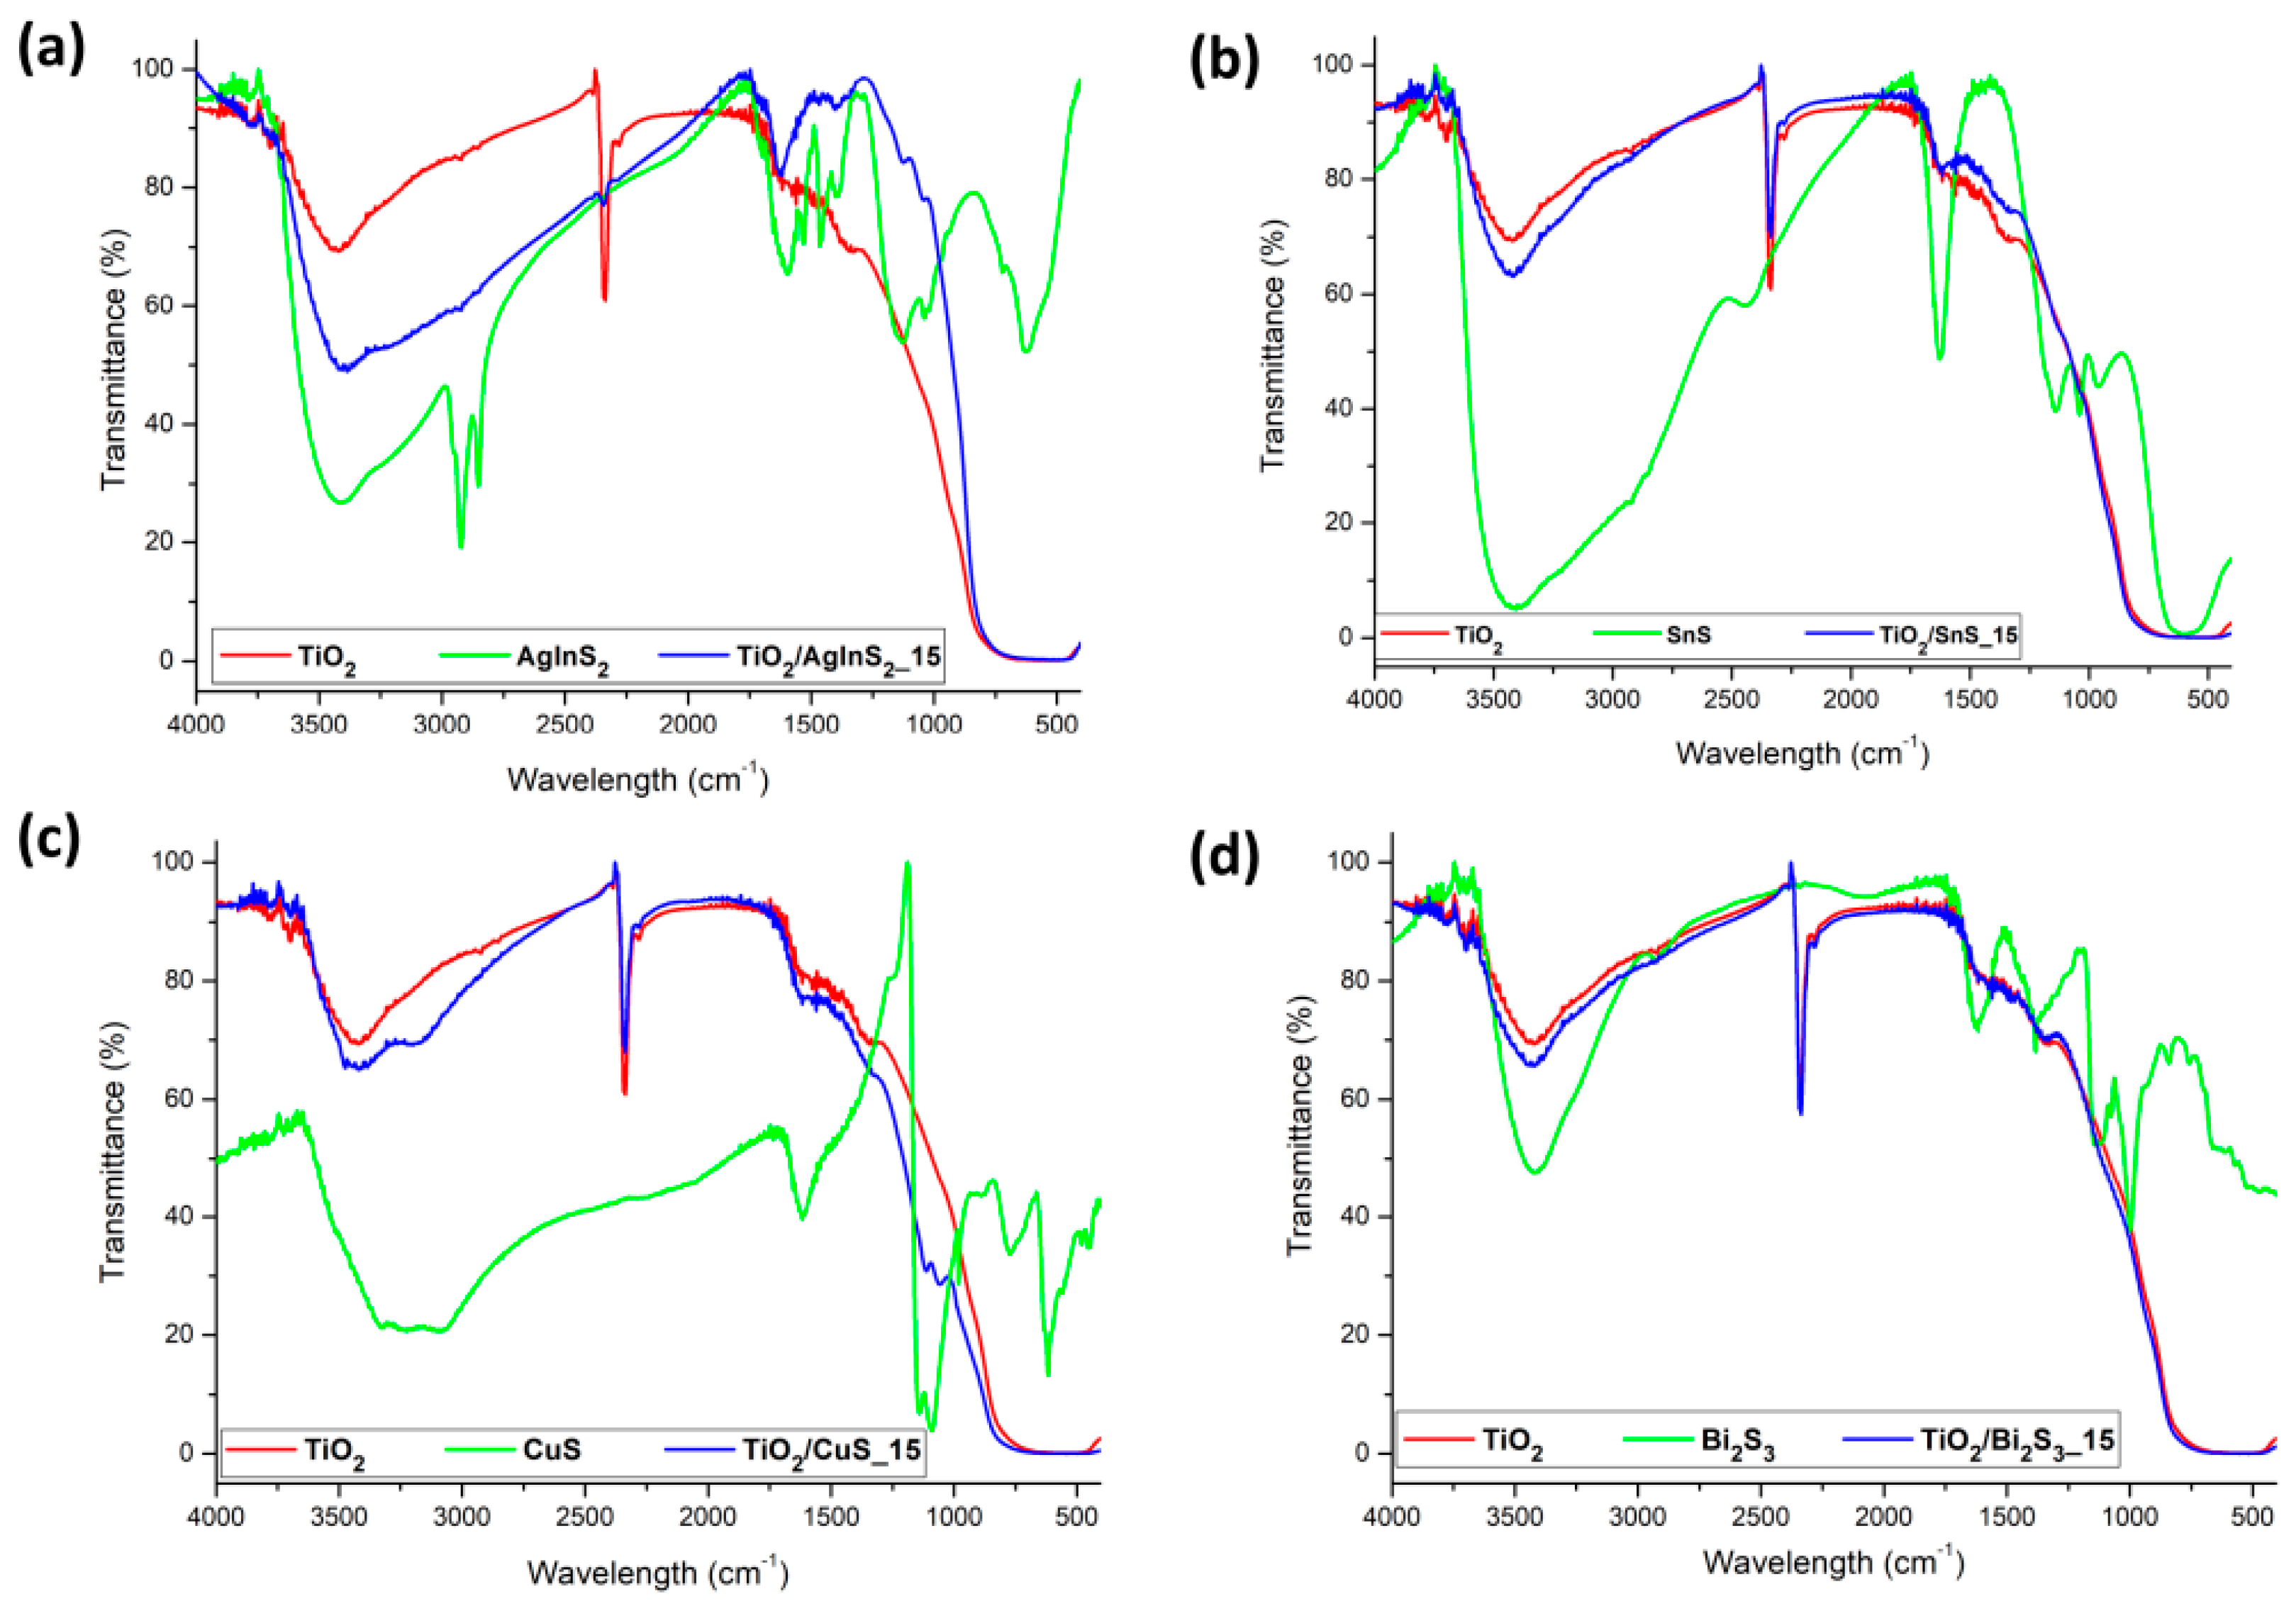
Figure 6 shows fourier transform infrared (FT-IR) spectra for pure TiO2 NPs, pure QDs and for TiO2 modified with 15% weight of selected sulphide. The groups of very weak, sharp bands occurring at wave numbers above 3600 cm−1 and 1600–1800 cm−1 are attributed to water vapor. Likewise strong doublet at 2336 cm−1 clearly comes from carbon dioxide, exactly from O=C=O stretching vibrations [48]. Mentioned above both compounds are contaminations that may have been present at measurement chamber during the analysis.
Furthermore CO2 can be adsorbed on the surface of TiO2 NPs as the case band is very distinct. The FTIR spectrum of pure TiO2 was given in Figure 6 a–d (red line) is characterized by several bands, which are evidence of the presence of specific functional groups. A very broad absorption band, centered in 3420 cm−1, originates from O–H stretching vibrations from hydroxyl groups of molecules surface. Medium band at 1620 cm−1 corresponds to water bending vibrations [49]. These two bands are repeated in most of the spectra presented in this chapter. Whereas peak at 1370 cm−1 and the strongest flat region between 400–850 cm−1 are typical for Ti–O and Ti–O–Ti stretching oscillation [50]. FT-IR AgInS2 spectra are given at Figure 6a. A strong pronounced doublet observed at 2923 and 2853 cm−1 are attributed to symmetric and asymmetric stretching modes of C–H [51]. Absorption, in this case, is strong because oleic acid (OA) was used to preparation probe therefore long chain hydrocarbon fragments were introduced. Bands at 1590, 1530 and twice peaks 1464, 1393 cm−1 corresponding to C=O stretching, N–H and H–C–H bending vibrations, respectively. The above bands are evidence of the presence of amide or amine groups that can form next bonds, two peaks at 1135 and 1032 cm−1 are attributed to C–N stretching modes. It confirms the existence of amide functional groups [44]. Strong peaks at 722 and 630 cm−1 are the result of H–C–H rocking and C–S stretching oscillation, respectively. TiO2/AgInS2_15 is the only case in which the shape of the spectrum is clearly closer to the shape of the pure AgInS2 than the TiO2 spectra. Each peak described for the AgInS2 is also visible in the spectrum of modified TiO2, the only exceptions are the peaks in the range 500–700 cm−1. Also, the sharp, strong absorption band visible on every spectrum at 2336 cm−1 (attributed to CO2) has been reduced in the TiO2/AgInS2 chart. The above analysis demonstrates that, in this case, the absorption AgInS2 on the surface of TiO2 occurred with the highest efficiency in this publication. At Figure 6b was presented spectra TiO2 modified with tin(II) sulphide. Namely bands at SnS spectra in 613, 950–1150 and 2440 cm−1 are typical for this compound [52,53]. Strengthened signal for 1620 cm−1 results from overlapping water and N-H bending vibrations amine group becomes from ammonium used in synthesis of semiconductor [54]. TiO2/SnS_15 spectrum exhibit features of both components although at first it seems identical to pure TiO2 NPs. Transmittance at wave numbers corresponding to characteristic bands of SnS is reduces which is visible as subtle peaks. Wavy spectra between 950–1150 cm−1 and slight signal at 2440 cm−1 are evidence of an effective adsorption process, SnS on TiO2 surface. CuS spectra are given at Figure 6c peak obtained for CuS in 3090 cm−1 comes from functional groups on surface of semiconductor, exactly N–H stretching vibrations. Two very strong vibrations at 1140 and 1090 cm−1 corresponds to C–O and S–O stretching [8]. These three bands described above are also visible in the TiO2/CuS_15 spectrum. Furthermore, oscillation localized between 500–700 cm−1 are typical for Cu–S stretching and are only clearly visible in the CuS spectra [55,56]. In Figure 6d was shown the effect of TiO2 modification using Bi2S3. The most important peaks are situated under 1500 cm−1, namely, a sharp band at 1390 cm−1 is due to the complex Bi3+ and citrate anions, which results from the type of precursors used for synthesis. Strong, sharp peaks at 1150 and 1000 cm−1 are attributed to stretching asymmetric and symmetric O–S–O vibrations. The band characteristics for Bi appear in the range 400–600 cm−1 [57]. All bands described above, except those in the range 400–600 cm−1, are reflected in spectra of TiO2/Bi2S3_15. Waved lines were observed in corresponding to interpreted peaks. Invisible bands in the 400–600 cm−1 range are masked by very strong, broad absorption band of TiO2. A similar phenomenon occurs in all spectra in this paragraph.

2.6. Photocatalytic Activity in the Gas Phase

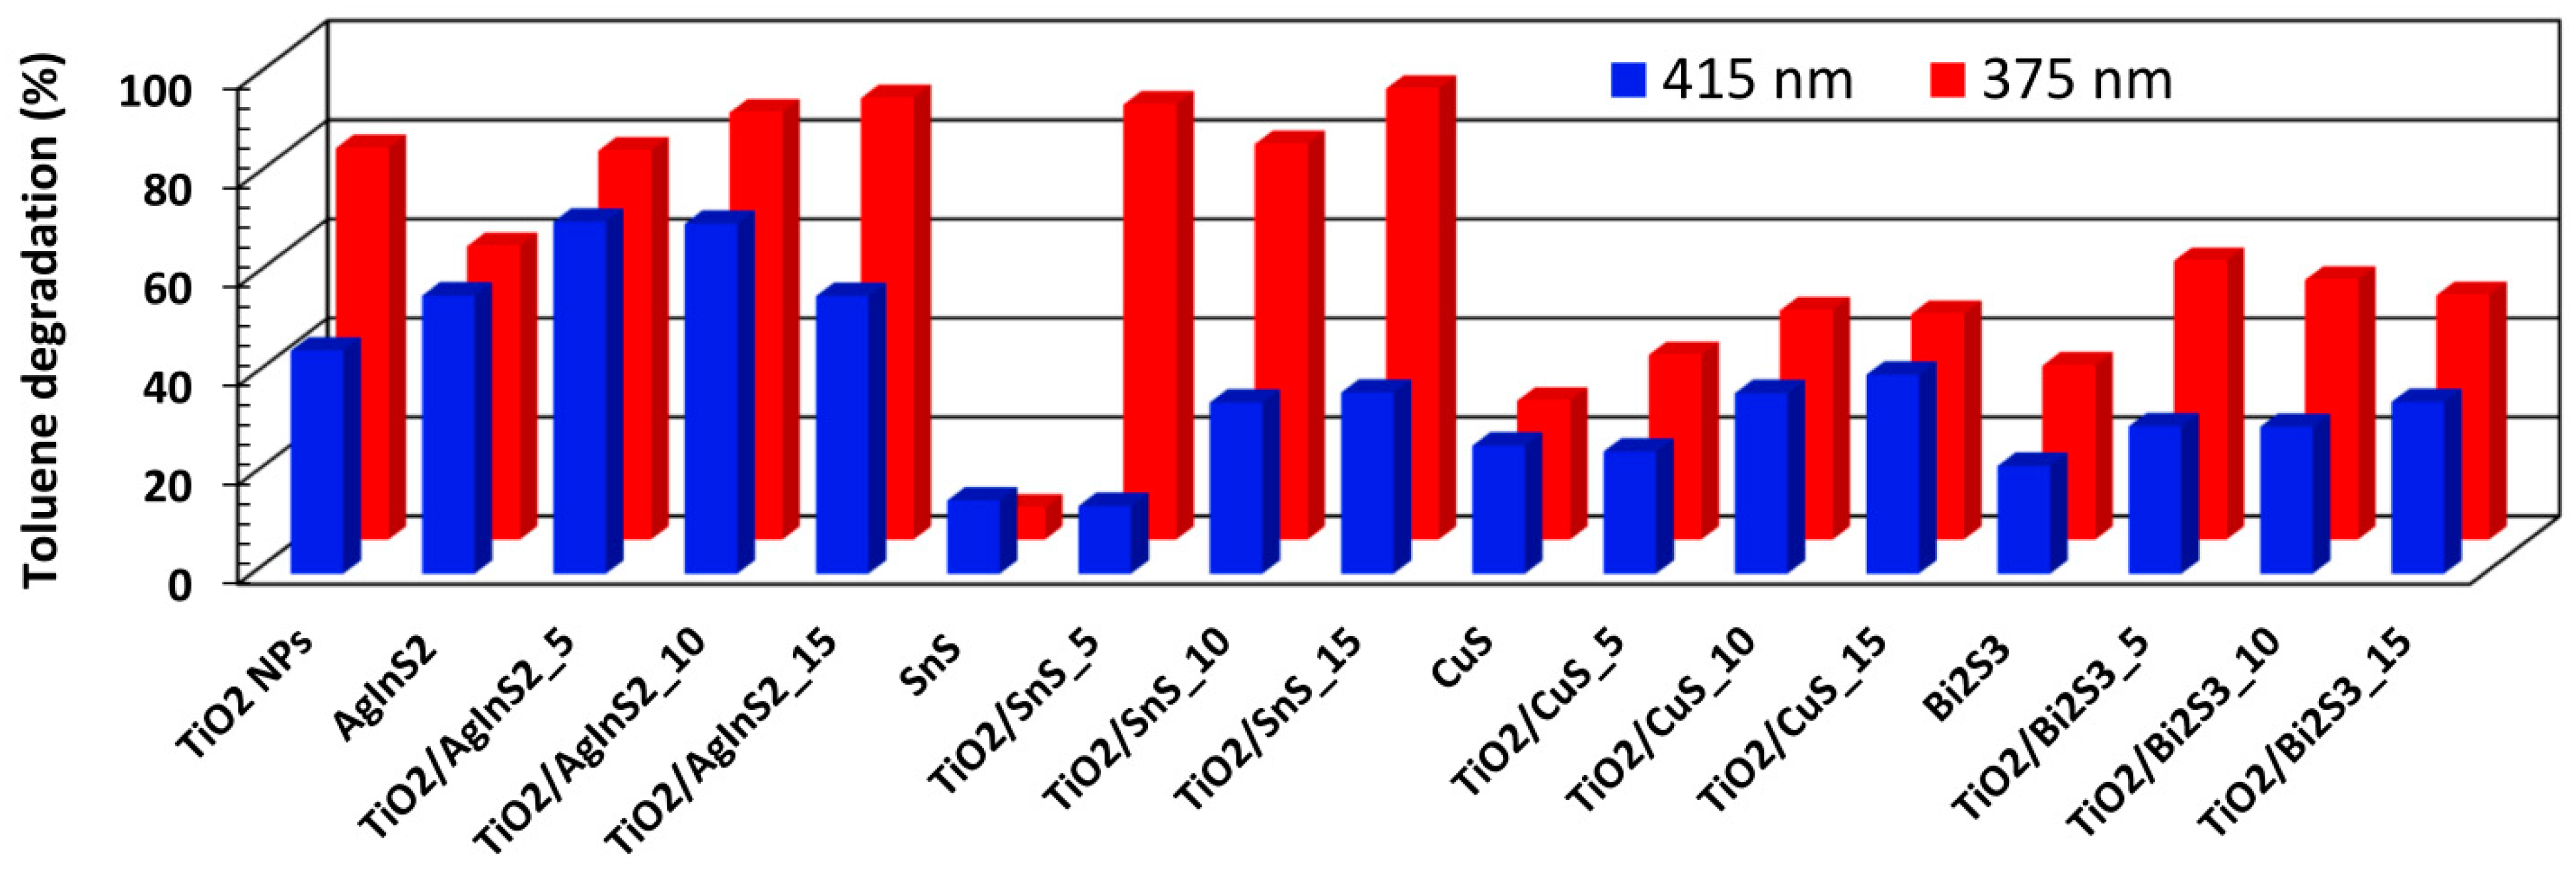
In order to investigate the photocatalytic activity of obtained photocatalysts, photocatalytic degradation of toluene in the gas phase were studied under 375 and 415 nm light irradiation. Under 375 nm for pristine QDs the efficiency of toluene degradation increased in the order of AgInS2 < Bi2S3 < CuS < SnS. All samples containing SnS quantum dots boosted the photocatalytic activity of TiO2 NPs under 375 nm light irradiation (Table 1, Figure 7). Cheraghizade et al. showed that SnS QDs photocatalytic activity depends on particle size. Prolonged sonication-assisted synthesis results in smaller crystallite size SnS QDs with higher photocatalytic activity. This is due to the reduced size of SnS QDs, in which the ratio of surface-to-volume is enhanced and so electron-hole creation of samples are also increased [36]. Although, pristine SnS QDs had very low activity in toluene photodegradation, the application of SnS QDs onto TiO2 surface most boosted reaction yield. The TiO2/SnS_15 sample exhibited the highest performance among other photocatalysts with 91.1% toluene degradation after 1 hour irradiation under 375 nm which proves that the load of 15% SnS QDs on TiO2 NPs matrix improved the photocatalytic activity of bare TiO2 NPs and pristine QDs by 1.15, and 12 times, respectively. High efficiency toluene degradation was also observed for TiO2/SnS_5 and TiO2/SnS_10, i.e., 87.9 and 79.7% of toluene was degraded after 1 h under 375 nm, respectively. These SnS QDs, when decorated onto the surfaces of TiO2 enable precise engineering of the band structure of the obtained composite. Through decoration of SnS QDs of suitable sizes, the charge separation of the TiO2 NPs is improved, while maintaining a suitable electronic potential to generate extra oxidizing species for toluene degradation [58]. High toluene degradation was observed for TiO2/AgInS2_10 and TiO2/AgInS2_15, while 5% modification (TiO2/AgInS2_5) decreased the activity of TiO2 NPs under 375 nm. Generally, it was observed, that in case of TiO2/AgInS2 composites, enhancement of concentration (from 5 to 15 wt.%) resulted in a linear increase of photoactivity under 375 nm and clear decrease in the recombination of electron hole pairs. The efficiency of toluene degradation increased from 78.6; 86.3 to 89.2% for TiO2/AgInS2_5, TiO2/AgInS2_10, and TiO2/AgInS2_15, respectively. The optimal content of quantum dots for TiO2/CuS composites was 10 wt.%. After 1 h, 46.3% toluene was degraded in the presence of TiO2/CuS_10 under 375 nm. Further increase in CuS QDs concentration (to 15 wt.%) resulted in a slight drop of photoactivity to 45.6 % for the sample TiO2/CuS_15. The TiO2/ Bi2S3_5 sample exhibited the highest performance among TiO2/ Bi2S3 composites under 375 nm (56.3%). Further increase in Bi2S3 concentration (to 15 wt.%) resulted in a drop of photoactivity to 49.4% for the sample TiO2/ Bi2S3_15. Lin et al. [59] reported that in case of CdSnO3-decorated CdS nanowire, for 2.5 at% of CdSnO3 the highest charge carrier separation was observed. Generally, building the TiO2/AgInS2 and TiO2/SnS composite resulted in a synergistic effect between QDs and TiO2 matrix. It was also observed that increasing AgInS2 QDs content on the surface TiO2 NPs resulted in (i) improved light harvesting ability, (ii) reduced recombination of e-h pairs and (iii) improved photoactivity under UV irradiation. Whereas modification with CuS and Bi2S3 showed lowered the activity than pristine TiO2 but higher activity than pristine CuS and Bi2S3 QDs under 375 and 415 nm. Under 415 nm for pristine QDs the efficiency of toluene degradation increased in the order of AgInS2 < CuS < Bi2S3 < SnS. An increase in SnS and CuS QDs concentration (from 5 to 15 wt.%) caused a linear increase in photoactivity under 415 nm. However, the highest toluene degradation was observed by AgInS2 modified TiO2 NPs while other modifications decreased the activity of TiO2 NPs after 1 h under 415 nm. TiO2/AgInS2_5 had the higher photocatalytic activity compare to TiO2/AgInS2_10 and TiO2/AgInS2_15 with 71.1% toluene degradation (Table 1, Figure 7). Therefore, it can be suggested that the most active sample for toluene degradation adheres to the type of the light irradiation. This is probably due to the electronic band structure of the TiO2 NPs and quantum dots that affect the photoexcited electrons and holes transfer route in the photocatalysts [21,60]. In summary, the photocatalytic activity was dependent on (i) type of QDs, (ii) amount of QDs and (iii) wavelength of the light irradiation.
In addition to those, the photostability of the most active sample under 375 nm irradiation, TiO2/SnS_15, was tested by carrying out 4 subsequent cycles. At the end of the cycle, the activity of TiO2/SnS_15 diminished by 9.65% (Figure 8). This deactivation can be explained mainly by the partial oxidation of toluene that leads to formation of intermediates such as benzaldehyde, benzyl alcohol, benzoic acid, benzene, and phenol which remain on the photocatalysis surface by strong adsorption [61]. In particular, with benzoic acid intermediate, more carbonyl group arises on the photocatalysis surface, which inhibits the electron density of the benzyl ring that makes the benzyl ring more inert, thus hard to break it [62,63].
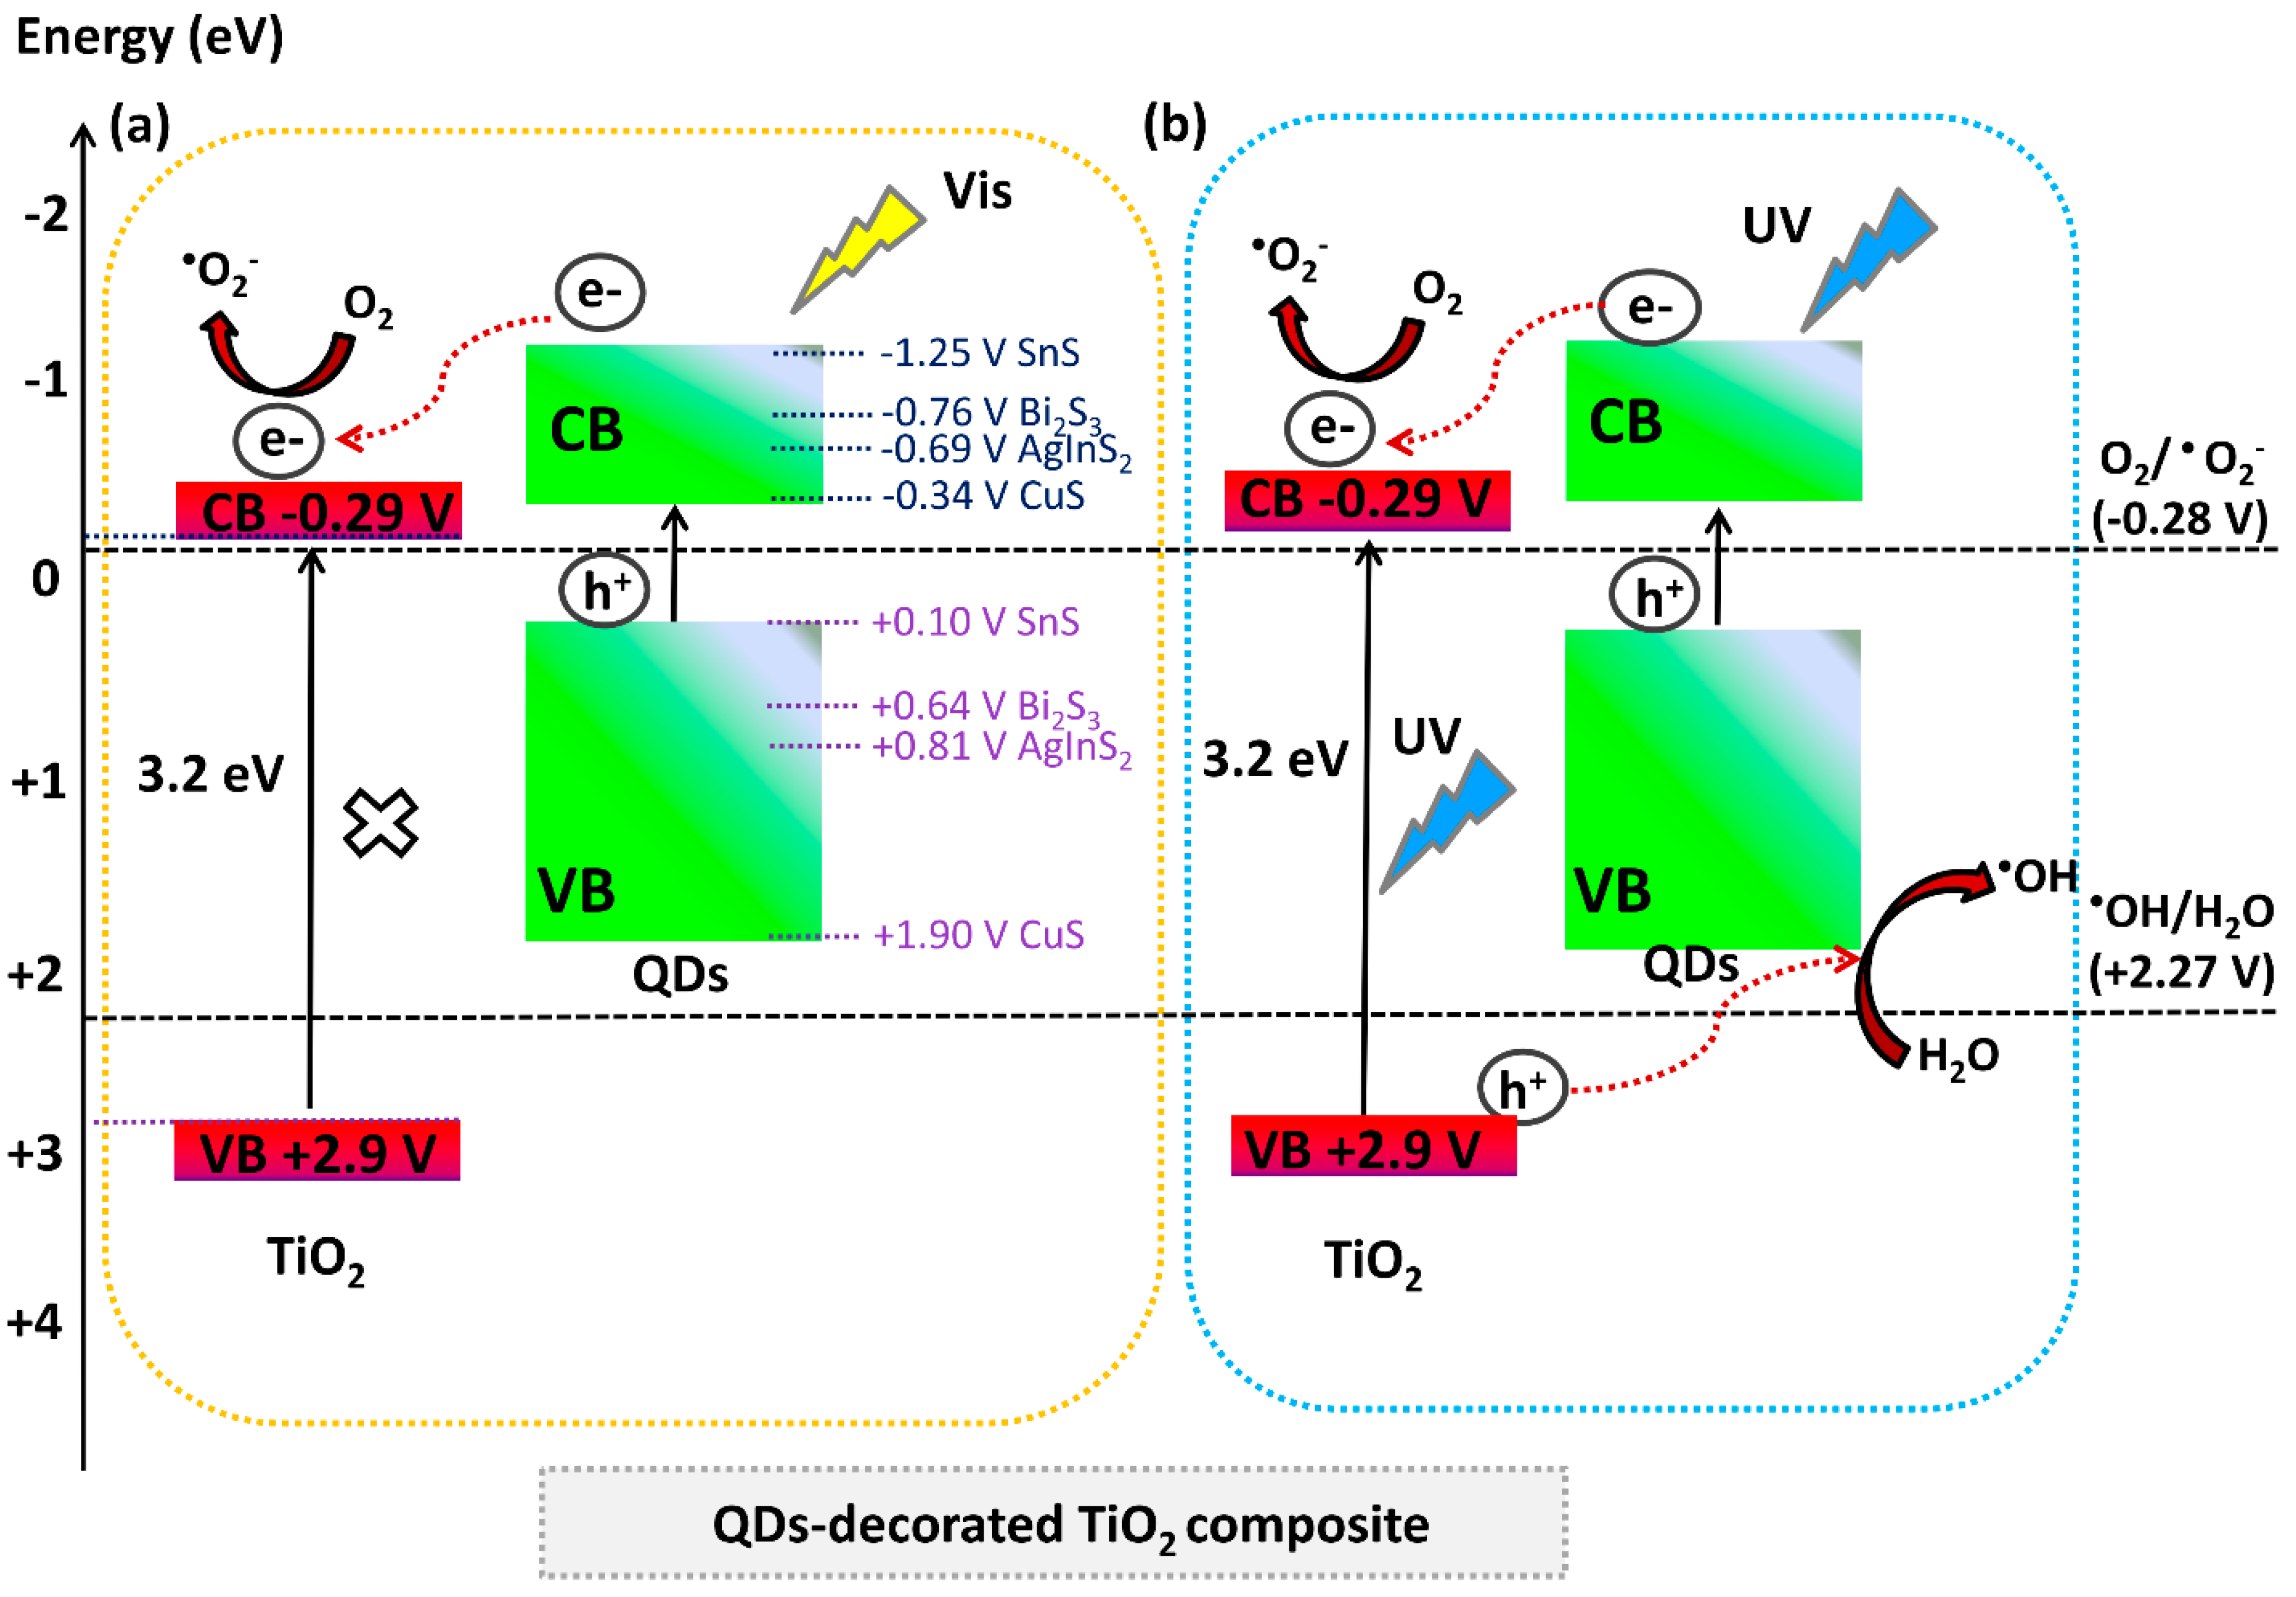
The photocatalytic mechanism for QDs-sensitized TiO2 composite under visible and UV irradiation has been proposed (Figure 9). All tested non-toxic QDs has narrow band gap and more negative conduction band (CB) energy level than CB of TiO2 (Table 2).
Photoexcited electrons are generated on the CB of QDs in upon the visible light absorption that leaves holes in the VB (Figure 9a). Since the CB of TiO2 is more positive than the CB of QDs, the photoexcited electrons transfer from the photoexcited QDs into the CB of TiO2 expectedly. Those electrons in CB of TiO2 reduce the O2 adsorbed on the surface of the photocatalyst to form O2. The VB potentials of QDs are more negative than the redox potential of OH/H2O (+2.27 V), indicating that the holes in the VB of QDs cannot oxidize H2O to produce OH.
Under UV irradiation, both TiO2 NPs and QDs was excited (Figure 9b). The electron from QDs can be inject into the CB of TiO2 NPs. The electron transfer from QDs to the TiO2 NPs is determined by the energy difference between the two CB positions energy levels, which acts as a driving force for interparticle electron transfer [25,68]. The highest difference between the CB positions energy levels were observed for TiO2 and SnS QDs, which means fastest electron transfer from QDs to TiO2 NPs and a high photocatalytic activity of those composites as showed in the experimental section. While, the holes formed in the VB of TiO2 had oxidative potential and can be easily transferred to the VB of QDs and then oxidize H2O and -OH to produce OH. In this way, the photogenerated electron-holes pairs can be effectively separated, which results in higher photoactivity in particular in presence of TiO2/AgInS2 and TiO2/SnS composite.

3. Experimental

3.1. Materials and Instruments

Tetrabutyl titanate (TBT, 97%, Sigma Aldrich, Saint Louis, MO, USA) and glycerol (99.5%, POCH, Gliwice, Poland) were used for TiO2 NPs prepartion. Silver nitrate (AgNO3, 99%, Sigma Aldrich, Saint Louis, MO, USA), indium (III) acetylacetonate (In(acac)3, 99.99%, Sigma Aldrich, Saint Louis, MO, USA), sulfur powder (S, 99.98%, POCH, Gliwice, Poland), 1-octadecene (ODE, 90%, Sigma Aldrich, Saint Louis, MO, USA), dodecanethiol (DDT, 98%, Alfa Aesar, Haverhill, MA, USA), oleylamine (OLA, 90%, ACROS ORGANICS, Gell Belgium), oleic acid (OA, 90%, Sigma Aldrich, Saint Louis, MO, USA) were used for AgInS2 QDs synthesis. Tin chloride (SnCl2, 99%, POCH, Gliwice, Poland), ammonium acetate (CH3COONH4, 99%, Sigma Aldrich, Saint Louis, MO, USA), ammonia (NH3, 25%, Chempur, Piekary Śląskie, Poland) sodium thiosulfate (Na2S2O3x5H2O, 99,5%, POCH, Gliwice, Poland) were used for SnS QDs synthesis. Thioacetamide (C2H5NS, 99%, Sigma Aldrich, Saint Louis, MO, USA), copper chloride (CuCl2xH2O, 99%, POCH, Gliwice, Poland) were used for CuS QDs synthesis. Sodium sulfide (Na2S, 99.9%, Sigma Aldrich, Saint Louis, MO, USA), ammonium bismuth citrate (99%, Sigma Aldrich, Saint Louis, MO, USA), starch (C6H12O5, pure p.a.) were used for Bi2S3 QDs synthesis. Deionized water was used in all the experiments.
The UV−vis spectra of samples were recorded in the scan range 250−650 nm using UV−vis spectrophotometer (UV 2600, Shimadzu, Kioto, Japan) equipped with BaSO4 as the reference. The photoluminescence (PL) emission spectra were measured by a PerkinElmer Luminescence Spectrometer LS 50B (Hamamatsu, Japan) equipped with xenon discharge lamp as an excitation source. The samples were excited with 330 nm at room temperature and the emission was scanned between 300 and 800 nm. X-ray diffraction (X’Pert Pro MPD Philips diffractometer, Almelo, The Netherands) with Cu Kα radiation λ = 1.5418 Å was used to determine the sample’s composition. The measurements were performed on the 2θ range of 10−80°. The morphology of samples have been analyzed by high-resolution transmission electron microscopy (HRTEM, Brno, Czech Republic, FEI Europe, model TecnaiF20 X-Twin) and scanning electron microscopy (JEOL, Tokyo, Japan, JSM-7610F operating at 15 kV). The preparation of the TEM samples was the following: sonication for 5 seconds of a few milligrams of sample in ethanol (99.8% anhydrous) using ultrasounds, then applying a drop of the solution of 5 μl on a carbon coated copper mesh with holes (Lacey type Cu 400 mesh, Plano), then the solvent was evaporating at room temperature. FT-IR spectra were obtained on a Bruker model IF S66 FTIR spectrometer using potassium bromide discs.

3.2. Sample Preparation

3.2.1. TiO2 NPs Preparation

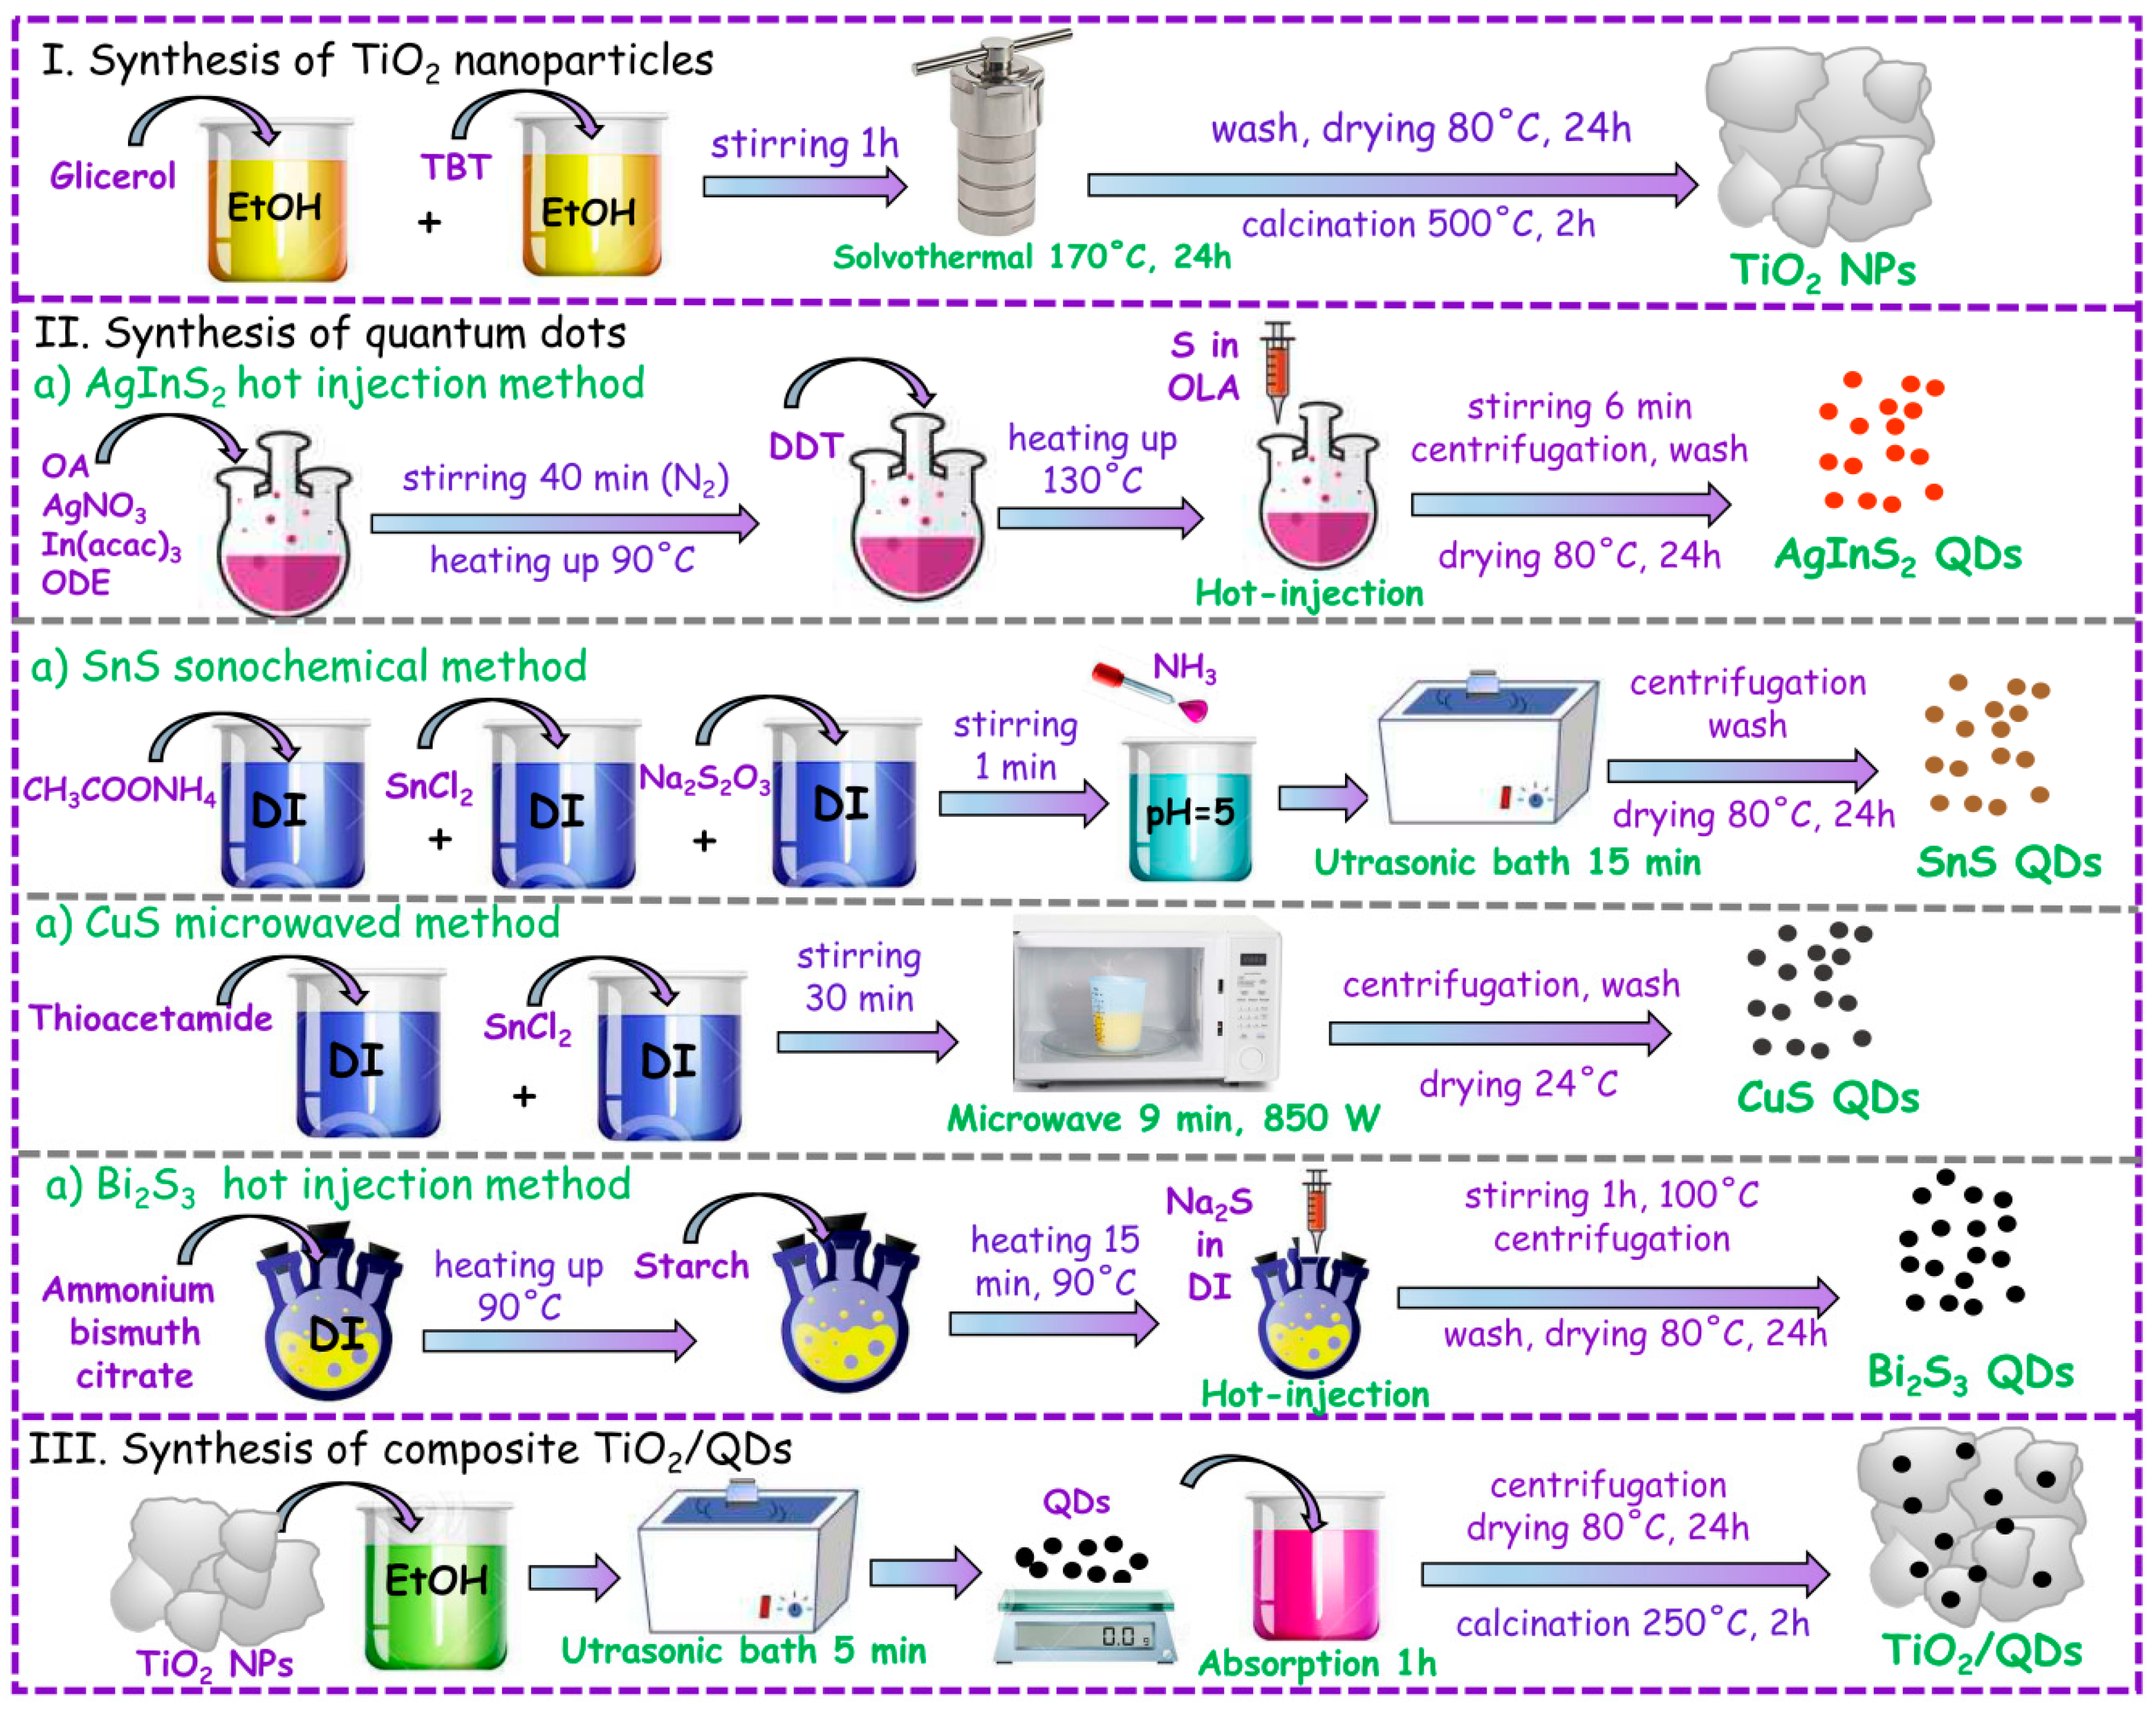
The pristine TiO2 NPs were synthesized by one-step solvothermal method. In a typical procedure, TBT (2.99 g) and glicerol (1.99 g) were mixed with 45 mL absolute ethyl alcohol, respectively. Then, both solutions were mixed together, followed by stirring for 1h. Then obtained suspension was transferred into a Teflon-lined stainless steel autoclave (200 ml capacity) (170 °C for 24 h). After being cooled in the air to room temperature, the products were washed three times with ethanol and then dried in an oven at 80 °C for 24 h. The white TiO2 powder was calcined at 500°C for 2 h (in air, heating rate of 2 °C/min) (Figure 10).

3.2.2. Quantum Dots Preparation

(a) AgInS2 QDs Preparation
The AgInS2 QDs were synthesized by hot-injection method similar to that described by Ruan et al. [69]. AgNO3 (0.0176 g), In(acac)3 (0.208 g) and OA (0.47 mL) were mixed and added into a three-neck flask. Then, 8 ml of ODE was added to the obtained solution. The mixing solution was stirred and degassed with N2 for 40 min. After that, the solution was heated to 90 °C and then DDT (1.0 mL) was injected into the flask. The obtained solution was then heated to 130 °C and the sulfur solution (0.0053 g S powder dissolved in 2.6 mL OLA) was quickly injected, and the solution continued stirring for 6 min. The resulting liqiud product was orange color. After being cooled to room temperature, the products were collected by centrifugation (6000 rpm, 10 min) and washed 3× with ethanol. Finally, the AgInS2 QDs was dried (80 °C for 24 h) (Figure 10).
(b) SnS QDs Preparation
The SnS QDs were synthesized by sonochemical method [36]. In a first step, three solutions were prepared (i) SnCl2 x 2H2O (0.9165 g) in 40 ml deionized water (DI), (ii) ammonium acetate (0.3119 g) in 40 ml DI, and (iii) Na2S2O3 (0.9578 g) dissolved in 20 ml DI. Then, all above solutions were mixed at 25 °C, followed by stirring for 1 minute and its pH was adjusted at 5 using addition of ammonia. After that the reaction mixture was introduced into an ultrasonic bath for 15 min. The products were washed times with deionized water, centrifuged (10 min. 6000 rpm) and dried (80 °C for 24 h). The resulting product was brown color (Figure 10).
(c) CuS QDs Preparation
The CuS QDs were prepared by through a simple and cost-effective microwave method [37]. In a typical procedure, CuCl2 x 2H2O (0.1344 g dissolved in 100 mL H2O) and thioacetamide (0.0901 g dissolved in 100 ml H2O) were mixed for 30 min at 25 °C. Then, the resulting solution was placed into the microwave 9 min at 850 W and the formation of black precipitates appeared. The CuS QDs were collected by centrifugation (6000 rpm, 20 min), washed 3 times with DI and dried at 25 °C (Figure 10).
(d) Bi2S3 QDs Preparation
Bi2S3 QDs were obtained by the hot-injection method using a starch capping agent [68]. Firstly, ammonium bismuth citrate (0.4043 g) was dissolved in 20 ml DI. Then mixture was heated to 95 °C and soluble starch (0.2015 g) was added and was kept at 95 °C for about 15 min. Then, the Na2S (0.4051 g dissolved in 20 mL of deionized water) was added into to the ammonium bismuth citrate solution and stirred at 100 °C for 1 h. The powder was collected by centrifugation (6000 rpm, 10 min), and washed 3× with DI. Finally, the Bi2S3 QDs was dried at 80 °C for 24 h (Figure 10).

3.2.3. Preparation of Quantum Dot-sensitized TiO2 Composites

TiO2/QDs (AgInS2, CuS, SnS, Bi2S3) photocatalysts were synthesized by absorption method (Figure 10). Typically, 30 mL of ethanol containing the TiO2 NPs was ultrasonicated for 5 min to make NPs completely dispersed. Then, a different amount of QDs (5,10,15% wt%) was added to suspension of photocatalysts, followed by stirring for 6 h (250 rpm/min.). After that, TiO2/QDs photocatalysts were collected by centrifugation (7000 rpm, 20 min) and dried at 70 °C for 24 h. Finally, the powder was calcined at 250 °C for 2 h (in air, heating rate of 3 °C/min). The description of the as-prepared photocatalysts is shown in Table 1.

3.3. Measurement of Photocatalytic Activity

The photocatalytic activity was determined in the toluene degradation process [70]. As an irradiation source, an array of 25 LEDs (λmax = 375 nm, 13.16 mW/cm2) and (λmax = 415 nm, 1.6 mW/cm2) (Optel, Opole, Poland), these diodes contain a part of UV radiation) were used. In a typical procedure, a thin film of the photocatalyst was prepared by suspending of photocatalyst (0.01 g) in water and loading it on a glass plate (3 cm × 3 cm) by painting technique. The gas mixture (with toluene concentration 200 ppm) was passed through the photoreactor (1 min), and the reactor was kept in the dark for 30 min in order to achieve equilibrium. The toluene concentration was determined by using a GC (TRACE 1300, Thermo Scientific, Waltham, MA, USA, FID, Elite-5 capillary column).

4. Conclusions

In summary, for pristine QDs the efficiency of toluene degradation increased in the order of AgInS2 < Bi2S3 < CuS < SnS under 375 nm and AgInS2 < CuS < Bi2S3 < SnS under 415 nm. All samples containing SnS quantum dots boosted the photocatalytic activity of TiO2 NPs under 375 nm light irradiation, which are related to a heterojunction with highest difference between the CB positions energy levels and thus faster electron transfer from SnS QDs to TiO2 NPs. The loading of 15% SnS QDs on TiO2 NPs matrix improved the photocatalytic activity of bare QDs 12 times. Generally, building the TiO2/AgInS2 and TiO2/SnS exhibited higher photoactivity under 375 nm than the pristine TiO2 and QDs, which resulted in a synergistic effect between QDs and TiO2 matrix. This enhancement can be also related with the improved light harvesting ability and decreasing recombination of electron–hole pairs by QDs-decorated TiO2. Whereas, modification with CuS and Bi2S3 showed lowered the activity than pristine TiO2 but higher activity than pristine CuS and Bi2S3 QDs under 375 and 415 nm. The photocatalytic activity of pristine QDs and QDs-decorated TiO2 composites is different, which means that it is important to create the appropriate heterojunction between QDs and semiconductor nanoparticles. Our results may provide useful guide for designing of QDs-sensitized TiO2 composite for the air purification in the presence of low powered and low cost irradiation sources (LEDs), which reduce the costs of the photocatalytic processes. QD-decorated semiconductor NPs composites are considered to play an increasing role in photocatalytic applications in the near future.

Supplementary Materials

The following are available online at https://www.mdpi.com/2073-4344/10/4/403/s1, Table S1. TEM-EDX analysis for (a) AgInS2 QDs, (b) SnS QDs, (c) TiO2/AgInS2_15, (d) TiO2/SnS_15, (e) TiO2/CuS_15, (f) TiO2/Bi2S3_15.

Author Contributions

Conceptualization, A.M.; funding acquisition, A.M; experiment design, A.M., D.K., J.S., O.C., T.K. and G.T.; data analysis, A.M., J.S., O.C., A.Z-M., T.K. and G.T.; writing—original draft, A.M., J.S., O.C., T.K. and A.Z.-M.; writing—review and editing, A.M. and A.Z.-M.; supervision, A.M. All authors have read and agreed to the published version of the manuscript.

Funding

This research was financially supported by Polish National Science Centre (Grant Sonata, No. NCN 2016/23/D/ST8/02682).

Conflicts of Interest

The authors declare no conflict of interest.

References

  1. Bajorowicz, B.; Kobylański, M.P.; Malankowska, A.; Mazierski, P.; Nadolna, J.; Pieczyńska, A.; Zaleska-Medynska, A. 4—Application of metal oxide-based photocatalysis. In Metal Oxide-Based Photocatalysis; Zaleska-Medynska, A., Ed.; Elsevier: Amsterdam, The Netherlands, 2018; pp. 211–340. [Google Scholar]
  2. Nath, R.K.; Zain, M.F.M.; Jamil, M. An environment-friendly solution for indoor air purification by using renewable photocatalysts in concrete: A review. Renew. Sustain. Energy Rev. 2016, 62, 1184–1194. [Google Scholar] [CrossRef]
  3. Ren, H.; Koshy, P.; Chen, W.-F.; Qi, S.; Sorrell, C.C. Photocatalytic materials and technologies for air purification. J. Hazard. Mater. 2017, 325, 340–366. [Google Scholar] [CrossRef] [PubMed]
  4. Wang, X.; Wang, F.; Sang, Y.; Liu, H. Full-Spectrum Solar-Light-Activated Photocatalysts for Light–Chemical Energy Conversion. Adv. Energy Mater. 2017, 7, 1700473. [Google Scholar] [CrossRef] [Green Version]
  5. Gao, C.; Low, J.; Long, R.; Kong, T.; Zhu, J.; Xiong, Y. Heterogeneous Single-Atom Photocatalysts: Fundamentals and Applications. Chem. Rev. 2020. [Google Scholar] [CrossRef] [PubMed]
  6. Kampouri, S.; Stylianou, K.C. Dual-Functional Photocatalysis for Simultaneous Hydrogen Production and Oxidation of Organic Substances. ACS Catal. 2019, 9, 4247–4270. [Google Scholar] [CrossRef]
  7. Wang, Z.; Li, C.; Domen, K. Recent developments in heterogeneous photocatalysts for solar-driven overall water splitting. Chem. Soc. Rev. 2019, 48, 2109–2125. [Google Scholar] [CrossRef]
  8. Byrne, C.; Subramanian, G.; Pillai, S.C. Recent advances in photocatalysis for environmental applications. J. Environ. Chem. Eng. 2018, 6, 3531–3555. [Google Scholar] [CrossRef]
  9. Di, T.; Xu, Q.; Ho, W.; Tang, H.; Xiang, Q.; Yu, J. Review on Metal Sulphide-based Z-scheme Photocatalysts. ChemCatChem 2019, 11, 1394–1411. [Google Scholar] [CrossRef]
  10. Liu, B.; Li, X.; Zhao, Q.; Ke, J.; Tadé, M.; Liu, S. Preparation of AgInS2/TiO2 composites for enhanced photocatalytic degradation of gaseous o-dichlorobenzene under visible light. Appl. Catal. B Environ. 2016, 185, 1–10. [Google Scholar] [CrossRef]
  11. Jiang, Y.; Yang, Z.; Zhang, P.; Jin, H.; Ding, Y. Natural assembly of a ternary Ag–SnS–TiO2 photocatalyst and its photocatalytic performance under simulated sunlight. RSC Adv. 2018, 8, 13408–13416. [Google Scholar] [CrossRef] [Green Version]
  12. Chandra, M.; Bhunia, K.; Pradhan, D. Controlled Synthesis of CuS/TiO2 Heterostructured Nanocomposites for Enhanced Photocatalytic Hydrogen Generation through Water Splitting. Inorg. Chem. 2018, 57, 4524–4533. [Google Scholar] [CrossRef] [PubMed]
  13. Kaur, A.; Umar, A.; Anderson, W.A.; Kansal, S.K. Facile synthesis of CdS/TiO2 nanocomposite and their catalytic activity for ofloxacin degradation under visible illumination. J. Photochem. Photobiol. A Chem. 2018, 360, 34–43. [Google Scholar] [CrossRef]
  14. Al-Fahdi, T.; Al Marzouqi, F.; Kuvarega, A.T.; Mamba, B.B.; Al Kindy, S.M.Z.; Kim, Y.; Selvaraj, R. Visible light active CdS@TiO2 core-shell nanostructures for the photodegradation of chlorophenols. J. Photochem. Photobiol. A Chem. 2019, 374, 75–83. [Google Scholar] [CrossRef]
  15. Yang, H.; Liu, Z.; Wang, K.; Pu, S.; Yang, S.; Yang, L. A Facile Synthesis of TiO2–CdS Heterostructures With Enhanced Photocatalytic Activity. Catal. Lett. 2017, 147, 2581–2591. [Google Scholar] [CrossRef]
  16. Zhang, X.; Gao, Y.; Nengzi, L.-C.; Li, B.; Gou, J.; Cheng, X. Synthesis of SnS/TiO2 nano-tube arrays photoelectrode and its high photoelectrocatalytic performance for elimination of 2,4,6-trichlorophenol. Sep. Purif. Technol. 2019, 228, 115742. [Google Scholar] [CrossRef]
  17. Yadav, S.K.; Jeevanandam, P. Synthesis of Ag2S–TiO2 nanocomposites and their catalytic activity towards rhodamine B photodegradation. J. Alloys Compd. 2015, 649, 483–490. [Google Scholar] [CrossRef]
  18. Li, Z.; Xiong, S.; Wang, G.; Xie, Z.; Zhang, Z. Role of Ag2S coupling on enhancing the visible-light-induced catalytic property of TiO2 nanorod arrays. Sci. Rep. 2016, 6, 19754. [Google Scholar] [CrossRef] [PubMed] [Green Version]
  19. Xu, F.; Zhang, J.; Zhu, B.; Yu, J.; Xu, J. CuInS2 sensitized TiO2 hybrid nanofibers for improved photocatalytic CO2 reduction. Appl. Catal. B Environ. 2018, 230, 194–202. [Google Scholar] [CrossRef]
  20. Li, C.; Xi, Z.; Fang, W.; Xing, M.; Zhang, J. Enhanced photocatalytic hydrogen evolution activity of CuInS2 loaded TiO2 under solar light irradiation. J. Solid State Chem. 2015, 226, 94–100. [Google Scholar] [CrossRef]
  21. Shen, F.; Que, W.; Liao, Y.; Yin, X. Photocatalytic Activity of TiO2 Nanoparticles Sensitized by CuInS2 Quantum Dots. Ind. Eng. Chem. Res. 2011, 50, 9131–9137. [Google Scholar] [CrossRef]
  22. Kim, J.; Kang, M. High photocatalytic hydrogen production over the band gap-tuned urchin-like Bi2S3-loaded TiO2 composites system. Int. J. Hydrog. Energy 2012, 37, 8249–8256. [Google Scholar] [CrossRef]
  23. Lu, J.; Han, Q.; Wang, Z. Synthesis of TiO2/Bi2S3 heterojunction with a nuclear-shell structure and its high photocatalytic activity. Mater. Res. Bull. 2012, 47, 1621–1624. [Google Scholar] [CrossRef]
  24. Yang, L.; Sun, W.; Luo, S.; Luo, Y. White fungus-like mesoporous Bi2S3 ball/TiO2 heterojunction with high photocatalytic efficiency in purifying 2,4-dichlorophenoxyacetic acid/Cr(VI) contaminated water. Appl. Catal. B Environ. 2014, 156, 25–34. [Google Scholar] [CrossRef]
  25. Bajorowicz, B.; Kobylański, M.P.; Gołąbiewska, A.; Nadolna, J.; Zaleska-Medynska, A.; Malankowska, A. Quantum dot-decorated semiconductor micro- and nanoparticles: A review of their synthesis, characterization and application in photocatalysis. Adv. Colloid Interface Sci. 2018, 256, 352–372. [Google Scholar] [CrossRef] [PubMed]
  26. Zhu, Y.; Wang, Y.; Chen, Z.; Qin, L.; Yang, L.; Zhu, L.; Tang, P.; Gao, T.; Huang, Y.; Sha, Z.; et al. Visible light induced photocatalysis on CdS quantum dots decorated TiO2 nanotube arrays. Appl. Catal. A Gen. 2015, 498, 159–166. [Google Scholar] [CrossRef]
  27. Liu, L.; Hui, J.; Su, L.; Lv, J.; Wu, Y.; Irvine, J.T.S. Uniformly dispersed CdS/CdSe quantum dots co-sensitized TiO2 nanotube arrays with high photocatalytic property under visible light. Mater. Lett. 2014, 132, 231–235. [Google Scholar] [CrossRef]
  28. Li, X.; Wang, J.; Men, Y.; Bian, Z. TiO2 mesocrystal with exposed (001) facets and CdS quantum dots as an active visible photocatalyst for selective oxidation reactions. Appl. Catal. B Environ. 2016, 187, 115–121. [Google Scholar] [CrossRef]
  29. Ge, L.; Liu, J. Synthesis and photocatalytic performance of novel CdS quantum dots sensitized Bi2WO6 photocatalysts. Mater. Lett. 2011, 65, 1828–1831. [Google Scholar] [CrossRef]
  30. Mao, L.; Jiang, W.; He, L.; Fang, P. Photocatalytic activity of TiO2 sensitized by CdS quantum dots under visible-light irradiation. Wuhan Univ. J. Nat. Sci. 2011, 16, 313–318. [Google Scholar] [CrossRef]
  31. Mazierski, P.; Nadolna, J.; Nowaczyk, G.; Lisowski, W.; Winiarski, M.J.; Klimczuk, T.; Kobylański, M.P.; Jurga, S.; Zaleska-Medynska, A. Highly Visible-Light-Photoactive Heterojunction Based on TiO2 Nanotubes Decorated by Pt Nanoparticles and Bi2S3 Quantum Dots. J. Phys. Chem. C 2017, 121, 17215–17225. [Google Scholar] [CrossRef]
  32. Qian, X.; Yue, D.; Tian, Z.; Reng, M.; Zhu, Y.; Kan, M.; Zhang, T.; Zhao, Y. Carbon quantum dots decorated Bi2WO6 nanocomposite with enhanced photocatalytic oxidation activity for VOCs. Appl. Catal. B Environ. 2016, 193, 16–21. [Google Scholar] [CrossRef]
  33. Martins, N.C.T.; Ângelo, J.; Girão, A.V.; Trindade, T.; Andrade, L.; Mendes, A. N-doped carbon quantum dots/TiO2 composite with improved photocatalytic activity. Appl. Catal. B Environ. 2016, 193, 67–74. [Google Scholar] [CrossRef]
  34. Bajorowicz, B.; Nadolna, J.; Lisowski, W.; Klimczuk, T.; Zaleska-Medynska, A. The effects of bifunctional linker and reflux time on the surface properties and photocatalytic activity of CdTe quantum dots decorated KTaO3 composite photocatalysts. Appl. Catal. B Environ. 2017, 203, 452–464. [Google Scholar] [CrossRef]
  35. Marchelek, M.; Grabowska, E.; Klimczuk, T.; Lisowski, W.; Zaleska-Medynska, A. Various types of semiconductor photocatalysts modified by CdTe QDs and Pt NPs for toluene photooxidation in the gas phase under visible light. Appl. Surf. Sci. 2017, 393, 262–275. [Google Scholar] [CrossRef]
  36. Cheraghizade, M.; Jamali-Sheini, F.; Yousefi, R.; Niknia, F.; Mahmoudian, M.R.; Sookhakian, M. The effect of tin sulfide quantum dots size on photocatalytic and photovoltaic performance. Mater. Chem. Phys. 2017, 195, 187–194. [Google Scholar] [CrossRef]
  37. Chaudhary, G.R.; Bansal, P.; Mehta, S.K. Recyclable CuS quantum dots as heterogeneous catalyst for Biginelli reaction under solvent free conditions. Chem. Eng. J. 2014, 243, 217–224. [Google Scholar] [CrossRef]
  38. Cui, W.; An, W.; Liu, L.; Hu, J.; Liang, Y. Novel Cu2O quantum dots coupled flower-like BiOBr for enhanced photocatalytic degradation of organic contaminant. J. Hazard. Mater. 2014, 280, 417–427. [Google Scholar] [CrossRef]
  39. Liqiang, J.; Yichun, Q.; Baiqi, W.; Shudan, L.; Baojiang, J.; Libin, Y.; Wei, F.; Honggang, F.; Jiazhong, S. Review of photoluminescence performance of nano-sized semiconductor materials and its relationships with photocatalytic activity. Solar Energy Mater. Solar Cells 2006, 90, 1773–1787. [Google Scholar] [CrossRef]
  40. Yen, Y.C.; Chen, J.Z.; Lu, Y.J.; Gwo, S.; Lin, K.J. Chain-network anatase/TiO2 (B) thin film with improved photocatalytic efficiency. Nanotechnology 2014, 25, 235602. [Google Scholar] [CrossRef]
  41. Grabowska, E.; Marchelek, M.; Klimczuk, T.; Trykowski, G.; Zaleska-Medynska, A. Noble metal modified TiO2 microspheres: Surface properties and photocatalytic activity under UV–vis and visible light. J. Mol. Catal. A Chem. 2016, 423, 191–206. [Google Scholar] [CrossRef]
  42. Saraf, L.V.; Patil, S.I.; Ogale, S.B.; Sainkar, S.R.; Kshirsager, S.T. Synthesis of Nanophase TiO2 by Ion Beam Sputtering and Cold Condensation Technique. Int. J. Mod. Phys. B 1998, 12, 2635–2647. [Google Scholar] [CrossRef]
  43. Gołąbiewska, A.; Malankowska, A.; Jarek, M.; Lisowski, W.; Nowaczyk, G.; Jurga, S.; Zaleska-Medynska, A. The effect of gold shape and size on the properties and visible light-induced photoactivity of Au-TiO2. Appl. Catal. B Environ. 2016, 196, 27–40. [Google Scholar] [CrossRef]
  44. Chang, J.-Y.; Wang, G.-Q.; Cheng, C.-Y.; Lin, W.-X.; Hsu, J.-C. Strategies for photoluminescence enhancement of AgInS2 quantum dots and their application as bioimaging probes. J. Mater. Chem. 2012, 22, 10609–10618. [Google Scholar] [CrossRef]
  45. Deepa, K.G.; Nagaraju, J. Growth and photovoltaic performance of SnS quantum dots. Mater. Sci. Eng. B 2012, 177, 1023–1028. [Google Scholar] [CrossRef]
  46. Li, S.; Ge, Z.-H.; Zhang, B.-P.; Yao, Y.; Wang, H.-C.; Yang, J.; Li, Y.; Gao, C.; Lin, Y.-H. Mechanochemically synthesized sub-5nm sized CuS quantum dots with high visible-light-driven photocatalytic activity. Appl. Surf. Sci. 2016, 384, 272–278. [Google Scholar] [CrossRef]
  47. Ijaz, S.; Ehsan, M.F.; Ashiq, M.N.; He, T. Synthesis of a Bi2S3/CeO2 nanocatalyst and its visible light-driven conversion of CO2 into CH3OH and CH4. Catal. Sci. Technol. 2015, 5, 5208–5215. [Google Scholar] [CrossRef]
  48. Derric, M.; Stulik, D.; Landry, J. Infrared Spectroscopy in Conservation Science; Getty Publications: Los Angeles, CA, USA, 2000. [Google Scholar]
  49. León, A.; Reuquen, P.; Garín, C.; Segura, R.; Vargas, P.; Zapata, P.; Orihuela, A.P. FTIR and Raman Characterization of TiO2 Nanoparticles Coated with Polyethylene Glycol as Carrier for 2-Methoxyestradiol. Appl. Sci. 2017, 7, 49. [Google Scholar] [CrossRef]
  50. Mugundan, S.; Rajamannan, B.; Viruthagiri, G.; Shanmugam, N.; Gobi, R.; Praveen, P. Synthesis and characterization of undoped and cobalt-doped TiO2 nanoparticles via sol–gel technique. Appl. Nanosci. 2015, 5, 449–456. [Google Scholar] [CrossRef] [Green Version]
  51. Deng, M.; Shen, S.; Wang, X.; Zhang, Y.; Xu, H.; Zhang, T.; Wang, Q. Controlled synthesis of AgInS2 nanocrystals and their application in organic–inorganic hybrid photodetectors. CrystEngComm 2013, 15, 6443–6447. [Google Scholar] [CrossRef]
  52. Salavati-Niasari, M.; Ghanbari, D.; Davar, F. Shape selective hydrothermal synthesis of tin sulfide nanoflowers based on nanosheets in the presence of thioglycolic acid. J. Alloys Compd. 2010, 492, 570–575. [Google Scholar] [CrossRef]
  53. Mariappan, R.; Mahalingam, T.; Ponnuswamy, V. Preparation and characterization of electrodeposited SnS thin films. Optik 2011, 122, 2216–2219. [Google Scholar] [CrossRef]
  54. Zhou, T.; Pang, W.K.; Zhang, C.; Yang, J.; Chen, Z.; Liu, H.K.; Guo, Z. Enhanced Sodium-Ion Battery Performance by Structural Phase Transition from Two-Dimensional Hexagonal-SnS2 to Orthorhombic-SnS. ACS Nano 2014, 8, 8323–8333. [Google Scholar] [CrossRef] [PubMed]
  55. Tank, N.S.; Parikh, K.D.; Joshi, M.J. Synthesis and characterization of copper sulphide (CuS) nano particles. AIP Conf. Proc. 2017, 1837, 040018. [Google Scholar]
  56. Riyaz, S.; Parveen, A.; Azam, A. Microstructural and optical properties of CuS nanoparticles prepared by sol–gel route. Perspect. Sci. 2016, 8, 632–635. [Google Scholar] [CrossRef] [Green Version]
  57. Salavati-Niasari, M.; Behfard, Z.; Amiri, O.; Khosravifard, E.; Hosseinpour-Mashkani, S.M. Hydrothermal Synthesis of Bismuth Sulfide (Bi2S3) Nanorods: Bismuth(III) Monosalicylate Precursor in the Presence of Thioglycolic Acid. J. Clust. Sci. 2013, 24, 349–363. [Google Scholar] [CrossRef]
  58. Lee, K.T.; Lin, C.H.; Lu, S.Y. SnO2 quantum dots synthesized with a carrier solvent assisted interfacial reaction for band-structure engineering of TiO2 photocatalysts. J. Phys. Chem. C 2014, 118, 14457–14463. [Google Scholar] [CrossRef]
  59. Lin, Y.-F.; Hsu, Y.-J. Interfacial charge carrier dynamics of type-II semiconductor nanoheterostructures. Appl. Catal. B Environ. 2013, 130, 93–98. [Google Scholar] [CrossRef]
  60. Muñoz-Batista, M.J.; Kubacka, A.; Fernández-García, M. Effect of g-C3N4 loading on TiO2-based photocatalysts: UV and visible degradation of toluene. Catal. Sci. Technol. 2014, 4, 2006–2015. [Google Scholar] [CrossRef]
  61. Young, C.; Lim, T.M.; Chiang, K.; Scott, J.; Amal, R. Photocatalytic oxidation of toluene and trichloroethylene in the gas-phase by metallised (Pt, Ag) titanium dioxide. Appl. Catal. B Environ. 2008, 78, 1–10. [Google Scholar] [CrossRef]
  62. Cao, L.; Gao, Z.; Suib, S.L.; Obee, T.N.; Hay, S.O.; Freihaut, J.D. Photocatalytic Oxidation of Toluene on Nanoscale TiO2 Catalysts: Studies of Deactivation and Regeneration. J. Catal. 2000, 196, 253–261. [Google Scholar] [CrossRef]
  63. Méndez-Román, R.; Cardona-Martínez, N. Relationship between the formation of surface species and catalyst deactivation during the gas-phase photocatalytic oxidation of toluene. Catal. Today 1998, 40, 353–365. [Google Scholar] [CrossRef]
  64. Leung, D.Y.C.; Fu, X.; Wang, C.; Ni, M.; Leung, M.K.H.; Wang, X.; Fu, X. Hydrogen Production over Titania-Based Photocatalysts. ChemSusChem 2010, 3, 681–694. [Google Scholar] [CrossRef] [PubMed]
  65. He, W.; Jia, H.; Yang, D.; Xiao, P.; Fan, X.; Zheng, Z.; Kim, H.-K.; Wamer, W.G.; Yin, J.-J. Composition Directed Generation of Reactive Oxygen Species in Irradiated Mixed Metal Sulfides Correlated with Their Photocatalytic Activities. ACS Appl. Mater. Interfaces 2015, 7, 16440–16449. [Google Scholar] [CrossRef] [PubMed] [Green Version]
  66. Miyauchi, M.; Shiga, Y.; Srinivasan, N.; Atarashi, D.; Sakai, E. Ubiquitous quantum dot-sensitized nanoporous film for hydrogen production under visible-light irradiation. Mater. Chem. Phys. 2015, 160, 383–388. [Google Scholar] [CrossRef] [Green Version]
  67. Wang, X.; Li, L.; Fu, Z.; Cui, F. Carbon quantum dots decorated CuS nanocomposite for effective degradation of methylene blue and antibacterial performance. J. Mol. Liq. 2018, 268, 578–586. [Google Scholar] [CrossRef]
  68. Bajorowicz, B.; Kowalska, E.; Nadolna, J.; Wei, Z.; Endo, M.; Ohtani, B.; Zaleska-Medynska, A. Preparation of CdS and Bi2S3 quantum dots co-decorated perovskite-type KNbO3 ternary heterostructure with improved visible light photocatalytic activity and stability for phenol degradation. Dalton Trans. 2018, 47, 15232–15245. [Google Scholar] [CrossRef]
  69. Ruan, C.; Zhang, Y.; Lu, M.; Ji, C.; Sun, C.; Chen, X.; Chen, H.; Colvin, V.L.; Yu, W.W. White Light-Emitting Diodes Based on AgInS₂/ZnS Quantum Dots with Improved Bandwidth in Visible Light Communication. Nanomaterials 2016, 6, 13. [Google Scholar] [CrossRef] [Green Version]
  70. Malankowska, A.; Kobylański, M.P.; Mikolajczyk, A.; Cavdar, O.; Nowaczyk, G.; Jarek, M.; Lisowski, W.; Michalska, M.; Kowalska, E.; Ohtani, B.; et al. TiO2 and NaTaO3 Decorated by Trimetallic Au/Pd/Pt Core–Shell Nanoparticles as Efficient Photocatalysts: Experimental and Computational Studies. ACS Sustain. Chem. Eng. 2018, 6, 16665–16682. [Google Scholar] [CrossRef]
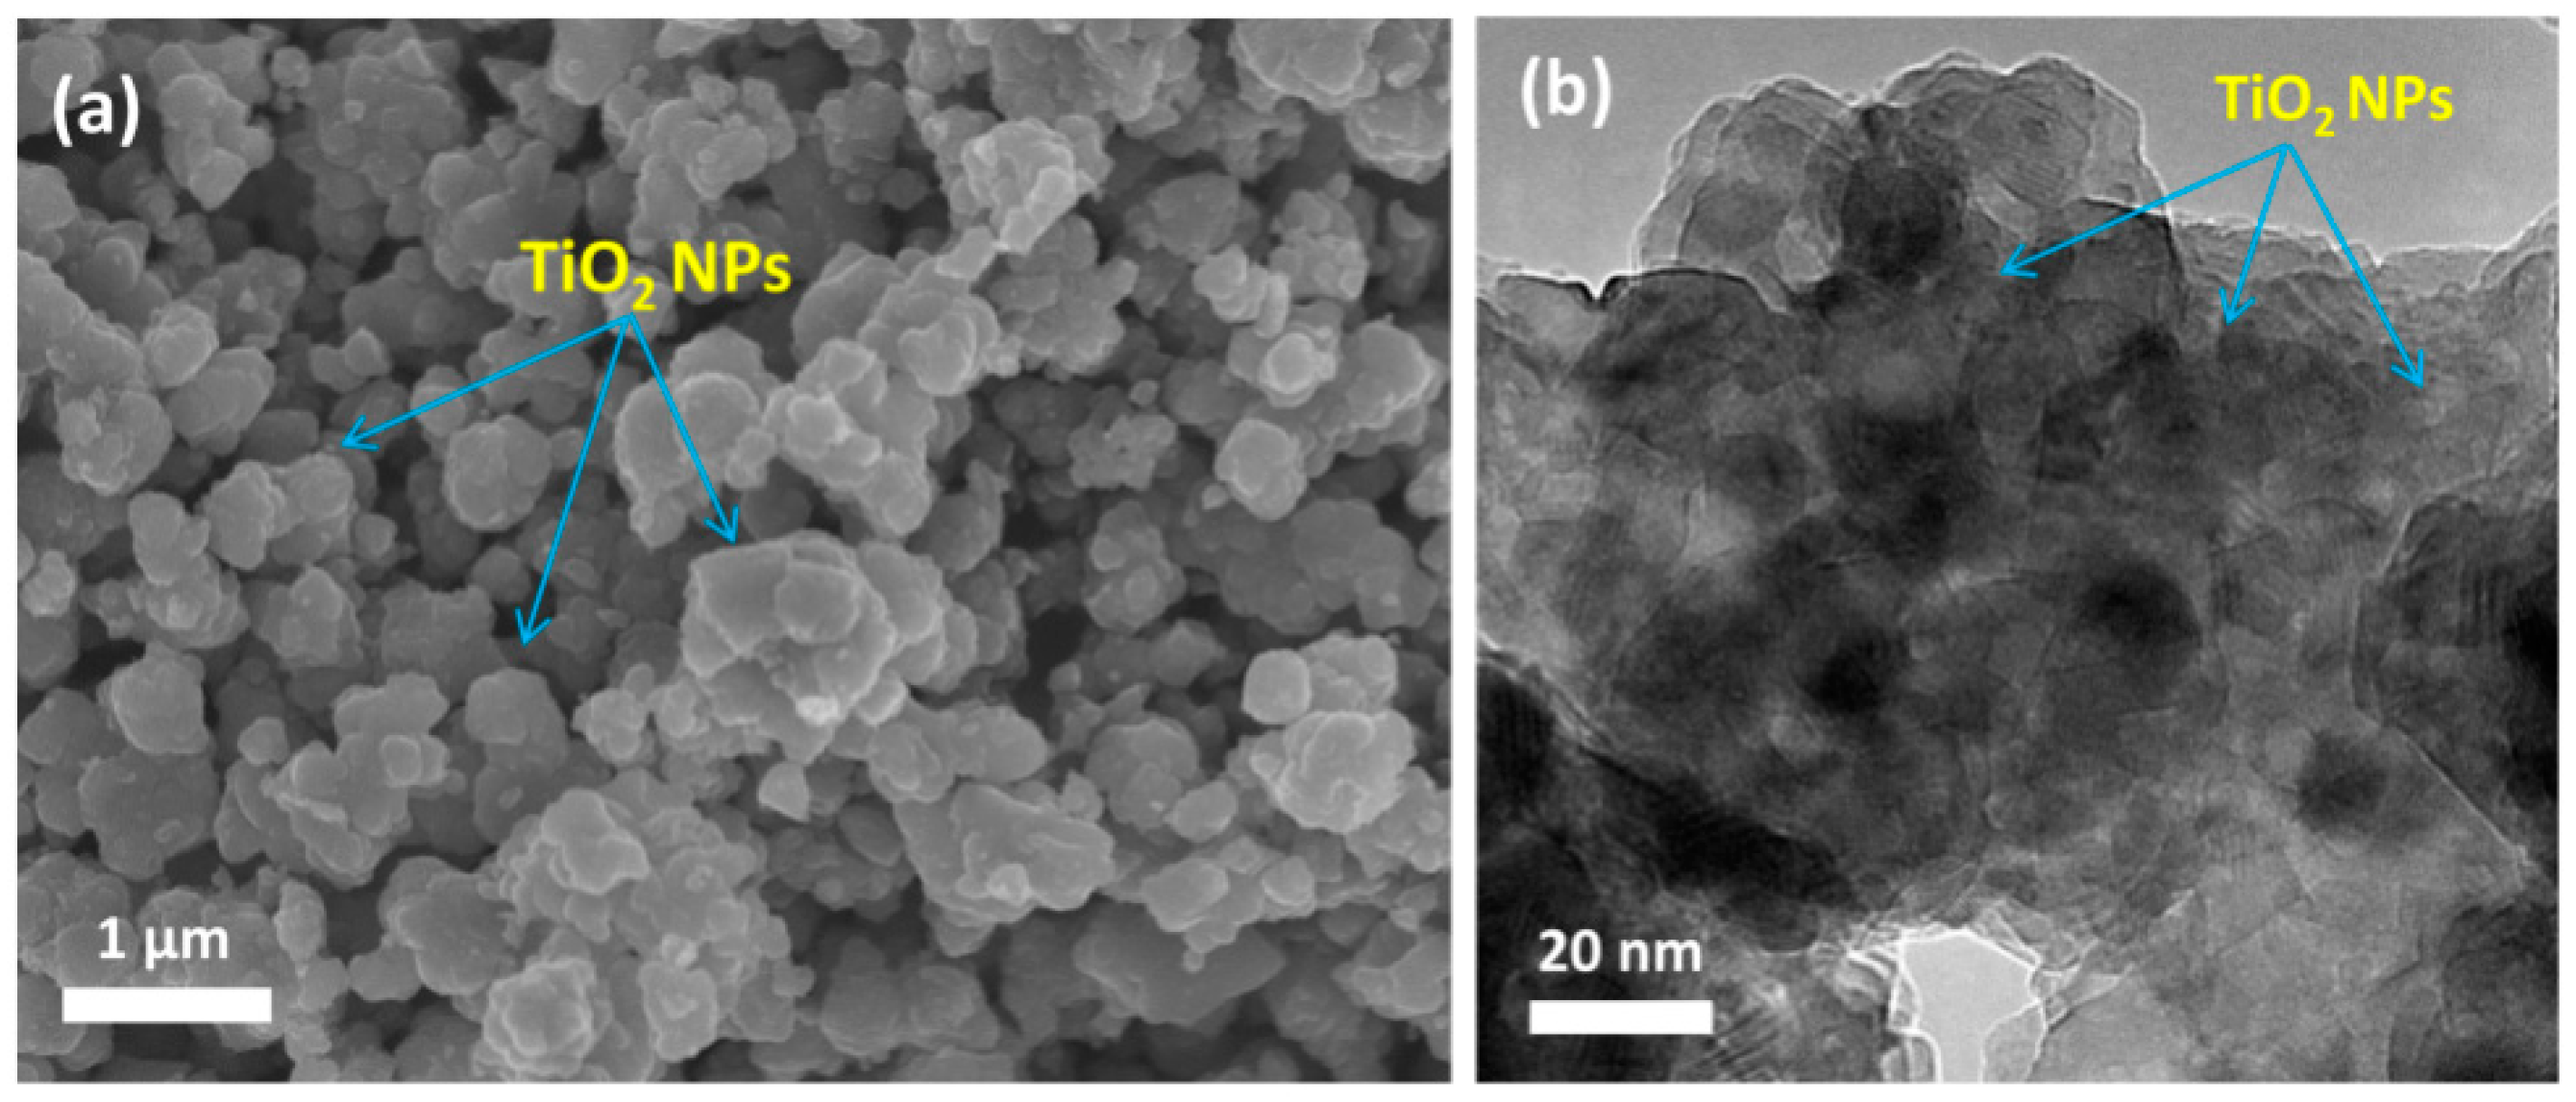
Figure 1. (a) SEM and (b) HR-TEM images for TiO2 NPs.
Catalysts 10 00403 g001
Figure 2. HR-TEM images for (a,b) AgInS2 QDs, (c,d) SnS QDs, (e,f) TiO2/CuS_15 QDs, and (g,h) TiO2/Bi2S3_15 QDs.
Catalysts 10 00403 g002
Figure 3. UV-Vis spectra for (a) TiO2, AgInS2 and TiO2 modified with AgInS2 (5, 10, 15 wt%), (b) TiO2, SnS and TiO2 modified with SnS (5, 10, 15 wt%), (c) TiO2, CuS2 and TiO2 modified with CuS (5, 10, 15 wt%), (d) TiO2, Bi2S3 and TiO2 modified with Bi2S3 (5, 10, 15 wt%).
Catalysts 10 00403 g003
Figure 4. PL spectra of (a) TiO2, AgInS2 and TiO2 modified with AgInS2 (5, 10, 15 wt%), (b) TiO2, SnS and TiO2 modified with SnS (5, 10, 15 wt%), (c) TiO2, CuS2 and TiO2 modified with CuS (5, 10, 15 wt%), (d) TiO2, Bi2S3 and TiO2 modified with Bi2S3 (5, 10, 15 wt%).
Catalysts 10 00403 g004
Figure 5. XRD analysis for (a) TiO2, AgInS2 and TiO2/AgInS2_15, (b) TiO2, SnS and TiO2/SnS_15, (c) TiO2, CuS2 and TiO2/CuS_15, (d) TiO2, Bi2S3 and TiO2/Bi2S3_15.
Catalysts 10 00403 g005
Figure 6. FT-IR spectra for QDs and TiO2 modified by (a) TiO2, AgInS2 and TiO2/AgInS2_15, (b) TiO2, SnS and TiO2/SnS_15, (c) TiO2, CuS2 and TiO2/CuS_15, (d) TiO2, Bi2S3 and TiO2/Bi2S3_15.
Catalysts 10 00403 g006
Figure 7. Photocatalytic activities of obtained photocatalysts for toluene photodegradation after 1 h irradiation of LEDs λmax = 375 nm and λmax = 415 nm.
Catalysts 10 00403 g007
Figure 8. Photostability of TiO2/SnS_15% measured in the fourth subsequent cycles in the toluene degradation reaction in the presence of LED λmax = 375 nm.
Catalysts 10 00403 g008
Figure 9. Proposed mechanism of photocatalytic reactions in the presence of QDs-sensitized TiO2 composite under (a) visible, and (b) UV irradiation.
Catalysts 10 00403 g009
Figure 10. Schematic diagram for the formation of TiO2, QDs (AgInS2, SnS, CuS, Bi2S3) and TiO2/QDs composite.
Catalysts 10 00403 g010
Table 1. Sample label, preparation method and photocatalytic activity of prepared photocatalysts.
Sample LabelLoading of QDs (wt%)Preparation MethodToluene Degradation after 1 h Irradiation (%)
λmax = 415 nmλmax = 375 nm
TiO2 NPs0hydrothermal45.179.1
AgInS2 0hot-injection56.259.3
TiO2/AgInS2_55adsorption/calcination71.178.6
TiO2/AgInS2_1010adsorption/calcination70.786.3
TiO2/AgInS2_1515adsorption/calcination56.189.2
SnS 0sonochemical14.86.50
TiO2/SnS_55adsorption/calcination13.787.9
TiO2/SnS_1010adsorption/calcination34.679.9
TiO2/SnS_1515adsorption/calcination36.691.1
CuS 0microwave25.928.1
TiO2/CuS_55adsorption/calcination24.737.3
TiO2/CuS_1010adsorption/calcination36.546.3
TiO2/CuS_1515adsorption/calcination40.245.6
Bi2S30hot-injection21.835.2
TiO2/Bi2S3_55adsorption/calcination29.856.3
TiO2/Bi2S3_1010adsorption/calcination29.752.5
TiO2/Bi2S3_1515adsorption/calcination34.749.4
Table 2. Band gap values and positions of the VB and CB for tested samples.
Type of SampleBand Gap Eg (eV)Position of VB (V)Position of CB (V)Ref.
TiO2 NPs3.2+2.9−0.29[64]
AgInS2 QDs1.5+0.81−0.69[65]
SnS QDs1.35+0.1−1.25[66]
CuS QDs2.25+1.9−0.34[67]
Bi2S3 QDs1.4+0.64−0.76[31]