Article

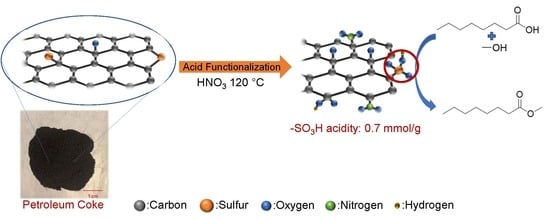
Nitric Acid Functionalization of Petroleum Coke to Access Inherent Sulfur

Department of Chemical and Petroleum Engineering, University of Calgary, Calgary, AB T2N 1N4, Canada
*
Author to whom correspondence should be addressed.
Catalysts 2020, 10(2), 259; https://doi.org/10.3390/catal10020259
Submission received: 26 December 2019 / Revised: 17 February 2020 / Accepted: 18 February 2020 / Published: 20 February 2020
(This article belongs to the Special Issue Commemorative Issue in Honor of Professor Hugo de Lasa)

Abstract

:
Sulfonated carbon-based catalysts have been identified as promising solid acid catalysts, and petroleum coke (petcoke), a byproduct of the oil industry, is a potential feedstock for these catalysts. In this study, sulfur-containing (6.5 wt%) petcoke was used as a precursor for these catalysts through direct functionalization (i.e., without an activation step) with nitric acid to access the inherent sulfur. Catalysts were also prepared using sulfuric acid and a mixture of nitric and sulfuric acid (1:3 vol ratio). Fourier transform infrared spectroscopy, X-ray photoelectron spectroscopy, and titration were used to identify and quantify the acid sites. The activities of the prepared catalysts were determined for the esterification of octanoic acid with methanol. Petcoke had few −SO3H groups, and correspondingly no catalytic activity for the reaction. All acid treatments increased the number of −SO3H groups and promoted esterification. Treatment with nitric acid alone resulted in the oxidation of the inherent sulfur in petcoke to produce ~0.7 mmol/g of strong acid sites and a total acidity of 5.3 mmol/g. The acidity (strong acid and total) was lower with sulfuric acid treatment but this sample was more active for the esterification reaction (TOF of 31 h−1 compared to 7 h−1 with nitric acid treatment).

Graphical Abstract

1. Introduction

Petroleum coke (petcoke) is a by-product from the oil industry and is a solid product mainly composed of carbon (>80 wt%) [1]. Depending on its source, petcoke may contain various impurities that limit its use as a fuel or a feedstock for the production of anodes in industrial manufacturing processes [2]. Sulfur, in particular, is a problematic contaminant, can be present in amounts of ~7 wt%, and exists as both inorganic (e.g., sulfur salts) and organic forms (e.g., thiophene) [3]. Many studies have focused on the removal of sulfur from petcoke [4,5,6,7], but the organic sulfur species are integrated with the petcoke aliphatic or aromatic structure and are difficult to remove [3]. Instead of removing the sulfur, there is potential to use petcoke as a precursor for preparing carbon-based catalysts such as solid acid catalysts that have sulfur-containing surface functional groups as active sites.
Solid acid catalysts are widely used in the petrochemical industry in esterification, etherification, hydration, dehydration, alkylation of aromatics and amines, and hydrocarbon cracking reactions [8]. Among various solid acid catalysts, carbon-based materials containing sulfonic acid (−SO3H) groups have attracted particular attention due to their high stability and strong acidity. For example, Zeng et al. compared the stability and activity of a carbon-based catalyst derived from rice husk with that of a typical SO42−/ZrO2 catalyst for esterification. After 10 cycles, the yield of ester decreased from 91% to ~75% with the carbon-based catalyst, and from 65% to ~30% with the zirconia-based catalyst [9].
Two routes have mainly been used to add sulfonic acid groups to carbon surfaces: One route involves the use of concentrated sulfuric acid, fuming sulfuric acid or gaseous SO3 for the sulfonation of solid carbon materials, whereas the other route involves the carbonization of sulfur-containing organic matter. For example, Ngaosuwan et al. sulfonated activated carbon derived from coffee residue with concentrated sulfuric acid and obtained a maximum −SO3H acidity of 0.72 mmol/g [10]. Increasing the sulfonation temperature from 140 °C to 200 °C resulted in a decrease in the number of −SO3H groups; in addition, the number of acid sites was not directly correlated with the surface area [10]. Similarly, Kastner et al. compared the sulfonation of different types of biochar and activated carbon derived from wood and obtained 2–3 times higher −SO3H acidity on biochar, even though biochar had significantly lower surface areas than activated carbon [11]. Using the second route, Yang et al. produced solid acid catalysts (0.53 mmol/g −SO3H acidity) by hydrothermal carbonization of glucose with p-toluenesulfonic acid and acrylic acid at 180 °C [12]. Solid acid catalysts have less –SO3H acidity than homogeneous acid catalysts like sulfuric acid, but avoid the issues of corrosion and product separation [13,14].
In previous studies, petcoke was chemically activated before being converted to solid acid catalysts by sulfonation with concentrated sulfuric acid [15,16]. The total acidities were 1.21 mmol/g [15] and 5.25 mmol/g [16], with the higher number of sulfonic groups resulting in higher activity for esterification [17]. During activation, the carbon-sulfur bonds break first, and then the sulfur is removed either as a gas phase species or during the washing step that is done to make the pores accessible [18]. Thus, the activation step removes sulfur and decreases the yield. Recently, our group has demonstrated that petcoke can be directly functionalized without activation. Treatment with concentrated sulfuric acid at 80 °C for 3 h increased the sulfonic group acidity from essentially none on petcoke to 1.2 mmol/g [19]. Increasing the number of aromatic hydrogen groups exposed on the petcoke surface by ball milling further increased the sulfonic groups to 3.7 mmol/g.
In the study herein, we have treated petcoke with nitric acid to access the inherent sulfur. This sulfur exists mainly as organic sulfur species, including thiophene, benzothiophene, and dibenzothiophene [5], which can be converted through an oxidation process. The oxidants ammonium persulfate, hydrogen peroxide, nitric acid, and sulfuric acid have generated oxygen-containing groups on carbon materials, with nitric acid showing the highest oxidative strength [20,21,22]. In most studies with carbon materials, a higher acidity was obtained from treatment with a mixture of nitric acid and sulfuric acid, especially at the ratio of 1:3 by volume, rather than treatment with only nitric acid [23,24,25]. Sulfuric acid promotes the formation of nitronium ions (NO2+), which are intermediates that attack aromatic compounds and promote oxidation [25]. Thus, in this study, petcoke was functionalized with nitric acid, sulfuric acid, and a mixture of the two acids (1:3 vol ratio), and the materials were characterized and tested for the esterification of octanoic acid with methanol.

2. Results and Discussion

2.1. Chemical Properties of Petcoke Treated with Various Acids

The FTIR spectra of petcoke before and after treatment with reverse osmosis (RO) water, H2SO4, HNO3, and a mixture of HNO3/H2SO4 are shown in Figure 1. The spectra of Petcoke and P-RO-24 are similar, which indicates that just heating petcoke in water did not create surface functional groups. The spectra of all samples have a peak at 1030 cm−1, which corresponds to ν(S=O) [26,27]. Compared to the spectrum of the petcoke, the spectra of the acid-treated samples have increased peak intensities at 1160 cm−1, which may be attributed to the sulfonic structure [10]. The spectra of the P-N-24 and P-N/S-24 samples have new peaks at 1337 and 1530 cm−1 and increased intensities at 1715 cm−1. The peaks at 1530 and 1337 cm−1 are generally assigned to νas(NO2) and νs(NO2), respectively, and indicate the presence of nitro groups [28,29]. The peak at 1337 cm−1 could also be related to νas(O=S=O) of sulfonic acid in the 1355-1340 cm−1 region [26], or be related to lactonic groups [30]. The peak at 1715 cm−1 is attributed to ν(C=O) and ν(COOH) [31]. These acidic oxygen-containing groups contribute to the sample acidity. Moreover, a peak at 1580 cm−1 in the spectra of the petcoke, P-RO-24, and P-S-24 samples, and 1600 cm−1 in the spectra of the P-N-24 and P-N/S-24 samples, corresponds to the conjugated aromatic groups [32]. The shift in this peak is similar to that seen after nitric acid treatment of activated carbon and has been explained by inductive effects from the carboxylic groups [32].
The surface elemental components were detected by X-ray photoelectron spectroscopy (XPS) and are summarized in Table 1. The main elements found on the petcoke surface were carbon, oxygen, and sulfur, with a small amount of silicon (2.5 wt%) and aluminium (1.3 wt%). These minerals were removed during functionalization of the petcoke as silicon and aluminium were not detected on the acid-treated samples. The oxygen and nitrogen contents significantly increased after treatment with HNO3 and HNO3/H2SO4, whereas the oxygen content decreased with H2SO4 treatment. The presence of nitrogen on samples P-N-24 and P-N/S-24 is in agreement with the nitro groups seen in the FTIR spectra (Figure 1). Nitric acid has been used for petcoke desulfurization [33], but more than 60% of the inherent sulfur remained on P-N-24. Narrow scans were performed on the S2p and C1s XPS peaks as shown in Figure 2. The S2p spectra (Figure 2a–d) contained three main types of bonds on all samples. The peaks at ~163.8 eV and 165 eV are attributed to C–S–C and C=S [34], respectively, which is consistent with the reported inherent sulfur in petcoke [3]. The peaks within 167–169 eV are associated with oxidized S (C–SOx, x = 2, 3, 4, and -SO3H) [35]. This area was deconvoluted into 2–3 peaks. The peak centered at 168.7 eV was assigned to −SO3H with areas corresponding to 3.6 at% of the sulfur in petcoke, increasing to 9.2 at%, 7.0 at%, and 7.3 at% for P-S-24, P-N-24, and P-N/S-24, respectively. The generation of sulfonic groups by treatment with only nitric acid confirms that the acid reacts with sulfur inherent in the petcoke. Even though the sulfur contents (see S/C values in Table 1) did not significantly change after acid treatment, the distributions of sulfur species did change. The XPS C1s spectra (Figure 2A–D) includes a peak at ~284.8 eV corresponding to C–C or C=C bonds, as well as a peak at 286.5 eV corresponding to C–O bonds. The latter peak area changed from 4.0 at% on petcoke to 14.2 at% on P-N-24 and 12.1 at% on P-N/S-24. The spectra of these samples also had peaks at 287.5 eV corresponding to C=O bonds and at 288.7–289.6 eV corresponding to O–C=O bonds indicating the formation of oxygen-containing groups [31]. These results are consistent with the CO and CO2 TPD profiles (Figure S1), in which the samples treated with HNO3 and HNO3/H2SO4 showed higher gas evolution than the sample treated with H2SO4.
The untreated petcoke had a total acidity of 0.34 mmol/g, and both the total acidity and the H+ exchange capacity (i.e., strong acid acidity) increased with all acid treatments. Specifically, the strong acid contents were 0.25 mmol/g, 0.70 mmol/g, and 0.73 mmol/g for samples P-S-24, P-N-24, and P-N/S-24, respectively. In addition to −SO3H groups, FTIR analysis, XPS, and CO and CO2 TPD profiles (Figure S1) demonstrated the presence of acidic oxygen groups, such as carboxylic, lactonic and hydroxyl groups, which contributed to the total acidity and were more abundant in samples P-N-24 and P-N/S-24 than sample P-S-24. Although the highest acidity in the current study was observed on sample P-N/S-24, the acidity of P-N-24 was similar to that of P-N/S-24, which could be attributed to the high sulfur content in the petcoke. The aromatic nitro structures also generated by treatment with nitric acid may enhance the dissociation of the formed carboxylic groups and could increase the ion exchange during the titration of strong acid groups. For example, the pKa value of dinitrobenzoic acid is in the range of 1.14 to 2.85 and that of trinitrobenzoic acid is 0.654 [36].

2.2. Physical Properties of Petcoke Treated with Various Acids

The physical properties of the samples are given in Table 2. Petcoke contains primarily ultra-micropores (<0.7 nm) accessible by CO2 at 0 °C. After treatment with acid, this microporosity increased, consistent with the results reported for other carbon materials after similar acid treatments [37]. The pore size distributions (Figure 3) indicate that the pores of all samples before and after acid treatments were within the range of 0.4 to 0.8 nm. Compared to petcoke, however, the pore widths in samples P-N-24 and P-N/S-24 decreased, and those in sample P-S-24 increased. As shown in Table 2, the ash contents decreased after acid treatments, and, thus, the removal of some of the inorganic material in petcoke likely contributed to the increased microporosity [38]. Although the added surface groups may enhance the interaction with CO2 [37,39], these groups may also block some pores [40,41,42]. As the total acidity increased (Table 1), the porosity decreased for the acid-treated samples (Table 2) suggesting that more pores were blocked than adsorption enhanced with the addition of functional groups.
The SEM images (Figure S2) do not show significant differences in morphology before and after acid treatments. Structure changes, however, were evident in the XRD patterns (Figure 4). The weak and broad peak at 20–30° 2θ indicates that petcoke contains a combination of amorphous and graphitic (002) structures. The disappearance of some minor peaks on petcoke after acid treatment demonstrates the removal of the mineral impurities, whereas the broadening of the peak associated with graphite (002) suggests destruction of the structure through oxidation by the acids and increased disorder of the stacking of graphene [43,44]. The shift in the graphite peak (002) in the patterns of samples P-N-24 and P-N/S-24 to lower 2θ values is consistent with increased distance between the layers as a result of the formation of oxygen-containing groups [44,45]. Similarly, a peak at ~10° 2θ on P-N-24 is assigned to the graphene oxide structure (001) [43,45], which infers a larger interlayer spacing and greater oxidation consistent with this sample having the highest oxygen content (Table 1).

2.3. Mechanisms of Surface Group Formation

Based on the characterization of acid-treated samples, three types of reactions—oxidation, sulfonation, and nitration—have been proposed to explain the formation of surface groups. The oxygen content increased with all acid treatments (Table 1), but significantly more in the presence of nitric acid. Figure 5 illustrates possible reactions between nitric acid and two aromatic structures. These structures were chosen based on previous studies on the functionalization of activated carbon [40,46,47]. Specifically, the aliphatic chains between the aromatic structures are oxidized to generate carboxylic groups as the main product. Other oxygen groups, such as carbonyl and lactonic groups, may form as well depending on the initial structure. In addition to the oxidation of carbon, the inherent sulfur in petcoke can be oxidized. For example, sulfur in the thiophene groups can be oxidized to sulfone that can be further oxidized to sulfonic and hydroxyl groups in the presence of water (Figure 6) [48]. Sulfonic groups were evident in the XPS spectra for P-N-24 (Figure 2c) and, compared to petcoke, the C–S–C content of P-N-24 decreased (from 55.0 to ~44.3 at%), whereas the C–SOX content increased (from 7.7 to ~17.3 at%).
The nitro and sulfonic groups on the acid-treated petcoke (Figure 1) were likely formed by nitration and sulfonation reactions (Figures S3 and S4), which are electrophilic substitution reactions [49]. The quantity of aromatic hydrogen groups (substitution site) in the samples was estimated by measuring the peak areas in the range of 950 to 700 cm−1 in the FTIR spectra (Figure 1) and the results are listed in Table 1. All acid-treated petcoke samples have lower aromatic hydrogen contents than petcoke, consistent with these groups being consumed in electrophilic substitution reactions. The total acidities were similar on samples P-N-24 and P-N/S-24, and it is possible that the inherent sulfur in the petcoke promoted the nitration reaction—in particular the formation of nitronium ions.

2.4. Esterification Reactions

Esterification of octanoic acid (OA) with methanol was used to test the catalytic activities of the acid-functionalized petcoke samples and the resulting yields of the caprylic acid methyl ester product are shown in Figure 7. The selectivity to caprylic acid methyl ester was 100%, although the carbon balance was not 100% indicating that some species may have remained on the surface of the samples. Petcoke was inactive for the reaction, whereas the acid-functionalized samples did have catalytic activity. Although P-S-24 has the lowest strong acid density of the functionalized samples, the yields obtained with P-S-24 were similar to that with P-N/S-24. The turnover frequencies (TOF) were 31 h−1, 7 h−1, and 11 h−1 on P-S-24, P-N-24, and P-N/S-24, respectively. These TOF are comparable to those determined with other solid acid catalysts (Table 3) [10,17,50,51,52,53]. P-S-24 had the fewest strong acid groups but the highest TOF, whereas P-N-24 had much more strong acid groups but the lowest TOF. Ngaosuwan et al. reported similar results; specifically, a sulfonated activated carbon derived from coffee residue with the highest titrated −SO3H acidity (0.72 mmol/g) had a lower catalytic activity for esterification than other samples with lower -SO3H acidity (0.45–0.66 mmol/g) [10]. This result may be related to the overestimation of −SO3H acidity. That is, the exchanged H+ was not only from −SO3H groups, which are the active sites for catalytic esterification, but also can be from other strong acid groups. H2SO4 creates strong acid sites mainly through sulfonation reactions (Figure S3) and the −SO3H groups primarily contributed to the strong acid titration. When petcoke was treated with only HNO3, however, −SO3H groups came from the oxidation of inherent sulfur and these groups were only a small fraction of the titrated acidity.

3. Materials and Methods

3.1. Materials and Chemicals

Delayed petcoke from oil sands upgrading (Suncor Energy, Inc., Calgary, AB, Canada) was used as the precursor. The petcoke was ground and sieved to particle sizes <150 μm. Nitric acid (HNO3, 68–70%) was purchased from VWR International. A diluted sulfuric acid solution (70%) was prepared from concentrated sulfuric acid (H2SO4, 95–98%) purchased from Millipore Sigma(Burlington, MA, USA). Hydrochloric acid (HCl, 37 %) and sodium hydroxide (NaOH, 0.1 M solution in water) were purchased from Sigma-Aldrich (Markham, ON, Canada) and used for titration. Octanoic acid (C8H16O2, 98+%) was purchased from Alfa Aesar® (Haverhill, MA, USA), and methanol (CH4O, ≥99.8%) and toluene (C7H8, ≥99.9%) were purchased from Sigma-Aldrich and used for the esterification experiments.

3.2. Sample Preparation

To functionalize the petcoke, 50 mL of an acid—HNO3, H2SO4, or the HNO3/H2SO4 mixture (1:3, v/v)—was mixed with 5 g petcoke and stirred (280 rpm) during refluxing at 120 °C for 24 h. This temperature was selected based on the oxidation of carbon nanotubes with HNO3 [23], and the sulfonation of carbon [54,55,56]. After refluxing, the samples were washed with reverse osmosis (RO) water until neutral pH was achieved, and then dried at 120 °C overnight. The samples are named with P (for petcoke) followed by the acid used (N for HNO3, S for H2SO4, and N/S for the mixture) and the time of treatment (in hours). For example, sample P-N-24 refers to petcoke treated with HNO3 for 24 h. A “blank” sample was prepared with the same procedure as above but using RO water with no acid. This sample is labeled as P-RO-24.

3.3. Characterization of Material

Surface areas were measured by N2 adsorption at −196 °C and CO2 adsorption at 0 °C using a Tristar 3000 instrument (Micromeritics Instrument Corporation, Norcross, GA, USA). The Solution of the Adsorption Integral Equation Using Splines (SAIEUS, Version 2.02, Micromeritics Instrument Corporation, Norcross, GA, USA) software was used to calculate the surface area and pore volume. The 2D Non-Local Density Functional Theory with heterogeneous surfaces model (2D-NLDFT-HS, Micromeritics Instrument Corporation, Norcross, GA, USA) provided the best fit for the adsorption data. All samples were degassed under vacuum at 150 °C prior to adsorption analysis. The surface morphology was observed by scanning electron microscopy (SEM, Zeiss Sigma VP, Carl Zeiss, Oberkochen, Germany). X-ray diffraction (XRD, Rigaku Miniflex II bench top PXRD, Rigaku Corporation, Tokyo, Japan) patterns were collected by using a CuKα x-ray source. The sample powder was dispersed with isopropanol and dropped on the sample holder. The recorded angles were between 5 and 70 ° 2θ.
To identify surface functional groups on the samples, a Fourier Transform Infrared (FTIR, Nicolet iS50, Thermo Fisher Scientific, Waltham, MA, USA) spectrometer with an attenuated transmission reflectance (ATR) was used. The ATR spectra were collected in the 4000 to 400 cm−1 wavenumber range, accumulating 64 scans at 4 cm−1 resolution. The number of surface acidic groups on the samples was determined by titration. For determination of total acidity, 0.1 g of sample was added to 5 mL of 0.1 M NaOH solution. The mixture was then oscillated in a shaker (VWR Symphony 5000I Shaker, Henry Troemner LLC, Thorofare, NJ, USA) at 25 °C and 250 rpm for 24 h. This solution was titrated with 0.01 M HCl solution using phenolphthalein and methyl orange as indicators. The H+ exchange capacity is used to determine the strong acid groups. Sample (0.1 g) was added to 5 mL of 0.1 M NaCl solution, stirred, and titrated with 0.01 M NaOH solution. Thermogravimetric analysis (TGA, SDT Q600, TA Instruments, New Castle, DE, USA) was used to be determine ash content. Approximately 0.015 g of dried sample was heated from ambient temperature up to 750 °C at a constant rate of 20 °C/min in a 50 mL/min flow of air. Samples were held at 750 °C for an additional 0.5 h. Temperature-programmed decomposition (TPD) was used to quantify the CO and CO2 released from the samples. For the experiments, 0.1 g of sample was put in a quartz U-tube, placed in a furnace, heated to 110 °C at a rate of 15 °C/min under argon flow (100 mL/min), and held at 110 °C for 1 h. After that, the sample was continuously heated to 950 °C. The effluent CO and CO2 concentrations were monitored by an ABB 2020 gas analyzer (ABB Group, Zürich, Switzerland), which was calibrated using calcium oxalate (CaC2O4·H2O). X-ray photoelectron spectroscopy (XPS) was recorded on Kratos Axis spectrometer (Kratos Analytical Limited, Manchester, UK) with monochromatized Al Kα (hυ = 1486.71 eV). Compositions were calculated from the survey spectra using the major elemental peaks. CasaXPS (Version 2.3.22PR1.0, Casa Software Ltd, Teignmouth, UK) was used for component analysis to fit the spectra of C1s and S2p with peaks related to different chemical bonds.

3.4. Esterification Experiment

The esterification reaction of octanoic acid and methanol, see Equation (1), was used to test the catalyst activity. The reaction was carried out in an Erlenmeyer flask (125 mL) housed in a water bath, stirred magnetically, and jacketed by a Graham condenser. First, 5 mL of octanoic acid, 25 mL of methanol, and 5 mL of toluene (internal standard) were added into the reaction flask and heated to 60° C with stirring at 500 rpm for 4 h. The amount of catalyst used was 10 wt% of the system (i.e., ~0.45 g catalyst and 4.5 g octanoic acid). At time zero, the catalyst was added to the reaction mixture. Periodically ~1 mL samples of the suspension were withdrawn by a syringe through a sampling port (the total sampling decreased the initial reaction volume by less than 15% and the initial catalyst amount by 10%). The catalyst was separated by passing the suspension through a membrane filter (0.45 µm, Supor® Pall, Sigma Canada) to prevent further reaction. The solution was then analyzed by gas chromatography (GC) with a flame ionization detector: 0.1 µL of solution was injected into the GC (6890N, Agilent Technologies, Santa Clara, CA, USA) equipped with a HP-5 capillary column (5% phenyl methyl siloxane, 30 m × 320 µm × 0.25 µm). The temperature program for the GC consisted of 2 min at 50 °C and then a ramp of 30 °C/min to 220 °C. Nitrogen was used as the carrier gas (injection using split mode). The temperatures of the injector and detector were set at 260 and 270 °C, respectively. The detector mode used was constant makeup flow.
C 7 H 15 C O O H +   C H 3 O H C 7 H 15 C O O C H 3 + H 2 O
The ester yield was calculated based on the following equation,
% y i e l d = m a c t u a l m t h e o r e t i c a l ×   100 %
where m a c t u a l is the mass of caprylic acid methyl ester formed and m t h e o r e t i c a l is the theoretical maximum mass of ester that could be formed if all octanoic acid converts to caprylic acid methyl ester. Turnover frequencies (TOF) were calculated as follows [57],
T O F = M e s t e r m c a t a l y s t × [ H + ] × t
where M e s t e r is the moles of caprylic acid methyl ester formed, m c a t a l y s t is the mass of catalyst added into the reactor, [ H + ] is the concentration of strong acid groups, and t is the reaction time.

4. Conclusions

Petcoke was functionalized using treatment with H2SO4, HNO3, and H2SO4/HNO3 at 120 °C for 24 h. Surface functional groups, including sulfonic, nitro (only when treated with HNO3), carboxylic, lactonic, and hydroxylic, were generated on the petcoke. Sulfonic groups were generated on the petcoke using only nitric acid, confirming that the inherent sulfur in the petcoke could be converted to surface functional groups. The number of strong acid groups ranged from ~0 on the petcoke to 0.25 mmol/g after treatment with H2SO4, and ~0.7 mmol/g after treatment with either HNO3 or H2SO4/HNO3. The corresponding total acidities were 0.34 mmol/g, 1.5 mmol/g, 5.2 mmol/g, and 5.5 mmol/g, respectively. The measurement of the strong acid groups was likely impacted the present of nitro groups, which enhance the ion exchange. The acid treatments increased the microporosity of the petcoke, partially through the removal of inorganic components. The acid-treated petcoke samples were active for the esterification of octanoic acid with methanol at 60 °C. The sample treated with sulfuric acid was the most active with a TOF of 31 h−1, whereas the samples treated with nitric acid or the mixture of acids had TOF of 7 h−1 and 11 h−1, respectively.

Supplementary Materials

The following are available online at https://www.mdpi.com/2073-4344/10/2/259/s1, Figure S1: CO and CO2 temperature-programmed decomposition profiles of petcoke samples before and after acid treatments. Figure S2: SEM images of (a) raw petcoke, (b) P-S-24, (c) P-N-24, and (d) P-N/S-24. Figure S3: Scheme of aromatic sulfonation with sulfuric acid treatment. Figure S4: Scheme of aromatic nitration with nitric acid treatment.

Author Contributions

Sample preparation and characterization, Q.H. and M.J.H..; esterification reactions, A.S.S.; technical input, M.J.H. and Y.X.; project development and funding acquisition, J.M.H.; manuscript preparation. All authors have read and agreed to the published version of the manuscript.

Funding

This research received no external funding

Acknowledgments

The author Qing Huang would like to thank the University of Calgary for the Eyes High Doctoral Recruitment Scholarship. We thank Vicente Montes for suggesting the esterification reaction.

Conflicts of Interest

The authors declare no conflicts of interest.

References

  1. Manasrah, A.D.; Nassar, N.N.; Ortega, L.C. Conversion of petroleum coke into valuable products using oxy-cracking technique. Fuel 2018, 215, 865–878. [Google Scholar] [CrossRef]
  2. Hill, J.M. Sustainable and/or waste sources for catalysts: Porous carbon development and gasification. Catal. Today 2017, 285, 204–210. [Google Scholar] [CrossRef]
  3. Shan, J.; Huang, J.J.; Li, J.Z.; Li, G.; Zhao, J.T.; Fang, Y.T. Insight into transformation of sulfur species during KOH activation of high sulfur petroleum coke. Fuel 2018, 215, 258–265. [Google Scholar] [CrossRef]
  4. Tripathi, N.; Singh, R.S.; Hills, C.D. Microbial removal of sulphur from petroleum coke (petcoke). Fuel 2019, 235, 1501–1505. [Google Scholar] [CrossRef]
  5. Zhao, P.J.; Ma, C.; Wang, J.T.; Qiao, W.M.; Ling, L.C. Almost total desulfurization of high-sulfur petroleum coke by Na2CO3 -promoted calcination combined with ultrasonic-assisted chemical oxidation. Xinxing Tan Cailiao/New Carbon Mater. 2018, 33, 587–594. [Google Scholar] [CrossRef]
  6. Chen, Z.; Ma, W.; Wei, K.; Wu, J.; Li, S.; Zhang, C.; Yu, Z.; Xie, K.; Yu, J. Detailed vacuum-assisted desulfurization of high-sulfur petroleum coke. Sep. Purif. Technol. 2017, 175, 115–121. [Google Scholar] [CrossRef]
  7. Agarwal, P.; Sharma, D.K. Studies on the desulfurization of petroleum coke by organorefining and other chemical and biochemical techniques under milder ambient pressure conditions. Pet. Sci. Technol. 2011, 29, 1482–1493. [Google Scholar] [CrossRef]
  8. Wright, P.A. Acid Catalysts. In Encyclopedia of Materials: Science and Technology; Elsevier: Amsterdam, The Netherlands, 2001; pp. 1–6. [Google Scholar]
  9. Zeng, D.; Zhang, Q.; Chen, S.; Liu, S.; Wang, G. Synthesis porous carbon-based solid acid from rice husk for esterification of fatty acids. Microporous Mesoporous Mater. 2016, 219, 54–58. [Google Scholar] [CrossRef]
  10. Ngaosuwan, K.; Goodwin, J.G.; Prasertdham, P. A green sulfonated carbon-based catalyst derived from coffee residue for esterification. Renew. Energy 2016, 86, 262–269. [Google Scholar] [CrossRef]
  11. Kastner, J.R.; Miller, J.; Geller, D.P.; Locklin, J.; Keith, L.H.; Johnson, T. Catalytic esterification of fatty acids using solid acid catalysts generated from biochar and activated carbon. Catal. Today 2012, 190, 122–132. [Google Scholar] [CrossRef]
  12. Yang, J.; Zhang, H.; Ao, Z.; Zhang, S. Hydrothermal carbon enriched with sulfonic and carboxyl groups as an efficient solid acid catalyst for butanolysis of furfuryl alcohol. Catal. Commun. 2019, 123, 109–113. [Google Scholar] [CrossRef]
  13. Trejda, M.; Nurwita, A.; Kryszak, D. Synthesis of solid acid catalysts for esterification with the assistance of elevated pressure. Microporous Mesoporous Mater. 2019, 278, 115–120. [Google Scholar] [CrossRef]
  14. Russo, P.A.; Antunes, M.M.; Neves, P.; Wiper, P.V.; Fazio, E.; Neri, F.; Barreca, F.; Mafra, L.; Pillinger, M.; Pinna, N.; et al. Solid acids with SO3H groups and tunable surface properties: Versatile catalysts for biomass conversion. J. Mater. Chem. A 2014, 2, 11813–11824. [Google Scholar] [CrossRef] [Green Version]
  15. Zeng, D.; Liu, S.; Gong, W.; Wang, G.; Qiu, J.; Tian, Y. Acid properties of solid acid from petroleum coke by chemical activation and sulfonation. Communications 2013, 40, 5–8. [Google Scholar] [CrossRef]
  16. Wu, M.; Wang, Y.; Wang, D.; Tan, M.; Li, P.; Wu, W.; Tsubaki, N. SO3H-modified petroleum coke derived porous carbon as an efficient solid acid catalyst for esterification of oleic acid. J. Porous Mater. 2016, 23, 263–271. [Google Scholar] [CrossRef]
  17. Landwehr, J.; Steldinger, H.; Etzold, B.J.M. Introducing sulphur surface groups in microporous carbons: A mechanistic study on carbide derived carbons. Catal. Today 2018, 301, 191–195. [Google Scholar] [CrossRef]
  18. Wu, J.; Montes, V.; Virla, L.D.; Hill, J.M. Impacts of amount of chemical agent and addition of steam for activation of petroleum coke with KOH or NaOH. Fuel Process. Technol. 2018, 181, 53–60. [Google Scholar] [CrossRef]
  19. Xiao, Y.; Hill, J.M. Chemosphere Solid acid catalysts produced by sulfonation of petroleum coke: Dominant role of aromatic hydrogen. Chemosphere 2020, 248, 125981. [Google Scholar] [CrossRef]
  20. Wepasnick, K.A.; Smith, B.A.; Schrote, K.E.; Wilson, H.K.; Diegelmann, S.R.; Fairbrother, D.H. Surface and structural characterization of multi-walled carbon nanotubes following different oxidative treatments. Carbon 2011, 49, 24–36. [Google Scholar] [CrossRef]
  21. Moreno-Castilla, C.; Ferro-García, M.A.; Joly, J.P.; Bautista-Toledo, I.; Carrasco-Marín, F.; Rivera-Utrilla, J. Activated Carbon Surface Modifications by Nitrcc Acid, Hydrogen Peroxide, and Ammonium Peroxydisulfate Treatmenss. Langmuir 1995, 11, 4386–4392. [Google Scholar] [CrossRef]
  22. Moreno-Castilla, C.; Carrasco-Marín, F.; Parejo-Pérez, C.; López Ramón, M.V. Dehydration of methanol to dimethyl ether catalyzed by oxidized activated carbons with varying surface acidic character. Carbon 2001, 39, 869–875. [Google Scholar] [CrossRef]
  23. Saleh, T.A. The influence of treatment temperature on the acidity of MWCNT oxidized by HNO3 or a mixture of HNO3/H2SO4. Appl. Surf. Sci. 2011, 257, 7746–7751. [Google Scholar] [CrossRef]
  24. Chiang, Y.C.; Lin, W.H.; Chang, Y.C. The influence of treatment duration on multi-walled carbon nanotubes functionalized by H2SO4/HNO3 oxidation. Appl. Surf. Sci. 2011, 257, 2401–2410. [Google Scholar] [CrossRef]
  25. Toebes, M.L.; Van Heeswijk, J.M.P.; Bitter, J.H.; Jos van Dillen, A.; De Jong, K.P. The influence of oxidation on the texture and the number of oxygen-containing surface groups of carbon nanofibers. Carbon 2004, 42, 307–315. [Google Scholar] [CrossRef] [Green Version]
  26. Tammer, M.G. Sokrates: Infrared and Raman characteristic group frequencies: Tables and charts. Colloid Polym. Sci. 2004, 283, 235. [Google Scholar] [CrossRef]
  27. Yao, H.; You, Z.; Li, L.; Goh, S.W.; Lee, C.H.; Yap, Y.K.; Shi, X. Rheological properties and chemical analysis of nanoclay and carbon microfiber modified asphalt with Fourier transform infrared spectroscopy. Constr. Build. Mater. 2013, 38, 327–337. [Google Scholar] [CrossRef]
  28. Zawadzki, J. IR spectroscopy investigations of acidic character of carbonaceous films oxidized with HNO3 solution. Carbon 1981, 19, 19–25. [Google Scholar] [CrossRef]
  29. Baltrusaitis, J.; Schuttlefield, J.; Jensen, J.H.; Grassian, V.H. FTIR spectroscopy combined with quantum chemical calculations to investigate adsorbed nitrate on aluminium oxide surfaces in the presence and absence of co-adsorbed water. Phys. Chem. Chem. Phys. 2007, 9, 4970–4980. [Google Scholar] [CrossRef]
  30. Figueiredo, J.; Pereira, M.F.; Freitas, M.M.; Órfão, J.J. Modification of the surface chemistry of activated carbons. Carbon 1999, 37, 1379–1389. [Google Scholar] [CrossRef]
  31. Stein, A.; Wang, Z.; Fierke, M.A. Functionalization of porous carbon materials with designed pore architecture. Adv. Mater. 2009, 21, 265–293. [Google Scholar] [CrossRef]
  32. Collins, J.; Ngo, T.; Qu, D.; Foster, M. Spectroscopic investigations of sequential nitric acid treatments on granulated activated carbon: Effects of surface oxygen groups on π density. Carbon 2013, 57, 174–183. [Google Scholar] [CrossRef]
  33. Phillips, C.R.; Chao, K.S. Desulphurization of Athabasca petroleum coke by (a) chemical oxidation and (b) solvent extraction. Fuel 1977, 56, 70–72. [Google Scholar] [CrossRef]
  34. Sun, D.; Yang, J.; Yan, X. Hierarchically porous and nitrogen, sulfur-codoped graphene-like microspheres as a high capacity anode for lithium ion batteries. Chem. Commun. 2015, 51, 2134–2137. [Google Scholar] [CrossRef] [PubMed]
  35. Thushari, I.; Babel, S. Sustainable utilization of waste palm oil and sulfonated carbon catalyst derived from coconut meal residue for biodiesel production. Bioresour. Technol. 2018, 248, 199–203. [Google Scholar] [CrossRef] [PubMed]
  36. Dean, J.A. University of T. Lange’s Handbook of Chemistry, 15th ed.; Esposito, R., Ed.; McGRAW-HILL, INC: New York, NY, USA, 1999. [Google Scholar]
  37. Yang, J.; Yue, L.; Lin, B.; Wang, L.; Zhao, Y.; Lin, Y.; Chang, K.; DaCosta, H.; Hu, X. CO2 Adsorption of Nitrogen-Doped Carbons Prepared from Nitric Acid Preoxidized Petroleum Coke. Energy Fuels 2017, 31, 11060–11068. [Google Scholar] [CrossRef]
  38. Gęsikiewicz-Puchalska, A.; Zgrzebnicki, M.; Michalkiewicz, B.; Narkiewicz, U.; Morawski, A.W.; Wrobel, R.J. Improvement of CO2 uptake of activated carbons by treatment with mineral acids. Chem. Eng. J. 2017, 309, 159–171. [Google Scholar] [CrossRef]
  39. Thommes, M. Physical adsorption characterization of nanoporous materials. Chemie-Ingenieur-Technik 2010, 82, 1059–1073. [Google Scholar] [CrossRef]
  40. Ternero-Hidalgo, J.J.; Rosas, J.M.; Palomo, J.; Valero-Romero, M.J.; Rodríguez-Mirasol, J.; Cordero, T. Functionalization of activated carbons by HNO3treatment: Influence of phosphorus surface groups. Carbon 2016, 101, 409–419. [Google Scholar] [CrossRef]
  41. Song, X.; Liu, H.; Cheng, L.; Qu, Y. Surface modification of coconut-based activated carbon by liquid-phase oxidation and its effects on lead ion adsorption. Desalination 2010, 255, 78–83. [Google Scholar] [CrossRef]
  42. Moreno-Castilla, C.; Carrasco-Marín, F.; Maldonado-Hódar, F.J.; Rivera-Utrilla, J. Effects of non-oxidant and oxidant acid treatments on the surface properties of an activated carbon with very low ash content. Carbon 1998, 36, 145–151. [Google Scholar] [CrossRef] [Green Version]
  43. Johra, F.T.; Lee, J.W.; Jung, W.G. Facile and safe graphene preparation on solution based platform. J. Ind. Eng. Chem. 2014, 20, 2883–2887. [Google Scholar] [CrossRef]
  44. Paton-Carrero, A.; Valverde, J.L.; Garcia-Alvarez, E.; Lavin-Lopez, M.P.; Romero, A. Influence of the oxidizing agent in the synthesis of graphite oxide. J. Mater. Sci. 2019, 55, 2333–2342. [Google Scholar] [CrossRef]
  45. Cao, J.; He, P.; Mohammed, M.A.; Zhao, X.; Young, R.J.; Derby, B.; Kinloch, I.A.; Dryfe, R.A.W. Two-Step Electrochemical Intercalation and Oxidation of Graphite for the Mass Production of Graphene Oxide. J. Am. Chem. Soc. 2017, 139, 17446–17456. [Google Scholar] [CrossRef]
  46. Chingombe, P.; Saha, B.; Wakeman, R.J. Surface modification and characterisation of a coal-based activated carbon. Carbon 2005, 43, 3132–3143. [Google Scholar] [CrossRef]
  47. Vinke, P.; van der Eijk, M.; Verbree, M.; Voskamp, A.F.; van Bekkum, H. Modification of the surfaces of a gas-activated cabron and a chemically activated carbon with nitric acid. Carbon 1994, 32, 675–686. [Google Scholar] [CrossRef]
  48. D’Alessandro, N.; Tonucci, L.; Bonetti, M.; Di Deo, M.; Bressan, M.; Morvillo, A. Oxidation of dibenzothiophene by hydrogen peroxide or monopersulfate and metal-sulfophthalocyanine catalysts: An easy access to biphenylsultone or 2-(2′-hydroxybiphenyl)sulfonate under mild conditions. New J. Chem. 2003, 27, 989–993. [Google Scholar] [CrossRef]
  49. Ouellette, R.J.; Rawn, J.D.; Towson, U. Organic Chemistry: Structure, Mechanism, and Synthesis; Elsevier: Amsterdam, The Netherlands, 2014. [Google Scholar]
  50. Hara, M.; Yoshida, T.; Takagaki, A.; Takata, T.; Kondo, J.N.; Hayashi, S.; Domen, K. A carbon material as a strong protonic acid. Angew. Chem. Int. Ed. 2004, 43, 2955–2958. [Google Scholar] [CrossRef]
  51. Ogino, I.; Suzuki, Y.; Mukai, S.R. Esterification of levulinic acid with ethanol catalyzed by sulfonated carbon catalysts: Promotional effects of additional functional groups. Catal. Today 2018, 314, 62–69. [Google Scholar] [CrossRef]
  52. Melero, J.A.; Morales, G.; Iglesias, J.; Paniagua, M.; Hernández, B.; Penedo, S. Efficient conversion of levulinic acid into alkyl levulinates catalyzed by sulfonic mesostructured silicas. Appl. Catal. A Gen. 2013, 466, 116–122. [Google Scholar] [CrossRef]
  53. Patil, C.R.; Niphadkar, P.S.; Bokade, V.V.; Joshi, P.N. Esterification of levulinic acid to ethyl levulinate over bimodal micro-mesoporous H/BEA zeolite derivatives. Catal. Commun. 2014, 43, 188–191. [Google Scholar] [CrossRef]
  54. Yamaguchi, D.; Hayashi, S.; Suganuma, S.; Kato, H.; Kitano, M.; Nakajima, K.; Hara, M. Adsorption-Enhanced Hydrolysis of β-1,4-Glucan on Graphene-Based Amorphous Carbon Bearing SO 3 H, COOH, and OH Groups. Langmuir 2009, 25, 5068–5075. [Google Scholar]
  55. do Fraga, A.C.; Quitete, C.P.B.; Ximenes, V.L.; Sousa-Aguiar, E.F.; Fonseca, I.M.; Rego, A.M.B. Biomass derived solid acids as effective hydrolysis catalysts. J. Mol. Catal. A Chem. 2016, 422, 248–257. [Google Scholar] [CrossRef]
  56. Zhang, S.; Tsang, D.C.W.; Yu, I.K.M.; Chen, S.S.; Xiong, X.; Cao, L.; Kwon, E.E.; Song, H.; Poon, C.S.; Ok, Y.S. Sulfonated biochar as acid catalyst for sugar hydrolysis and dehydration. Catal. Today 2018, 314, 52–61. [Google Scholar]
  57. Boudart, M. Turnover Rates in Heterogeneous Catalysis. Chem. Rev. 1995, 95, 661–666. [Google Scholar] [CrossRef]
Figure 1. FTIR spectra of petcoke before and after refluxing in different solutions at 120 °C for 24 h.
Catalysts 10 00259 g001
Figure 2. XPS S2p (left, a–d) and C1s (right, A–D) spectra for petcoke before and after acid treatment.
Catalysts 10 00259 g002aCatalysts 10 00259 g002b
Figure 3. Pore size distributions of petcoke before and after various acid treatments, as determined by CO2 adsorption using a 2D-NLDFT-HS model.
Catalysts 10 00259 g003
Figure 4. XRD patterns of petcoke before and after acid treatments.
Catalysts 10 00259 g004
Figure 5. Oxidation of two representative structures within petcoke with nitric acid (adapted with permission from ref [47]; published by Elsevier, 1994).
Catalysts 10 00259 g005
Figure 6. Proposed reaction pathway for the oxidation of dibenzothiophene (adapted with permission from ref [48]; published by ROYAL SOCIETY OF CHEMISTRY, 2003).
Catalysts 10 00259 g006
Figure 7. The yield of caprylic acid methyl ester from esterification reactions with petcoke before and after various acid treatments. Reaction conditions: 5 mL (~4.5 g) octanoic acid, 25 mL methanol (methanol: octanoic acid = 20:1 molar ratio), 60 °C, 500 rpm, 0.45 g catalyst.
Catalysts 10 00259 g007
Table 1. Surface chemical properties of petcoke before and after various acid treatments.
SampleElemental Analysis 1 (at%)Acidity
(mmol/g)
Aromatic
Hydrogen 4 (mmol/g)
COSNO/CS/CStrong Acid 2Total 3
Petcoke72.420.52.21.10.280.03nd 50.341.5
P-S-248411.72.51.80.140.030.251.490.6
P-N-2467.626.61.44.40.390.020.705.250.9
P-N/S-2468.325.01.84.90.370.030.735.460.6
1 By XPS; 2 titrated with NaCl; 3 titrated with NaOH; 4 estimated from FTIR; 5 not detected.
Table 2. Physical properties of petcoke before and after various acid treatments.
SampleN2
Adsorption 1
CO2
Adsorption 1
Ash Content 2 (wt%)
SA (m2/g)V (cm3/g)SA (m2/g)V (cm3/g)
Petcoke1.50.005840.0217.7
P-S-244.60.013174 0.0452.1
P-N-244.10.015151 0.0352.1
P-N/S-242.30.0091250.0283.4
1 2D-NLDFT-HS model; 2 estimated from TGA.
Table 3. Solid acid catalysts in esterification reactions.
No.ReactantsCatalyst
(Concentration of Catalytic Acid Sites)
Reaction ConditionsTOF 1 (h–1)Ref.
1AcA 2 + EtOH 3Sulfonated naphthalene derived carbon (4.9 mmol/g)70 °C, AcA/EtOH = 1/10 (molar ratio)78[50]
2LA 4 + EtOHSulfonated activated carbon (0.5 mmol/g)60 °C, LA/EtOH = 1/3 (molar ratio)40[51]
3LA + EtOHSulfonated carbide-derived carbon
(0.8 mmol/g)
60 °C, LA/EtOH = 1/5 (molar ratio)2[17]
4CA 5+ MeOH 6Sulfonated activated carbon from coffee residue (0.45–0.72 mmol/g)60 °C, CA/MeOH = 1/3 (molar ratio)25–47[10]
5CA+ MeOHAmberlyst-15 (4.3 mmol/g)60 °C, CA/MeOH = 1/3 (molar ratio)4[10]
6LA + EtOHAmberlyst-15
(4.8 mmol g–1)
75 °C, LA/EtOH = 1/5 (molar ratio)5[52]
7LA + EtOHMicro-mesoporous Beta zeolite (0.69 mmol/g)70 °C, LA/EtOH = 1/6 (molar ratio)6[53]
8OA 7+ MeOHSulfonated high sulfur petroleum coke (0.7 mmol/g)60 °C, OA/MeOH = 1/20 (molar ratio)31This work
9OA+ MeOHNitric acid oxidized high sulfur petroleum coke (0.7 mmol/g)60 °C, OA/MeOH = 1/20 (molar ratio)7This work
10OA+ MeOHNitric acid and sulfuric acid mixture oxidized high sulfur petroleum coke (0.73 mmol/g)60 °C, OA/MeOH = 1/20 (molar ratio)11This work
1 Estimated by ester(mol)/catalytic acid sites(mol)/time(h); 2 AcA, acetic acid; 3 EtOH, ethanol; 4 LA, levulinic acid; 5 CA, caprylic acid; 6 MeOH, methanol; 7 OA, octanoic acid.

