Article

An Accurate Growth Mechanism and Photocatalytic Degradation Rhodamine B of Crystalline Nb2O5 Nanotube Arrays

Tianjin Key Laboratory of Brine Chemical Engineering and Resource Eco-utilization, College of Chemical Engineering and Materials Science, Tianjin University of Science and Technology, Tianjin 300457, China
*
Author to whom correspondence should be addressed.
Catalysts 2020, 10(12), 1480; https://doi.org/10.3390/catal10121480
Submission received: 25 November 2020 / Revised: 10 December 2020 / Accepted: 15 December 2020 / Published: 17 December 2020
(This article belongs to the Special Issue Understanding the Molecular Mechanisms of Photocatalysis)

Abstract

:
To effectively improve photocatalytic activity, the morphology and crystallinity of semiconductor photocatalysts must be precisely controlled during the formation process. Self-aligned Nb2O5 nanotube arrays have been successfully fabricated using the electrochemical anodization method. A novel growth mechanism of Nb2O5 nanotubes has been proposed. Starting from the initial oxidation process, the “multi-point” corrosion of fluoride ions is a key factor in the formation of nanotube arrays. The inner diameter and wall thickness of the nanotubes present a gradually increasing trend with increased dissociative fluorine ion concentration and water content in the electrolyte. With dehydroxylation and lattice recombination, the increased crystallinity of Nb2O5 represents a reduction of lattice defects, which effectively facilitates the separation and suppresses the recombination of photo-generated carriers to enhance their catalytic degradation activity.

Graphical Abstract

1. Introduction

Compared with traditional biological and electrooxidized treatments, photocatalysis is an environmentally friendly technology for the treatment of all kinds of contaminants [1,2], especially for the removal of organic contaminants with solar energy, which mainly includes the oxidative decomposition of volatile organic compounds and purification of waste water. Semiconductor photocatalysts have been used to effectively reduce the concentration of organic pollutants and elevate the rate of hydrogen evolution in photocatalysis water under sunlight illumination [3,4], which has attracted attention and research over several decades. With the characteristic morphologies of nanomaterials, nanotubes take many paralleled channels, which have outstanding advantages in photocatalytic applications [5]. The distinct nanotube array structure intensifies the quantum availability because of its repeated refraction [5,6], except for the large specific surface area provided by the tubular structure.
Except for niobium oxide as a transition oxide, which possesses excellent stability and catalytic activity such as with TiO2, ZnO, and WO3, Nb2O5 has higher selectivity for partial oxidation products [7]. Nb2O5 with nanostructures has been synthesized by hydrothermal synthesis [8], sol-gel processes [9], templating techniques [10], reactive sputtering [11], and electrochemical anodization [12], and has been applied to electrochemical sensors [13], photocatalysis [14], and lithium batteries [15,16], correspondingly. In particular, electrochemical oxidation is extensively used and explored due to its flexible operation, short time duration, and mild reaction conditions. It is worth mentioning that the morphology of the oxide generated on the base metal foil is effectively controlled by changing the oxidation parameters, such as the composition of the electrolyte, the oxidation time, and the like, to contribute to more flexible applications in different aspects [17].
Great contributions have been made by numerous research teams [18,19,20,21] to understand the growth mechanism of nanotube oxides in the process of anodic oxidation. While previous investigators proposed possible growth mechanisms of Ta2O5 [22], ZrO2 [23], and TiO2 [18,19] under specific conditions, researchers had only understood the growth mechanism of tube-like anodic oxide. Theories introduced to explain the growth process of anodic oxide include the field-assisted dissolution model [24], the mechanical splitting model [25], the localized dielectric breakdown model [26], and the viscous flow model [27,28,29,30]. The explicit growth mechanism of Nb2O5 nanotube arrays (Nb2O5 NAs) has not been proposed in electrolyte as compared with other nanostructures of niobium oxide [31,32,33]. In particular, the initial process and causes of nanotube array formation are not clear. It follows that the lack of a definite growth mechanism and active sites impedes further development of niobium oxide in promising material science and catalytic applications. In addition, the geometric aspects of a controllable nanotube, such as diameter (D), wall thickness (d), inter-tube distance (w), and nanotube length (H), can facilitate the separation and migration rate of photogenerated carriers and restrain the recombination process of holes and electrons in the photocatalytic reaction [14]. The decisive role in determining the key factors in the growth process is in line with findings on the controlled morphology of nanotube arrays.
Ever since the first observation of self-organized Nb2O5 nanostructures by Sieber et al. [34], the types of acids in electrolytes have been focused on the electrochemical self-organized formation of transition niobium oxide nanotubes [35]. Galstyan et al. found that decreased H2O concentration and increased NH4F content in glycerol are the key factors in nanotube formation [36].
In this work, the key factors (such as electrolyte composition, etc.) affecting the structure of the nanotube array during the preparation process are explored. To find out the relationship between the structure and composition of nanotube arrays and the photocatalytic activity, the optimal conditions to control the morphology and crystallinity of nanotube arrays and photocatalytic degradation performance were investigated in detail. An accurate growth mechanism of Nb2O5 nanotubes during the fabrication procedure, especially the original state, is also proposed. Furthermore, the photocatalytic performance of as-prepared samples, modeled for the photocatalytic mechanism of Nb2O5 nanotube arrays, is assessed by monitoring the degradation of Rh B under UV light.

2. Results and Discussion

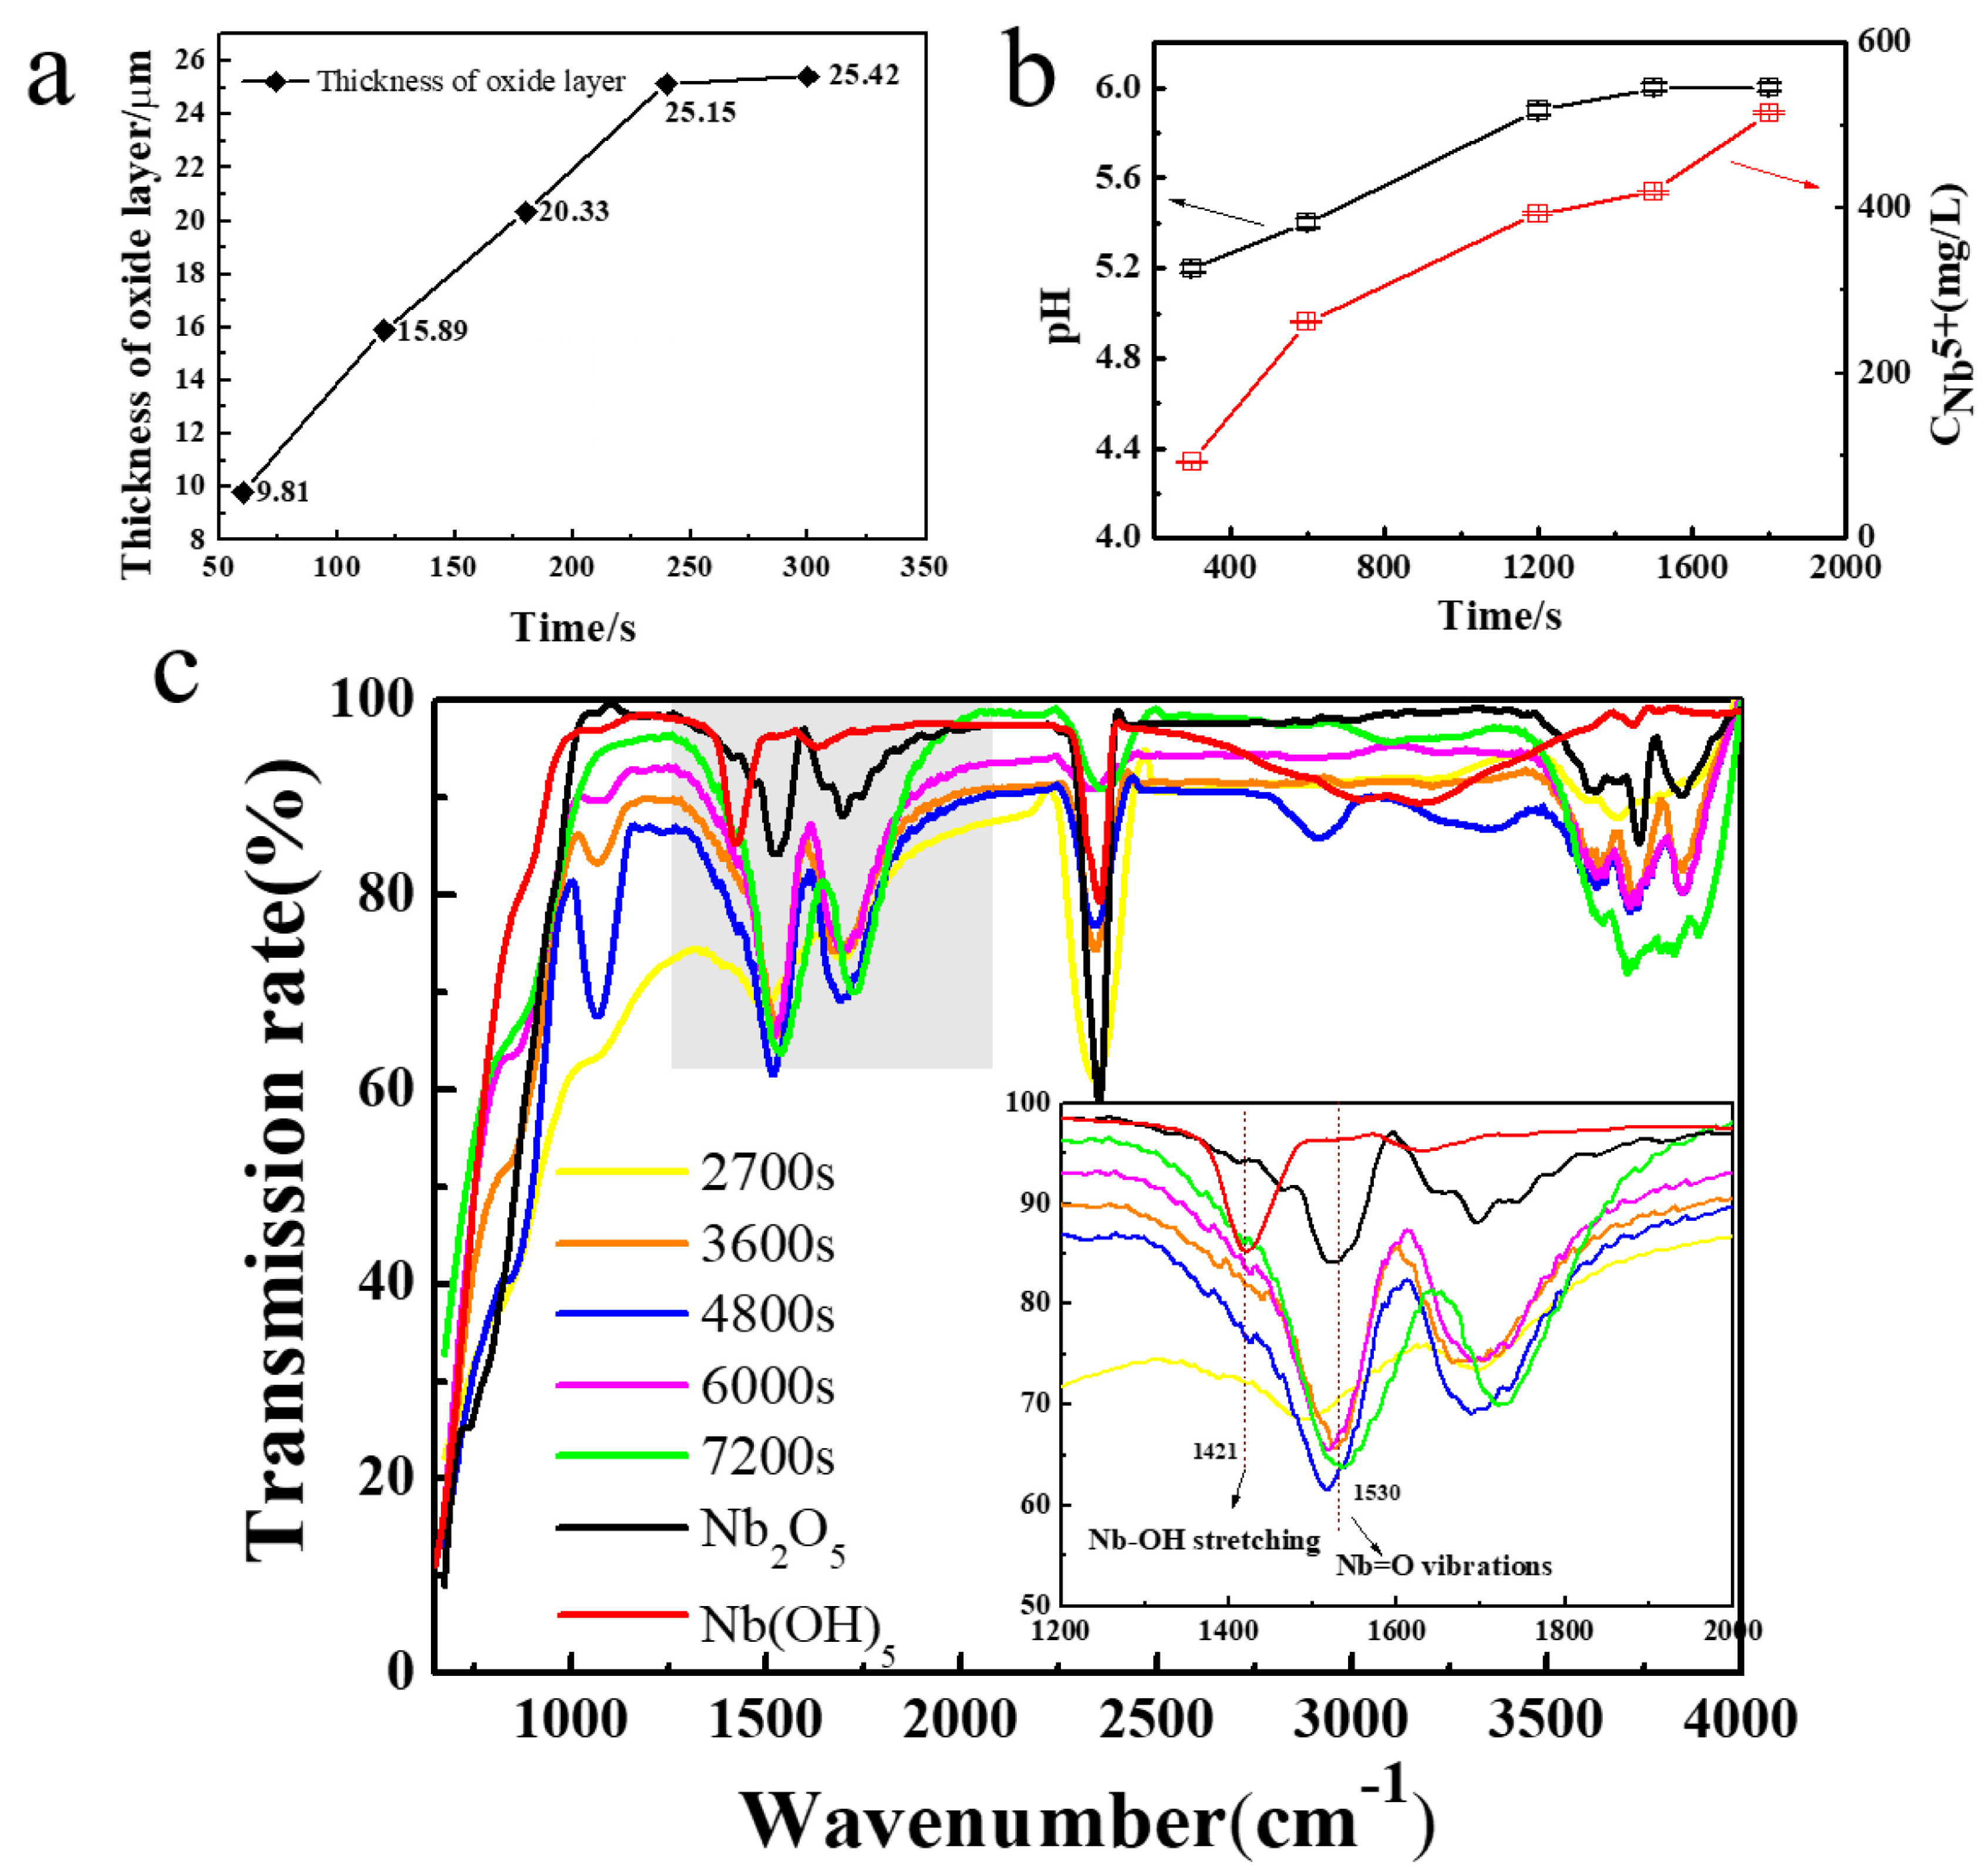
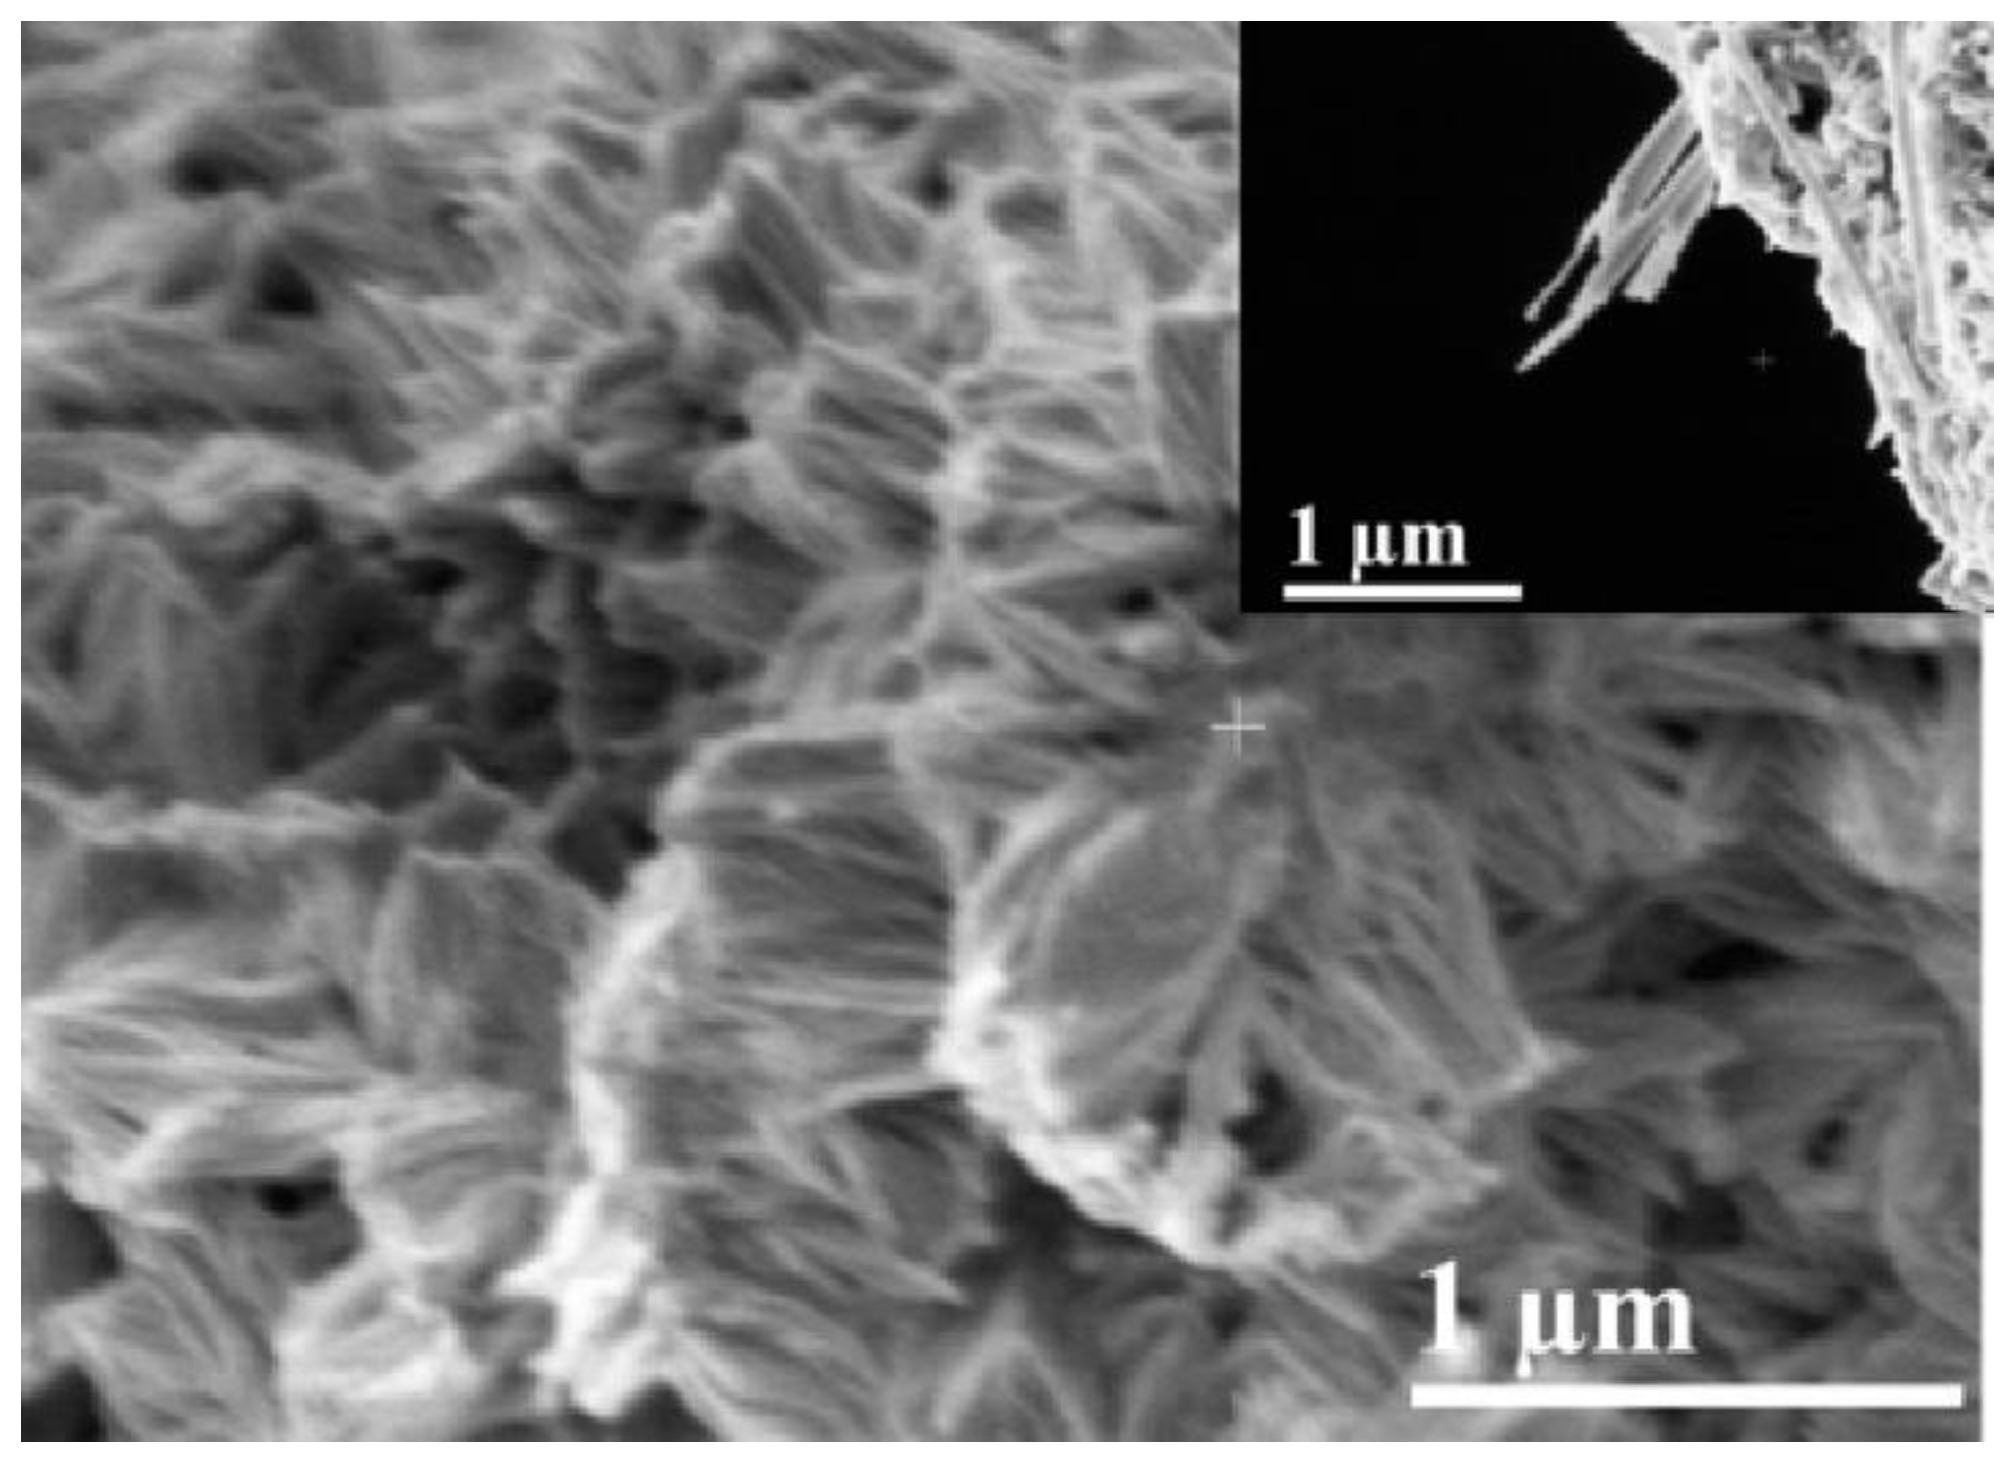
2.1. Growth Mechanism

A schematic diagram of self-aligned Nb2O5 NAs by electrochemical anodization is shown in Figure 1, divided into initial oxidation corrosion and dehydration processes. The whole growth mechanism of nanotubes embodies four basic stages: (I) Initial oxidation corrosion process, including rapid oxidation; (II) further oxidation; (III) competition between oxidation and corrosion; and (IV) dehydration process reaching a balance under the constant voltage system. It is worth mentioning that in the precise growth mechanism of Nb2O5 NAs, the fluctuation of resistance value influenced by electrolyte and oxide layers formed on the electrode surface plays a crucial role, verified by the change of current value in the constant voltage system (Figure 2). The current value (expressed as I) can be derived from the working voltage (expressed as U) and the resistance (expressed as R) based on Ohm’s law in Equation (1). The resistance of the electrolyte and the oxide layers formed on the surface of niobium foil during the reaction are represented by R1 and R2, respectively.
I = U R 1 + R 2
In stage I, as the initial stage, the resistance is mainly from the electrolyte (R1; the resistance of Nb foil is ignored to zero), which causes high current density to be detected as early as 5 s, as shown in Figure 2. Under the electric field, the niobium foil as the anode is oxidized to release a large number of free electrons to generate Nb5+ in the electrolyte/metal interface; meanwhile, anions in the electrolyte (OH/O2−/F) spontaneously diffuse to the surface of the anode and combine with Nb5+ to form Nb2O5, Nb(OH)5, and NbF72−, which causes the current density to dramatically drop to a minimum value. When a thinner oxide layer is formed in a transient period of 60 s, the oxide layer is consistent with the SEM image shown in Figure 3a. It plays a key role in the initial oxidation process, but the corrosion process of F is not the dominant process. It can be observed from Figure 3b that the contact angle is relatively large during the initial electrooxidation process, which leads to an uneven distribution of fluoride ions in the electrolyte at the interface between electrode and electrolyte. The occurrence of this phenomenon means that the electrolyte is isolated, with high dispersion on the surface of the oxide layer as a bunch of parallel “arrows” coming in. The fluctuation of these physical properties is the redistribution of surface concentration and thus the formation of “multi-point” corrosion as starting points for the formation of nanotubes (Figure 1I). The main chemical reactions that occur at stage I are described by Equations (2)–(6):
Nb Nb 5 + + 5 e
H 2 O     H + + OH    
2 H 2 O O 2 + 4 H + + 4 e
4 Nb 5 + + 5 O 2 + 20 e 2 Nb 2 O 5
Nb 5 + + 5 OH     Nb ( OH ) 5
In stage II, the change of the electrode (R2) in the oxide formed on the surface is the main factor affecting the current value. In this process, the sharp increase of oxide thickness is dominant. A further reduction in the contact angle with the increased oxide surface leads to the formation of micro-pits and increased contact area in the interface, which allows the quantity of fluoride ions to accumulate rapidly (Figure 3d). As shown in Figure 4a, it is clearly demonstrated that the thickness of oxide formed by further oxidation increases with the oxidation time and stabilizes at 300 s. Similarly, an increase in the thickness of the oxide layer can be seen from the SEM image (Figure S1) due to the change of resistance, demonstrated by a slow decrease in the current (Figure 2).
In stage III, the corrosion of F becomes dominant when the rapid growth of the oxide layer tends to stabilize. At this stage, the sharp reduction of contact angle not only causes the electrolyte to be highly dispersed on the oxide surface, but also mass fluoride ions accumulate in the pits to enhance the corrosion effect under the electric field (Figure 3f). The pits get larger and deeper with further erosion at the electrolyte/oxide layer interface, as can be seen from the SEM image (Figure 3e). The dense oxide layer is continuously corroded downward to form a tube, which leads to decreased surface resistance of the electrode and increased current density (Figure 2). OH and NbF72− are continuously released in the electrolyte to enhance the corrosion, leading to increased pH and Nb5+ concentration (Figure 4b).
Nb 2 O 5   +   14 F     +   10 H +   2 NbF 7 2   +   5 H 2 O
Nb ( OH ) 5 +   7 F         NbF 7 2   +   5 OH    
At stage IV, the current reaches a stable state, indicating the beginning of the recombination process of chemical components and lattices of nanotubes, as shown in Figure 2. Niobium hydroxide, as a by-product, is converted into the effective active component niobium oxide by dehydration under an electric field. In the meantime, a soluble complexation ion, NbF72−, is spontaneously hydrolyzed into niobium hydroxide in the electrolyte (Equations (9) and (10)) at a pH of more than 7. It is obvious in Figure 3g that, comparatively, nanotubes with well-distributed diameters were formed on the surface, except for some broken edges near the mouths of tubes. To convincingly confirm these, the molecular structure of the intermediate generated at different times was characterized using SEM and ATR-IR. Compared with Nb2O5, Nb(OH)5 prepared by the reference method, the IR spectrum was adopted to demonstrate the functional group properties of as-prepared samples. As presented in Figure 4c, the peak occurred between 650 and 1000 cm−1, corresponding to the asymmetric stretching of the [-O-Nb-O-]n bond [36]. The absorption peaks of the ATR-IR spectrum around a wavenumber of 1421 cm−1 can be associated with the bending vibration of the hydroxyl –OH group of the Nb-OH structure. Peaks appeared near 1530 cm−1 and 1696 cm−1, was to Nb = O and Nb–O, respectively [37]. The absorption peak of the sample appeared near a wavenumber of 3400–1620 cm−1, which may be caused by asymmetric and symmetric stretching vibration of the hydroxyl group (-OH) and the surface hydroxyl group of the water molecules absorbed [38]. It is confirmed that Nb2O5 and Nb(OH)5 were present in the oxide layer. The partial wavenumbers corresponding to absorptions are displayed in Table 1. The absorption of as-prepared samples at 1421 cm−1 generally presented a right shift trend compared with pure Nb(OH)5, which may be due to the influence of oxides. According to the data given in Table 1, it is reasonable to believe that the transformation of hydroxides with low resistance into oxides under the action of an electric field and the results on the increased oxide content to some extent (Equation (10)) were confirmed by the increasing proportion of oxides.
2 NbF 7 2   +   5 H 2 O     Nb 2 O 5   +   14 F     +   10 H +
2 Nb ( OH ) 5     Nb 2 O 5   +   5 H 2 O

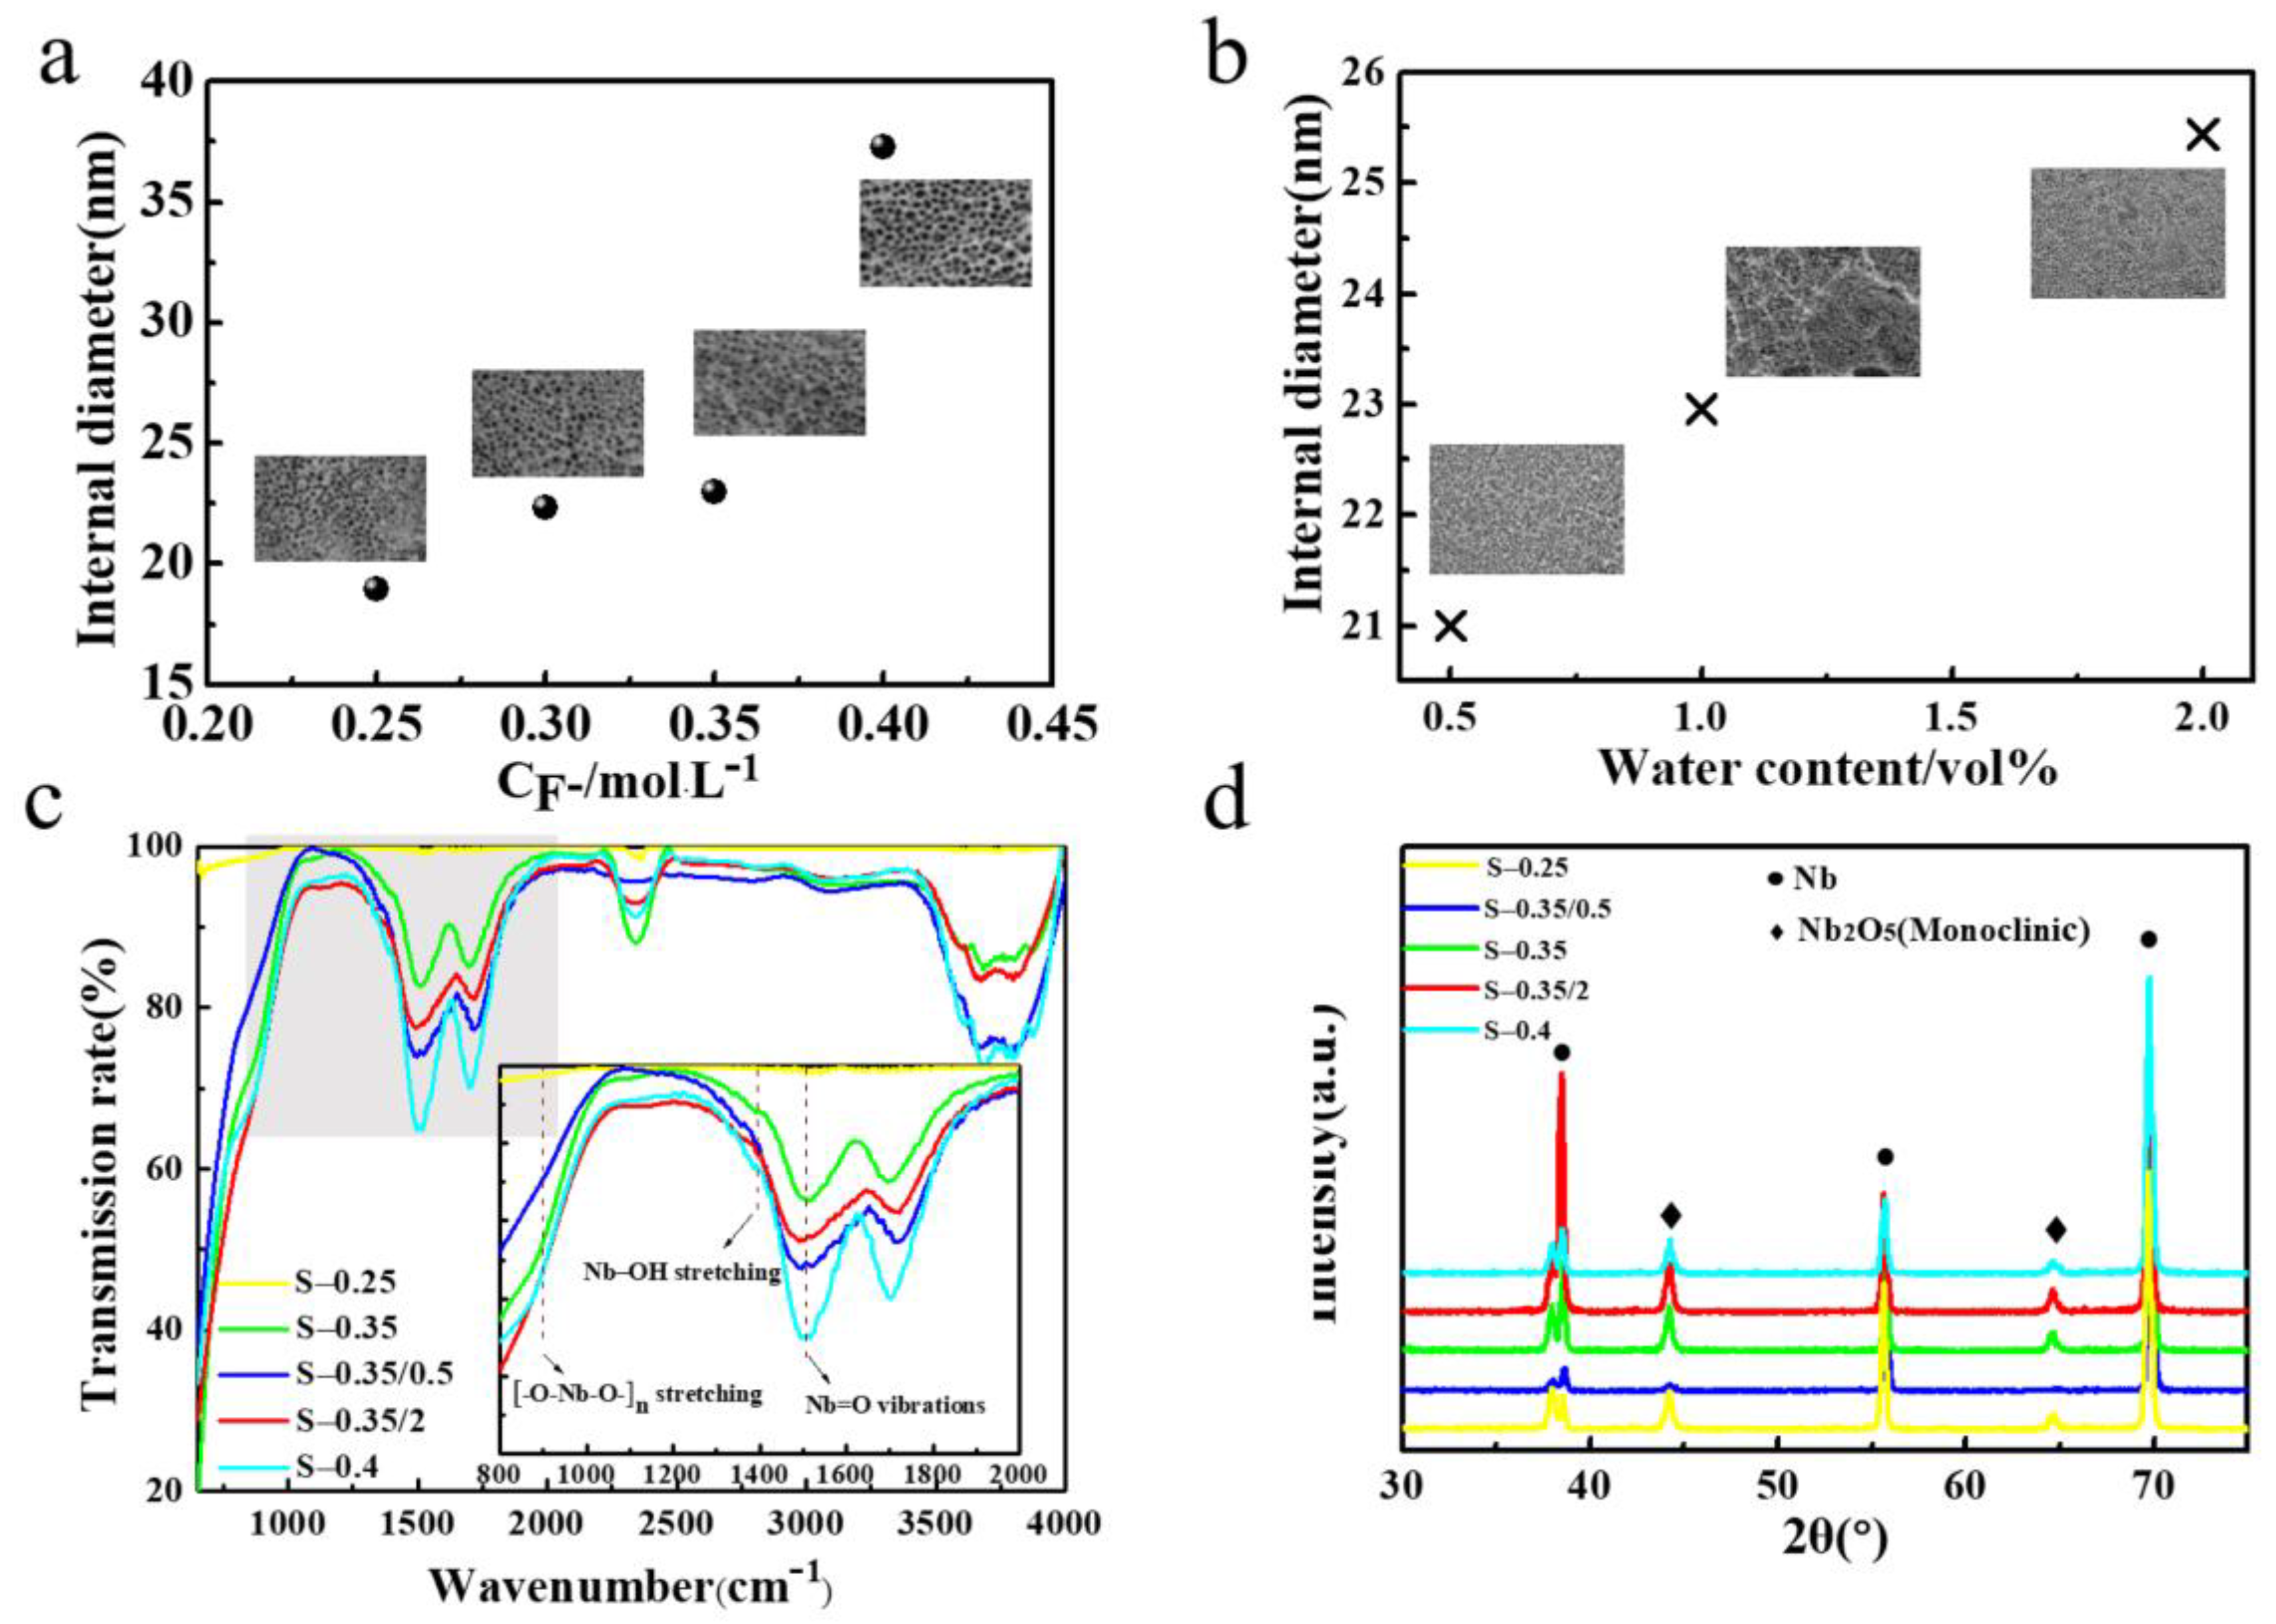
2.2. Effect of Essential Ions on Formation of Nb2O5 NAs

The formation processes of oxide nanotubes in electrolyte containing fluoride ions by anodization on metals such as Ti and Ta were reported [34,39]. Nb2O5 nanotube fabricated by anodization in NH4F containing ethylene glycol (EG) solution are different from other metal oxidation, such as TiO2; especially with electrolyte containing H2O, anodization promotes the development of oxygen-containing anions (i.e., OH, O2) [40]. The formation of Nb2O5 NAs strongly verified that fluoride ions play an important role in corroding oxide barrier layers and proved by above growth mechanism. To explore the key factors affecting the growth of Nb2O5 NAs, the concentration of fluoride ions in the electrolyte was adjusted to observe the effect on the morphology of oxidation during the anodization process. Figure 5a shows the effective distribution of pore diameter to prove that the average inner diameter measured by Digital Micrograph software of the tubes presented a gradually increasing trend with increased dissociative fluorine ion concentration. That is, the initial F concentration of the electrolyte is a key factor to control the nanotube size of Nb2O5 NAs. Beyond that, the nanostructure of Nb2O5 surface was characterized by SEM (Figure S2), as shown in Figure 5b, indicating that the uniformity of the nanotubes was affected by the proportion of water added. It is easy to obtain uniform Nb2O5 nanotubes in an electrolyte containing ethylene glycol with a water content of 2%, which indicates that appropriate water content can increase the transfer rate of free ion in the electrolyte and thus spontaneously form self-aligned tubes.
Oxidized at a voltage of 20 V in 2 h, samples S-0.25, S-0.35, and S-0.4 were prepared in electrolytes only containing ethylene glycol with fluoride ion concentration at 0.25, 0.35, and 0.4 M NH4F, and samples S-0.35/0.5 and S-0.35/2 were formed with water content in 0.35 M NH4F at 0.5 and 2vol%, respectively. The composition and crystallinity of as-prepared samples were investigated by ATR-IR spectroscopy (Figure 5c) and XRD (Figure 5d), respectively. The fourth stage, the molecular composition of the oxide layer formed on the Nb substrate, is summarized in Table 2. Comparing the intensity of the oxide and hydroxide peaks in the oxide layer, it can be easily obtained that the amount of oxide is approximately twice that of hydroxide, which affects its catalytic properties to some extent. The XRD patterns of Nb2O5 NAs synthesized under different conditions were compared to determine the crystalline phase and crystallinity of the samples. These peaks are mainly attributed to Nb substrates and oxides. Among the peaks from XRD patterns (Figure 5d), the three higher diffraction peaks at 38.5° (110), 55.5° (200), and 69.6° (211) are classified as characteristic peaks of niobium foil (JCPDS #35-0789). The two diffraction peaks at 44.1° and 64.5° are indexed as the monoclinic phase of Nb2O5 (JCPDS #19-0864).
On that basis, the crystallinity of the samples was calculated, and a summary is given in Table 2. The differences in crystallinity depended on the electrooxidation, but also on the dehydroxyl rate during the anodic oxidation process. As is shown in Table 2, compared with the pure organic electrolyte, water in the electrolyte accelerated the electrolysis rate and produced more OH in the early stage of electrooxidation, which led to a reduction of the effective active components, but inhibited the catalytic efficiency. Meanwhile, a too-high concentration of fluoride ion will lead to oxide breaking and blocking the gate in the process of corrosion, which can reduce the utilization rate of photons. From the above growth mechanism, it can be obtained that hydroxides in the later period of anodic oxidation gradually convert into oxides with the extension of oxidation time. Hence, it is worth noting that the free fluoride ion concentration, water content, and oxidation time are essential operating parameters for controlling the molecular composition and crystallinity of Nb2O5 NAs during the anodic oxidation process.

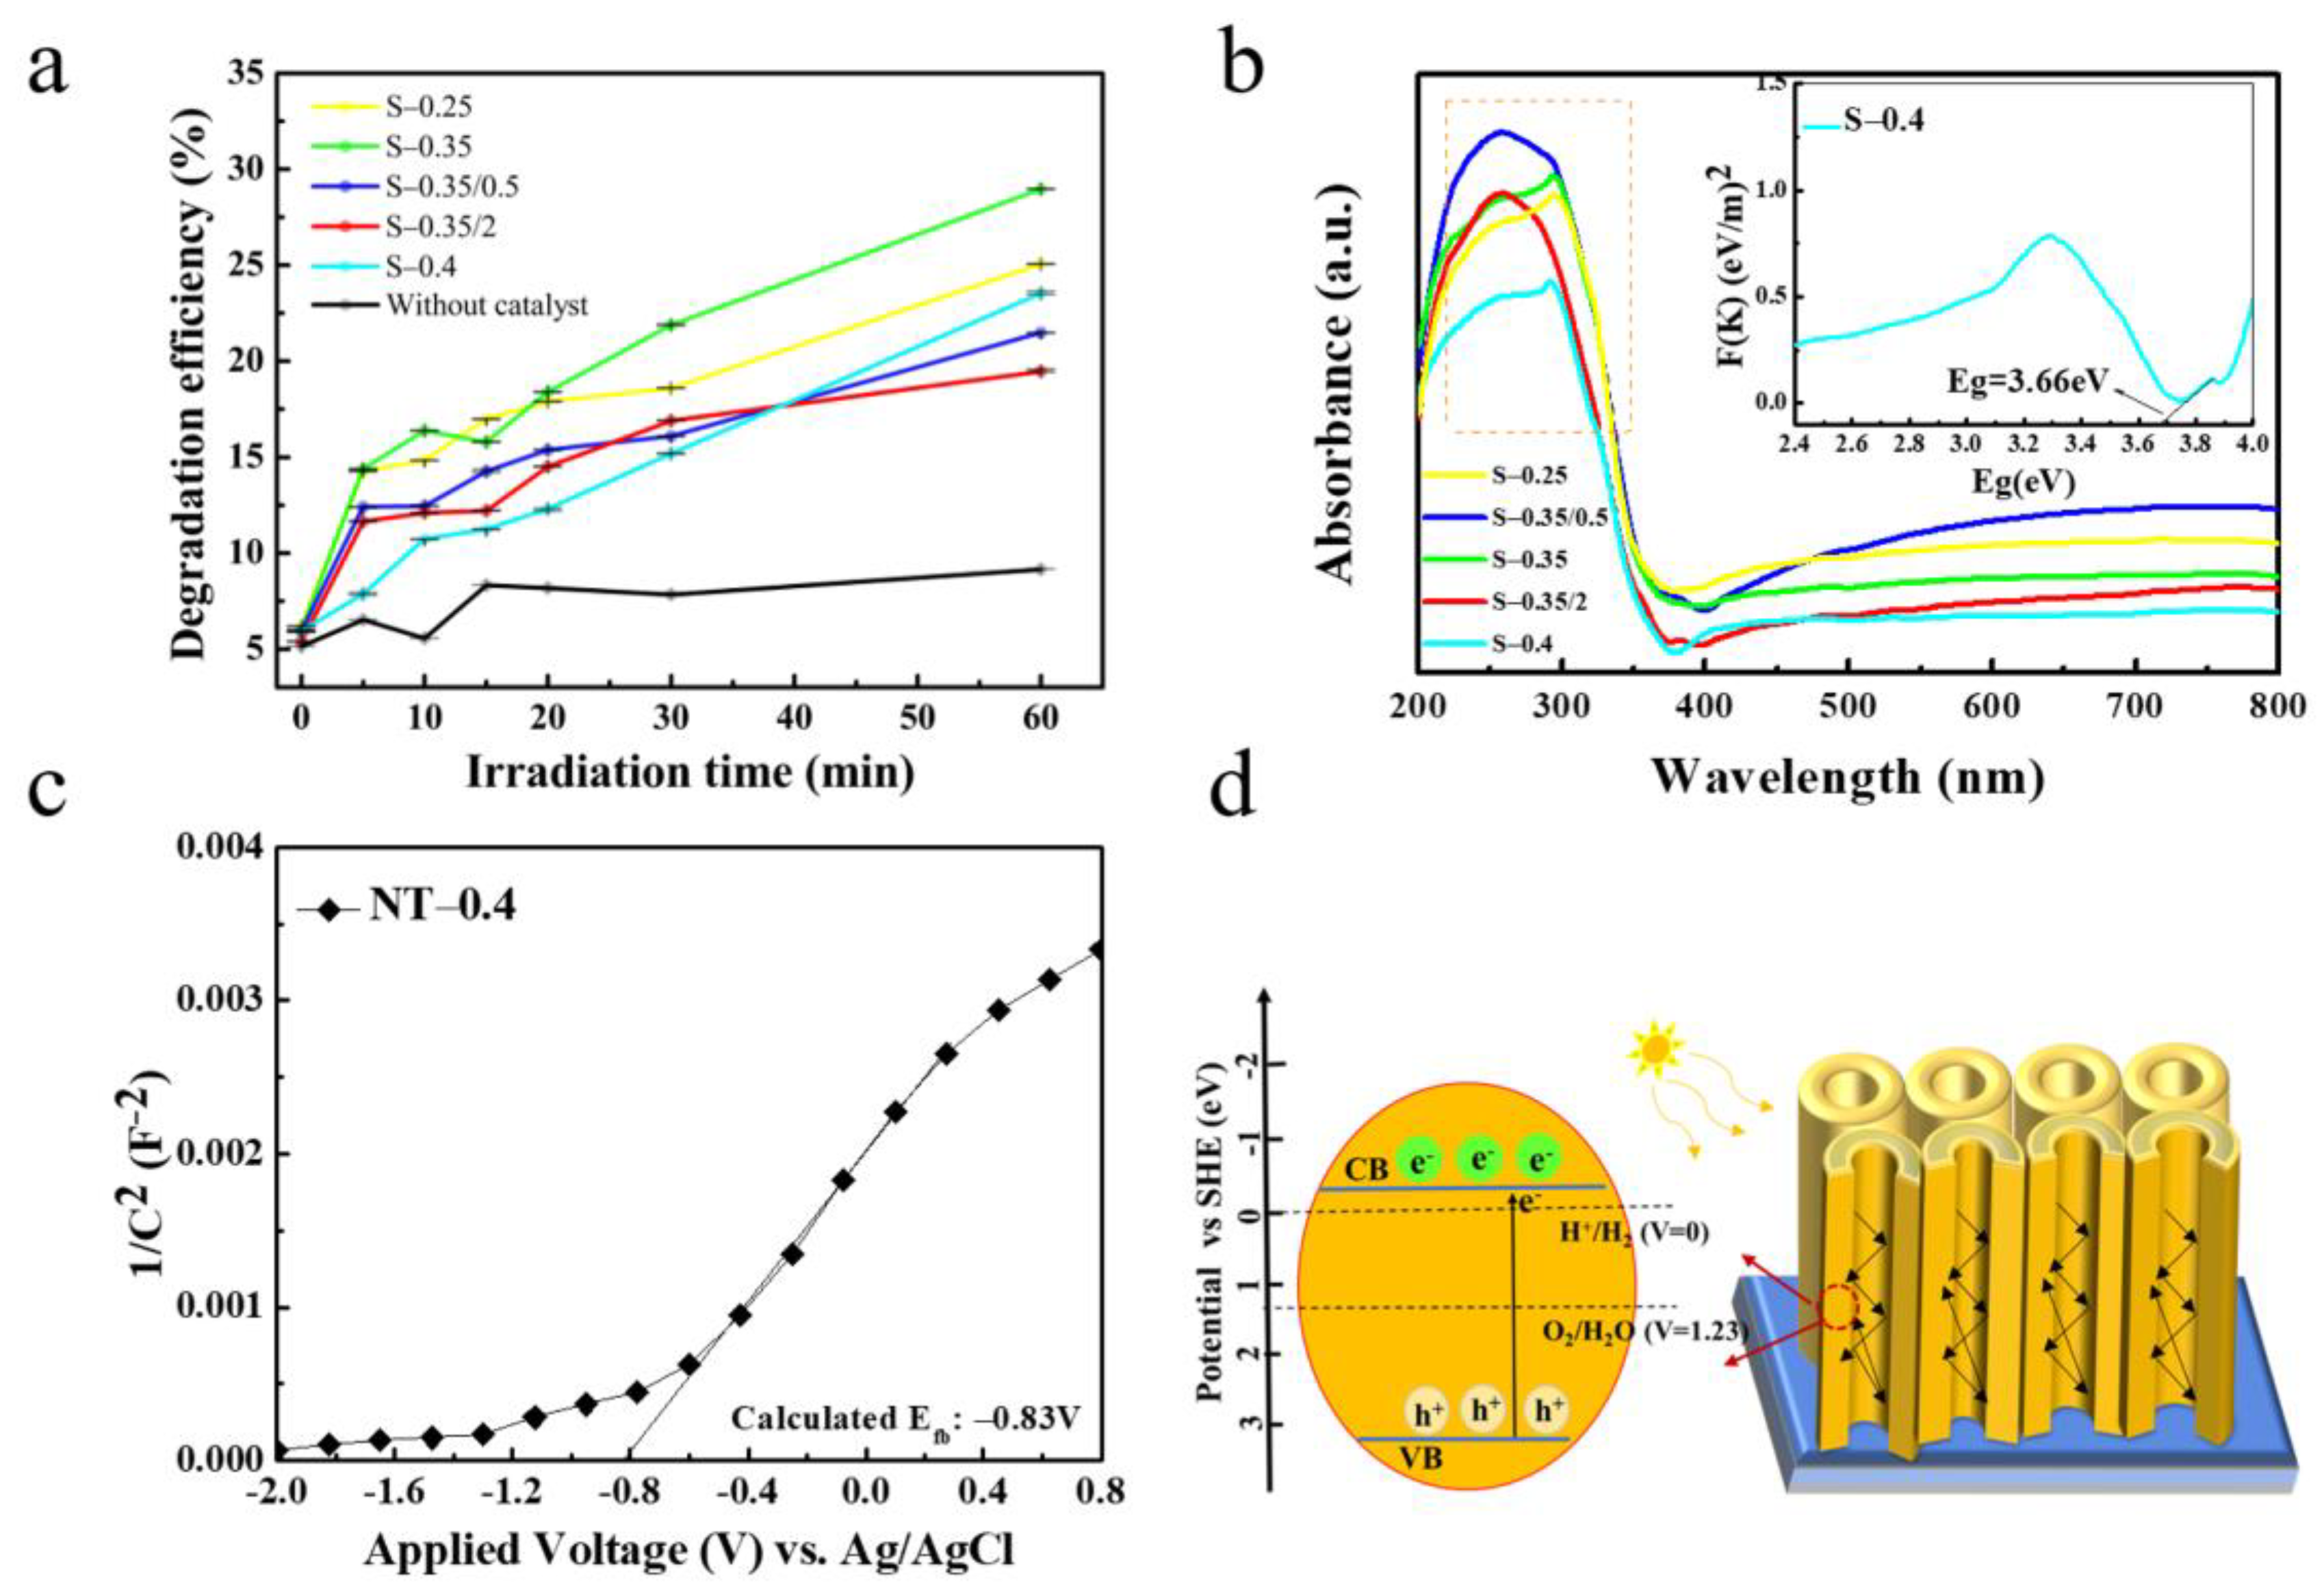
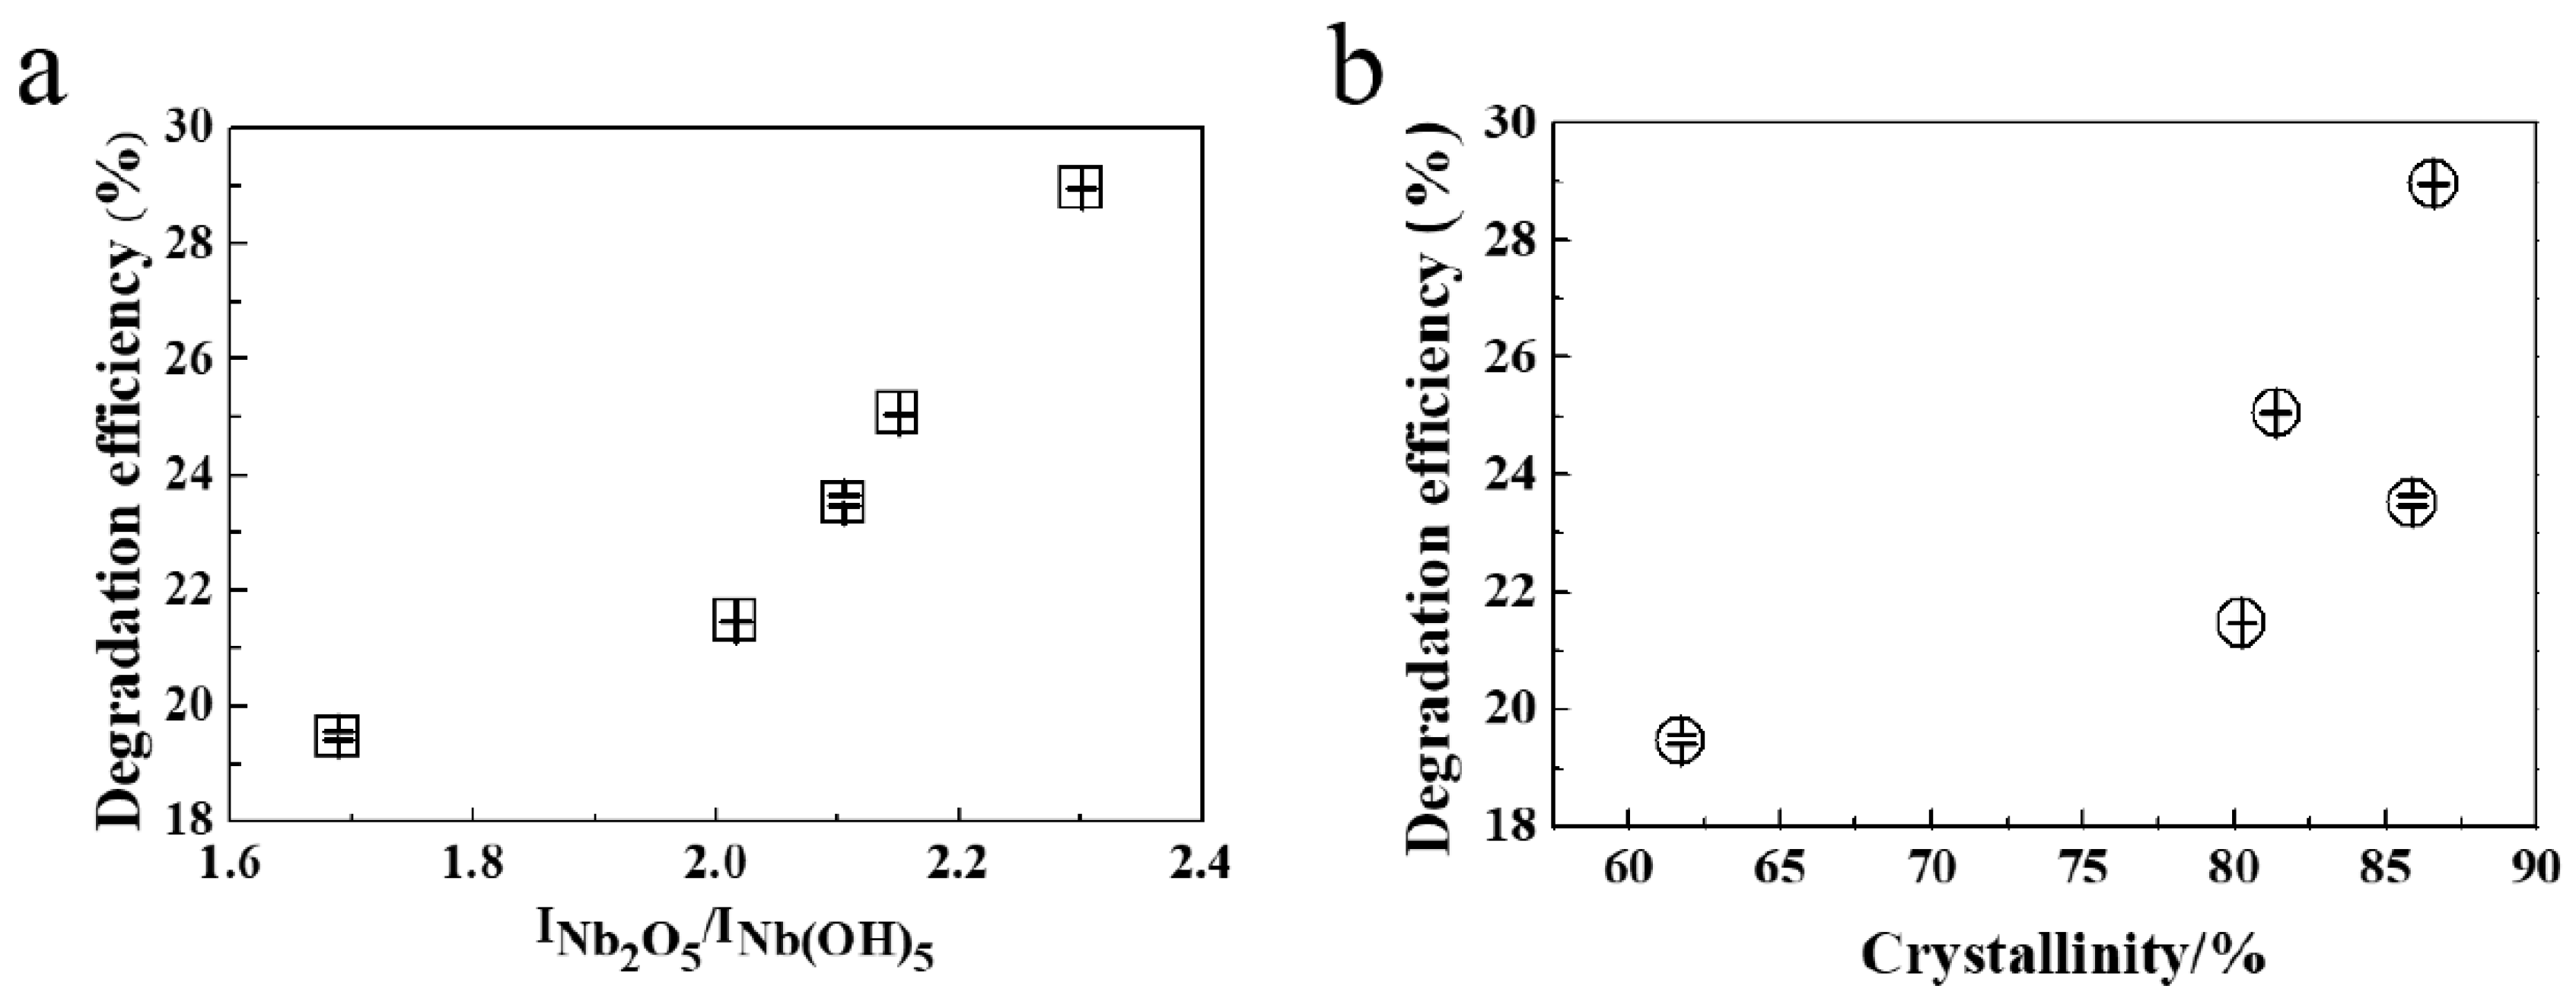
2.3. Catalytic Performance and Mechanism

Rhodamine B (Rh B), an organic dye as a model organic compound, is widely adopted to conduct photodegradation experiments in UV light to evaluate the photocatalytic activity of as-prepared catalysts. The absorption peak at 554 nm was measured as characteristic at a certain interval to compare the performance diversity of as-prepared samples. As shown in Figure S3, the curve of Rhodamine B (R2 > 99) was measured to convert the sampling concentration. It is worth noting that the thickness of the oxide layer with a free-standing nanotube layer excluded from Nb substrate should be more than 1 µm (Figure 6) to be sufficiently exposed to UV light irradiation. The degradation efficiency of the catalysts for the organic dye solution was calculated by Equation (11), where DE is the degradation efficiency of the dye (%), C0 is the initial concentration of Rh B solution, and C is the concentration of the instantaneous dye extracted.
DE   = { 1 C C 0 } 100 %
The as-prepared samples were immersed in Rh B solution for 30 min under dark conditions prior to UV irradiation. As shown in Figure S4, due to their adsorption on the sample surface, the concentration of Rh B molecules in the solution decreased, and reached the adsorption equilibrium after 30 min. The photocatalytic performance was distinctly evaluated with the degradation efficiency of Rh B in the Nb2O5 NAs samples. As shown in Figure 7a, a slight degradation of Rh B was observed at the initial stage without the catalysts under UV light. After 60 min of UV light irradiation, about 28.96% of Rh B was removed by S-0.35/0.5 with superior degradation efficiency, whereas only 25.06, 21.48, 19.47, and 23.52%, was removed by samples S-0.25, S-0.35, S-0.4, and S-0.35/2, respectively. Meanwhile, UV-visible diffuse reflection was used to analyze the optical absorption properties of as-prepared samples for further exploration of the utilization of UV light. As shown in Figure 7b, the maximum absorption peaks of samples S-0.25, S-0.35, and S-0.4 had a larger red shift at 295 nm compared to samples S-0.35/0.5 and S-0.35/2 prepared under water conditions. This is because the addition of a certain amount of water in the preparation process will reduce the mass transfer resistance of the organic electrolyte and accelerate the corrosion or even fragmentation of the nanotubes, and the results were proved by SEM (shown in Figure S2). With the data in Table 2, the content of oxide and relative crystallinity of as-prepared samples can be demonstrated, and it shows that the disorder of molecular arrangement in the samples under the condition of water. The red shift order of the maximum absorption peaks of some as-prepared samples is consistent with the degradation efficiency, indicating that the photocatalytic degradation performance is restricted by the photo absorption effect of the catalysts. The band gap can be evaluated from the plot of F(K) = (αhv)1/2 vs. hv, by extrapolating the straight line to the x-axis. It can be observed from the thumbnail in Figure 7b that the band gap of pure Nb2O5 NAs sample (S-0.4) was found to be approximately 3.66 eV.
To determine the carrier separation due to the band alignment under anodic oxidation, Mott-Schottky analysis of sample S-0.4 was measured in 0.2 M Na2SO4 electrolyte. Figure 7c shows the Mott-Schottky plots, from which the flat potential Efb of sample S-0.4 was obtained. The flat band potential is negative compared to RHE, which may be due to the fact that it is likely to form oxides with a certain ordered arrangement under the external force of voltage. While the prepared pure Nb2O5 NAs had a wide band gap (Eg = 3.66 eV), the modified valence band potential is more advantageous to the utilization of photo-generated holes in photocatalytic degradation (Figure 7d) [41]. In addition, the degradation efficiency of the catalyst depends not only on the crystal phase and its relative crystallinity, but also on the molecular active components. As seen from the data in Table 2 and Figure 7b, catalyst with more active components and crystallinity has higher light absorption efficiency. It is an effective measure to prepare high-proportion oxides and specific crystal phases by adjusting the appropriate fluorine concentration and lower water content, which can provide more active sites for the degradation of organics.
To further explore the mechanism of photocatalytic degradation, the crystallinity and composition of Nb2O5 NA materials were analyzed with degradation efficiency. The results, shown in Figure 8, indicate that the crystallinity and composition of as-prepared catalyst are associated with the catalytic effect in terms of molecular structure. From the data in Table 2 and Figure 8, it can be obtained that catalysts with a larger positive proportion of oxides and higher relative crystallinity have a more advantageous utilization ratio of absorption and degradation in the photocatalytic reaction, due to the generation of more effective components. With similar relative crystallinity, Nb2O5 as the available active component in the molecular composition will more greatly promote the degradation efficiency, which is consistent with the results of the photocatalytic degradation efficiency of different catalysts. The ratio and combination of Nb2O5 and Nb(OH)5 in catalyst layers affect not only the crystallinity of catalysts, but also the degradation performance of photocatalysts. The high ratio of Nb2O5 and certain crystalline phase arrangements provide more active sites. A detailed study of the crystalline phase is significant to understand the mechanism of the photocatalytic properties of Nb2O5 NAs.

3. Materials and Methods

3.1. Synthesis of Nb2O5 Nanotube Arrays

Experimental procedures for the fabrication of niobium oxide nanotubes refer to other transition metal oxides [42], described in previous papers [43,44]. Niobium foil (100 × 100 × 0.25 mm, 99.99% purity; China New Materials Technology, Beijing, China) was cut into 1 cm × 1 cm pieces, cleaned with ethanol and deionized water in an ultrasonic bath for 5 min, and then air-dried to remove impurities on the surface. The pretreated niobium foil pieces were used as anode materials, acting as working electrodes in electrolytic cells. Meanwhile, Pt foil pieces were used as cathode materials, acting as opposite electrodes in the 2-electrode system. The entire electrochemical oxidation process was carried out in a Teflon beaker with a capacity of 100 mL. The electrolyte solution was prepared by NH4F (≥99.7%, AR; Shanghai Aladdin Bio-Chem Technology Co., LTD, Shanghai, China) and H2O (DI; homemade) and ethylene glycol (99+%, AR; Alfa Aesar Chemical Co., LTD., Shanghai, China) under stirring. The concentrations of NH4F containing ethylene glycol and H2O were readjusted in the range of 0–2% and 0.2–0.4 M, respectively. Anodic oxidation experiments were performed by using a power supply (Lp6003D, Lodestar, Shenzhen, China) in a range of no more than 36 V for 0–120 min. The oxide layers were rinsed several times with ethanol and deionized water to detach excess electrolyte and then air-dried overnight for subsequent characterization and performance testing.

3.2. Characterization of Catalysts

A field emission scanning electron microscope (FE-SEM; FEI Apreo, Hillsboro, OR, USA) was used for morphological characterization of the samples. The crystallographic structures were determined by x-ray diffraction (XRD; XD-6, Persee, Beijing, China) with graphite monochromatic Cu Kα radiation. A contact angle meter (DRS100, Kruss, Hamburg, Germany) was used to analyze the static contact angle between the anode material and the electrolyte at different moments. ICP-OES (Agilent–5100, Teledyne Leeman Labs, Hudson, NH, USA) was adopted to measure the concentration of niobium in electrolyte. A UV-Vis spectrophotometer (SPECORD 210 PLUS, Analytik Jena AG, Jena, Germany) was used to determine the absorbance of photodegraded samples at a wavelength of 554 nm, with an integral time of 0.2 s and 10 measurements. Attenuated total reflectance infrared (ATR-IR, Thermo Scientific Nicolet 6700, Waltham, MA, USA) spectra were obtained with a Thermo Scientific Nicolet 6700 instrument. UV-Vis diffuse reflectance absorbance spectra (DRS) were obtained with a UV-Vis spectrophotometer (UV-2550, Shimadzu, Kyoto, Japan) equipped with an integrated sphere using Nb foil as the reference and scanning in the range of 200–800 nm. Electrochemical measurements were performed on an AUTO-LAB workstation (SP300, Biologic, Seyssinet-Pariset, France) in a 3-electrode system, with the samples, platinum foil, and saturated Ag/AgCl electrodes as the working, counter, and reference electrodes, respectively. The measurements were performed in 0.2 M Na2SO4 at room temperature.

3.3. Photocatalysis Activity Test

Photocatalytic degradation of Rhodamine B (Rh B, 5 mg/L, Sinopharm Chemical Reagent Co., LTD., Shanghai, China) at room temperature (about 25 °C) was chosen as the proper conditions to test the activity of the as-prepared samples. Ultraviolet radiation by a 300 W xenon lamp (CEL-HXF-300, Beijing, China) as the light source was carried out. Before this, an as-prepared sample with a size of 1 × 1 cm2 was immersed in the 5 mg/L Rh B solution in dark for 30 min to saturate the photocatalyst with Rh B molecules. The distance between the sample and the lamp was 10 cm, and the average visible light intensity impacting the sample surface was 4 mW cm−2. The change of Rh B concentration with time was monitored using a UV-Vis spectrophotometer (UV-2550, Shimadzu, Kyoto, Japan).

4. Conclusions

In this work, the morphology and components of Nb2O5 NAs were effectively controlled by adjusting the anodic oxidation parameters. The precise growth mechanism of Nb2O5 NAs fabricated by anodic oxidation goes through the following steps: Rapid oxidation, further slow oxidation, competition between oxidation and corrosion, and dehydroxylation. The key in Nb2O5 NA formation is the electrolyte-contained free F under an electric field in the initial state model with a row of multiple horizontal points on the oxide surface. The performance of photocatalytic degradation of Nb2O5 NAs in various states was investigated to resolve its structural-activity relationship not only from the macro scale, but also from the deeper micro scale, indicating that the high proportion of oxides and crystalline Nb2O5 NAs was conducive to providing more active sites for the degradation of organic compounds. The results provide a substantial foundation for the preparation and potential application of niobium pentoxide semiconductor materials.

Supplementary Materials

The following are available online at https://www.mdpi.com/2073-4344/10/12/1480/s1, Figure S1: SEM images for the thickness of the oxide layer in stage II, Figure S2: High-resolution SEM images of the anodic oxide layers formed by anodization of Nb foils at 20V in the ethylene glycol electrolytes with the concentrations of NH4F at 0.25(a), 0.3(b), 0.35(c), and 0.4(d) M NH4F;and the water contents in 0.35 M NH4F at 0.5(e), 1.0(f) and 2(g) vol%, Figure S3: Standard curve of Rhodamine B solution, Figure S4: Rh B degradation by different samples under dark conditions and UV irradiation by 300 watts xenon lamp.

Author Contributions

Conceptualization, W.G., L.Y., J.L. and P.G.; methodology, W.G. and L.Y.; validation, W.G. and L.Y.; formal analysis, P.G.; investigation, W.L. and Z.F.; data curation, W.G. and J.L.; Writing—Original draft preparation, W.G.; Writing—Review and editing, L.Y.; supervision, L.Y. All authors have read and agreed to the published version of the manuscript.

Funding

This research was funded by Innovative Research Team of the Chinese University (IRT-17R81) and Innovative Research Team of Tianjin Municipal Education Commission (TD12-5004).

Acknowledgments

The authors greatly acknowledge Luo-fu Min and Yuexiao Song at Tianjin University for the contribution of the SEM and Diffuse reflectance UV-vis tests.

Conflicts of Interest

The authors declare no conflict of interest. The funders had no role in the design of the study; in the collection, analyses, or interpretation of data; in the writing of the manuscript, or in the decision to publish the results.

References

  1. Zhu, Y.; Chen, Z.; Gao, T.; Huang, Q.; Niu, F.; Qin, L.; Tang, P.; Huang, Y.; Sha, Z.; Wang, Y. Construction of hybrid Z-scheme Pt/CdS–TNTAs with enhanced visible-light photocatalytic performance. Appl. Catal. B Environ. 2015, 163, 16–22. [Google Scholar] [CrossRef]
  2. Yang, J.; Hao, J.; Xu, S.; Dai, J.; Wang, Y.; Pang, X. Visible-light-driven photocatalytic degradation of 4-CP and the synergistic reduction of Cr(VI) on one-pot synthesized amorphous Nb2O5 nanorods/graphene heterostructured composites. Chem. Eng. J. 2018, 353, 100–114. [Google Scholar] [CrossRef]
  3. Zhu, Y.; Wang, Y.; Chen, Z.; Qin, L.; Yang, L.; Zhu, L.; Tang, P.; Gao, T.; Huang, Y.; Sha, Z.; et al. Visible light induced photocatalysis on CdS quantum dots decorated TiO2 nanotube arrays. Appl. Catal. A Gen. 2015, 498, 159–166. [Google Scholar] [CrossRef]
  4. Lin, H.; Long, X.; Yang, S.; Zhou, D.; Yang, S. Three-Dimensional Decoupling Co-Catalyst from a Photoabsorbing Semiconductor as a New Strategy To Boost Photoelectrochemical Water Splitting. Nano Lett. 2018, 19, 455–460. [Google Scholar] [CrossRef] [PubMed]
  5. Ghicov, A.; Schmuki, P. Self-ordering electrochemistry: A review on growth and functionality of TiO2 nanotubes and other self-aligned MOx structures. Chem. Commun. 2009, 20, 2791–2808. [Google Scholar] [CrossRef]
  6. Zhang, N.; Quan, Q.; Qi, M.-Y.; Tang, Z.-R.; Xu, Y.-J. Hierarchically tailorable double-array film hybrids with enhanced photocatalytic and photoelectrochemical performances. Appl. Catal. B Environ. 2019, 259, 118086. [Google Scholar] [CrossRef]
  7. Furukawa, S.; Ohno, Y.; Shishido, T.; Teramura, K.; Tanaka, T. Selective Amine Oxidation Using Nb2O5 Photocatalyst and O2. ACS Catal. 2011, 1, 1150–1153. [Google Scholar] [CrossRef]
  8. Rao, W.-F.; Zhang, Y.; Wang, Z.; Yu, Q.; Yang, Y. Electric switching process of aligned Nb2O5 nanorods arrays. Mater. Lett. 2018, 211, 168–170. [Google Scholar] [CrossRef]
  9. Maček, M.; Orel, B. Electrochromism of sol–gel derived niobium oxide films. Sol. Energy Mater. Sol. Cells 1998, 54, 121–130. [Google Scholar] [CrossRef] [Green Version]
  10. Mozalev, A.; Sakairi, M.; Saeki, I.; Takahashi, H. Nucleation and growth of the nanostructured anodic oxides on tantalum and niobium under the porous alumina film. Electrochim. Acta 2003, 48, 3155–3170. [Google Scholar] [CrossRef]
  11. Aagard, R.L. Optical waveguide characteristics of reactive dc-sputtered niobium pentoxide films. Appl. Phys. Lett. 1975, 27, 605–607. [Google Scholar] [CrossRef]
  12. Karlinsey, R.L. Preparation of self-organized niobium oxide microstructures via potentiostatic anodization. Electrochem. Commun. 2005, 7, 1190–1194. [Google Scholar] [CrossRef]
  13. Yang, M.; Zhao, X.; Zheng, S.; Liu, X.; Jin, B.; Li, H.; Gan, Y. A new electrochemical platform for ultrasensitive detection of atrazine based on modified self-ordered Nb2O5 nanotube arrays. J. Electroanal. Chem. 2017, 791, 17–22. [Google Scholar] [CrossRef]
  14. Liu, X.; Zheng, R.; Yuan, R.; Peng, L.; Liu, Y.; Lin, J. Released Defective Nb2O5with Optimized Solar Photocatalytic Activity. ECS J. Solid State Sci. Technol. 2017, 6, P665–P670. [Google Scholar] [CrossRef]
  15. Wen, H.; Liu, Z.; Wang, J.; Yang, Q.; Li, Y.; Yu, J. Facile synthesis of Nb2O5 nanorod array films and their electrochemical properties. Appl. Surf. Sci. 2011, 257, 10084–10088. [Google Scholar] [CrossRef]
  16. Shi, C.; Xiang, K.; Zhu, Y.; Zhou, W.; Chen, X.; Chen, H. Box-implanted Nb2O5 nanorods as superior anode materials in lithium ion batteries. Ceram. Int. 2017, 43, 12388–12395. [Google Scholar] [CrossRef]
  17. Lucas-Granados, B.; Sánchez-Tovar, R.; Fernández-Domene, R.M.; Estívalis-Martínez, J.M.; García-Antón, J. How does anodization time affect morphological and photocatalytic properties of iron oxide nanostructures? J. Mater. Sci. Technol. 2020, 38, 159–169. [Google Scholar] [CrossRef]
  18. Guan, D.; Wang, Y. Synthesis and growth mechanism of multilayer TiO2 nanotube arrays. Nanoscale 2012, 4, 2968–2977. [Google Scholar] [CrossRef]
  19. Guan, D.; Hymel, P.J.; Wang, Y. Growth mechanism and morphology control of double-layer and bamboo-type TiO2 nanotube arrays by anodic oxidation. Electrochim. Acta 2012, 83, 420–429. [Google Scholar] [CrossRef]
  20. Kumaravel, V.; Mathew, S.; Bartlett, J.; Pillai, S.C. Photocatalytic hydrogen production using metal doped TiO2: A review of recent advances. Appl. Catal. B Environ. 2019, 244, 1021–1064. [Google Scholar] [CrossRef]
  21. Xu, X.; Fang, X.; Zhai, T.; Zeng, H.; Liu, B.; Hu, X.; Bando, Y.; Golberg, D.V. Tube-in-Tube TiO2 Nanotubes with Porous Walls: Fabrication, Formation Mechanism, and Photocatalytic Properties. Small 2010, 7, 445–449. [Google Scholar] [CrossRef] [PubMed]
  22. Wei, W.; Macak, J.M.; Schmuki, P. High aspect ratio ordered nanoporous Ta2O5 films by anodization of Ta. Electrochem. Commun. 2008, 10, 428–432. [Google Scholar] [CrossRef]
  23. Guo, L.; Zhao, J.; Wang, X.; Xu, R.; Li, Y. Synthesis and growth mechanism of zirconia nanotubes by anodization in electrolyte containing Cl. J. Solid State Electrochem. 2008, 13, 1321–1326. [Google Scholar] [CrossRef]
  24. O’Sullivan, J.P.; Wood, G.C. The morphology and mechanism of formation of porous anodic films on aluminium. Proc. R. Soc. London. Ser. A. Math. Phys. Sci. 1970, 317, 511–543. [Google Scholar] [CrossRef]
  25. Macak, J.M.; Tsuchiya, H.; Ghicov, A.; Yasuda, K.; Hahn, R.; Bauer, S.; Schmuki, P. TiO2 nanotubes: Self-organized electrochemical formation, properties and applications. Curr. Opin. Solid State Mat. Sci. 2007, 11, 3–18. [Google Scholar] [CrossRef]
  26. Su, Z.; Zhou, W.; Jiang, F.; Hong, M. Anodic formation of nanoporous and nanotubular metal oxides. J. Mater. Chem. 2012, 22, 535–544. [Google Scholar] [CrossRef]
  27. Garcia-Vergara, S.; Skeldon, P.; Thompson, G.; Habazaki, H. A flow model of porous anodic film growth on aluminium. Electrochim. Acta 2006, 52, 681–687. [Google Scholar] [CrossRef]
  28. Garcia-Vergara, S.; Iglesias-Rubianes, L.; Blanco-Pinzon, C.; Skeldon, P.; Thompson, G.; Campestrini, P. Mechanical instability and pore generation in anodic alumina. Proc. R. Soc. A Math. Phys. Eng. Sci. 2006, 462, 2345–2358. [Google Scholar] [CrossRef]
  29. Garcia-Vergara, S.; Habazaki, H.; Skeldon, P.; Thompson, G. Tracer studies relating to alloying element behaviour in porous anodic alumina formed in phosphoric acid. Electrochim. Acta 2010, 55, 3175–3184. [Google Scholar] [CrossRef]
  30. Lee, W.; Schwirn, K.; Steinhart, M.; Pippel, E.; Scholz, R.; Gösele, U. Structural engineering of nanoporous anodic aluminium oxide by pulse anodization of aluminium. Nat. Nanotechnol. 2008, 3, 234–239. [Google Scholar] [CrossRef]
  31. Li, G.-Z.; Tang, H.-P.; Zhang, W.-Y.; Li, G.; Yu, L.-L.; Li, Y.-N. Fabrication of multilayer Nb2O5 nanoporous film by anodization of niobium foils. Rare Met. 2013, 34, 77–80. [Google Scholar] [CrossRef]
  32. Zhao, J.; Wang, X.; Xu, R.; Mi, Y.; Li, Y. Preparation and Growth Mechanism of Niobium Oxide Microcones by the Anodization Method. Electrochem. Solid State Lett. 2007, 10, C31–C33. [Google Scholar] [CrossRef]
  33. Wei, M.; Qi, Z.-M.; Ichihara, M.; Zhou, H. Synthesis of single-crystal niobium pentoxide nanobelts. Acta Mater. 2008, 56, 2488–2494. [Google Scholar] [CrossRef]
  34. Sieber, I.; Hildebrand, H.; Friedrich, A.; Schmuki, P. Formation of self-organized niobium porous oxide on niobium. Electrochem. Commun. 2005, 7, 97–100. [Google Scholar] [CrossRef]
  35. Upadhyay, K.K.; Cha, G.; Hildebrand, H.; Schmuki, P.; Silva, T.M.; Montemor, M.F.; Altomare, M. Capacitance response in an aqueous electrolyte of Nb2O5 nanochannel layers anodically grown in pure molten σ-H3PO4. Electrochim. Acta 2018, 281, 725–737. [Google Scholar] [CrossRef]
  36. Nakajima, K.; Baba, Y.; Noma, R.; Kitano, M.; Kondo, J.N.; Hayashi, S.; Hara, M. Nb2O5·nH2O as a Heterogeneous Catalyst with Water-Tolerant Lewis Acid Sites. J. Am. Chem. Soc. 2011, 133, 4224–4227. [Google Scholar] [CrossRef]
  37. Jin, X.; Liu, C.; Xu, J.; Wang, Q.; Chen, D. Size-controlled synthesis of mesoporous Nb2O5 microspheres for dye sensitized solar cells. RSC Adv. 2014, 4, 35546–35553. [Google Scholar] [CrossRef]
  38. Amaravathy, P.; Sowndarya, S.; Sathyanarayanan, S.; Rajendran, N. Novel sol gel coating of Nb2O5 on magnesium alloy for biomedical applications. Surf. Coatings Technol. 2014, 244, 131–141. [Google Scholar] [CrossRef]
  39. Tsuchiya, H.; Macak, J.M.; Sieber, I.; Schmuki, P. Self-Organized High-Aspect-Ratio Nanoporous Zirconium Oxides Prepared by Electrochemical Anodization. Small 2005, 1, 722–725. [Google Scholar] [CrossRef]
  40. Karlinsey, R.L. Self-assembled Nb2O5 microcones with tailored crystallinity. J. Mater. Sci. 2006, 41, 5017–5020. [Google Scholar] [CrossRef]
  41. Preethi, L.K.; Antony, R.P.; Mathews, T.; Walczak, L.; Gopinath, C.S. A Study on Doped Heterojunctions in TiO2 Nanotubes: An Efficient Photocatalyst for Solar Water Splitting. Sci. Rep. 2017, 7, 14314. [Google Scholar] [CrossRef] [PubMed] [Green Version]
  42. Paulose, M.; Shankar, K.; Yoriya, S.; Prakasam, H.E.; Varghese, O.K.; Mor, G.K.; LaTempa, T.A.; Fitzgerald, A.; Grimes, C.A. Anodic Growth of Highly Ordered TiO2 Nanotube Arrays to 134 μm in Length. J. Phys. Chem. B 2006, 110, 16179–16184. [Google Scholar] [CrossRef] [PubMed]
  43. Galstyan, V.; Comini, E.; Faglia, G.; Sberveglieri, G. Synthesis of self-ordered and well-aligned Nb2O5 nanotubes. CrystEngComm 2014, 16, 10273–10279. [Google Scholar] [CrossRef]
  44. Wei, W.; Lee, K.; Shaw, S.; Schmuki, P. Anodic formation of high aspect ratio, self-ordered Nb2O5 nanotubes. Chem. Commun. 2012, 48, 4244–4246. [Google Scholar] [CrossRef] [PubMed]
Figure 1. Schematic diagram of self-aligned process of niobium pentoxide nanotube arrays (NAs) by electrochemical anodization.
Catalysts 10 01480 g001
Figure 2. I-t curve during anodization of Nb in 0.4 M NH4F containing glycerol electrolytes at 20 V.
Catalysts 10 01480 g002
Figure 3. Surface images and corresponding contact angles of Nb2O5 NAs anodized at different times during electrochemical oxidation: (a,b) 60 s; (c,d) 300 s; (e,f) 1800 s; (g,h) 7200 s under anodic voltage of 20 V.
Catalysts 10 01480 g003
Figure 4. (a) Growth patterns for oxide layer thickness and anodic oxidation time in stage II. (b) Trend chart of pH and Nb5+ concentration of electrolyte in stage III. (c) ATR-IR spectra of Nb2O5 NAs. Experimental conditions: 0.4 M NH4F electrolyte containing glycol electrolyte at 20 V.
Catalysts 10 01480 g004
Figure 5. High-resolution SEM images and corresponding internal diameters of anodic oxide layers formed by anodization of Nb foils at 20 V in ethylene glycol electrolytes with (a) concentration of NH4F, (b) water content, (c) ATR-IR spectra, and (d) XRD patterns of samples prepared under different conditions. Preparation conditions: Oxidized at 20 V in 2 h; samples S-0.25, S-0.35, and S-0.4 were prepared in electrolytes only containing ethylene glycol with fluoride ion concentration at 0.25, 0.35, and 0.4 M NH4F; samples S-0.35/0.5 and S-0.35/2 were formed with water content in 0.35 M NH4F at 0.5 and 2 vol%, respectively.
Catalysts 10 01480 g005
Figure 6. Cross-sectional image of Nb2O5 NAs.
Catalysts 10 01480 g006
Figure 7. (a) Photocatalytic degradation of Rhodamine B (Rh B) in as-prepared Nb2O5 NA samples in different conditions under UV light irradiation. (b) Diffuse reflectance UV-vis spectra of as-prepared anodic oxides. (c) Mott Schottky plots of sample S-0.4 synthesized in 0.4 M NH4F solution containing glycol electrolyte at 20 V. (d) Schematic diagram of Nb2O5 NA band structure.
Catalysts 10 01480 g007
Figure 8. Effect of (a) composition and (b) crystallinity of Nb2O5 NA samples on degradation efficiency.
Catalysts 10 01480 g008
Table 1. Parameters from ATR-IR spectrum at different times.
IntensityINb(OH)5INb2O5INb2O5/INb(OH)5
Time (s)
270029.14 32.88 1.13
360019.71 32.68 1.66
480022.89 38.38 1.68
600018.30 34.52 1.89
720018.09 42.54 2.35
Table 2. Characteristic parameters of as-prepared samples after 2 h of electrooxidation at 20 V.
No.Internal Diameter (nm)INb2O5/INb(OH)5Crystallinity (%)
S-0.2518.962.1581.39
S-0.35/0.521.002.0280.24
S-0.3523.002.3086.59
S-0.35/225.441.6961.72
S-0.437.312.1185.88
Publisher’s Note: MDPI stays neutral with regard to jurisdictional claims in published maps and institutional affiliations.

