Article

Photocatalytic Transformation of Triclosan. Reaction Products and Kinetics

by
Sophie Schröder
,
Mª-Fresnedo San-Román
* and
Inmaculada Ortiz
Departamento de Ingenierías Química y Biomolecular, ETSIIyT, Universidad de Cantabria, Avda. de los Castros, 39005 Santander, Spain
*
Author to whom correspondence should be addressed.
Catalysts 2020, 10(12), 1468; https://doi.org/10.3390/catal10121468
Submission received: 20 November 2020 / Revised: 10 December 2020 / Accepted: 14 December 2020 / Published: 16 December 2020
(This article belongs to the Special Issue Green Catalysts: Application to Waste and Groundwater Treatment)

Abstract

:
5-Chloro-2-[2,4-dichlorophenoxy]-phenol, or triclosan (TCS), is an antimicrobial and antifungal agent with high resistance to conventional wastewater treatments, thus, more effective remediation technologies are necessary, where photocatalytic processes deserve special attention due to the high degradation rates of TCS, and the use of a renewable source of energy. However, different by-products may be formed during the treatment, sometimes more harmful than the parent compounds. Efforts to detail reaction pathways continually feed into related literature; however, knowing the transformation kinetics and the dependence on the operating variables is essential for the correct design of the abovementioned remediation technologies. This work contributes to increasing the knowledge necessary for the application of photocatalytic processes for the degradation of emerging pollutants, with TCS as a case study. First, an experimental plan to analyze the influence of the operating variables was carried out, determining time courses of the parent and intermediate compounds. Next, the kinetic model and parameters that are capable of predicting TCS concentration and its derivatives as a function of the operating conditions are provided. This constitutes a very useful tool to predict the performance of wastewater remediation treatment both in the degradation of the original pollutant and in the reduction of the toxicity in the treated water.

Graphical Abstract

1. Introduction

Over the past decades, the world population has experienced significant growth, resulting in the increase in domestic and industrial activities that have, as a consequence, a great increment in the consumption of freshwater. This leads to a rise in the discharge of wastewaters containing a variety of unregulated pollutants, causing disastrous effects in the environment [1]. Urban wastewaters contain increasing concentrations of pharmaceutical and personal care products (PPCPs), characterized by their broad use, with a steady and daily increase. 5-Chloro-2-[2,4-dichlorophenoxy]-phenol, better known as triclosan (TCS), belongs to this group; it is used as an antimicrobial and antifungal agent and is present in different consumer goods (toothpaste, hand wash, hand sanitizers, toys, etc.) [2]. TCS is resistant to biodegradation and is environmentally persistent; it presents severe toxicity and relatively high lipophilicity [3,4]. This substance can remain in the environment for a long time and can be retained in sediments [5], sewage sludge [6] or indoor dust [7,8]. Moreover, it has been detected in the influent [9] and even in the effluent [10,11] of various municipal wastewater treatment plants (WWTPs), because of the low effectiveness of conventional wastewater treatments [12,13,14]. As a result, it has been found both in natural and drinking water [15,16]. Consequently, TCS ends up in aquatic organisms, which belong to the basic diet for human beings, finally entering the human body, e.g., tissues, skin, and it has even been detected in human breast milk [17,18]. TCS is related to various human health issues; furthermore, it has been defined as endocrine disruptor [19,20]. These characteristics have led to its partial prohibition in many countries, such as Canada [21], a complete ban in over-the-counter (OTC) consumer antiseptic wash products, such as liquid/foam/gel hand soaps or body washes in the Federal Rule 84 FR 14847 by the U.S. Food and Drug Administration (USFDA) [22] or disapproval for use in human hygiene biocidal products by the EU [23].
Thus, developing cost-effective remediation technologies that prevent the presence of this pollutant in natural resources constitutes a techno-scientific challenge. Advanced oxidation processes (AOPs) came out as a set of alternative technologies to provide effective solutions to the degradation of persistent and emerging pollutants [2,24,25,26,27,28]. With regard to TCS degradation, photolytic treatments, photolysis and photocatalysis, have attracted the interest of the scientific community. Photocatalysis takes place when a semiconductor, the photocatalyst, absorbs photons that possess equal or higher energy than the photocatalyst band gap, generating electron–hole pairs (e and h+, respectively) on the catalyst surface [29]. These react with H2O producing reactive oxygen species, ROS, responsible of the cleavage and consecutive changes of the molecule of interest [24,30,31].
When AOPs are applied to aqueous media containing organic compounds, the oxidation pathway goes through the formation of a number of intermediate compounds, which often tend to be more stable, and thus, more resistant to degradation. Moreover, these intermediates are sometimes more toxic than the parent compounds. Regarding the photocatalytic oxidation of TCS, the group of chlorophenols (CPs) containing highly toxic, bio-cumulative and scarcely biodegradable compounds appears to be present in most of the reported reaction pathways. Together with 2,4-dichlorophenol and other phenols, 2,8-dichlorodibenzo-p-dioxin, 4-chlorocatechol and diverse TCS derivatives have been detected during TCS photodegradation [32]. 2-Chlorophenol, 2,4-dichlorophenol, 2,4-6-trichlorophenol and pentachlorophenol were indexed in the priority pollutant list by the European Commission [33] and the USEPA’s Clean Water Act [34].
In order to move photocatalysis to a harmless and green remediation technology for emerging pollutants such as TCS, a thorough understanding of the reaction pathway leading to the end products, as well as the kinetics of the entire process, becomes necessary. Most works to date have deepened the kinetics of the degradation of the parent compound and only a few provide kinetic constants; but a kinetic study of the formation of intermediate derivatives is still lacking [35,36,37]. Thus, the aim of this work is to contribute to increasing the knowledge of the application of remediation technologies that prevent the contamination of natural waters with emerging pollutants. More specifically, the kinetic model and parameters of the photocatalytic remediation of TCS-polluted waters are reported as a case study that provides methodological insight, which is useful to predict the performance of remediation technologies.

2. Results and Discussion

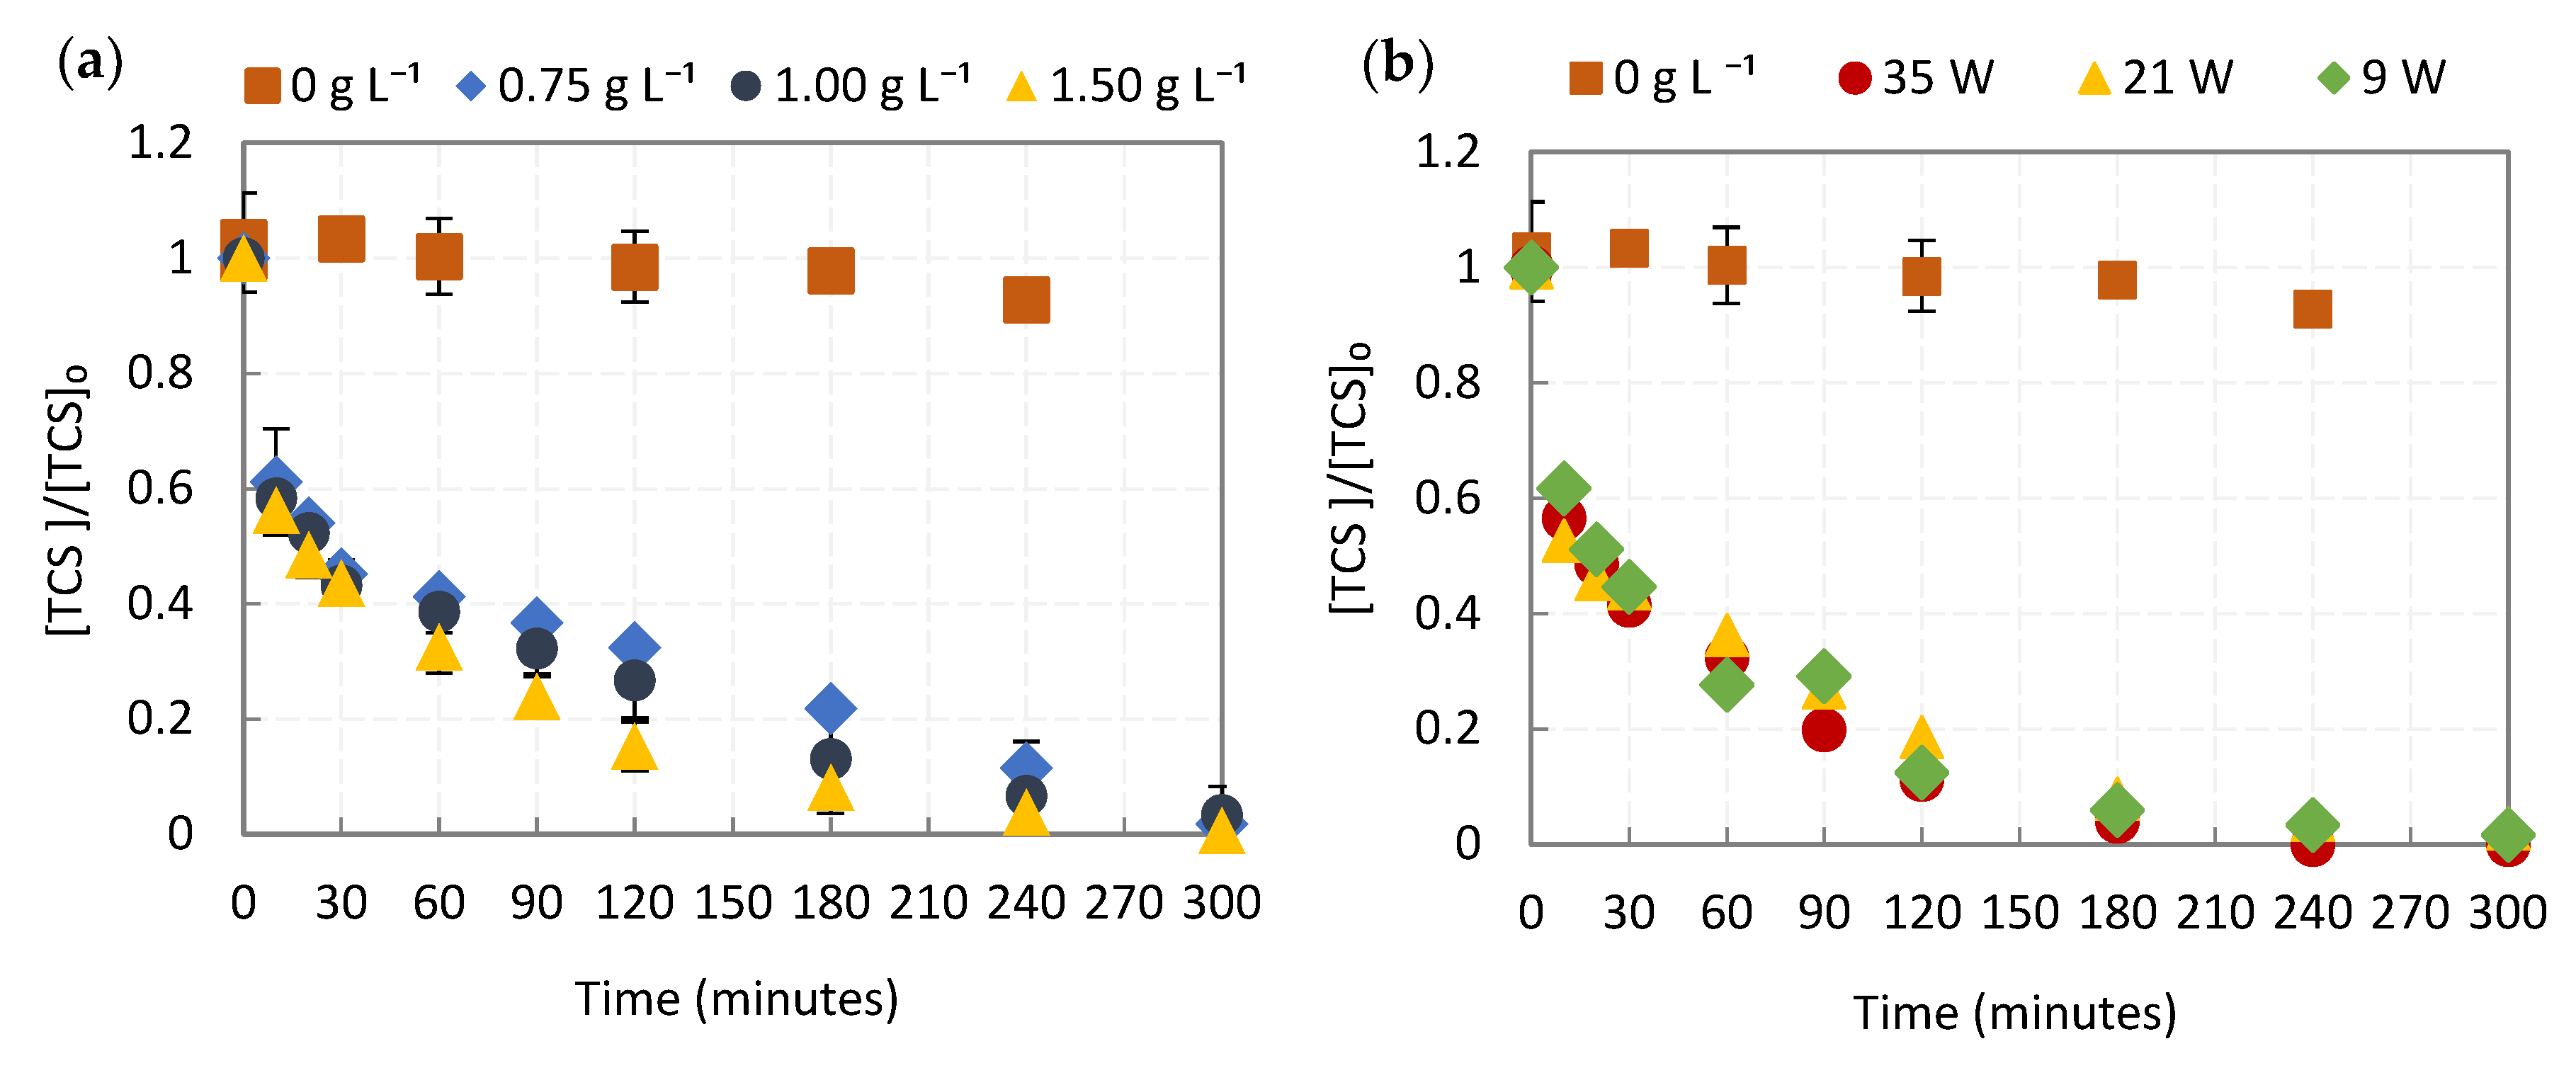
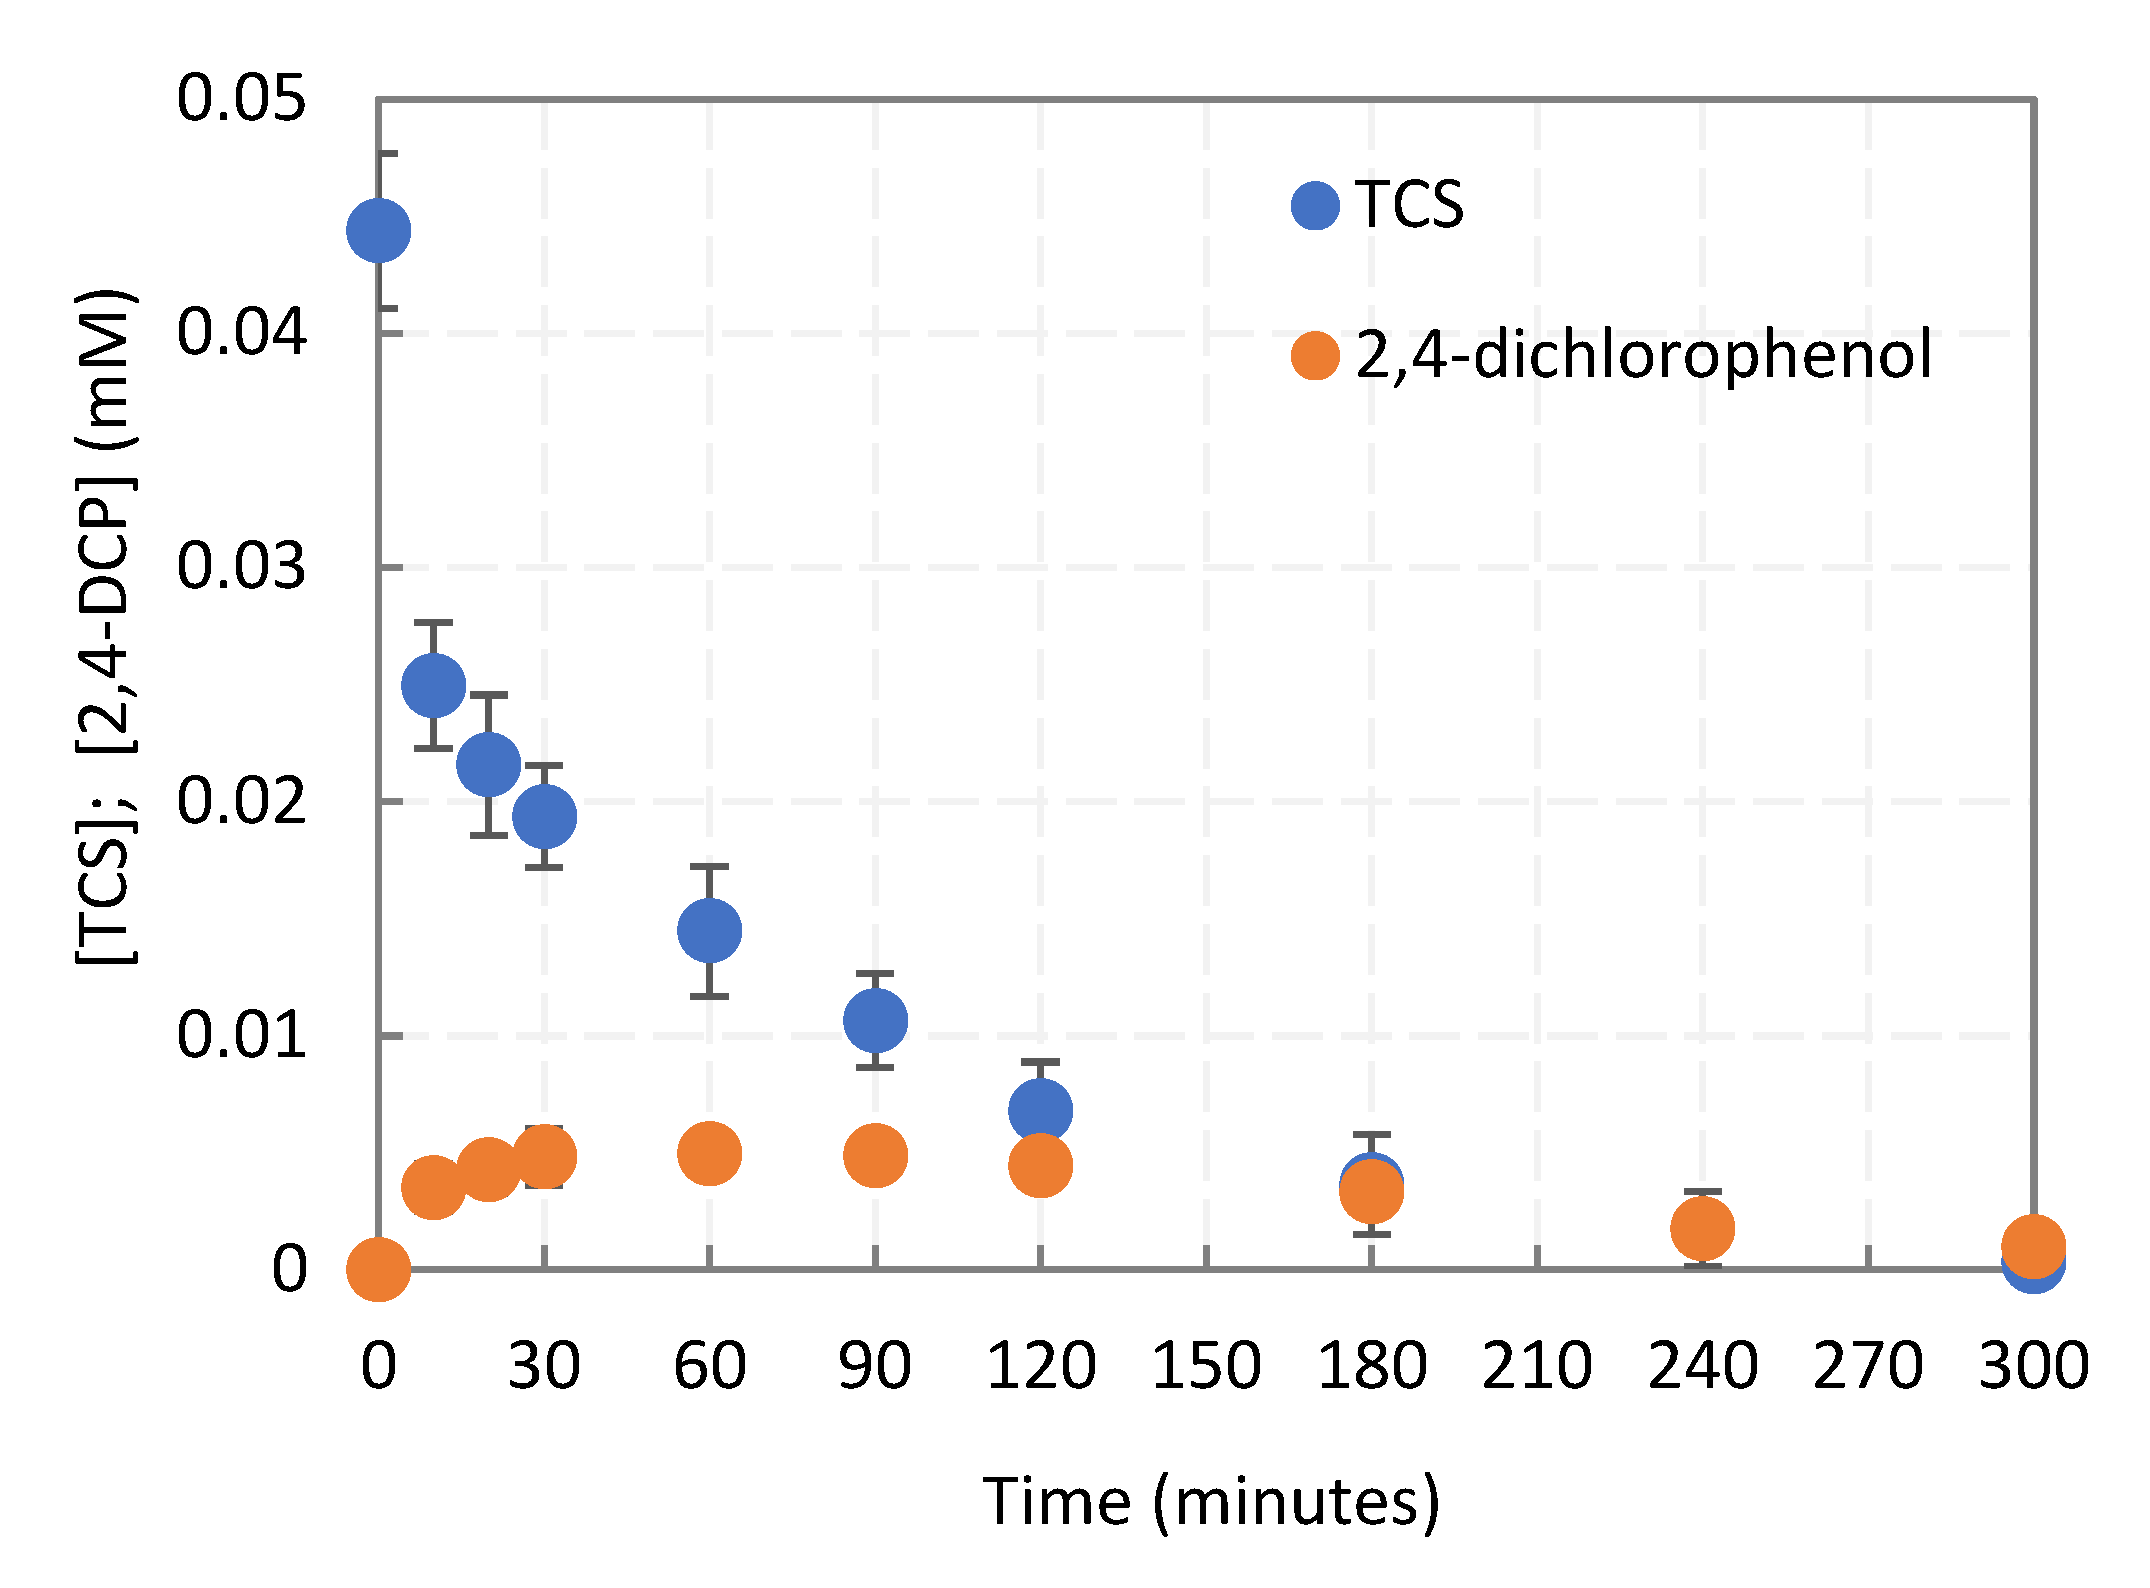
2.1. Degradation Kinetics of the Parent (TCS) Compound

An experimental plan was carried out to analyze the influence of the main process variables, i.e., catalyst loading and light power, on the rate of the disappearance of TCS and the formation of intermediate derivatives. First, the adsorption of TCS on the TiO2 surface was studied in experiments carried out at pH 5.8 for 4 h in the dark, observing negligible adsorption. In these conditions, TCS is in a neutral form (pH < pKa), so it is neutral–positively charged (TCS pKa = 7.9–8.1). TiO2 is positively charged because the pZc value is below the solution pH (pZc = 6.25); therefore, the adsorption and desorption properties of TiO2 may be affected by this attribute [36,38]. Then, due to the repulsion forces between TCS and TiO2, the adsorption is negligible.
Figure 1a shows time courses of TCS concentration under different TiO2 doses, using UV-A LEDs. First, an experiment without catalyst was carried out, and as can be observed, almost no degradation of triclosan was produced. Moreover, no influence in TCS degradation was found within the studied range of TiO2 concentrations. Experimental data are represented together with error bars, which were obtained after replication of the experiments. Figure 1b shows the change in TCS concentration for different values of light power, again with a very small influence of this variable. By working at the maximum power at which TCS is not degraded by photolysis (35 W), we guarantee working with the maximum photon flux.

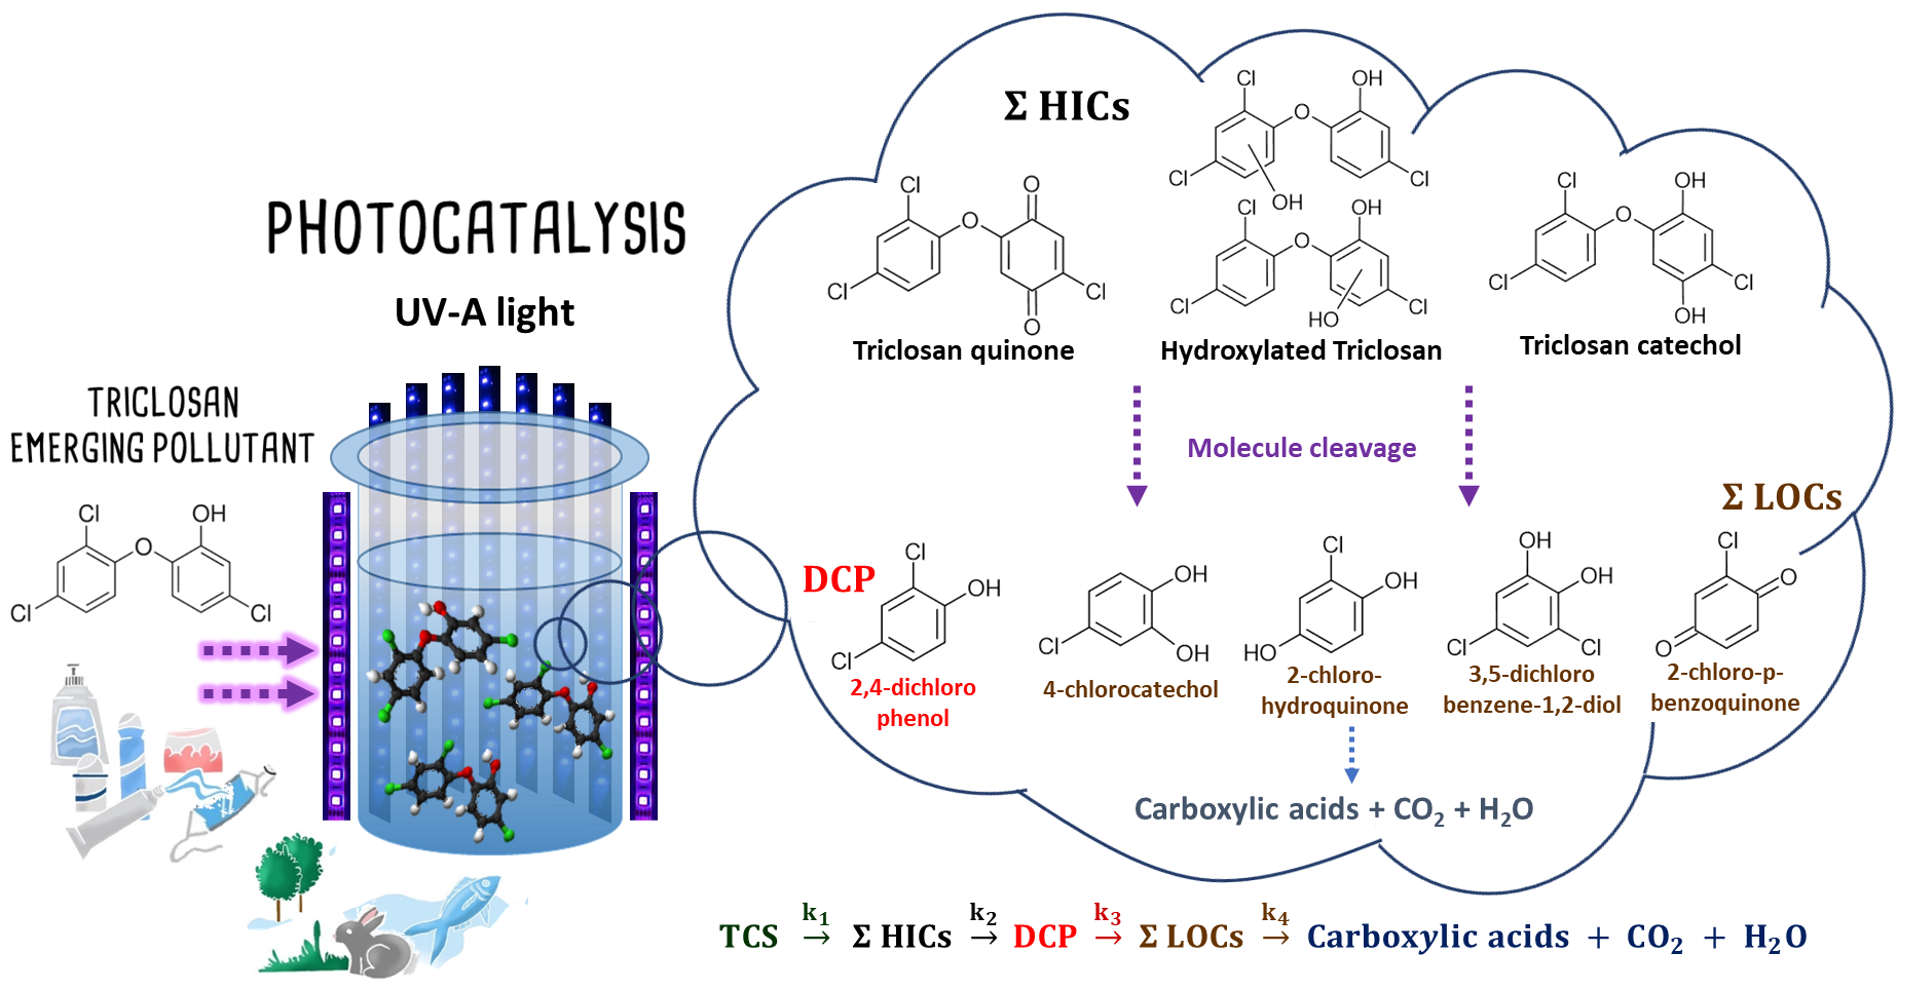
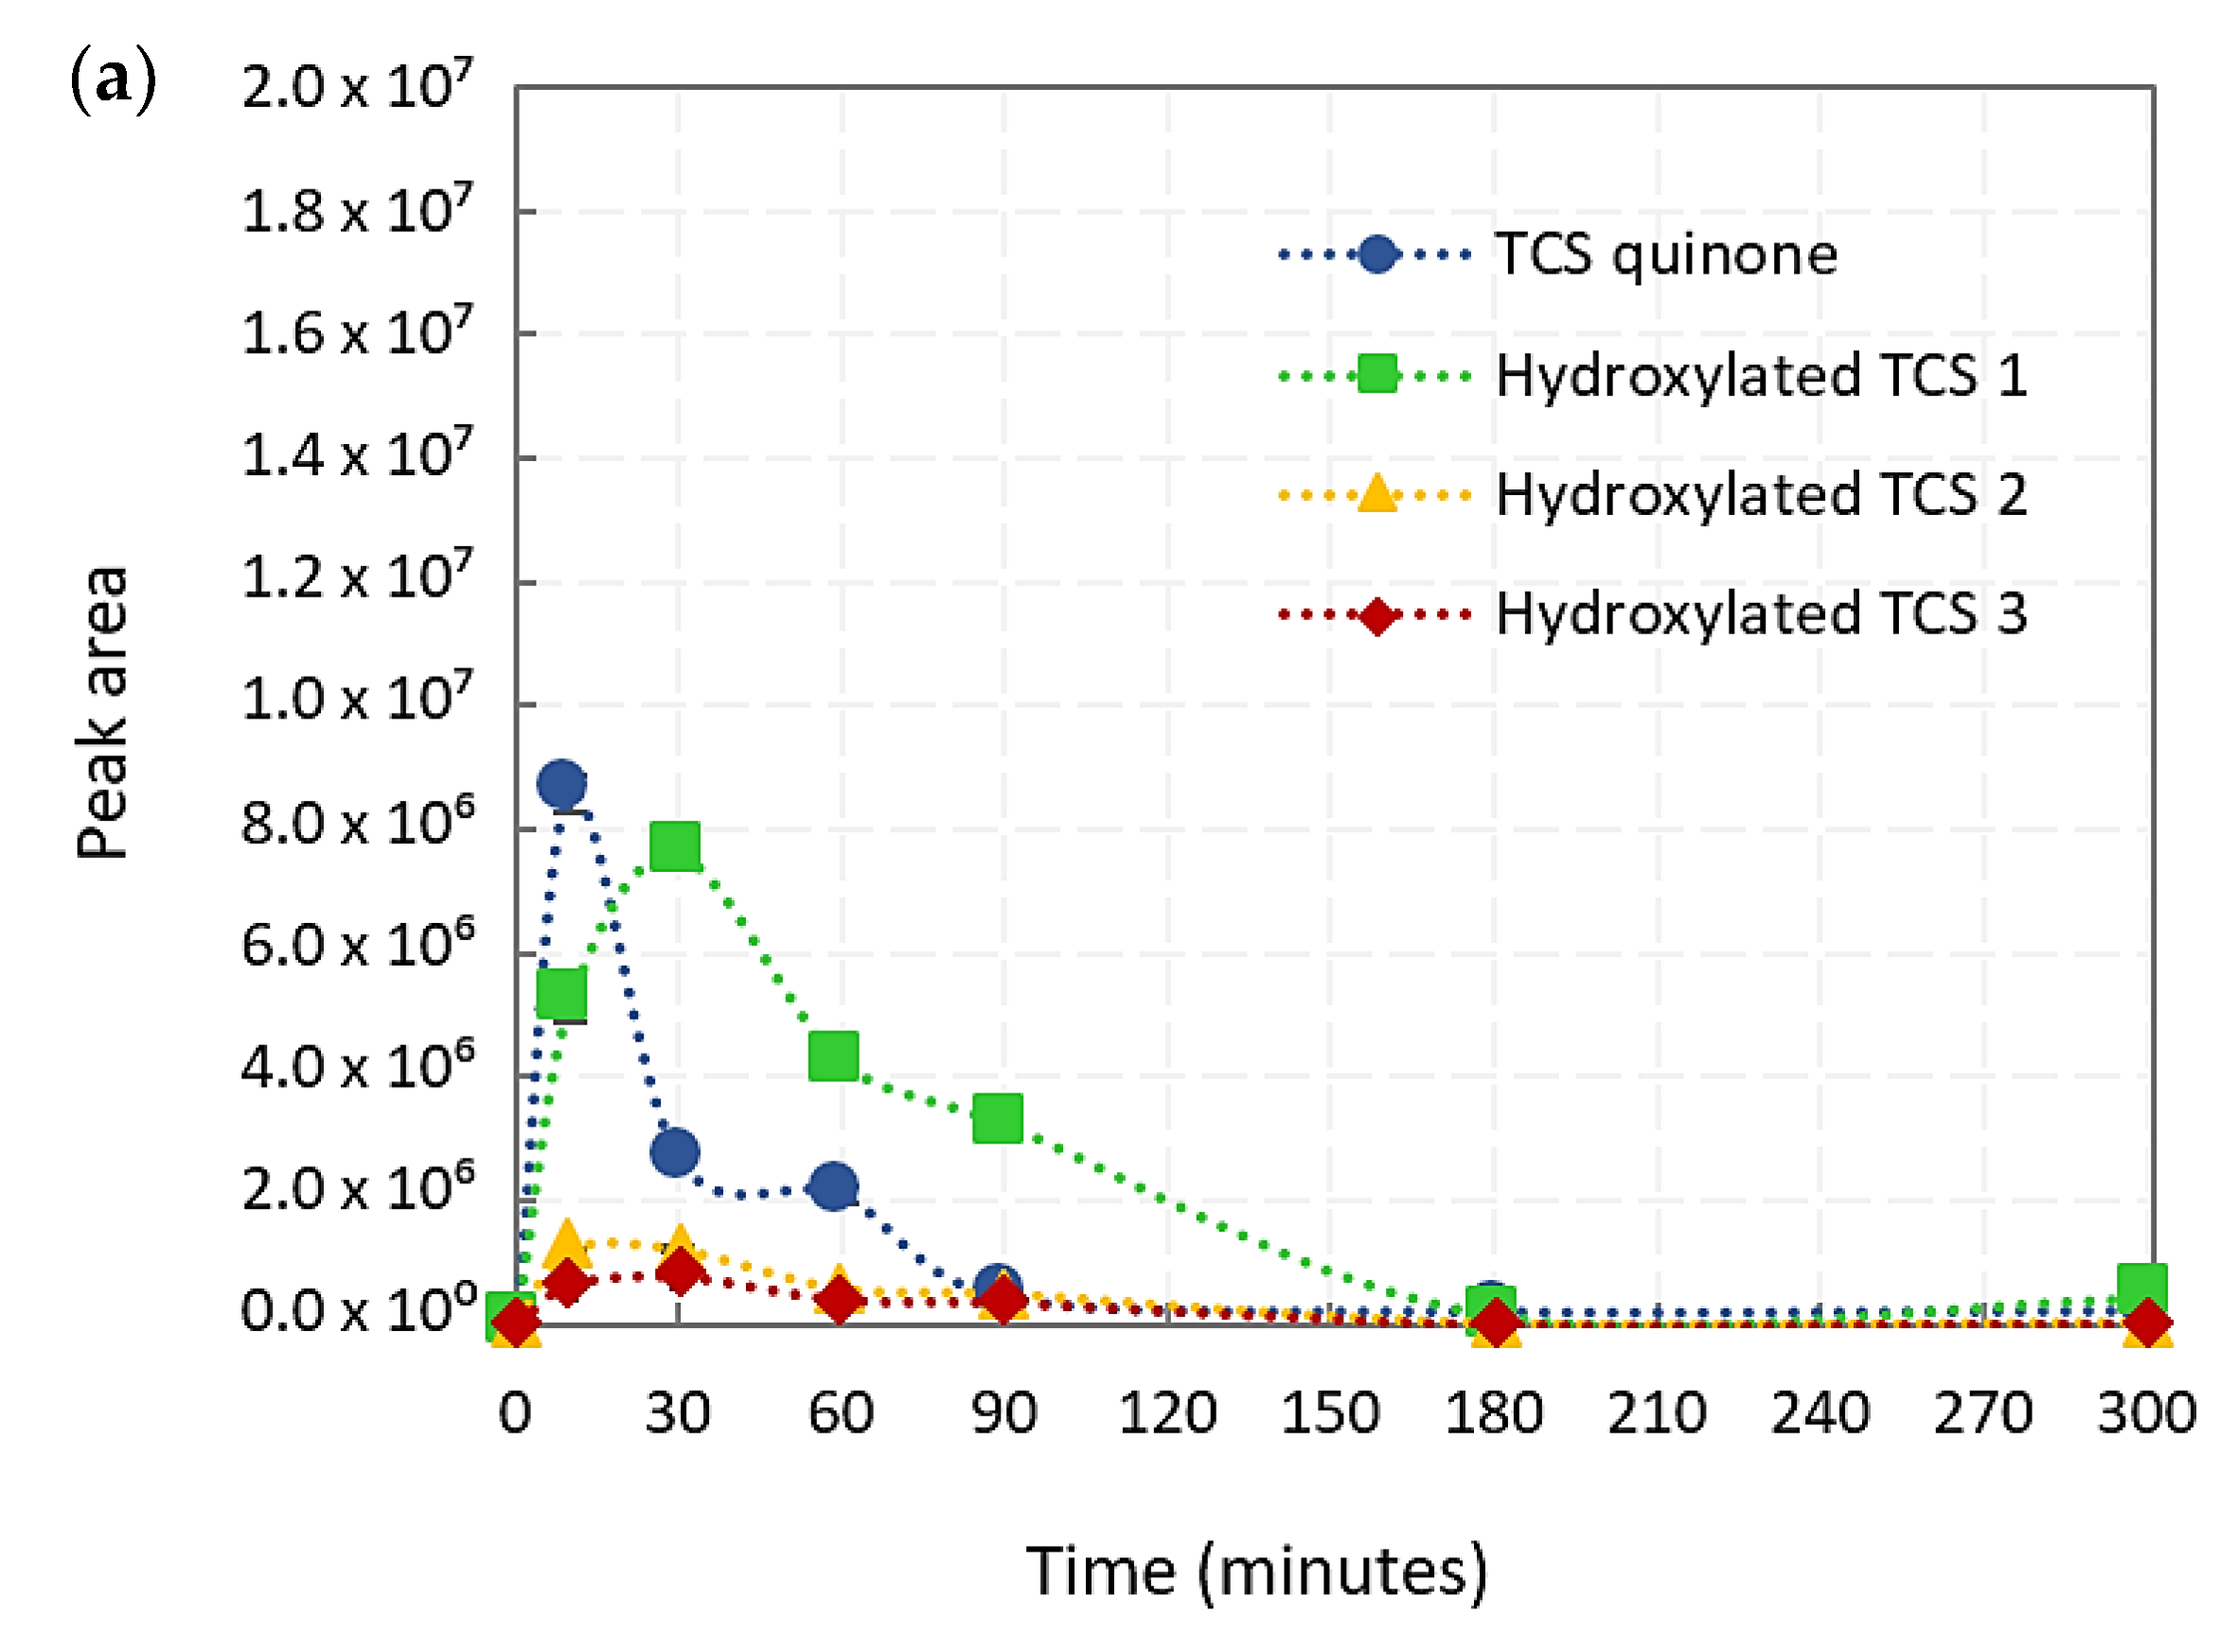
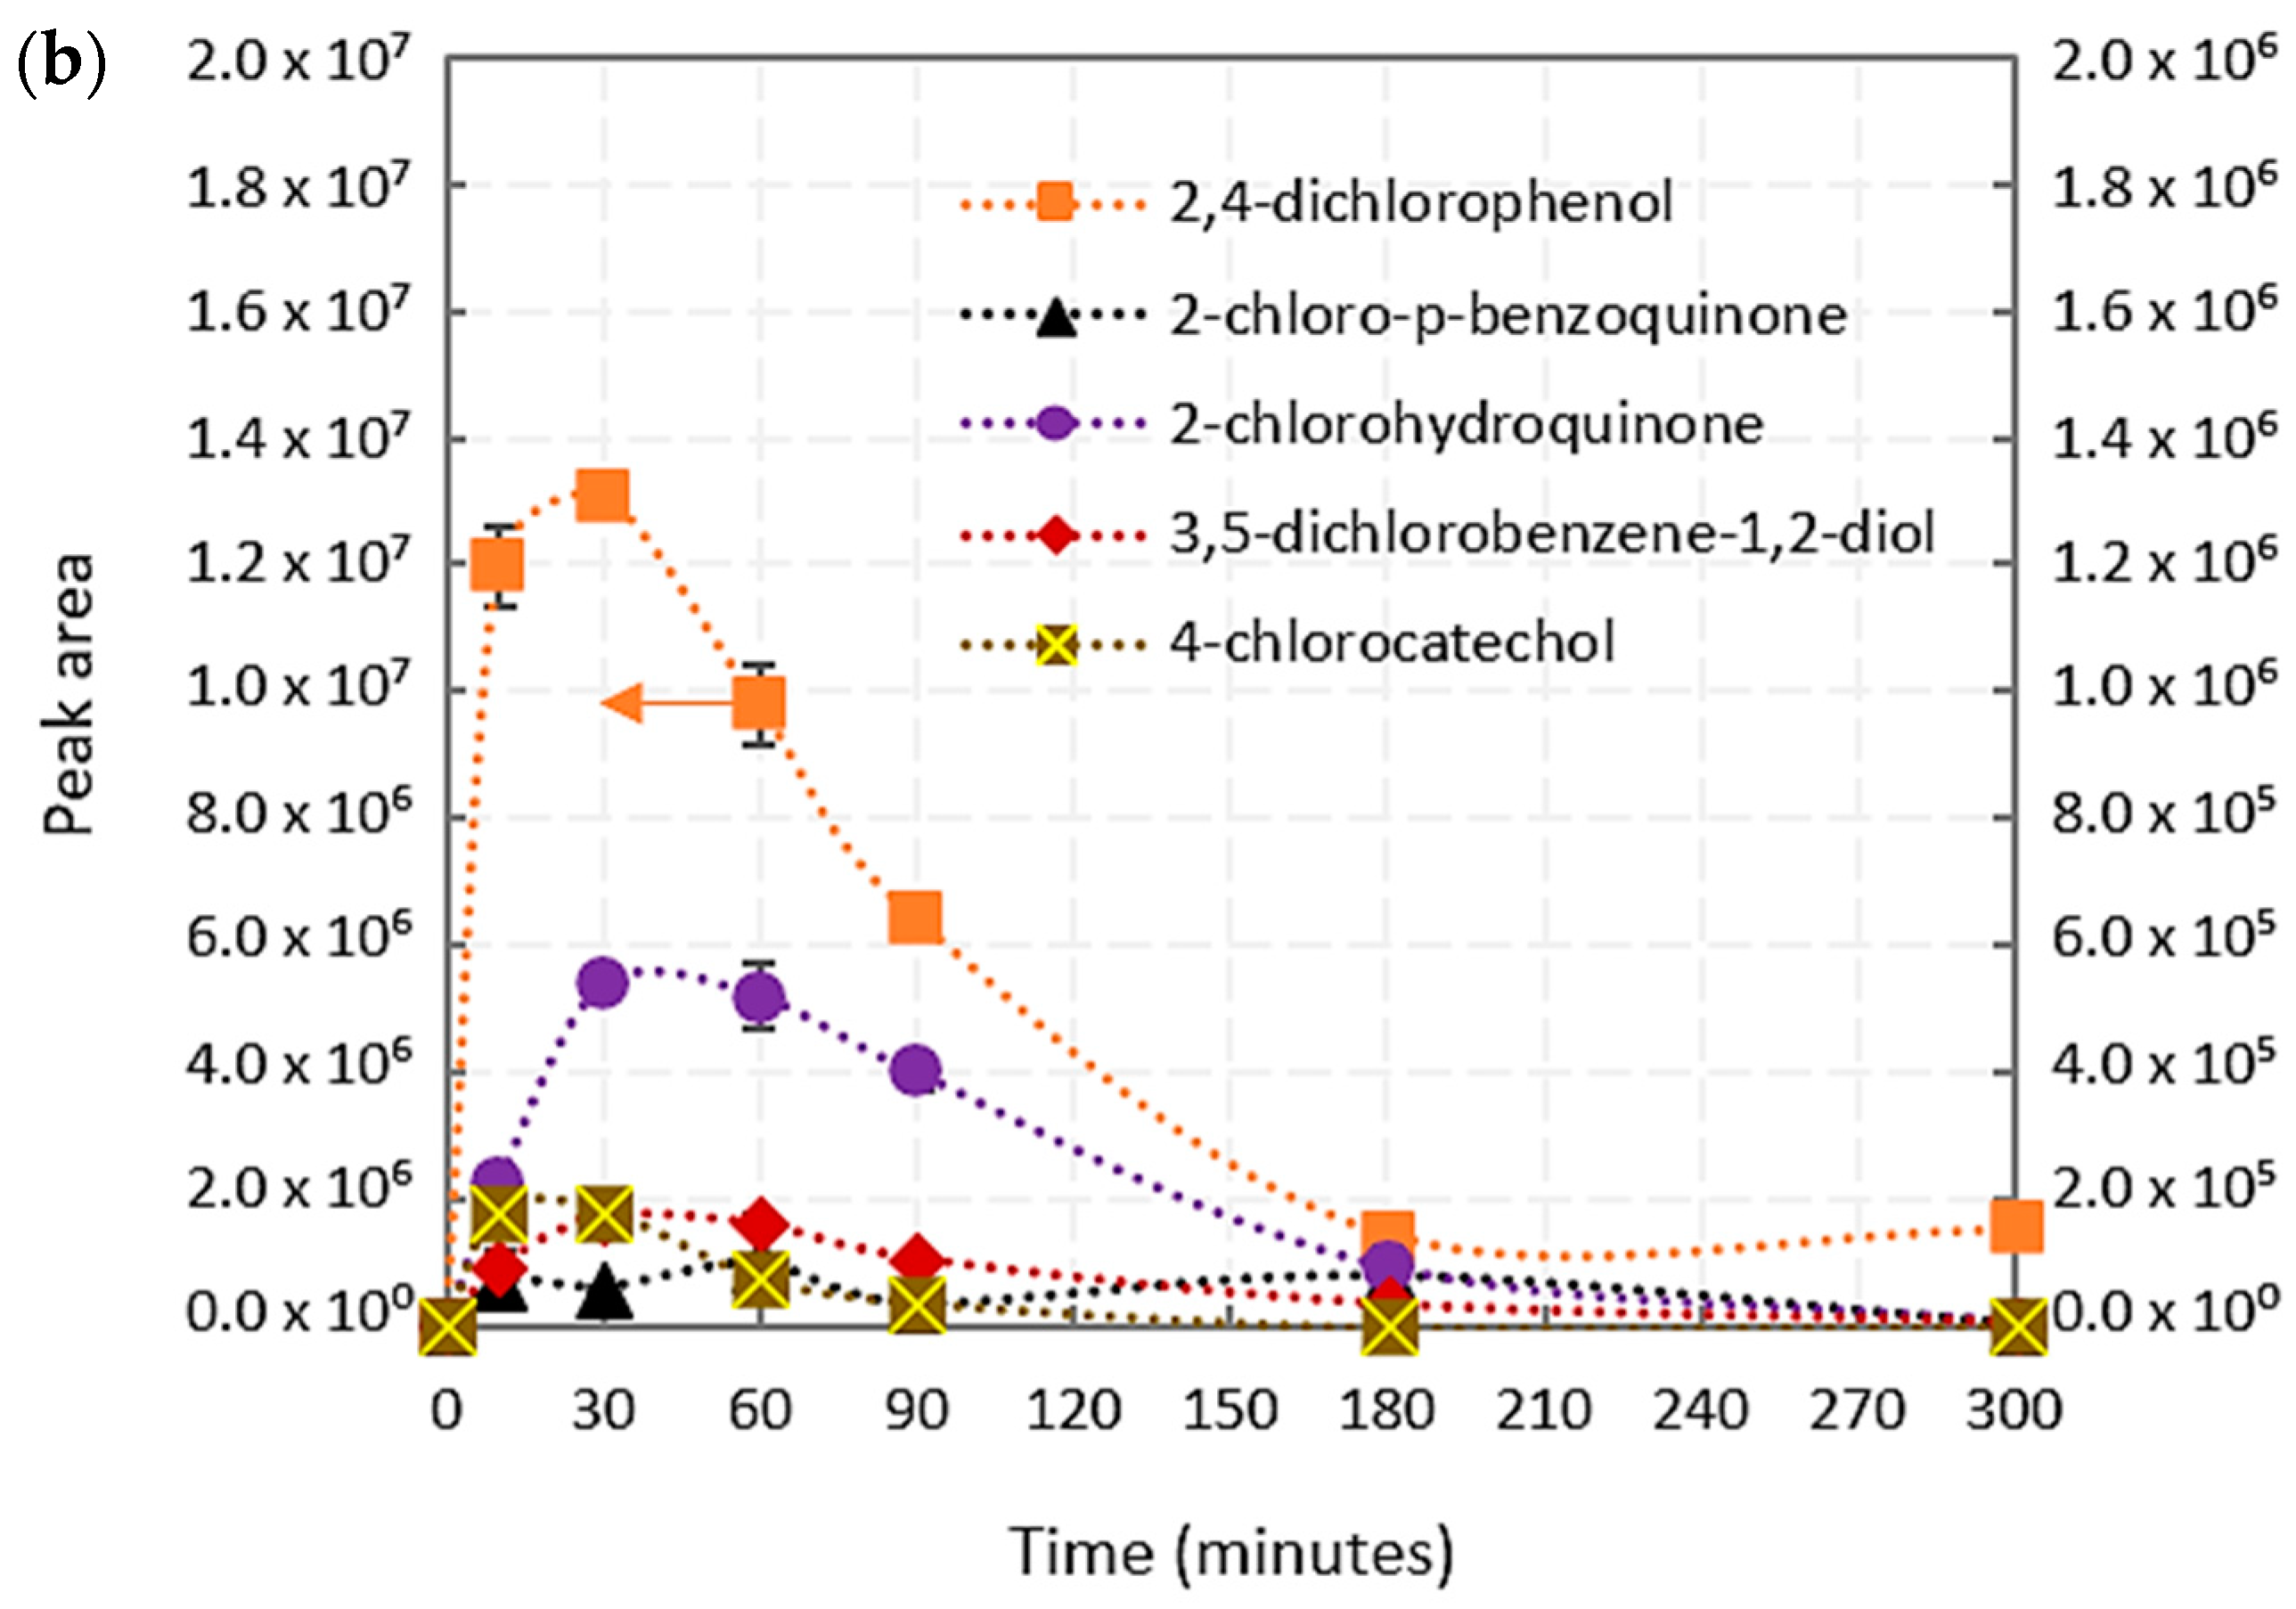
2.1.1. TCS Intermediate Derivatives

The intermediate derivatives identified in this work have been classified in two main groups, higher concentration compounds, HICs, and lower concentration compounds, LOCs, according to the measured area. HICs were formed from a small modification of the TCS molecule, whereas LOCs were produced by the cleavage of the TCS molecule. Table 1 shows the identified compounds with their retention time and characteristic ions. The corresponding mass spectra of HICs are shown in Figure S1, Supplementary Materials.
Within HICs, a set of four compounds were identified and corroborated with the bibliography, which were named TCS derivatives (Table 1, Nos. 1–4). The first one is the TCS quinone (No. 1), with mass spectra and characteristic ions in good agreement with the works of Yu et al. and Zhang and Huang [39,40]. The other three compounds belong to the group named hydroxylated TCS, whose main difference lies in the position where the OH radical was added to a carbon atom of the TCS molecule [37]. It is hard to know the position in the ring where the OH was added, so generic representations of these molecules are depicted in Table 1 (Nos. 2–4). Sankoda et al. [41] established that there are six feasible positions where OH radicals can be added to the molecule to generate six hydroxylated derivatives. OH radicals possess a strong electrophilic character and have a tendency to attack the carbon atoms with the highest electron density, so OH radical preferentially attacks the chlorophenolic ring, producing hydroxylated TCS 1 [37,40,41]. Hydroxylated TCS 2 and 3 were produced when OH was added to the non-phenolic ring [37]. The similarity between the mass spectra of hydroxylated TCS 2 and 3 is noticeable. However, the small existing differences, such as the mass fragments with high molecular weight and the relative abundance of the molecular ion and fragment ions, suggest that they are different molecules. TCS quinone and the different hydroxylated TCS were not authenticated due to the commercial unavailability of standard compounds. Finally, LOCs such as chloro-aromatic derivatives 2-chloro-p-benzoquinone, 2,4-dichlorophenol, 2-chlorohydroquinone, 3,5-dichlorobenzene-1,2-diol and 4-chlorocatechol were identified by GC-MS using the NIST08 library.

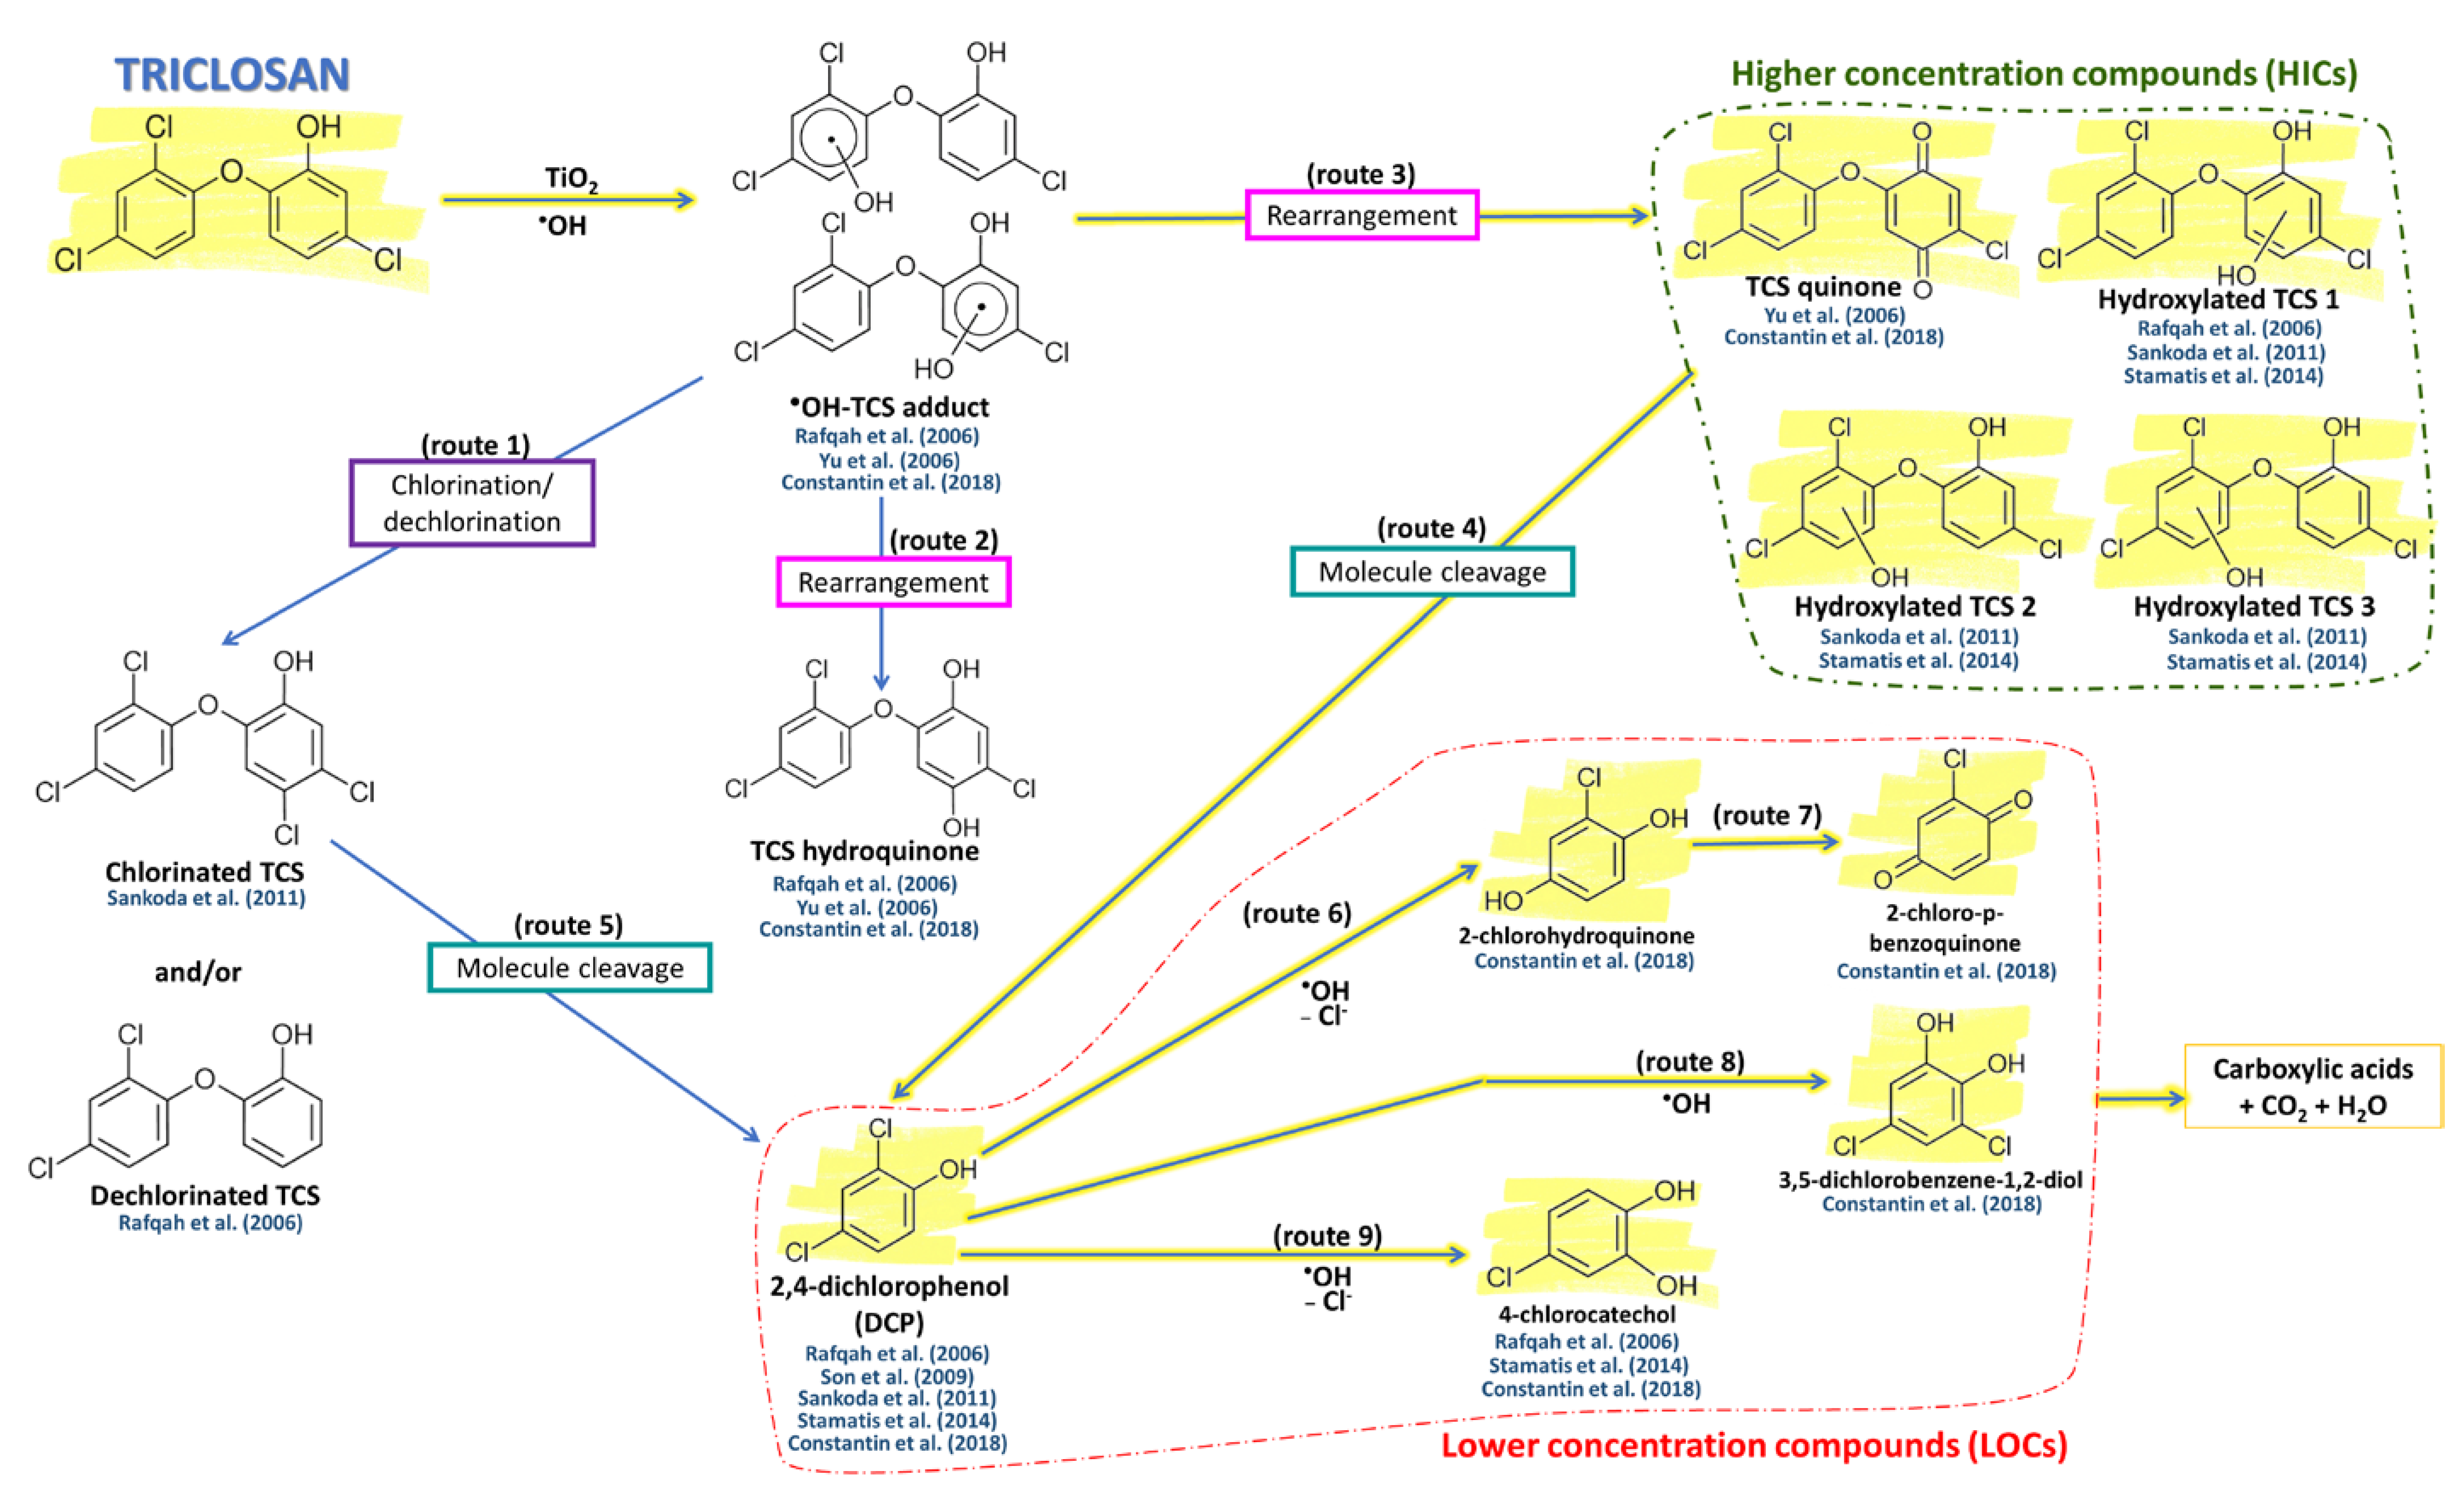
2.1.2. TCS Degradation Pathways

In order to understand the degradation pathway of the photocatalytic transformation of triclosan, a mechanism was proposed based on our experimental results and previous literature reports (Figure 2) [32,35,36,37,39,41,42]. The first step in TCS decomposition could generate TCS derivatives through chlorination and dechlorination mechanisms (route 1, chlorinated TCS and/or dechlorinated TCS) or the rearrangement of the molecule (route 2, TCS hydroquinone and route 3, TCS quinone, hydroxylated TCS 1, hydroxylated TCS 2 and hydroxylated TCS 3). These were formed due to the OH-TCS adduct, produced immediately after the attack of OH radicals, and as a consequence of its instability, it ends up in a semi-quinone radical, which leads to the formation of different TCS derivatives [35,39,42]. Generally, this is followed by the cleavage of the molecule, producing different phenolic compounds, such as 2,4-dichlorophenol, among others (routes 4 and 5). 2,4-Dichlorophenol gives rise to 2-chlorohydroquinone, through the loss of a chlorine atom and OH addition (route 6), and then it transforms into 2-chloro-p-benzoquinone (route 7). Moreover, 2,4-dichlorophenol generates 3,5-dichlorobenzene-1,2-diol through OH addition (route 8) and 4-chlorocatechol, also through the loss of a chlorine atom and OH addition (route 9). Finally, these molecules are broken, giving smaller products such as carboxylic acids. Chlorinated TCS and dechlorinated TCS, depicted in Figure 2, are represented as generic molecules. Chlorinated TCS with four or five chlorine atoms can be named as tetraclosan or pentaclosan. In the same way, dechlorinated TCS can appear in different forms, depending where the atoms are placed [41,42]. Compounds detected in this work have been marked in yellow in Figure 2.

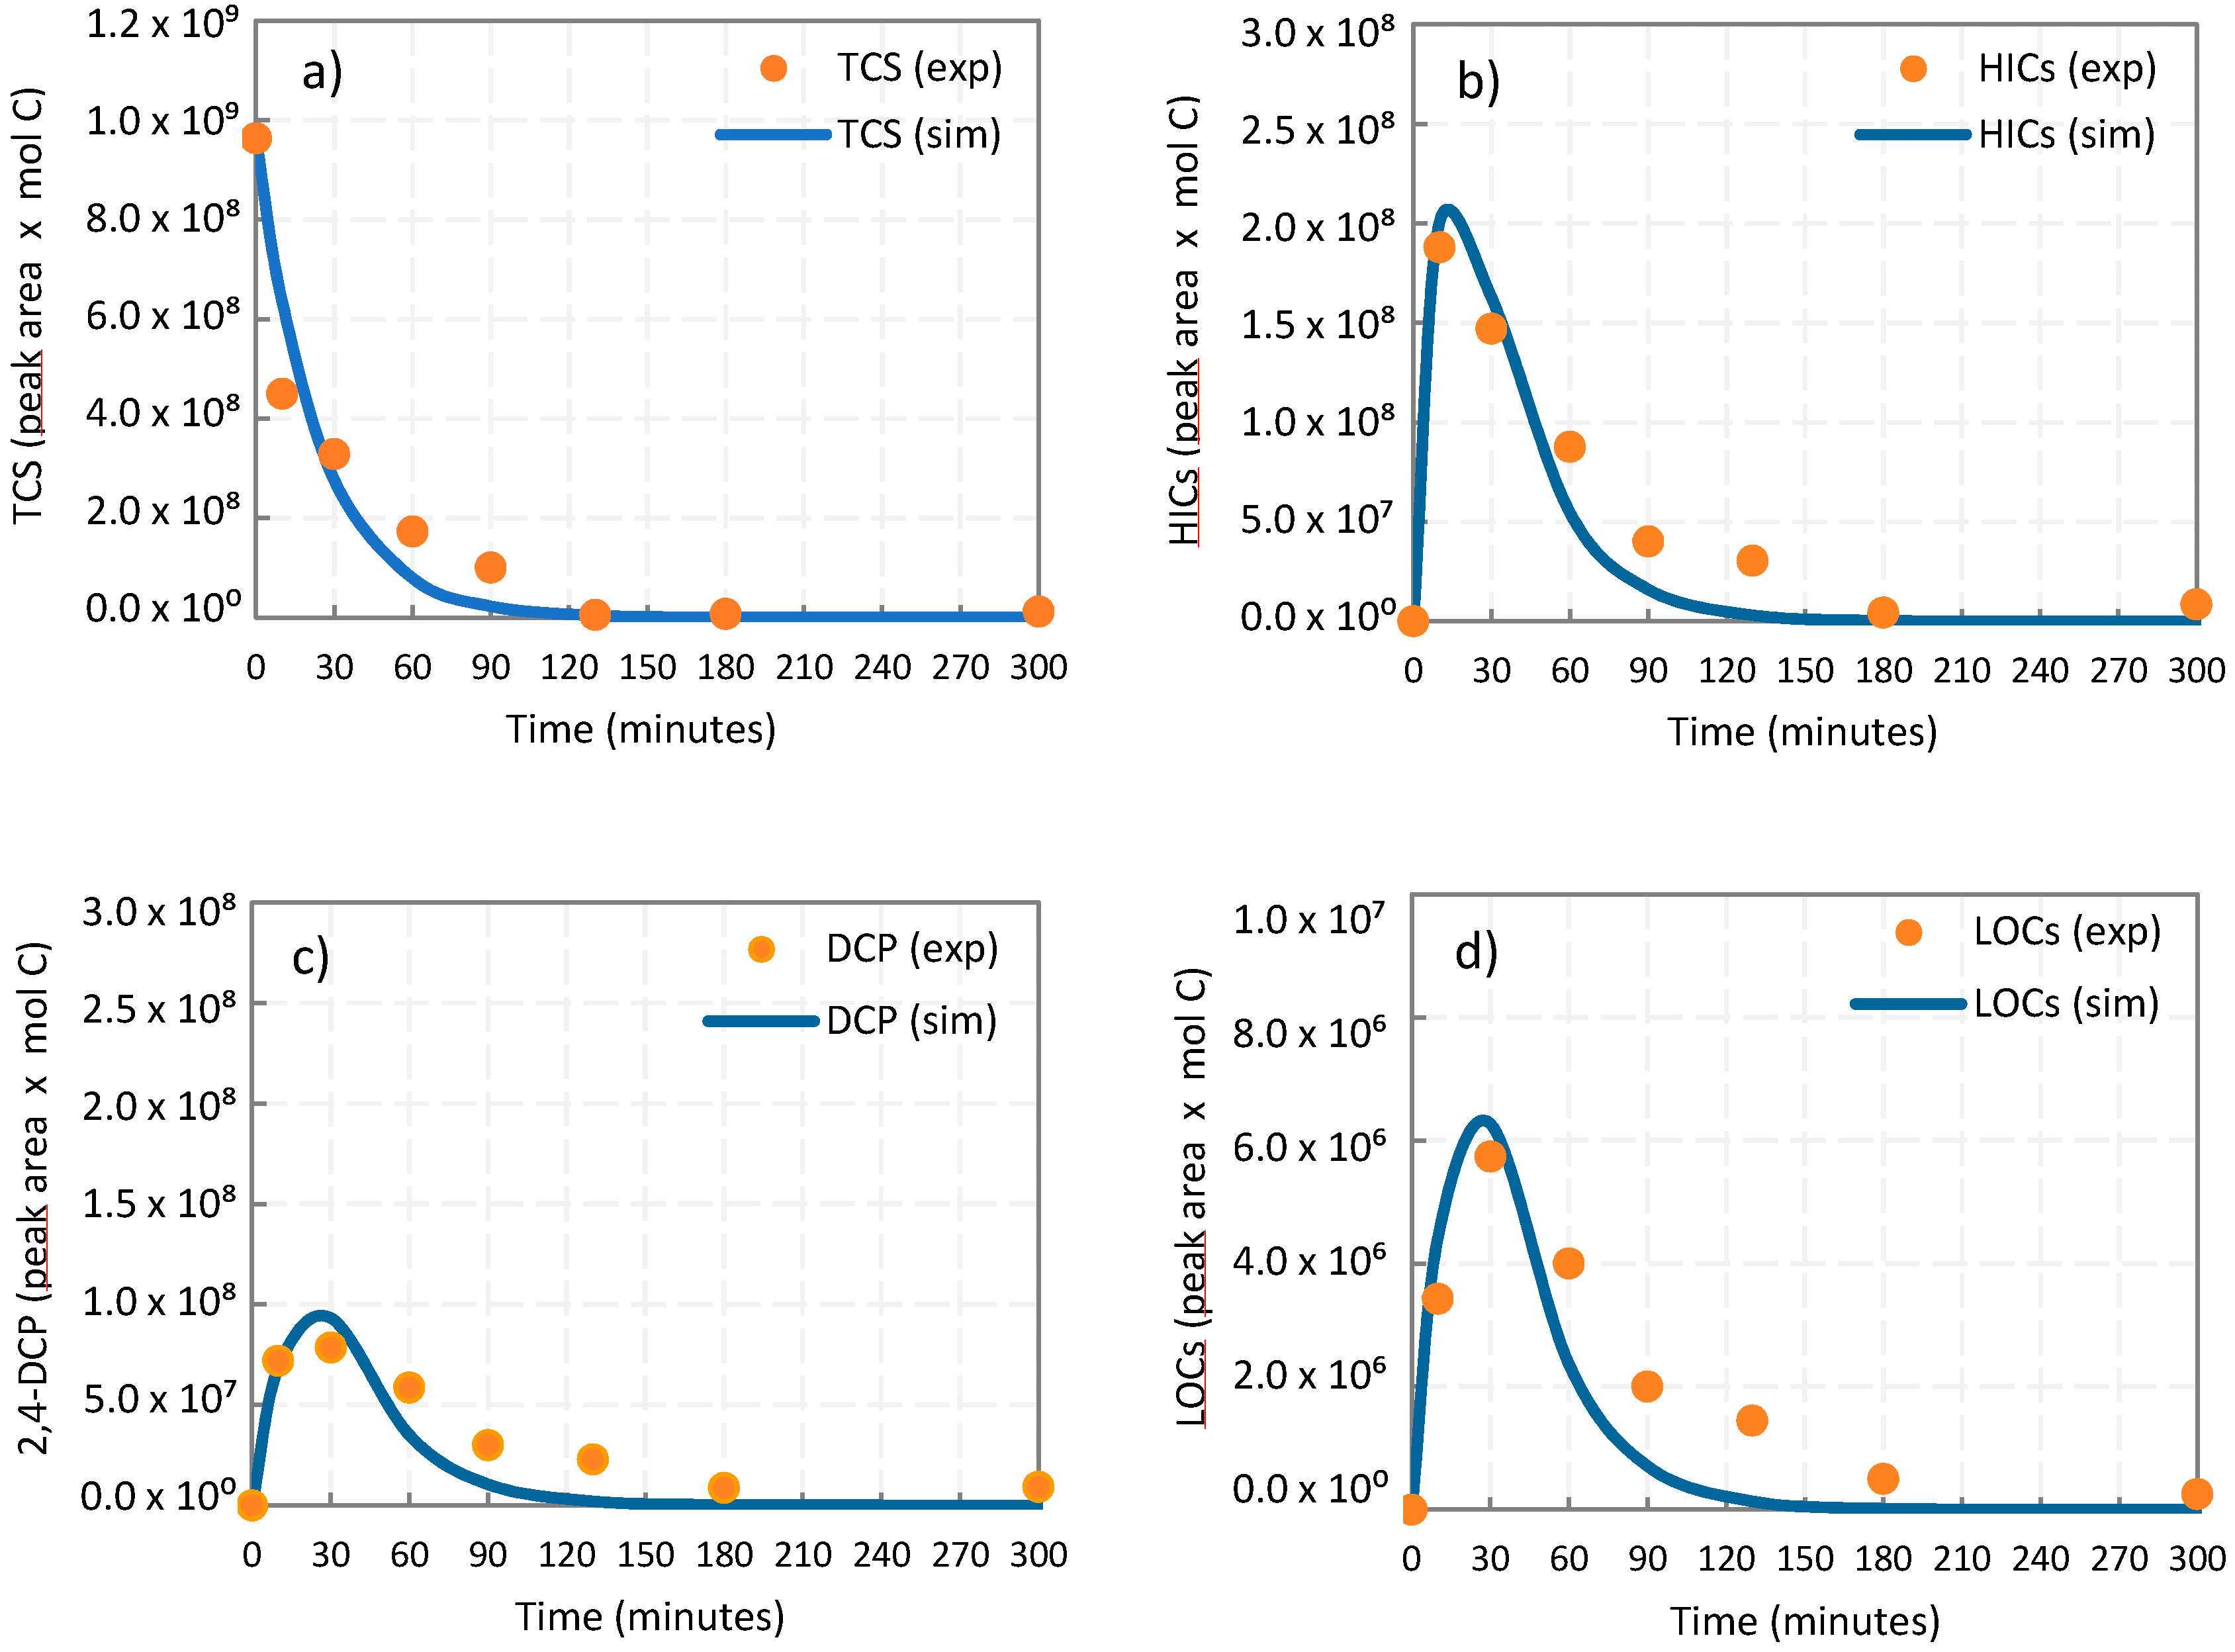
2.2. Kinetic Analysis and Modeling

In order to follow the change in the concentration of the parent TCS and the photocatalytically obtained derivatives, different samples were withdrawn at selected time values (10; 30; 60; 90; 130; 180; and 300 min) and the procedure described in the experimental section was followed. Figure 3 depicts the time courses of TCS and 2,4-dichlorophenol concentration, with the corresponding error bars, representing the standard deviations of four replicates. 2,4-Dichlorophenol showed the highest concentration of all identified derivatives; it was produced gradually, reaching a maximum value of approx. 0.0049 mM and then the concentration started decreasing smoothly.
Figure 4a shows the time courses of HIC derivatives (detailed in Table 1) in terms of peak area. TCS quinone and hydroxylated TCS 1 presented much higher peak areas than hydroxylated TCS 2 and TCS 3; besides, TCS quinone was formed faster than hydroxylated TCS; all of them reached a maximum and then decreased. Negligible signal was obtained for all the compounds after ca. 180 min.
Figure 4b depicts peak areas of LOC derivatives; 2,4-dichlorophenol presented the highest peak area of all and, in contrast, the lowest area value of LOCs belongs to 2-chloro-p-benzoquinone. The trend was similar to that observed for HIC derivatives; LOCs were formed, reached a maximum around 30 min and then started decreasing until almost complete disappearance.
After identifying TCS derivatives and in order to proceed with the kinetic modeling, a carbon balance was carried out, by multiplying the peak area of each compound by its corresponding number of carbon atoms. This facilitated the expression of the concentration of the different derivatives in terms of the number of carbon moles. Additionally, for the best treatment of the data, the concentrations of HICs (hydroxylated TCS 1, 2 and 3) were added, obtaining a lumped value, ΣHICs; the same procedure was followed with LOC derivatives (2-chloro-p-benzoquinone, 2-chlorohydroquinone, 3,5-dichlorobenzene-1,2-diol and 4-chlorocatechol), to obtain ΣLOCs, excluding 2,4-dichlorophenol due to its higher concentration. TCS degradation occurs while the other compounds appear, with HICs being the first group of derivatives formed during the photocatalytic oxidation of TCS, reaching the maximum value in the interval of 10–30 min, then 2,4-dichlorophenol was formed. This compound increases until a maximum around 30 min and then decreases. Finally, LOCs have a similar tendency, although with lower peak areas, as can be seen in Figure 5. To the extent of the authors’ knowledge, there has been no previous research about the kinetic model considering the formed intermediate derivatives.
As has been stated in Section 2.1.2, some authors proposed that the TCS molecule suffers hydroxylation, while different authors propose that TCS breaks due to the OH action [35,36,37,39,41,42]. Based on the behavior of the intermediate derivatives and supported by the reviewed literature related to TCS photocatalysis, a reaction scheme is proposed in Equation (1). It is well known that oxidation reactions tend to follow a mechanism with consecutive reactions. Equation (1) represents the stoichiometric equations following TCS photocatalytic degradation. Triclosan (TCS) decomposes, leading to higher concentration compounds (HICs); the latter decompose to 2,4-dichlorophenol (DCP) and 2,4-dichlorophenol decomposes, forming lower concentration by-products (LOCs). Finally, LOCs are oxidized to carboxylic acids, CO2 and H2O (P).
TCS   k 1   Σ   HICs   k 2   DCP k 3 Σ   LOCs k 4   Carboxylic   acids   +   CO 2   +   H 2 O
For the kinetic modeling, the rate of all degradation and formation reactions has been described by a series of first order kinetic equations, where k1, k2, k3 and k4 are the kinetic constants (min−1); the kinetic model is expressed by Equations (2)–(6). k1 thereby corresponds to the reaction of TCS degradation and HIC formation, k2 to the disappearance of HICs and the formation of DCP, k3 to DCP degradation and LOC formation and finally, k4 to LOC disappearance and the formation of the carboxylic acids, CO2 and H2O.
dTCS dt = k 1 [ TCS ]
dHICs dt = k 1 [ TCS ] k 2 [ HICs ]
dDCP dt = k 2 [ HICs ] k 3 [ DCP ]
dLOCs dt = k 3 [ DCP ] k 4 [ LOCs ]
dP dt = k 4 [ LOCs ]
Aspen Custom Modeler software was employed to numerically solve the system of Equations (2)–(6). Figure 6 pictures the best fit between the model and the experimental data. The values of the kinetic constants were 4.20·10−2, 1.00·10−1, 1.95·10−1 and 2.92·100 min−1 for k1, k2, k3 and k4, respectively.
Table 2 summarizes the kinetic model and parameters and collects the values previously reported in the literature. The highest value of the k1 kinetic constant, 2.16·10−1 min−1, was reported by Son et al. (2009) [36], working with 0.1 g L−1 of TiO2 and treating 0.87 mg L−1 of TCS. Constantin et al. (2018) [35] reported the lowest k value, 2.50·10−2 min−1, treating 31 mg L−1 of TCS, and this can be attributed to the highest concentration of TCS, that reaches the highest value of all reported works, along with the amount of TiO2 employed. In the present work, the k1 value for TCS degradation is lower, but still in the range of the rest of the kinetic constants collected in Table 2. As can be seen, as the concentration of TCS decreases, the k value increases, keeping the rest of the variables constant; this means that the reported values correspond to apparent kinetic constants that depend on the concentration of the pollutants. Intrinsic kinetic constants would need an experimental plan with the individual compounds; therefore, this work constitutes a methodological path that helps in the design of remediation technologies.
Moreover, a review about the photocatalytic degradation kinetics of 2,4-dichlorophenol has been undertaken. Most studies have been carried out with higher concentrations of 2,4-dichlorophenol and have pointed to the dependency of the apparent kinetic parameters on the pollutant concentration, pH and light intensity. The reported values of kinetic parameters vary between the zeroth order parameter value 4.00·10−4 M h−1 reported by Ku and Hsieh [43] and the most recent first order parameter 5.11·10−1 min−1, reported by Abeisch et al. [44] in the treatment of 50 mg L−1 of 2,4-dichlorophenol with 0.5 g L−1 of TiO2 and 1000 mW cm−2. Additional information on the reviewed kinetic constants of 2,4-dichlorophenol degradation is collected in Table S1, Supplementary Materials.
Thus, this work provides the kinetic model and parameters that describe the concentration of most TCS derivatives formed during the photocatalytic treatment providing a very useful tool for process design and control.

3. Materials and Methods

3.1. Materials and Chemicals

Triclosan (≥99%) was provided by Alfa Aesar (Thermo Fisher Scientific, Waltham, MA, USA), 2,4-dichlorophenol (99%, Sigma-Aldrich, Saint Louis, MO, USA) was employed as standard for HPLC. The catalyst was TiO2 powder Degussa P25 (80:20 anatase/rutile) with a specific surface of 50 m2 g−1, provided by Evonik Industries AG (Essen, Germany). Formic acid (85%, Panreac, Barcelona, Spain) and acetonitrile LiChrosolv® (≥99.9%, Merck, Darmstadt, Germany) were employed in HPLC analysis. Dichloromethane UniSolv® (≥99%, Merck, Darmstadt, Germany) was used for intermediate product analysis. Syringe filters of 1 μm APFB (Merck Millipore, Burlington, MA, USA) were employed. Deionized ultrapure Milli-Q water (resistivity = 18.2 MΩ·cm) purified with a Milli-Q device (Millipore) was employed in the preparation of all solutions. The pH meter employed was a GLP 22 (Crison). Zeta potential was measured with a Zetasizer Nano ZS (Malvern Instruments, Malvern, Worcestershire, UK) and a zeta potential folded capillary cell (Malvern), by Laser Doppler Electrophoresis.

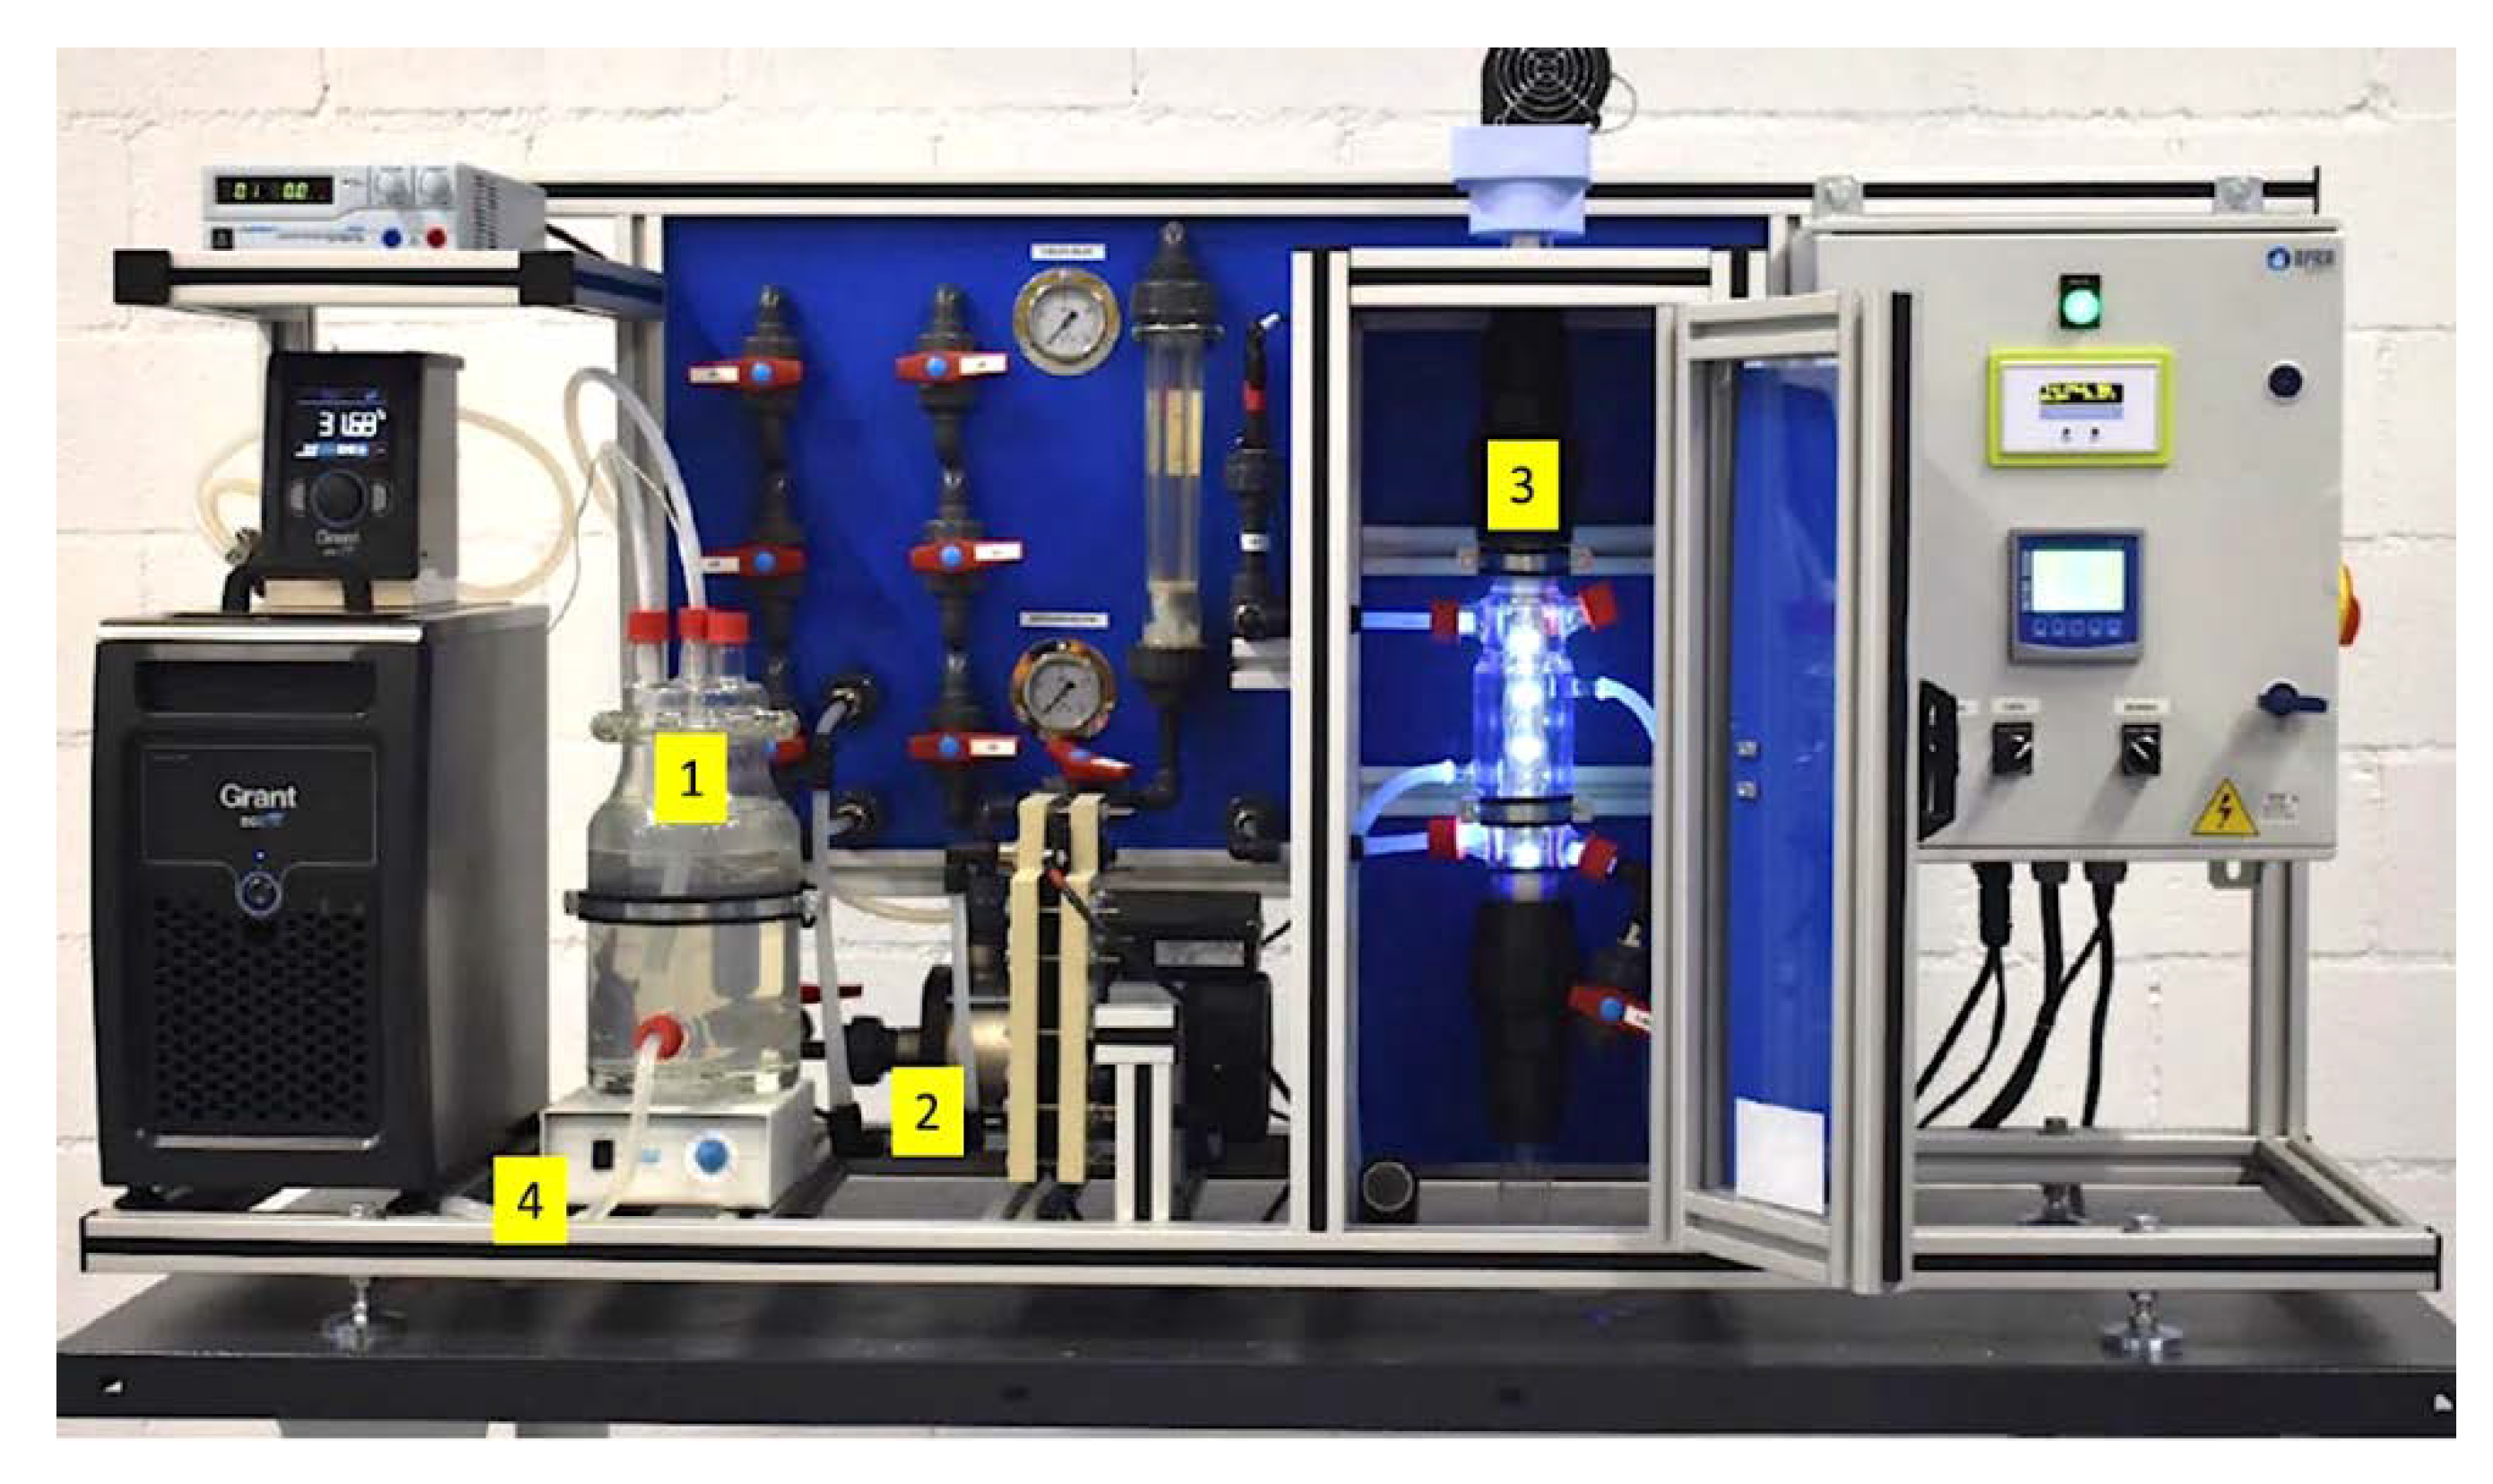
3.2. Photocatalytic Experiments

Photocatalytic solutions with an initial concentration of 10 mg L−1 of TCS were treated in a medium/high-power laboratory-scale photochemical plant provided with LED technology (APRIA Systems S.L., Guarnizo, Cantabria, Spain). It consists of a 1 L mixing tank where the solution was placed and pumped into a 0.25 L jacketed annular Pyrex reaction vessel; all elements were connected with flexible Teflon tubing. UVA-LEDs were located inside the inner tube of the reactor, with an emission wavelength of 365 nm. The electrical power of the plant ranges from 0 to 54 W in the UV-A spectra. Moreover, the system contains a magnetic stirring plate operated at 1000 rpm to maintain the homogeneity of the suspension, and a refrigeration bath to keep the temperature constant at 25 °C. The experimental set-up is represented in Figure 7.
Different catalyst doses of TiO2 were used (0.75, 1.0 and 1.5 g L−1) to perform the study. The electrical power applied in the experiments varied between 9–35 W, and the working pH was 5.8 (the initial pH of the sample was not modified) until its complete degradation, reached after 5 h. Before each photocatalytic experiment, the suspension with TiO2 flowed through the system in complete darkness for 2 min to reach the solute adsorption–desorption equilibrium. Then, the light was turned on to start the experiments. Different samples were taken at specified times and filtered through an APFB filter before storage in amber vials, until analysis. Two replicates of each experiment were carried out.

3.3. Chemical Analysis

The concentrations of triclosan and 2,4-dichlorophenol were analyzed in a high-performance liquid chromatograph (HPLC) Agilent Series 1100, employing an Agilent ZORBAX 80Å Extend-C18 5 μm column (3.0 × 150 mm) and photodiode array (PDA) detector (Agilent, Santa Clara, CA, USA). The analysis of TCS and 2,4-dichlorophenol followed the gradient elution method with acetonitrile and formic acid (0.1% v/v) as a mobile phase at a flow rate of 1 mL min−1: Eighty percent formic acid solution was eluted for 3 min with acetonitrile, 80% to 20% formic acid solution was eluted for the next 12 min, followed by 20% to 0% formic acid for another 5 min. Lastly, 100% acetonitrile was eluted for 6 min. The selected wavelength was 210 nm and the column was kept at 30 °C. The injection volume was 50 μL. Compounds were identified using authentic standards by matching their retention time and absorbance spectra. The retention times for 2,4-dichlorophenol and TCS were 9.7 and 14.2 min, respectively.
Qualitative analysis for intermediate derivatives formed during the TCS photocatalytic experiments were performed by gas chromatography–mass spectrometry (GC-MS). The GC-MS was performed on Shimadzu QP2010 Ultra (Shimadzu, Kyoto, Japan) apparatus equipped with an auto-sampler. Separation occurred in an HP-5MS column (30 m × 0.25 mm × 0.1 mm) (Agilent, Santa Clara, CA, USA). Aliquots of samples (500 mL) were extracted twice with 50 mL of dichloromethane using a separatory funnel. The organic extract was concentrated up to 1 mL, first, using a rotatory evaporator (R-210, BÜCHI Labortechnik AG, Flawil, Switzerland) and a gentle flow of N2 in a second step. The temperature program of the GC-MS oven was 60 °C, held for 3 min, rate 10 °C min−1 to 320 °C, held for 6 min. Helium was employed as a carrier gas at a flow rate of 1 mL min−1. A volume sample of 2 μL was injected in splitless mode and the injector temperature was set at 285 °C. The mass spectrometer (MS) was operated in electron impact ionization mode (70 eV). Transfer line and ion source temperatures were 290 and 230 °C, respectively. Data acquisition was in full scan mode with a range from m/z 35 to 400. Identification of the intermediate derivatives produced during the oxidation treatment was carried out by comparison of their mass spectra with those from the NIST08 database. The change in the concentration of the intermediate derivatives was determined from the comparison of the areas of characteristic peaks at different oxidation times (10; 30; 60; 90; 130; 180; and 300 min).

4. Conclusions

This work advances the knowledge on photocatalytic wastewater remediation technologies for the degradation of persistent and emerging pollutants; besides the degradation of the parent compound, the kinetics of the formation of intermediate derivatives is also analyzed. The work progress has been applied to the photocatalytic degradation of TCS as a case study. TCS is an antimicrobial and antifungal compound that is found in natural waters as a result of its widespread use in consumer goods. The environmental and energy benefits offered by photocatalysis are promising in further deployment of the technology for the remediation of wastewaters containing emerging pollutants, but a deep understanding of the degradation pathways and kinetics is needed first. An experimental plan working with different catalyst doses (0.75, 1.00 and 1.50 g L−1 of TiO2) and light power (9, 21 and 35 W) was carried out in a medium/high-power laboratory-scale photochemical plant provided with LED technology. The main derivatives formed during TCS photocatalysis were identified from samples taken at different times. They were classified into two groups, higher concentration compounds (TCS quinone and three hydroxylated TCS compounds) and lower concentration compounds (2-chloro-p-benzoquinone, 2,4-dichlorophenol, 2-chlorohydroquinone, 3,5-dichlorobenzene-1,2-diol and 4-chlorocatechol).
Finally, after the proposal of the reaction pathway supported by the identified derivatives, the kinetic model was developed, starting with the formation of TCS derivatives at a higher concentration, which were degraded to the lower concentration compounds by the cleavage of the TCS molecule, and ended up as carboxylic acids, CO2 and water. The kinetic parameters obtained for the change of TCS and 2,4-dichlorophenol are in good agreement with previously reported values obtained from experiments performed under similar conditions. In addition, the kinetic model here reported can be used to predict the performance of water remediation technology.

Supplementary Materials

The following are available online at https://www.mdpi.com/2073-4344/10/12/1468/s1, Figure S1: GC-MS spectra of the TCS derivatives: (a) TCS quinone, (b) hydroxylated TCS 1, (c) hydroxylated TCS 2 and (d) hydroxylated TCS 3, Table S1: 2,4-dichlorophenol kinetic constants reviewed in bibliography.

Author Contributions

Conceptualization, S.S., Mª.-F.S.-R. and I.O.; Formal analysis, S.S., Mª.-F.S.-R. and I.O.; Funding acquisition, Mª.-F.S.-R.; Investigation, S.S., Mª.-F.S.-R. and I.O.; Methodology, S.S., Mª.-F.S.-R. and I.O.; Project administration, Mª.-F.S.-R.; Supervision, Mª.-F.S.-R.; Writing—original draft, S.S.; Writing—review and editing, S.S., Mª.-F.S.-R. and I.O. All authors have read and agreed to the published version of the manuscript.

Funding

This research was funded by the Spanish Ministry of Economy and Competitiveness (MINECO) (CTM2017-87740-R and RTI2018-093310-B-I00).

Acknowledgments

S.S. is grateful for the FPI contract grant, PRE2018-083526.

Conflicts of Interest

The authors declare no conflict of interest.

References

  1. Ortiz Uribe, I.; Mosquera-Corral, A.; Lema Rodicio, J.; Esplugas, S. Advanced technologies for water treatment and reuse. Am. Inst. Chem. Eng. 2015, 61, 3146–3158. [Google Scholar] [CrossRef]
  2. Solá-Gutiérrez, C.; San Román, M.F.; Ortiz, I. Fate and hazard of the electrochemical oxidation of triclosan. Evaluation of polychlorodibenzo-p-dioxins and polychlorodibenzofurans (PCDD/Fs) formation. Sci. Total Environ. 2018, 626, 126–133. [Google Scholar] [CrossRef] [PubMed]
  3. Dhillon, G.S.; Kaur, S.; Pulicharla, R.; Brar, S.K.; Cledón, M.; Verma, M.; Surampalli, R.Y. Triclosan: Current status, occurrence, environmental risks and bioaccumulation potential. Int. J. Environ. Res. Public Health 2015, 12, 5657–5684. [Google Scholar] [CrossRef] [PubMed]
  4. Ruszkiewicz, J.A.; Li, S.; Rodriguez, M.B.; Aschner, M. Is Triclosan a neurotoxic agent? J. Toxicol. Environ. Heal. Part B Crit. Rev. 2017, 20, 104–117. [Google Scholar] [CrossRef] [PubMed]
  5. Dann, A.B.; Hontela, A. Triclosan: Environmental exposure, toxicity and mechanisms of action. J. Appl. Toxicol. 2011, 31, 285–311. [Google Scholar] [CrossRef]
  6. Bester, K. Triclosan in a sewage treatment process—Balances and monitoring data. Water Res. 2003, 37, 3891–3896. [Google Scholar] [CrossRef]
  7. Canosa, P.; Rodríguez, I.; Rubí, E.; Cela, R. Determination of parabens and triclosan in indoor dust using matrix solid-phase dispersion and gas chromatography with tandem mass spectrometry. Anal. Chem. 2007, 79, 1675–1681. [Google Scholar] [CrossRef]
  8. Chen, J.; Hartmann, E.M.; Kline, J.; Van Den Wymelenberg, K.; Halden, R.U. Assessment of human exposure to triclocarban, triclosan and five parabens in U.S. indoor dust using dispersive solid phase extraction followed by liquid chromatography tandem mass spectrometry. J. Hazard. Mater. 2018, 360, 623–630. [Google Scholar] [CrossRef]
  9. Pedrouzo, M.; Borrull, F.; Marcé, R.M.; Pocurull, E. Stir-bar-sorptive extraction and ultra-high-performance liquid chromatography-tandem mass spectrometry for simultaneous analysis of UV filters and antimicrobial agents in water samples. Anal. Bioanal. Chem. 2010, 397, 2833–2839. [Google Scholar] [CrossRef]
  10. Kookana, R.S.; Ying, G.G.; Waller, N.J. Triclosan: Its occurrence, fate and effects in the Australian environment. Water Sci. Technol. 2011, 63, 598–604. [Google Scholar] [CrossRef]
  11. Villaverde-De-Sáa, E.; González-Mariño, I.; Quintana, J.B.; Rodil, R.; Rodríguez, I.; Cela, R. In-sample acetylation-non-porous membrane-assisted liquid-liquid extraction for the determination of parabens and triclosan in water samples. Anal. Bioanal. Chem. 2010, 397, 2559–2568. [Google Scholar] [CrossRef] [PubMed]
  12. Archer, E.; Petrie, B.; Kasprzyk-Hordern, B.; Wolfaardt, G.M. The fate of pharmaceuticals and personal care products (PPCPs), endocrine disrupting contaminants (EDCs), metabolites and illicit drugs in a WWTW and environmental waters. Chemosphere 2017, 174, 437–446. [Google Scholar] [CrossRef] [PubMed]
  13. Mohan, S.; Balakrishnan, P. Triclosan in treated wastewater from a city wastewater treatment plant and its environmental risk assessment. Water. Air. Soil Pollut. 2019, 230, 69. [Google Scholar] [CrossRef]
  14. Ricart, M.; Guasch, H.; Alberch, M.; Barceló, D.; Bonnineau, C.; Geiszingerb, A.; Ferrer, J.; Ricciardi, F.; Romaní, A.M.; Morin, S.; et al. Triclosan persistence through wastewater treatment plants and its potential: Toxic effects on river biofilms. Aquat. Toxicol. 2010, 100, 346–353. [Google Scholar] [CrossRef]
  15. Bedoux, G.; Roig, B.; Thomas, O.; Dupont, V.; Le Bot, B. Occurrence and toxicity of antimicrobial triclosan and by-products in the environment. Environ. Sci. Pollut. Res. 2012, 19, 1044–1065. [Google Scholar] [CrossRef]
  16. Guruge, K.S.; Goswami, P.; Tanoue, R.; Nomiyama, K.; Wijesekara, R.G.S.; Dharmaratne, T.S. First nationwide investigation and environmental risk assessment of 72 pharmaceuticals and personal care products from Sri Lankan surface waterways. Sci. Total Environ. 2019, 690, 683–695. [Google Scholar] [CrossRef]
  17. Hewitt, N.J.; Grégoire, S.; Cubberley, R.; Duplan, H.; Eilstein, J.; Ellison, C.; Lester, C.; Fabian, E.; Fernandez, J.; Géniès, C.; et al. Measurement of the penetration of 56 cosmetic relevant chemicals into and through human skin using a standardized protocol. J. Appl. Toxicol. 2019, 40, 403–415. [Google Scholar] [CrossRef] [Green Version]
  18. Wang, L.; Asimakopoulos, A.G.; Kannan, K. Accumulation of 19 environmental phenolic and xenobiotic heterocyclic aromatic compounds in human adipose tissue. Environ. Int. 2015, 78, 45–50. [Google Scholar] [CrossRef]
  19. Mínguez-Alarcón, L.; Gaskins, A.J. Female exposure to endocrine disrupting chemicals and fecundity: A review. Curr. Opin. Obstet. Gynecol. 2017, 29, 202–211. [Google Scholar] [CrossRef]
  20. Weatherly, L.M.; Gosse, J.A. Triclosan exposure, transformation, and human health effects. J. Toxicol. Environ. Health Part B Crit. Rev. 2017, 20, 447–469. [Google Scholar] [CrossRef]
  21. Government of Canada Chemical Products Safety—Triclosan. Available online: https://www.canada.ca/en/health-canada/services/chemicals-product-safety/triclosan.html (accessed on 31 August 2020).
  22. U.S. FDA 84 FR 14847—Safety and Effectiveness of Consumer Antiseptic Rubs; Topical Antimicrobial Drug Products for Over-the-Counter Human Use; Food and Drug Administration: Silver Spring, MD, USA, 2019; Volume 84, No. 71.
  23. European Commission. Commission Implementing Decision (EU); European Commission: Luxembourg, 2016; Volume 2001, L 21/86. [Google Scholar]
  24. Fernández-Castro, P.; San Román, M.F.; Ortiz, I. Theoretical and experimental formation of low chlorinated dibenzo-p-dioxins and dibenzofurans in the Fenton oxidation of chlorophenol solutions. Chemosphere 2016, 161, 136–144. [Google Scholar] [CrossRef] [PubMed]
  25. Solá-Gutiérrez, C.; Schröder, S.; San Román, M.F.; Ortiz, I. PCDD/Fs traceability during triclosan electrochemical oxidation. J. Hazard. Mater. 2019, 369, 584–592. [Google Scholar] [CrossRef] [PubMed]
  26. Vallejo, M.; Fernández-Castro, P.; San Román, M.F.; Ortiz, I. Assessment of PCDD/Fs formation in the Fenton oxidation of 2-chlorophenol: Influence of the iron dose applied. Chemosphere 2015, 137, 135–141. [Google Scholar] [CrossRef] [PubMed]
  27. Vallejo, M.; San Román, M.F.; Ortiz, I.; Irabien, A. The critical role of the operating conditions on the fenton oxidation of 2-chlorophenol: Assessment of PCDD/Fs formation. J. Hazard. Mater. 2014, 279, 579–585. [Google Scholar] [CrossRef] [Green Version]
  28. Vallejo, M.; San Román, M.F.; Ortiz, I. Quantitative assessment of the formation of polychlorinated derivatives, PCDD/Fs, in the electrochemical oxidation of 2-chlorophenol as function of the electrolyte type. Environ. Sci. Technol. 2013, 47, 12400–12408. [Google Scholar] [CrossRef]
  29. Wold, A. Photocatalytic properties of TiO2. Chem. Mater. 1993, 5, 280–283. [Google Scholar] [CrossRef]
  30. Ribao, P.; Corredor, J.; Rivero, M.J.; Ortiz, I. Role of reactive oxygen species on the activity of noble metal-doped TiO2 photocatalysts. J. Hazard. Mater. 2019, 372, 45–51. [Google Scholar] [CrossRef]
  31. Ribao, P.; Rivero, M.J.; Ortiz, I. Enhanced photocatalytic activity using GO/TiO2 catalyst for the removal of DCA solutions. Environ. Sci. Pollut. Res. 2018, 25, 34893–34902. [Google Scholar] [CrossRef]
  32. Solá-Gutiérrez, C.; Schröder, S.; San-Román, M.F.; Ortiz, I. Critical review on the mechanistic photolytic and photocatalytic degradation of triclosan. J. Environ. Manag. 2020, 260, 110101. [Google Scholar] [CrossRef]
  33. European Commission. Decision No 2455/2001/EC of the European Parliament and of the Council of 20 November 2001; European Commission: Luxembourg, 2004; Volume 2001. [Google Scholar]
  34. U.S. EPA. 126 Priority Pollutants; U.S. EPA: Washington, DC, USA, 2012; Volume 29.
  35. Constantin, L.A.; Nitoi, I.; Cristea, N.I.; Constantin, M.A. Possible degradation pathways of triclosan from aqueous systems via TiO2 assisted photocatalyis. J. Ind. Eng. Chem. 2018, 58, 155–162. [Google Scholar] [CrossRef]
  36. Son, H.-S.; Ko, G.; Zoh, K.D. Kinetics and mechanism of photolysis and TiO2 photocatalysis of triclosan. J. Hazard. Mater. 2009, 166, 954–960. [Google Scholar] [CrossRef] [PubMed]
  37. Stamatis, N.; Antonopoulou, M.; Hela, D.; Konstantinou, I. Photocatalytic degradation kinetics and mechanisms of antibacterial triclosan in aqueous TiO2 suspensions under simulated solar irradiation. J. Chem. Technol. Biotechnol. 2014, 89, 1145–1154. [Google Scholar] [CrossRef]
  38. Bayarri, B.; Giménez, J.; Curcó, D.; Esplugas, S. Photocatalytic degradation of 2,4-dichlorophenol by TiO2/UV: Kinetics, actinometries and models. Catal. Today 2005, 101, 227–236. [Google Scholar] [CrossRef]
  39. Yu, J.C.; Kwong, T.Y.; Luo, Q.; Cai, Z. Photocatalytic oxidation of triclosan. Chemosphere 2006, 65, 390–399. [Google Scholar] [CrossRef] [PubMed]
  40. Zhang, H.; Huang, C.H. Oxidative transformation of triclosan and chlorophene by manganese oxides. Environ. Sci. Technol. 2003, 37, 2421–2430. [Google Scholar] [CrossRef]
  41. Sankoda, K.; Matsuo, H.; Ito, M.; Nomiyama, K.; Arizono, K.; Shinohara, R. Identification of triclosan intermediates produced by oxidative degradation using TiO2 in pure water and their endocrine disrupting activities. Bull. Environ. Contam. Toxicol. 2011, 86, 470–475. [Google Scholar] [CrossRef]
  42. Rafqah, S.; Wong-Wah-Chung, P.; Nelieu, S.; Einhorn, J.; Sarakha, M. Phototransformation of triclosan in the presence of TiO2 in aqueous suspension: Mechanistic approach. Appl. Catal. B Environ. 2006, 66, 119–125. [Google Scholar] [CrossRef]
  43. Ku, Y.; Hsieh, C.-B. Photocatalytic decomposition of 2,4-dichlorophenol in aqueous TiO2 suspensions. Water Res. 1992, 26, 1451–1456. [Google Scholar] [CrossRef]
  44. Abeish, A.M.; Ang, H.M.; Znad, H. Solar photocatalytic degradation of chlorophenols mixture (4-CP and 2,4-DCP): Mechanism and kinetic modelling. J. Environ. Sci. Heal. Part A Toxic/Hazardous Subst. Environ. Eng. 2015, 50, 125–134. [Google Scholar] [CrossRef]
Figure 1. Influence of (a) TiO2 loading working at 35 W and (b) light power working with 1.5 g L−1 of TiO2.
Catalysts 10 01468 g001
Figure 2. Summary of the main photodegradation mechanisms of Triclosan (TCS). Catalysts 10 01468 i010 Detected in this work. Adapted from the literature [32,35,36,37,39,41,42].
Catalysts 10 01468 g002
Figure 3. Time course of TCS and 2,4-dichlorophenol (conditions: [TCS]0 = 10 mg L−1, (TiO2) = 1.50 g L−1, pH0 = 5.8).
Catalysts 10 01468 g003
Figure 4. Time courses of (a) HICs and (b) LOCs derivatives formed during TCS photocatalysis. Lines have been added for a better readability of the data.
Catalysts 10 01468 g004aCatalysts 10 01468 g004b
Figure 5. Disappearance of the parent TCS and formation of intermediate derivatives throughout the photocatalytic experiments.
Catalysts 10 01468 g005
Figure 6. Fitting of simulated and experimental data of (a) TCS photocatalysis, (b) higher concentration derivatives (HICs), (c) 2,4-dichloropheno1 (DCP) and (d) lower concentration derivatives (LOCs).
Catalysts 10 01468 g006
Figure 7. Experimental set-up, APRIA Systems; (1) mixing tank, (2) pump, (3) LED reactor and (4) magnetic stirrer.
Catalysts 10 01468 g007
Table 1. Summary of the identified higher concentration compounds (HICs) and lower concentration compounds (LOCs).
Higher Concentration Compounds (HICs)
No.Compoundsm/zRetention Time (min)Structure
1TCS quinone267/269/53/24023.01 Catalysts 10 01468 i001
2Hydroxylated TCS 1234/304/130/9523.85 Catalysts 10 01468 i002
3Hydroxylated TCS 2234/304/162/23623.99 Catalysts 10 01468 i003
4Hydroxylated TCS 3234/304/162/5124.41 Catalysts 10 01468 i004
Lower Concentration Compounds (LOCs)
No.Compoundsm/zRetention Time (min)Structure
52-chloro-p-benzoquinone142/54/268.77 Catalysts 10 01468 i005
62,4-dichlorophenol162/164/6310.24 Catalysts 10 01468 i006
72-chlorohydroquinone144/52/8012.75 Catalysts 10 01468 i007
83,5-dichlorobenzene-1,2-diol178/180/11413.3 Catalysts 10 01468 i008
94-chlorocatechol144/146/6314.2 Catalysts 10 01468 i009
Table 2. TCS kinetic constants in photocatalytic experiments.
Photocatalysis
ConditionsKinetic Equations and ParametersRef.
Kinetic Equationsk (min −1)
TCS0 = 30 µM (8.7 mg L−1); TiO2 = 0.1 g L−1; V = 0.15 L; pH = neutral; Hg lamp (UV-A) = 450 W, λ = 365 nm;
Light intensity = 1.37·10−4 Einstein L−1 min−1
dTCS dt = k   [ TCS ]
(k values given at 5 min)
k1 = 1.67·10−1[36]
TCS0 = 17 µM (4.92 mg L−1); TiO2 = 0.1 g L−1;
V = 0.15 L; pH = neutral; Hg lamp (UV-A) = 450 W,λ = 365 nm; Light intensity = 1.37·10−4 Einstein L−1 min−1
k2 = 1.71·10−1
TCS0 = 10 µM (2.89 mg L−1); TiO2 = 0.1 g L−1;
V = 0.15 L; pH = neutral; Hg lamp (UV-A) = 450 W,
λ = 365 nm; Light intensity = 1.37·10−4 Einstein L−1 min−1
k3 = 1.87·10−1
TCS0 = 7 µM (2.02 mg L−1); TiO2= 0.1 g L−1; V = 0.15 L;
pH = neutral; Hg lamp (UV-A) = 450 W, λ = 365 nm;
Light intensity = 1.37·10−4 Einstein L−1 min−1
k4 = 2.02·10−1
TCS0 = 3 µM (0.87 mg L−1); TiO2 = 0.1 g L−1; V = 0.15 L;
pH = neutral; Hg lamp (UV-A) = 450 W, λ = 365 nm;
Light intensity = 1.37·10−4 Einstein L−1 min−1
k5 = 2.16·10−1
TCS0 = 3.45 µM (1 mg L−1); TiO2 = 0.5 g L−1; V = 0.25 L;
pH = 6.6; Xe lamp (UV) = 2.2 kW, λ = >290 nm
dTCS dt = k 1 [ TCS ] k1 = 1.50·10−1
t1/2 = 4.61 min
[37]
TCS0 = 109.8 µM (31.8 mg L−1); TiO2 = 0.2 g L−1; pH = 6.5;
UV = 300-400 nm; Light intensity = 1.05·10−6 Einstein s−1
dTCS dt = k 1 [ TCS ] k1 = 2.50·10−2[35]
TCS0 = 34.5 µM (10 mg L−1); TiO2 = 1.5 g L−1; V = 1 L;
pH = 5.8; LED lamp (UV) = 35 W, λ = 365 nm
dTCS dt = k 1 [ TCS ]
dHICs dt = k 1 [ TCS ] k 2 [ HICs ]
dDCP dt = k 2 [ HICs ] k 3 [ DCP ]  
dLOCs dt = k 3 [ DCP ] k 4 [ LOCs ]
dP dt = k 4 [ LOCs ]
k1 = 4.20·10−2
k2 = 1.00·10−1
k3 = 1.95·10−1
k4 = 2.92·100
This work
Publisher’s Note: MDPI stays neutral with regard to jurisdictional claims in published maps and institutional affiliations.

