Article

Influence of Topology and Brønsted Acid Site Presence on Methanol Diffusion in Zeolites Beta and MFI

by
Cecil H. Botchway
1,2,
Richard Tia
1,
Evans Adei
1,
Alexander J. O’Malley
3,
Nelson Y. Dzade
2,
Carlos Hernandez-Tamargo
2,4 and
Nora H. de Leeuw
2,5,*
1
Department of Chemistry, Kwame Nkrumah University of Science and Technology, Kumasi 1916, Ghana
2
School of Chemistry, Cardiff University, Main Building, Cardiff CF10 3AT, UK
3
Department of Chemistry, University of Bath, Bath BA2 7AY, UK
4
National Centre for Catalysis Research, Department of Chemistry, Indian Institute of Technology Madras, Chennai 600 036, India
5
School of Chemistry, University of Leeds, Leeds LT2 9JT, UK
*
Author to whom correspondence should be addressed.
Catalysts 2020, 10(11), 1342; https://doi.org/10.3390/catal10111342
Submission received: 30 October 2020 / Revised: 13 November 2020 / Accepted: 14 November 2020 / Published: 18 November 2020
(This article belongs to the Special Issue Advances in Zeolite Catalysts)

Abstract

:
Detailed insight into molecular diffusion in zeolite frameworks is crucial for the analysis of the factors governing their catalytic performance in methanol-to-hydrocarbons (MTH) reactions. In this work, we present a molecular dynamics study of the diffusion of methanol in all-silica and acidic zeolite MFI and Beta frameworks over the range of temperatures 373–473 K. Owing to the difference in pore dimensions, methanol diffusion is more hindered in H-MFI, with diffusion coefficients that do not exceed 10 × 10 10   m 2 s 1 . In comparison, H-Beta shows diffusivities that are one to two orders of magnitude larger. Consequently, the activation energy of translational diffusion can reach 16 kJ·mol−1 in H-MFI, depending on the molecular loading, against a value for H-Beta that remains between 6 and 8 kJ·mol−1. The analysis of the radial distribution functions and the residence time at the Brønsted acid sites shows a greater probability for methylation of the framework in the MFI structure compared to zeolite Beta, with the latter displaying a higher prevalence for methanol clustering. These results contribute to the understanding of the differences in catalytic performance of zeolites with varying micropore dimensions in MTH reactions.

Graphical Abstract

1. Introduction

The zeolite-catalyzed conversion of methanol to hydrocarbons (MTH) has received considerable attention over the last four decades as a reliable source of light olefins with diverse applications in the chemical industry [1]. These aluminosilicate crystals combine high surface area, great thermal stability, and shape/size selectivity, performing as excellent catalysts in the conversion process [2,3,4,5]. Despite several proposed reaction mechanisms [6,7,8,9,10,11], a clear understanding of how structural features affect the catalytic performance is still missing. Diffusion studies are critical to improve our insight, since the movement of methanol through the pore system is affected by the interaction with the active sites, variations in temperature and modifications in the zeolite topology and micropore dimension, which are all factors that also control the efficiency of zeolites as catalysts in the MTH process.
Earlier experiments have shown that the MTH process over acidic zeolites MFI and Beta have similar conversion efficiencies but differ in molecular shape and size selectivity [12]. The role of Brønsted acid sites in the analysis of multicomponent diffusion studies, such as CH3OH/(CH3)2O [13] or CH3OH/H2O [14], is ignored, with scarce knowledge on the most favorable adsorption conformation for the methylation of zeolites. The majority of the reported mechanisms propose the C-O cleavage in the methanol molecule at the Brønsted acid sites of the zeolite framework [15]. The complexity of the suggested mechanisms further expands with recent studies demonstrating the possible formation of a carbene-like intermediate when the framework methoxy species reacts with hydrocarbon-pool compounds [16,17]. The gap in our knowledge of the effect of the Brønsted acid sites on the mobility of methanol within the zeolite frameworks can be resolved by comparing the diffusivities of methanol in all-silica and acidic frameworks to quantify the influence of the Brønsted acid sites on a crucial part of the MTH process. Diffusion studies serve as a useful tool in determining and understanding the methanol–zeolite interactions, which ultimately enhances our existing knowledge of the catalytic activity, selectivity, and lifespan of the zeolites [18,19].
It is well-established that the MTH process in zeolites is a temperature-sensitive reaction. However, considerable uncertainty remains on the optimum range of temperature within which the reaction occurs. Neutron spectroscopy experiments of methanol in H-ZSM-5 [20] have shown that methylation can occur under ambient conditions, while other experimental studies have indicated that methylation occurs at high temperatures between 473 and 523 K [21]. It is worth noting that methoxy species formed at temperatures below 373 K have low stability and are susceptible to post-dehydration hydrolysis, which results in the reformation of methanol [22]. Some proposed kinetic models have shown the deactivation of ZSM-5 in the MTH process by coke formation observed at a relatively higher temperature range of 573–723 K. At temperatures above 723 K, the irreversible dealumination of the zeolite catalyst is observed in the production of light olefins from chloromethane [23]. Dimethyl ether formation, which is presumed to be an intermediate in the MTH process, shows high yield with a reduction in selectivity as the temperature increases [24]. From this information, a tentative temperature range for the MTH process can be set with lower and upper limits of 373–573 K. In this work, we present the diffusion analysis of methanol with the highest temperature set at 473 K, which should provide sufficient information on the initial stages of the dehydration process as a function of temperature.
Reports centered around the topological features and their relevance in catalysis have shown that zeolites with relatively small pores, specifically 10-membered channels, have better selectivity toward light olefins [25]. Relatively larger pore zeolites, such as MOR and Beta, are popular in reactions involving the aromatization of olefins, although they tend to deactivate easily and they also require comparatively higher concentrations of substrates [26,27,28]. Hence, the pore dimension and framework features are crucial for the conversion process and product selectivity. In order to analyze the correlation between framework topology and catalytic activity in the MTH reaction, other factors that govern the performance of the catalysts have to remain unchanged, e.g., the acid site distribution and methanol concentration [29,30]. Only then can one distinctly recognize the effect of different pore dimensions on the catalytic activity [31]. In this regard, computer simulations are a natural choice to perform this analysis, allowing us to systematically tune the features of the model to subsequently observe the effects of the parameters of interest.
In the present work, we report the investigation of methanol diffusion in all-silica and acidic zeolites MFI and Beta, using molecular dynamics (MD) simulations to analyze the effect of topology, temperature, and molecular concentration on the mobility of methanol and its interaction with the Brønsted acid sites. We inspect experimentally relevant parameters, such as diffusion barriers and mean square displacement of the adsorbates, over the range of temperature 373–473 K and at methanol concentrations between 2 and 5 molecules per unit cell. The calculated results demonstrate the relevance of methanol diffusion studies as they inform and validate some proposed reaction mechanisms involved in zeolite methylation, which is a key aspect of the MTH reactions.

2. Results and Discussion

The comparison between the acidic and all-silica structures allows us to assess the effect of the Brønsted acid sites on the diffusion of methanol through the micropore system of the zeolites. As a general observation, diffusion is slower in the presence of acid sites, owing to H-bonding interactions between methanol OH groups and the acidic protons; this translational motion slows down for both acidic and all-silica zeolites when the molecular loading is increased, as shown in the mean square displacement (MSD) plots of Figure 1. The slowest diffusion of methanol in zeolite Beta is observed for a molecular loading of 4 molecules per unit cell (mpuc) in the acidic structure at a temperature of 373 K, with a diffusion coefficient of 89.9 × 10⁻¹⁰ m2s−1. This value steadily increases to 143.0 × 10⁻¹⁰ m2s−1 at a temperature of 473 K, yielding an activation energy for the translational diffusion of 6.8 kJ·mol−1 (see Table 1). When the concentration of methanol is halved to 2 mpuc, the coefficients increase by factors of between 1.2 and 1.4, with the energy barrier increasing by 2 kJ·mol−1. The diffusion in the all-silica structure increases by a factor of 1.2 to 1.3 compared to the acidic framework, with a marginal decrease in the activation energy, down to 8.5 and 5.3 kJ·mol−1 for concentrations of 2 and 4 mpuc, respectively.
Zeolite MFI shows a considerable reduction in translational diffusion compared to zeolite Beta, with diffusion coefficients lower by factors between 20 and 40 for the acidic structure and between 10 and 30 for the all-silica framework.
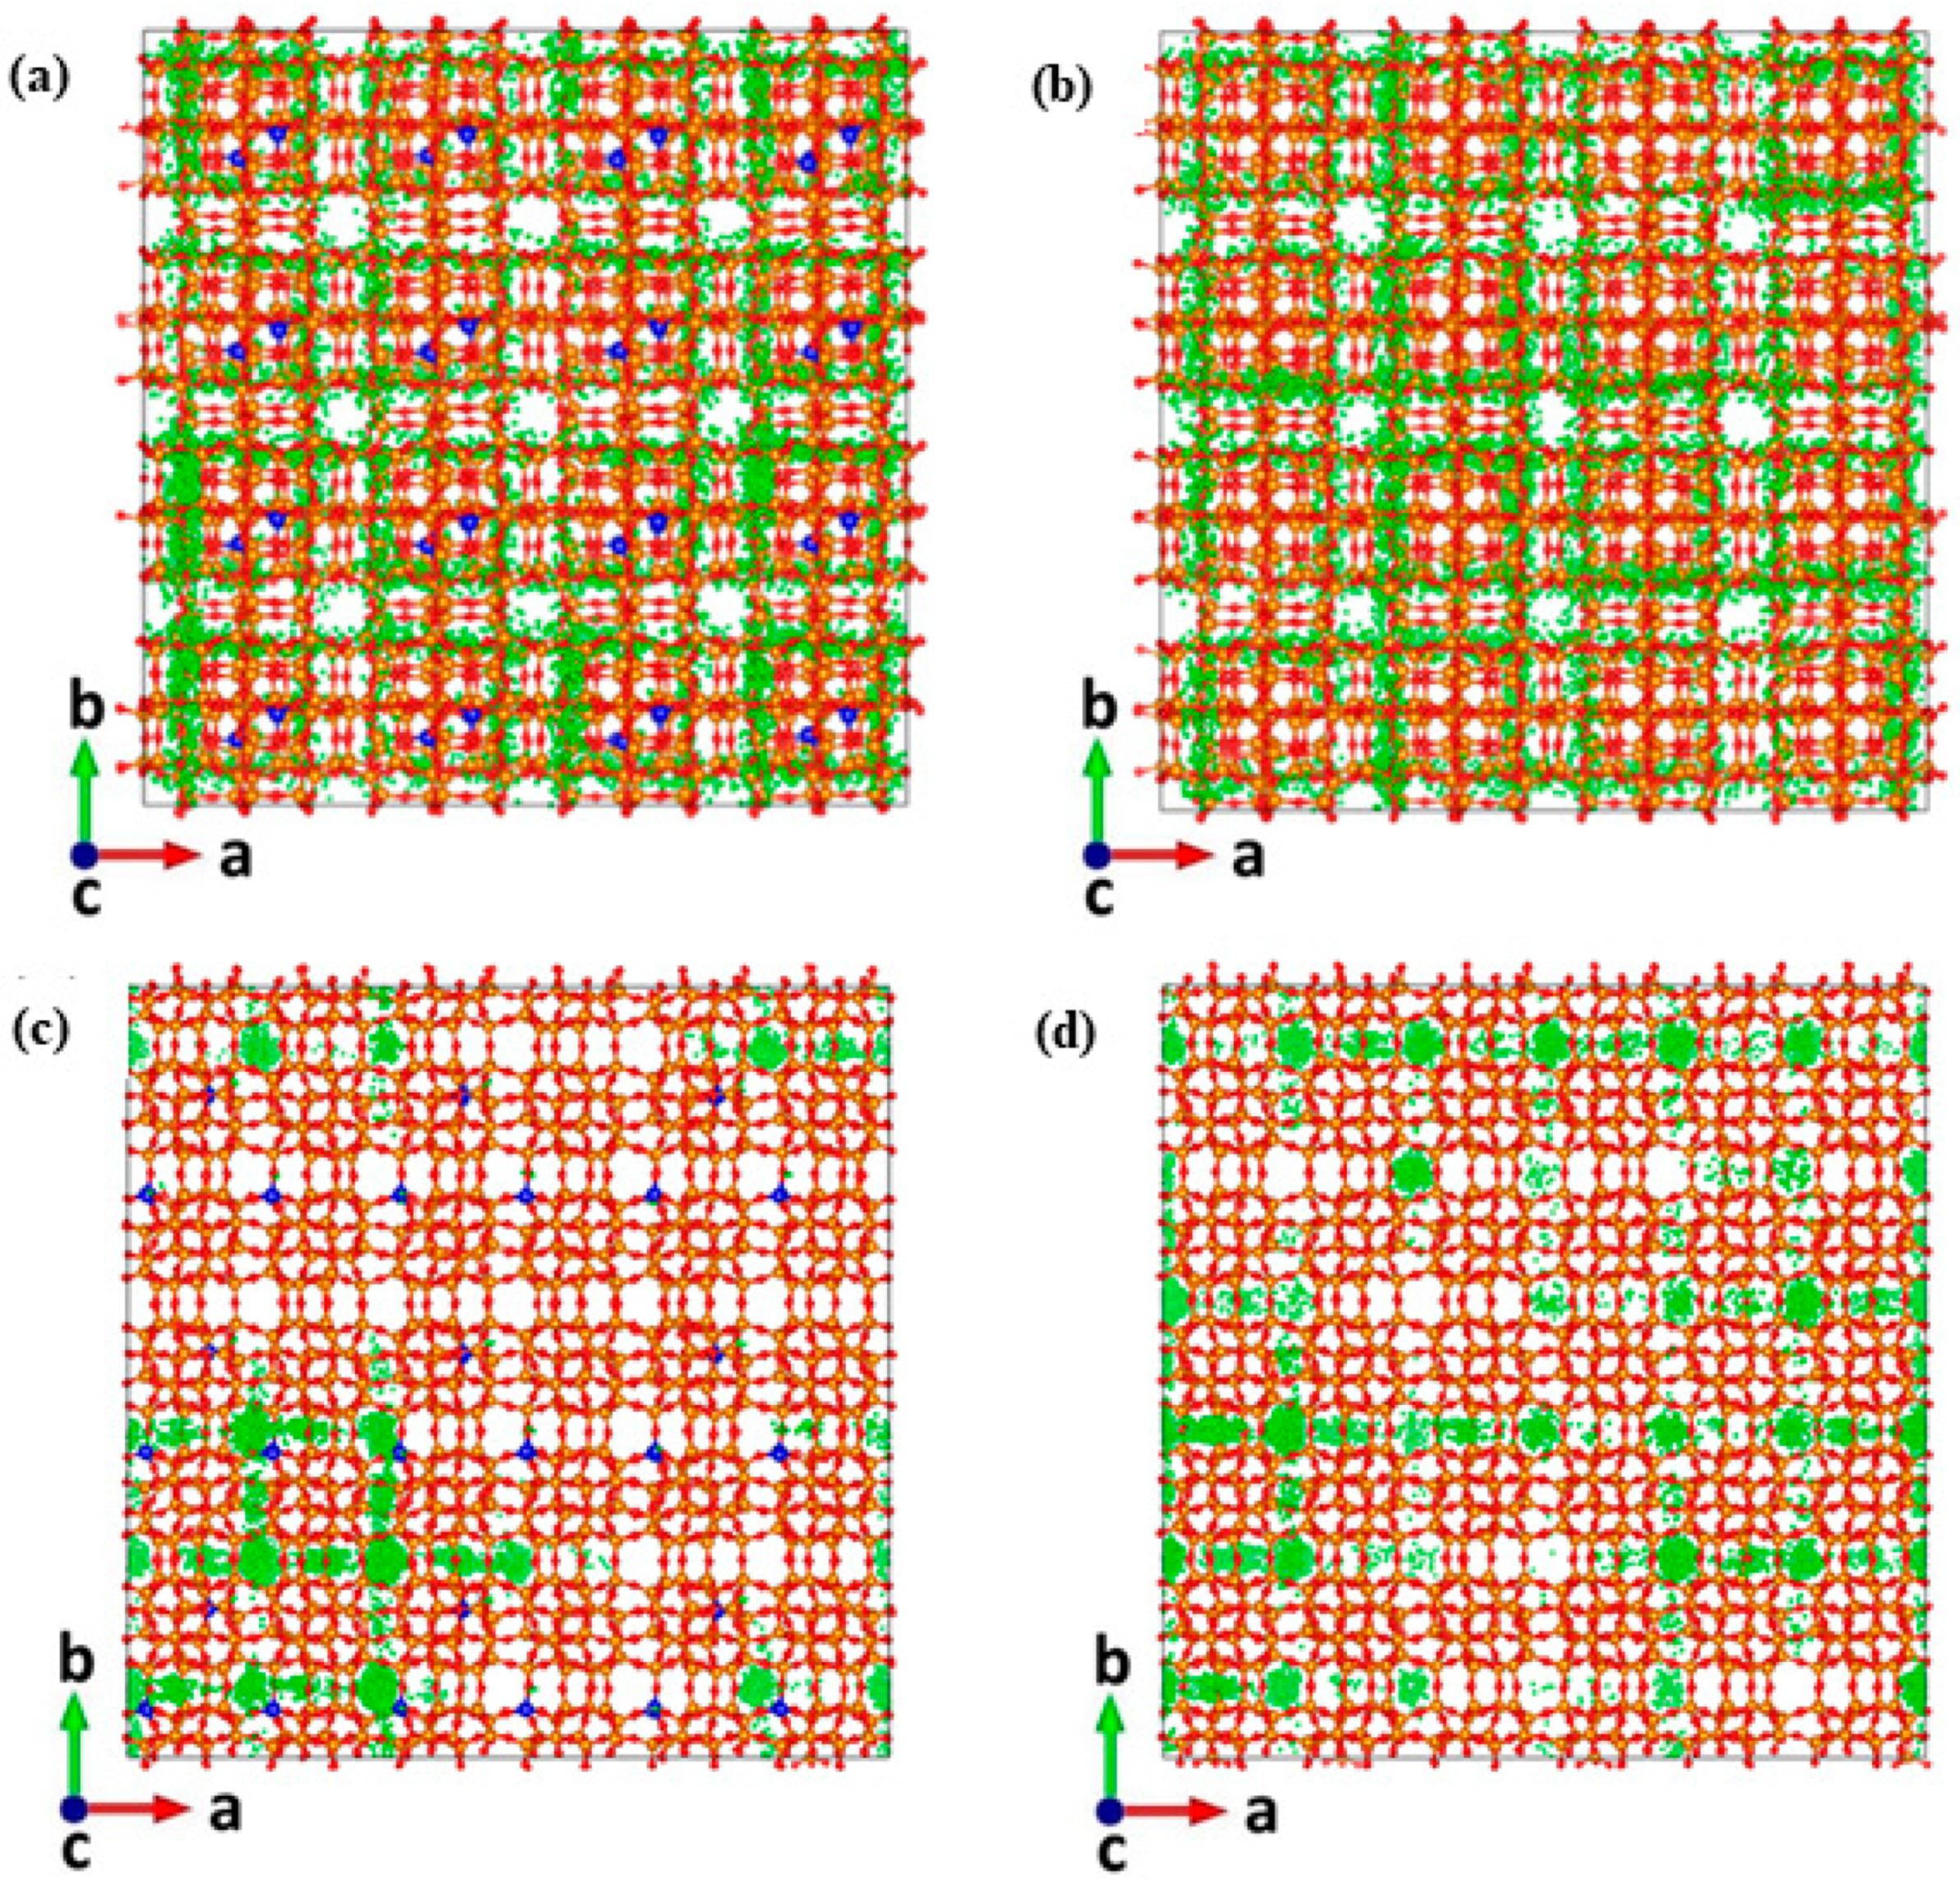
This observation is a direct consequence of the reduction of the pore size in zeolite MFI, with a dimension of 10 MR compared to zeolite Beta, which features 12 MR pore windows. Thus, the methanol agglomeration is more pronounced in MFI, which affects more markedly the H-bonding interactions between methanol and the acidic protons. The effect of the micropore dimension can be observed clearly in the trajectories of randomly selected molecules at 473 K, as shown in Figure 2. In zeolite Beta, the molecule covers practically all the micropore volumes, irrespective of whether the zeolite is in its acidic or all-silica form. In the 10 MR pores of zeolite MFI, the methanol movement is highly reduced where Brønsted acid sites are present, showing less hindered diffusion in the all-silica structure. It is worth noting that the localized motion of the methanol molecules in the spherical intersections of the straight and sinusoidal channels, even in all-silica zeolite MFI, is consistent with recent quasielastic neutron scattering (QENS) observations [18].
We observe that for a concentration of 3 mpuc and at a temperature of 373 K, the diffusion coefficient in acidic MFI can be as low as 3.4 × 10⁻¹⁰ m2s−1, increasing to 9.7 × 10⁻¹⁰ m2s−1 for the highest probed temperature of 473 K similar to other diffusion studies for methanol in zeolite HY [32]. This variation yields an activation energy of 15.4 kJ·mol−1. When the molecular loading is increased to 5 mpuc in acidic MFI, the coefficients decrease by factors of between 1.5 and 1.8 as a direct consequence of higher molecular agglomeration, although the activation energy of diffusion is reduced from 15.4 kJ·mol−1 for 3 mpuc to 13.0 kJ·mol−1 for 5 mpuc. This behavior is in contrast to the all-silica MFI framework, where the activation energy of diffusion increases with the concentration of methanol, from 4.3 to 9.5 kJ·mol1, as shown in Table 1. It has been reported previously that when the molecular concentration increases, re-adsorption events at the acid sites play a more prominent role than molecular agglomeration in the variation of the diffusion barrier in acidic zeolite; it is in the all-silica structure where molecular agglomeration has a more determining impact [33]. These trends are explained by first considering that methanol adsorbs preferentially at the acid sites in the acidic zeolites Beta and MFI, where the molecule resides for most of the simulation time, as shown in the MD trajectories of Figure 2. The micropore volume covered by the diffusion of each molecule is hence much lower compared to the all-silica structure, and therefore an increment in molecular loading will not notably affect a translation that is already strongly reduced by the H-bonding interaction with the acidic protons. This effect does not occur in the all-silica MFI framework, where the methanol molecules roam more freely in the supercell, but they are primarily located within the intersections of the channels without a preferential adsorption site; consequently, additional molecules will more clearly disrupt their diffusion, which explains why the diffusion barrier increases with concentration in the all-silica zeolite MFI. We also have to consider the re-adsorption of methanol at the acid sites [34]. At the lowest concentration of 3 mpuc, more acidic protons are freely available for a methanol molecule to re-adsorb when the H-bonding interaction with a current acid site is broken; therefore, re-adsorption events will reduce the diffusion and yield a higher energy barrier. When the number of freely available sites is decreased as a consequence of the increase in molecular concentration, re-adsorption is less probable, hence having a less significant impact on the energy barrier. Accordingly, the activation energy of diffusion decreases in acidic zeolites Beta and MFI as the concentration of methanol increases. This trend should hold as long as the acid sites are not saturated by methanol molecules, in which case agglomeration should start to play a more important role [33]. It is apparent that the larger pores of zeolite Beta, which exert less steric hindrance on the relatively small methanol molecules, diminish the effects of molecular agglomeration in its all-silica framework, since its diffusion barrier decreases from 8.5 to 5.3 kJ·mol1 with the increase of the molecular concentration.
The importance of the pore dimension in the catalytic activity of zeolites cannot be over-stated, as product selectivity is highly dependent on the size and arrangement of the microporous system. Zeolite MFI is distinguished by 10 MR channels, and it is known to be more selective toward C5–C6 carbon chains, with reduced preference for aromatics in the MTH process. Observed coefficients for the translational diffusion of methanol in ZSM-5 from both nuclear magnetic resonance [35] and quasi-elastic neutron scattering methods [36] have yielded values within the range of 2.0–3.5 × 10⁻¹⁰ m2s−1 at 300 and 335 K respectively, which are in agreement with the values calculated in this work for similar temperatures (see Table 1). In contrast, high methanol mobility is observed for zeolite Beta, which presents a larger pore diameter of approximately 6.7 Å [37]. Zeolite Beta generally shows higher diffusion coefficients for methanol with selectivity toward aromatics as the intra-crystalline porosity significantly increases the access to acid sites, hence improving the conversion rate and selectivity for aromatic compounds [38,39].
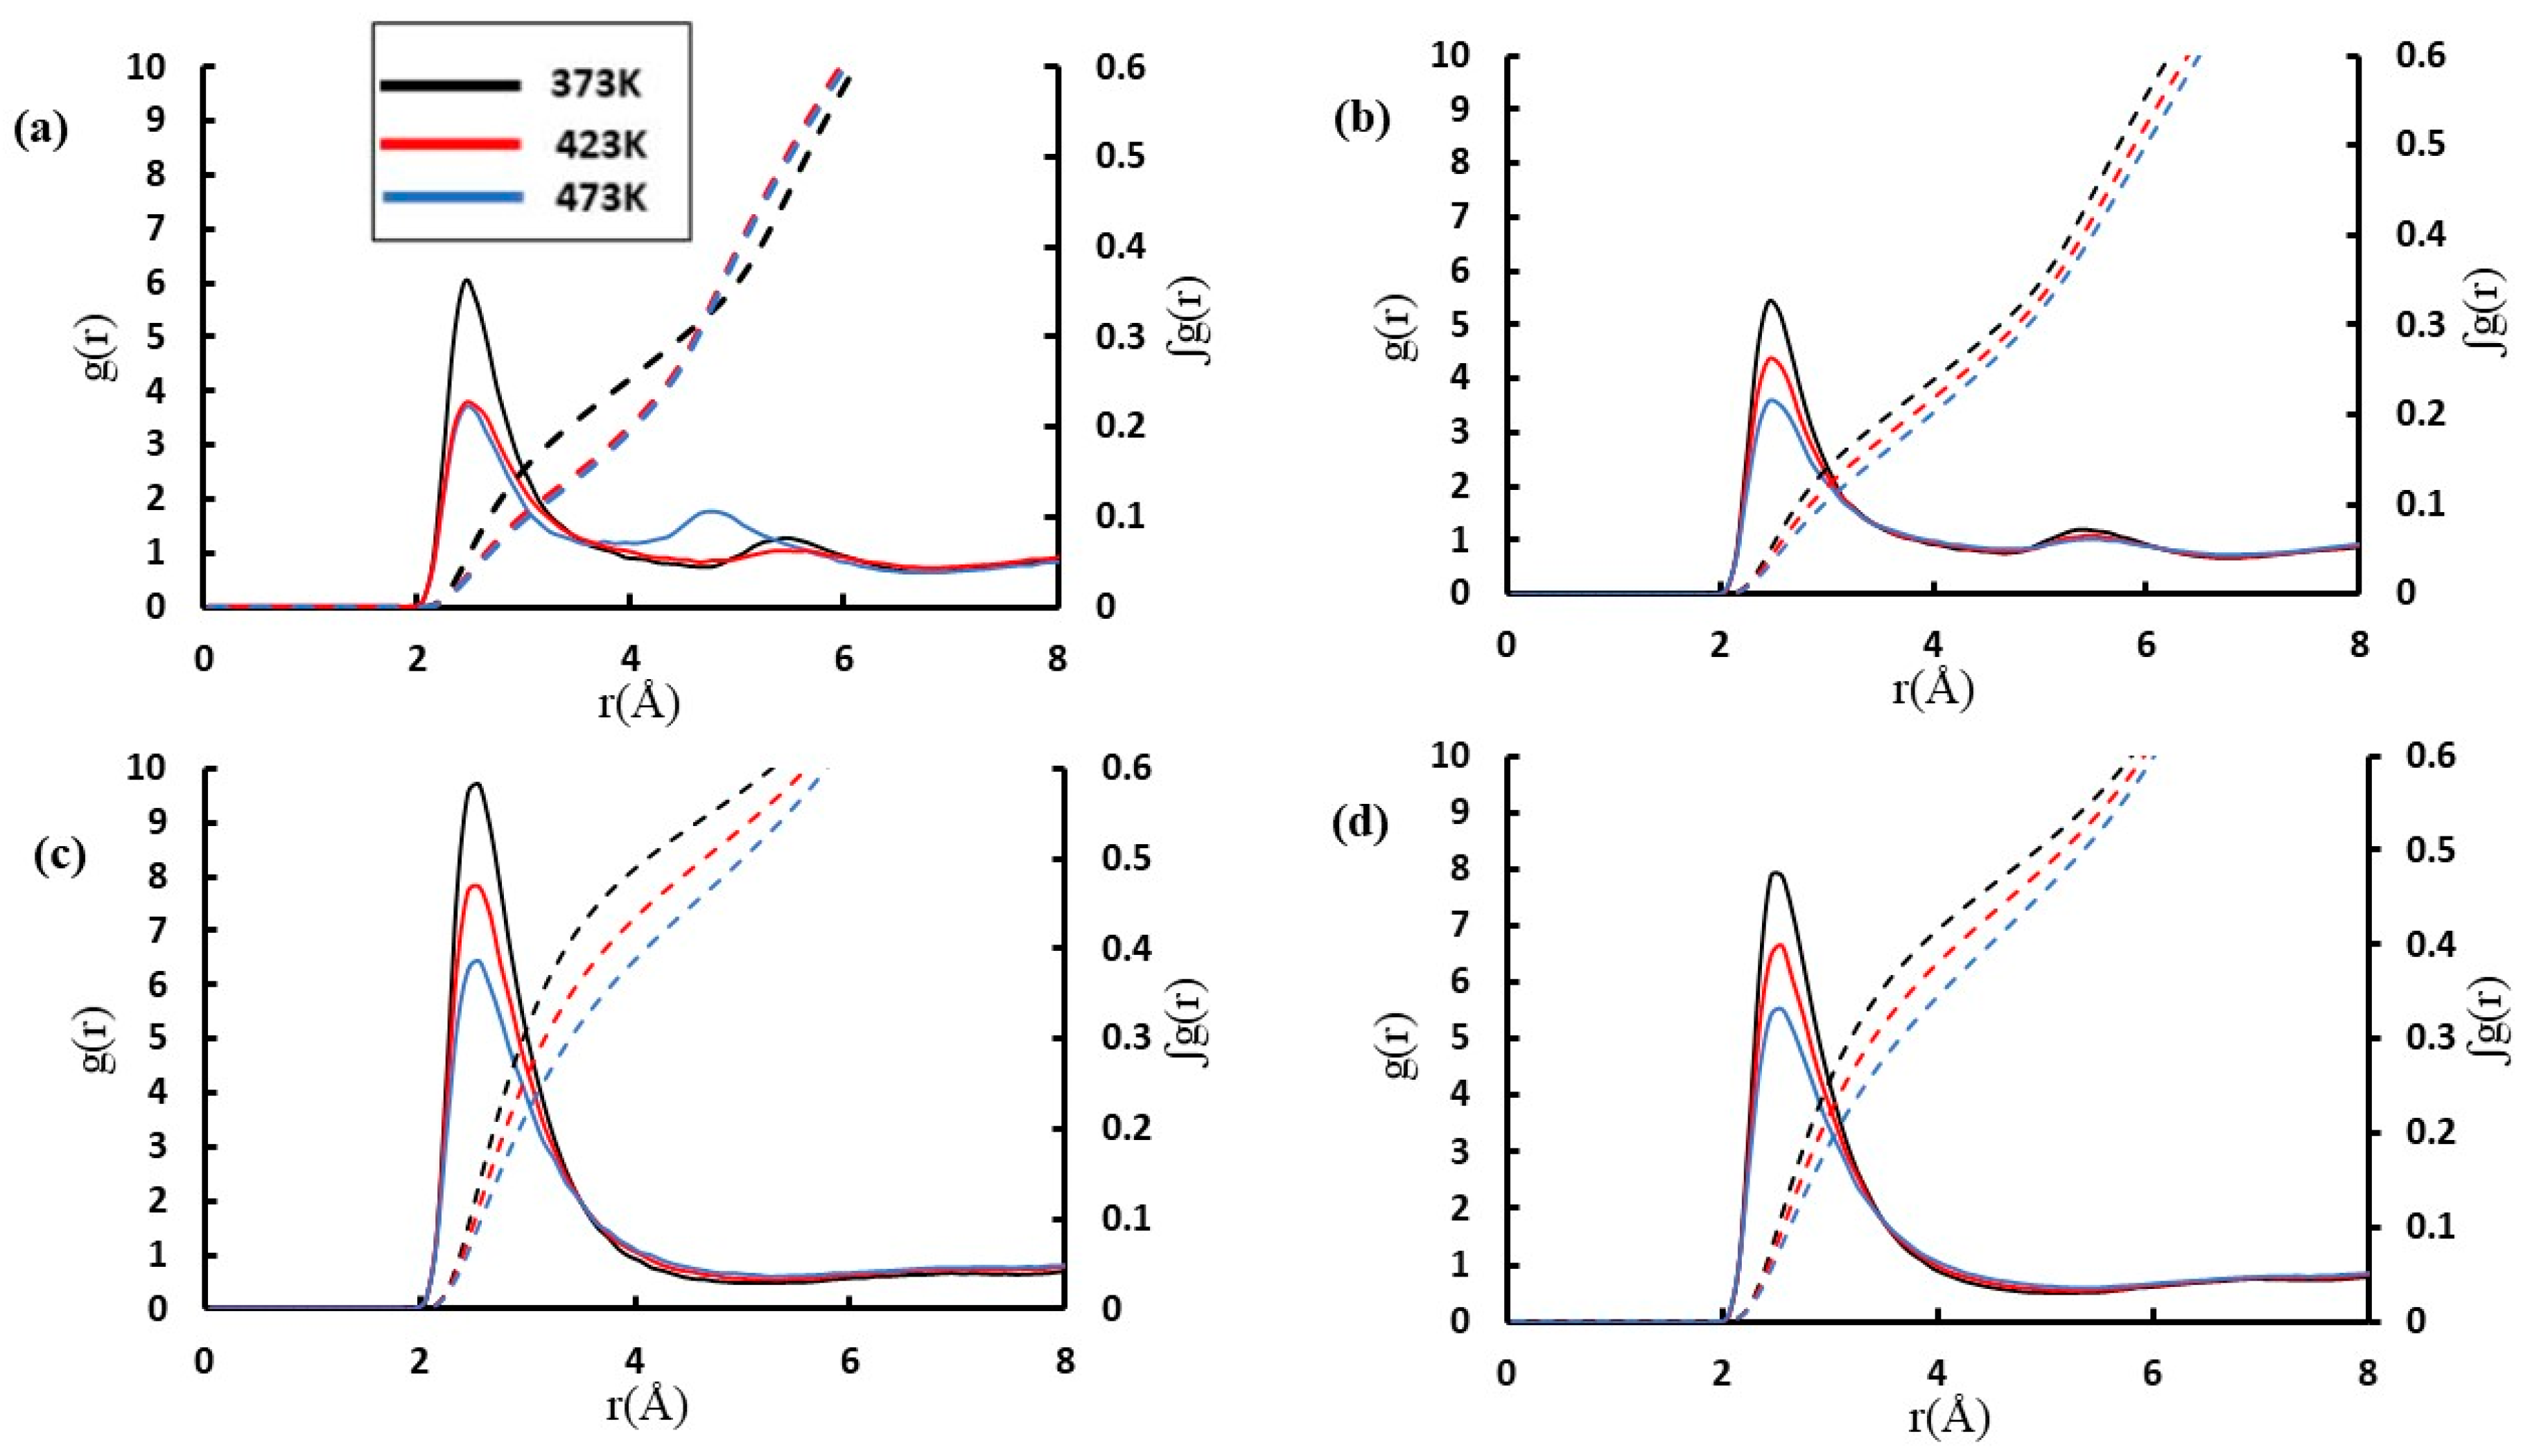
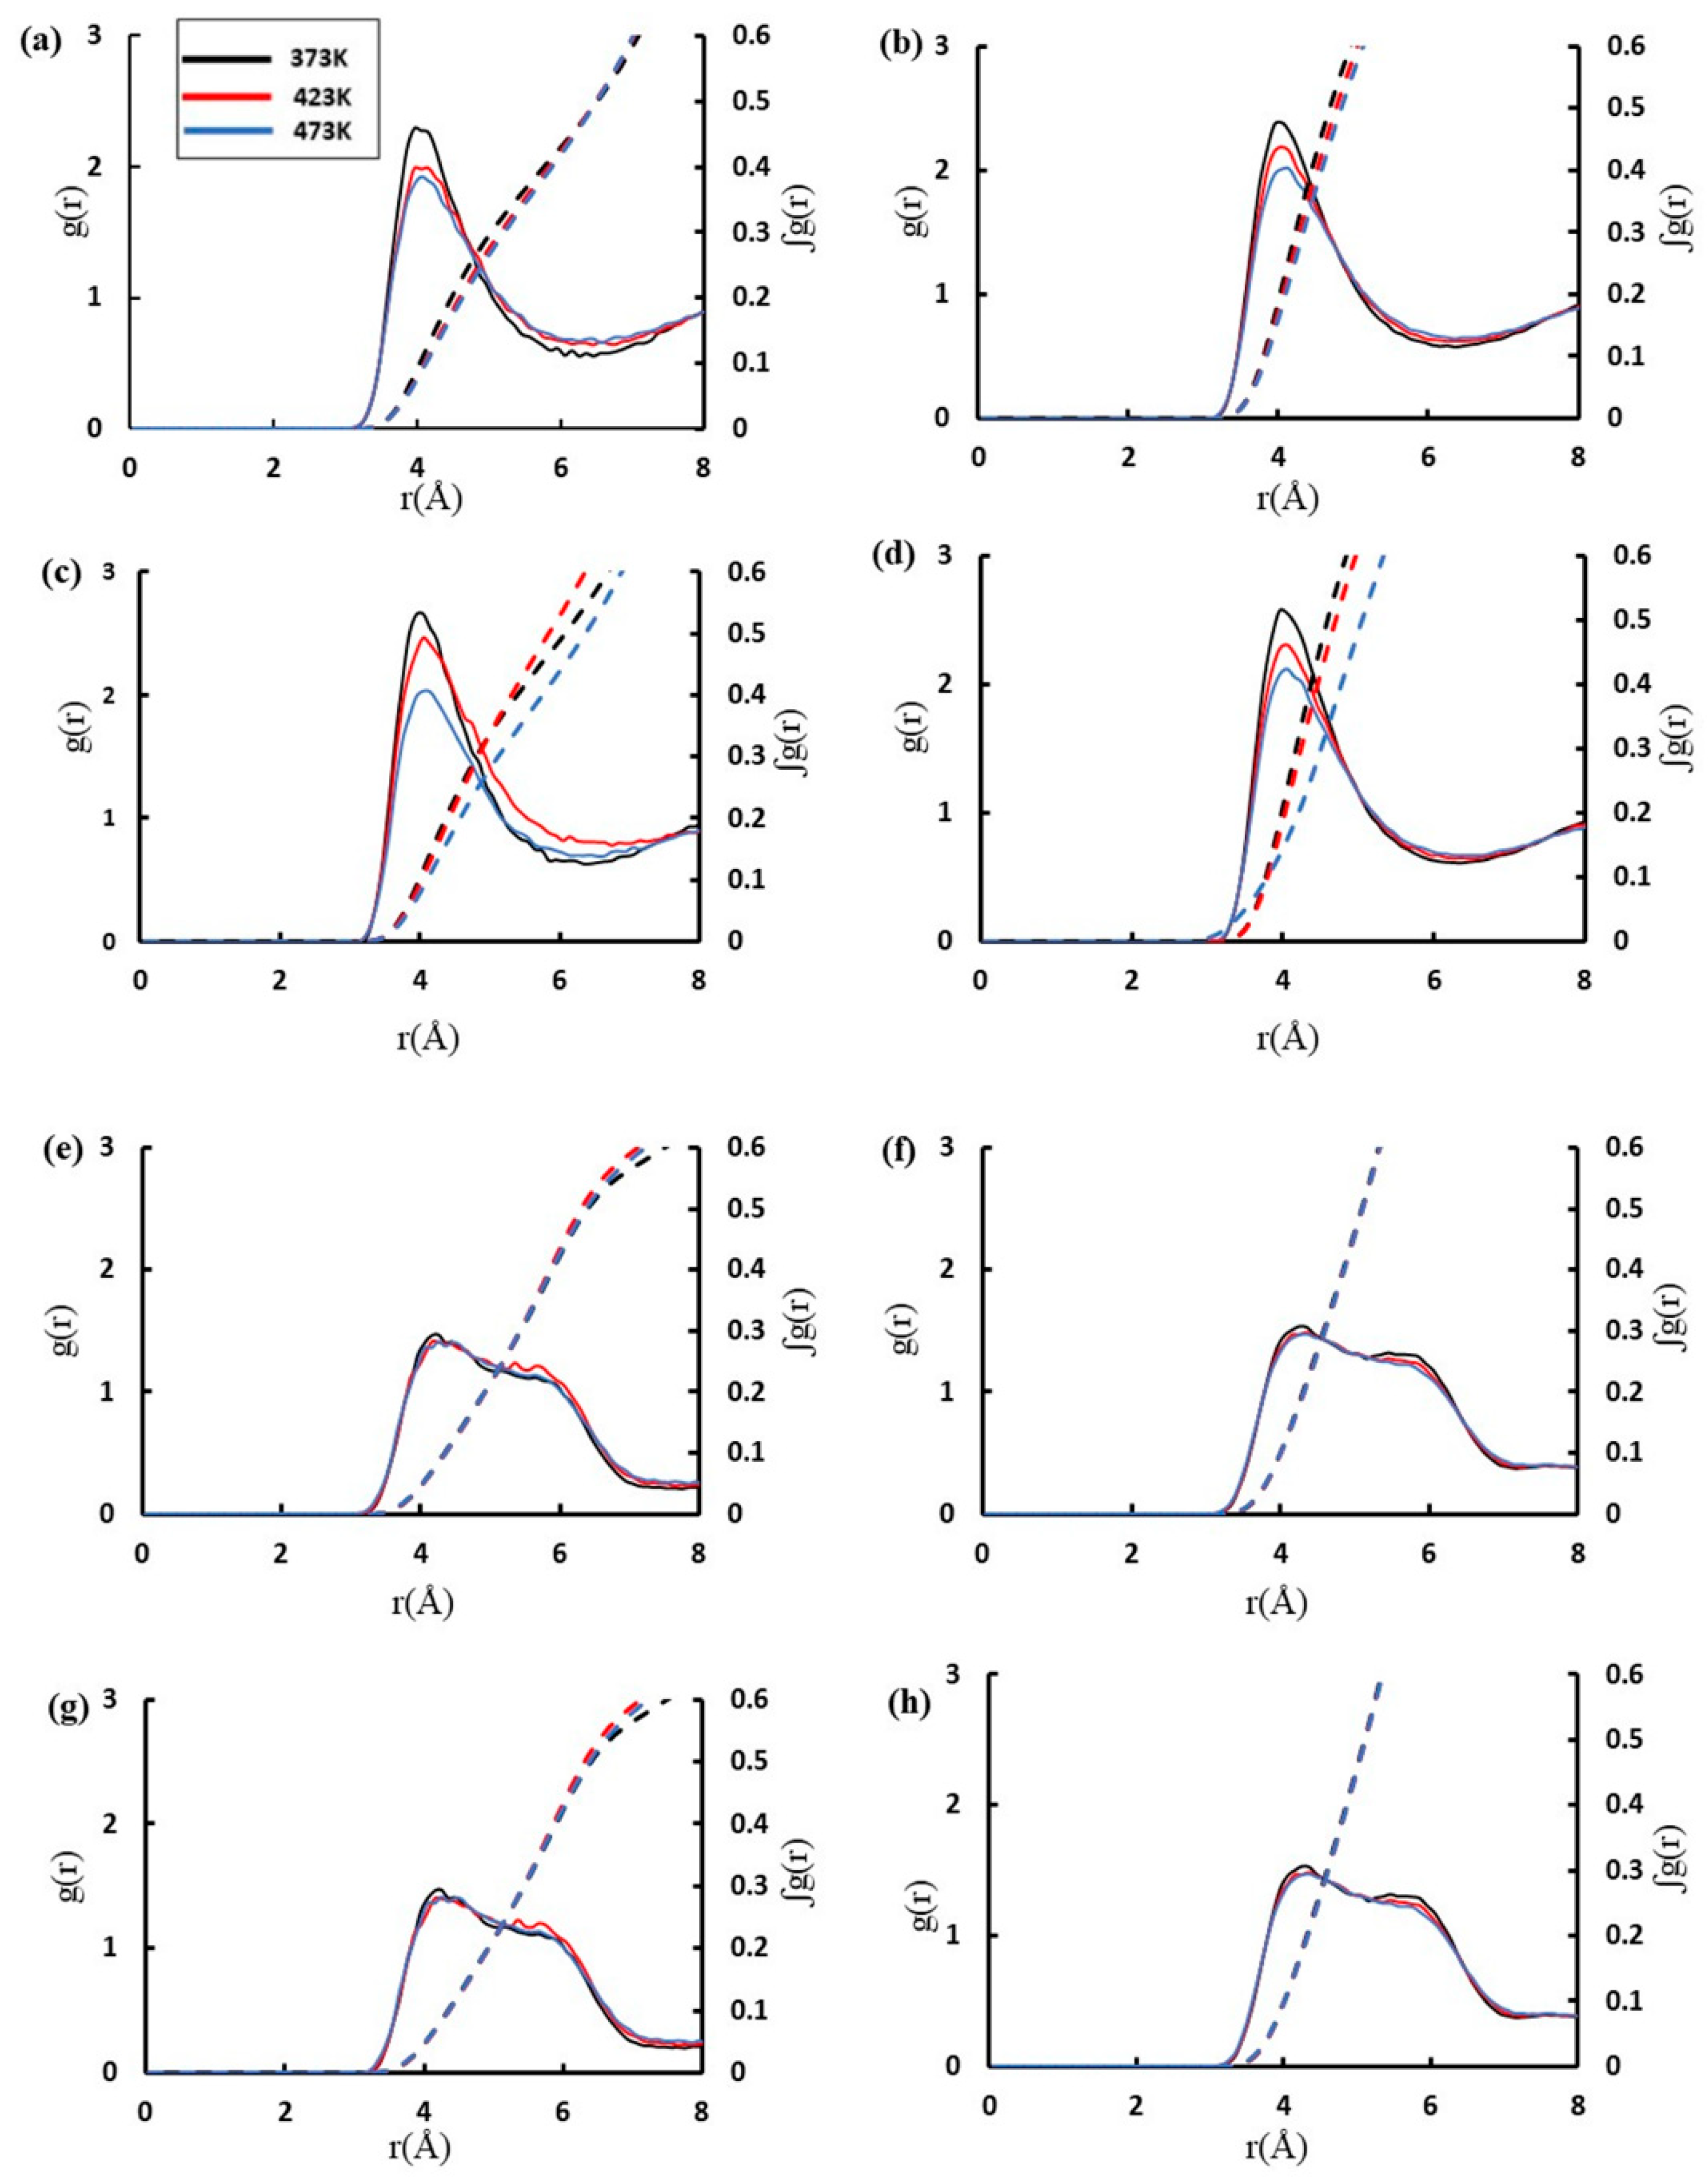
From the analysis of the MSD plots, we can conclude that methanol has a higher protonation probability in zeolite MFI compared to zeolite Beta. This analysis can be expanded further by examining the radial distribution function (RDF) and their integrals for the atomic pair formed by the acidic proton and the oxygen atom of the methanol molecule (*Om, Ha), as shown in Figure 3. The integration of the RDFs adds information with regard to the number of atoms within the coordination sphere. In Beta zeolite, a narrow and intense peak is observed at an *Om---Ha distance of 2.6 Å, whose intensity is reduced as the temperature increases. Minor peaks can also be detected within the region from 4.0 to 6.0 Å. In comparison, zeolite MFI shows a similar profile, but the intensity of its peak around 2.5 Å is higher. In fact, although this peak also diminishes as the temperature increases, it is as intense at 473 K in zeolite MFI as it is at 373 K in zeolite Beta, which highlights the higher protonation probability of methanol in the 10 MR structure. The molecular confinement in the micropore system plays a critical role in strengthening the H-bonding interaction between the catalyst and the adsorbed molecule [26]. This can be corroborated further by considering the average residence time τ of methanol molecules within a distance of 3.5 Å from the acidic proton (plots are available in the Supplementary Data Figure S1) (see Table 2). In zeolite Beta, τ shows a maximum value of about 3 ps for a concentration of 2 mpuc and a temperature of 373 K; the residence time decreases to values of approximately 2 ps at the temperatures 423 and 473 K. As expected, in zeolite MFI, methanol spends almost twice as much time engaged in H-bonding interactions with the acidic protons when compared to zeolite Beta, with τ values between 5 and 6 ps for a loading of 3 mpuc at 373 K, becoming steadily smaller for higher temperatures, down to a value of 2–3 ps for 473 K. However, although a higher retention time is a factor in defining the catalytic performance in the MTH reaction, it also increases the probability of secondary reactions, for instance the formation of coke, which is detrimental to the lifetime of the catalyst [40,41].
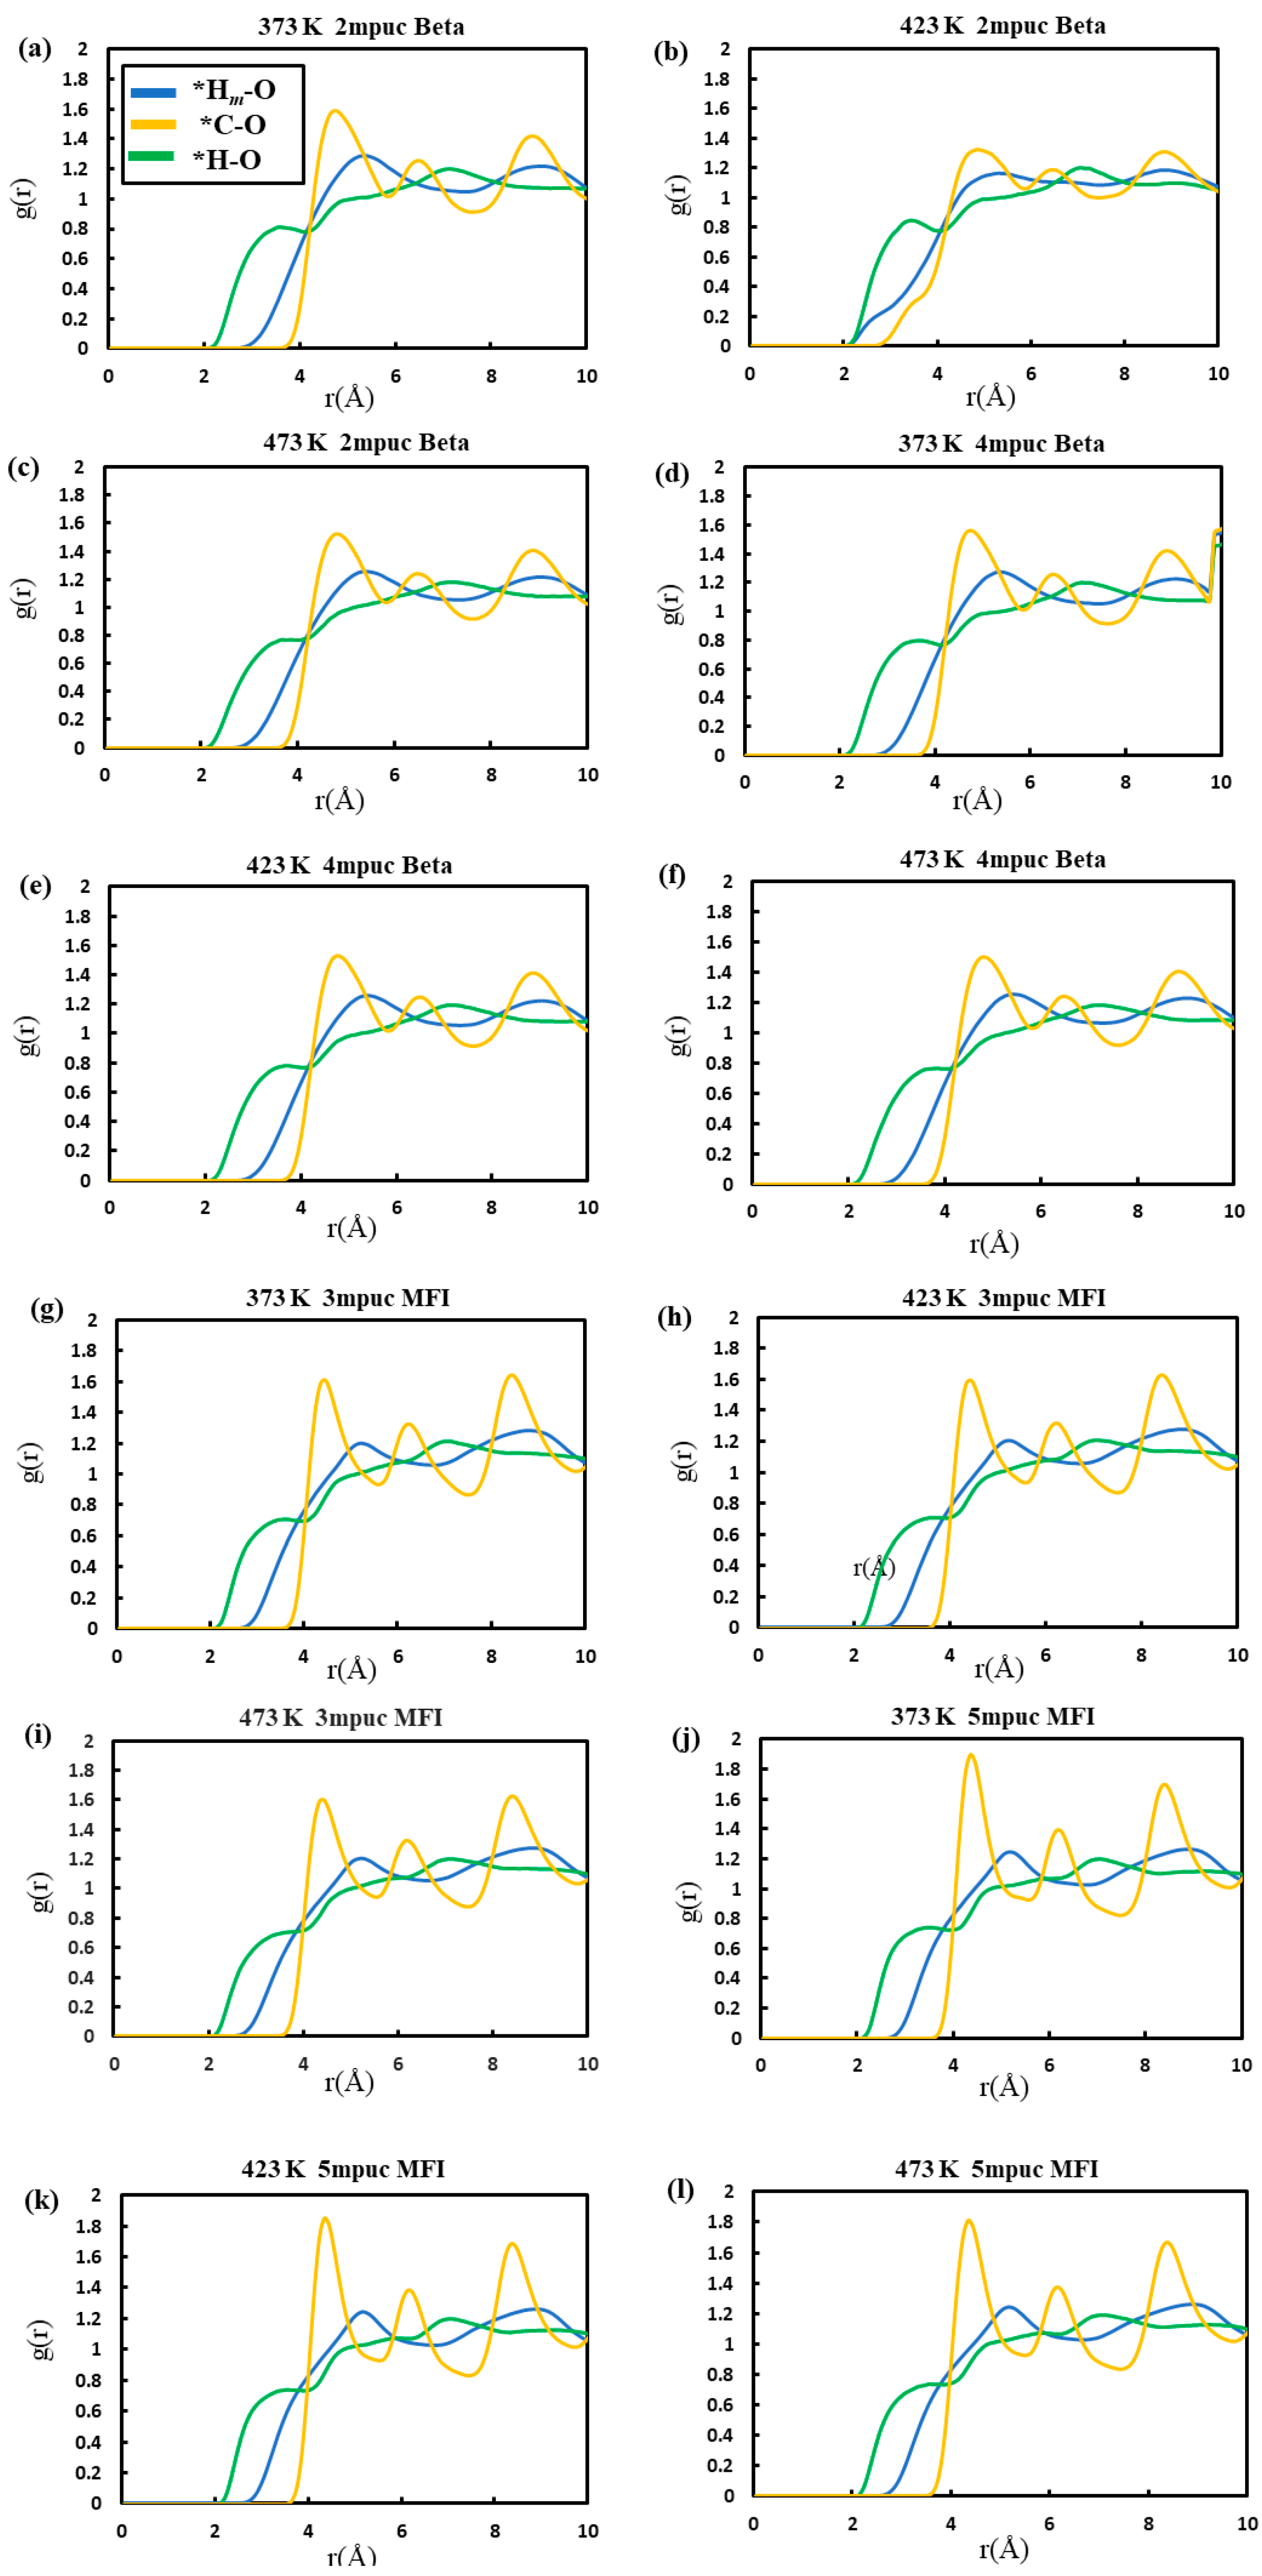
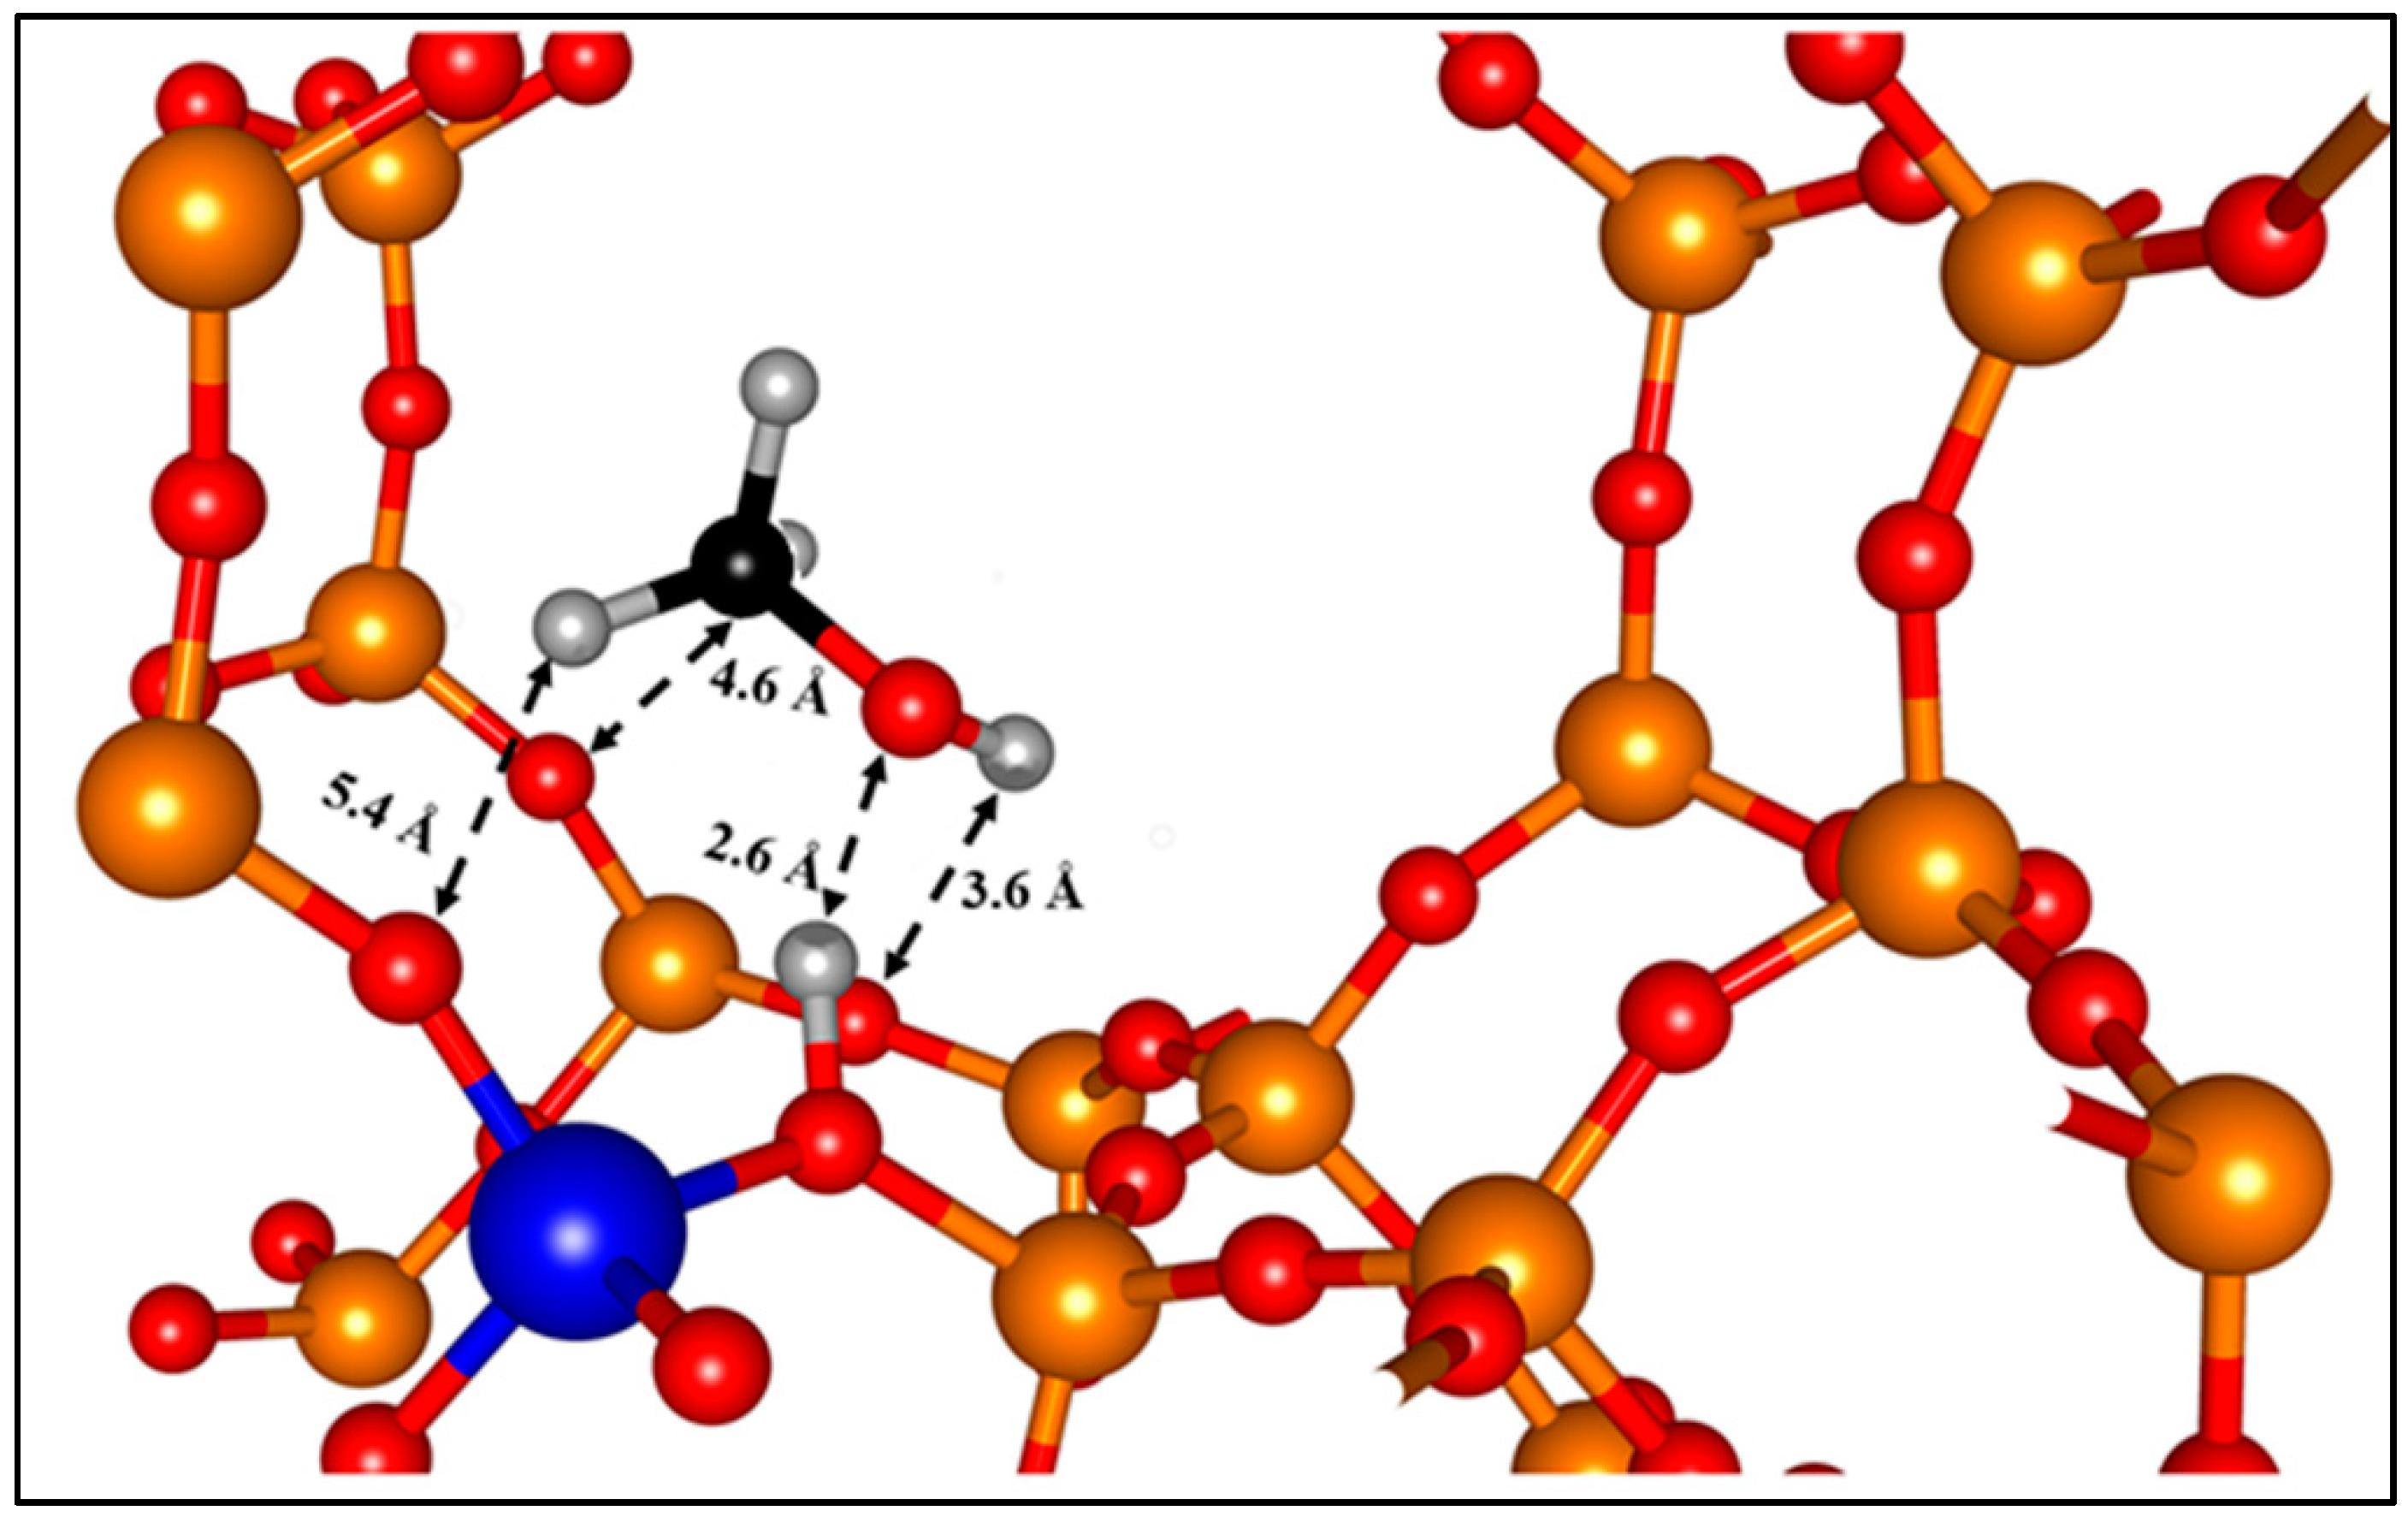
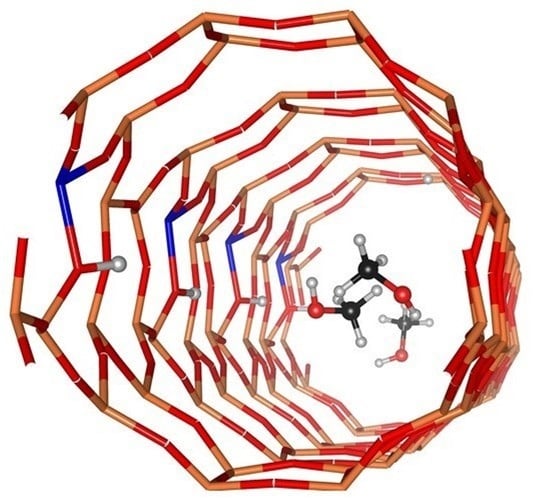
Some experimental studies have suggested that framework methoxy species are the starting point for the C-C bond formation in MTH reactions, giving much relevance to the methanol–acidic proton interaction [22,42]. Many variations in the proposed mechanism for MTH stem from the different orientations that the methanol molecule can assume during adsorption and protonation [43]. Once the methanol is H-bonded to the acidic proton, its methyl group can either point to the centre of the pore (end-on configuration) or lean toward the framework O atoms in the vicinity of the acid site (side-on configuration). Density functional theory (DFT) studies on the different methanol adsorption complexes formed at Brønsted acid sites have shown that methanol is adsorbed at the acid site preferably through the end-on adsorption mode, which shows higher thermochemical stability. However, the side-on adsorption configuration directly precedes the dehydration step leading to the cleavage of the C-O bond in methanol, followed by the methoxylation of the zeolite [21]. The RDFs of four atomic pairs are examined in order to elucidate the predominant methanol adsorption complex in both zeolites Beta and MFI, as seen in Figure 4. In the case of zeolite Beta, the atomic pair formed by *Om from the hydroxyl OH end of methanol and the acidic proton Ha of the zeolite framework (*Om, Ha) shows an intense peak at an *Om---Ha distance of 2.6 Å, which we have already discussed earlier in this section. Additionally, three distinct peaks are observed for the atomic pairs composed of the carbon atom *C of the methanol and the non-acidic framework O at (*C, O) distances of 4.6, 6.4, and 8.5 Å. Each peak represents the methanol *C interaction with the three nearest neighboring framework O atoms to the Brønsted acid site. Furthermore, the pair formed by methyl hydrogen *H and the non-acidic oxygen O of the zeolite (*H, O) shows two peaks at the distances 5.4 and 9.1 Å. This is expected, as the spatial arrangement of the three methyl *H atoms will always cause one of them to be closer to the non-acidic framework O relative to the other two, hence producing two peaks. The RDF profiles also show the pair *Hm from the hydroxyl of methanol and the non-acidic O of the framework (*Hm, O), which yields what appears to be three overlapping peaks of low intensities at distances of 3.6, 5.1, and 7.2 Å. The typical end-on adsorption mode is characterized by a primary H-bond *Om---Ha and a secondary H-bond interaction *Hm---O while the side-on adsorption complex can be described by a single H-bond *Om---Ha [44]. The observed peak intensities for the atomic pair (*Hm, O) suggest very weak interactions between the *Hm atom and the non-acidic O atoms of the zeolite, matching the description of a side-on configuration. In Figure 5, we have created an illustrative image to depict the side-on adsorbed methanol, with average distances for the selected atomic pairs (*Om, Ha), (*C, O), (*H, O), and (*Hm, O) based on our RDF analysis. Similar trends are observed in zeolite MFI, although significantly higher signals are recorded for each of the selected atomic pairs at approximately the same distances, indicating higher occurrence of side-on configuration. Thus, our analysis demonstrates higher susceptibility for methoxylation in zeolite MFI compared to zeolite Beta. As a general observation, the peak intensities for atomic pairs (*Om-Ha) and (*C-O) decrease with increasing concentration and temperature in zeolite Beta. Zeolite MFI displays similar trends, except that the peak observed for the (*C-O) atomic pair becomes rather more intense as the methanol concentration increases. The observed peaks for the pairs (*H, O) and (*Hm, O) exhibit very little change when either the temperature or loading is varied. These results are confirmed by data from hybrid DFT calculations of active species in ZSM-5 for the MTH process [45], which report on the transient nature of the side-on conformations, leading to methanol dehydration. This provides insight into geometry transitions that take place during proton abstraction and the sequential methoxylation of the zeolite frameworks during the MTH process.
The RDF for the atomic pair formed by the carbon atoms of two different methanol molecules (*C, *C) provides valuable information concerning the molecular clustering inside the micropore system, as shown in Figure 6. We have discussed the impact of the micropore size on the protonation probability of methanol, which also extends to the molecular clustering. The RDF profile of zeolite Beta shows an intense peak at approximately 4.1 Å, with a lesser signal above 8.0 Å. In comparison, zeolite MFI shows what seems to be two overlapping signals of lower intensity within a *C–*C distance region between 4.0 and 7.0 Å. Therefore, we can conclude that the larger pore size in zeolite Beta allows a more intense clustering of the methanol molecules. We have observed that the retention time of methanol by the acidic protons is reduced in both zeolites when the methanol concentration is increased, which means that a higher number of molecules adsorbed in the systems disrupts more easily the interaction with the acid sites due to more frequent methanol–methanol contacts.
The methanol–methanol interactions have a significant impact on the adsorption, desorption, and diffusion characteristics of methanol. XRD reports show that at high loadings, methanol clusters of side-on adsorption conformation up to 6 molecules are formed at the intersections of channels in ZSM-5, where the free space diameter (≈10 Å) is approximately twice the channel diameter [46]. Larger clusters of methanol molecules in zeolite MFI should be more weakly bound, and their occurrence may be limited to channel intersections, which explains its overlapping RDF peaks and lower integration numbers observed for the atomic pair (*C, *C) as seen in Figure 6. In contrast, zeolite Beta, whose 12 MR channels allow for stronger methanol–methanol interactions, exhibits more intense methanol clustering with relatively higher integration numbers compared to zeolite MFI. These findings may be of further relevance when considering the mixed diffusion of methanol with other polar molecules that are also involved in the MTH, such as dimethyl ether, ethanol, and water. Under industrially significant conditions, water is used as a regulatory tool for methanol diffusivity, based on the relatively higher polarity of water causing an increase in molecular clustering [47]. Ultimately, methanol clustering facilitates proton transfer from Brønsted acid sites to create methoxonium ions, due to the increased H-bonding interactions from multiple methanol molecules. This may result in an almost barrier-less reaction step for methanol dehydration in the MTH process.

3. Method

3.1. Models

Zeolite framework types MFI and Beta are selected for this study. Zeolite Beta is characterized by interconnected, 3-dimensional 12-membered ring (12 MR) channels with tetragonal P4122 symmetry, while MFI has 10 MR channels, which are also 3-dimensionally interconnected, and an orthorhombic Pnma symmetry [48,49]. Both all-silica and acidic frameworks are employed in this study, which allows us to determine the effect of the acid sites on the diffusion of methanol. The unit cell of zeolite Beta with lattice parameters a = 12.46 Å, b = 12.46 Å, and c = 26.22 Å is subjected to an expansion to a 4 × 4 × 2 system, leading to a supercell size of approximately 50 Å. The unit cell of MFI, with lattice parameters a = 20.07 Å, b = 19.69 Å and c = 13.34 Å, is replicated to create a 3 × 3 × 4 supercell of approximately 60 Å.
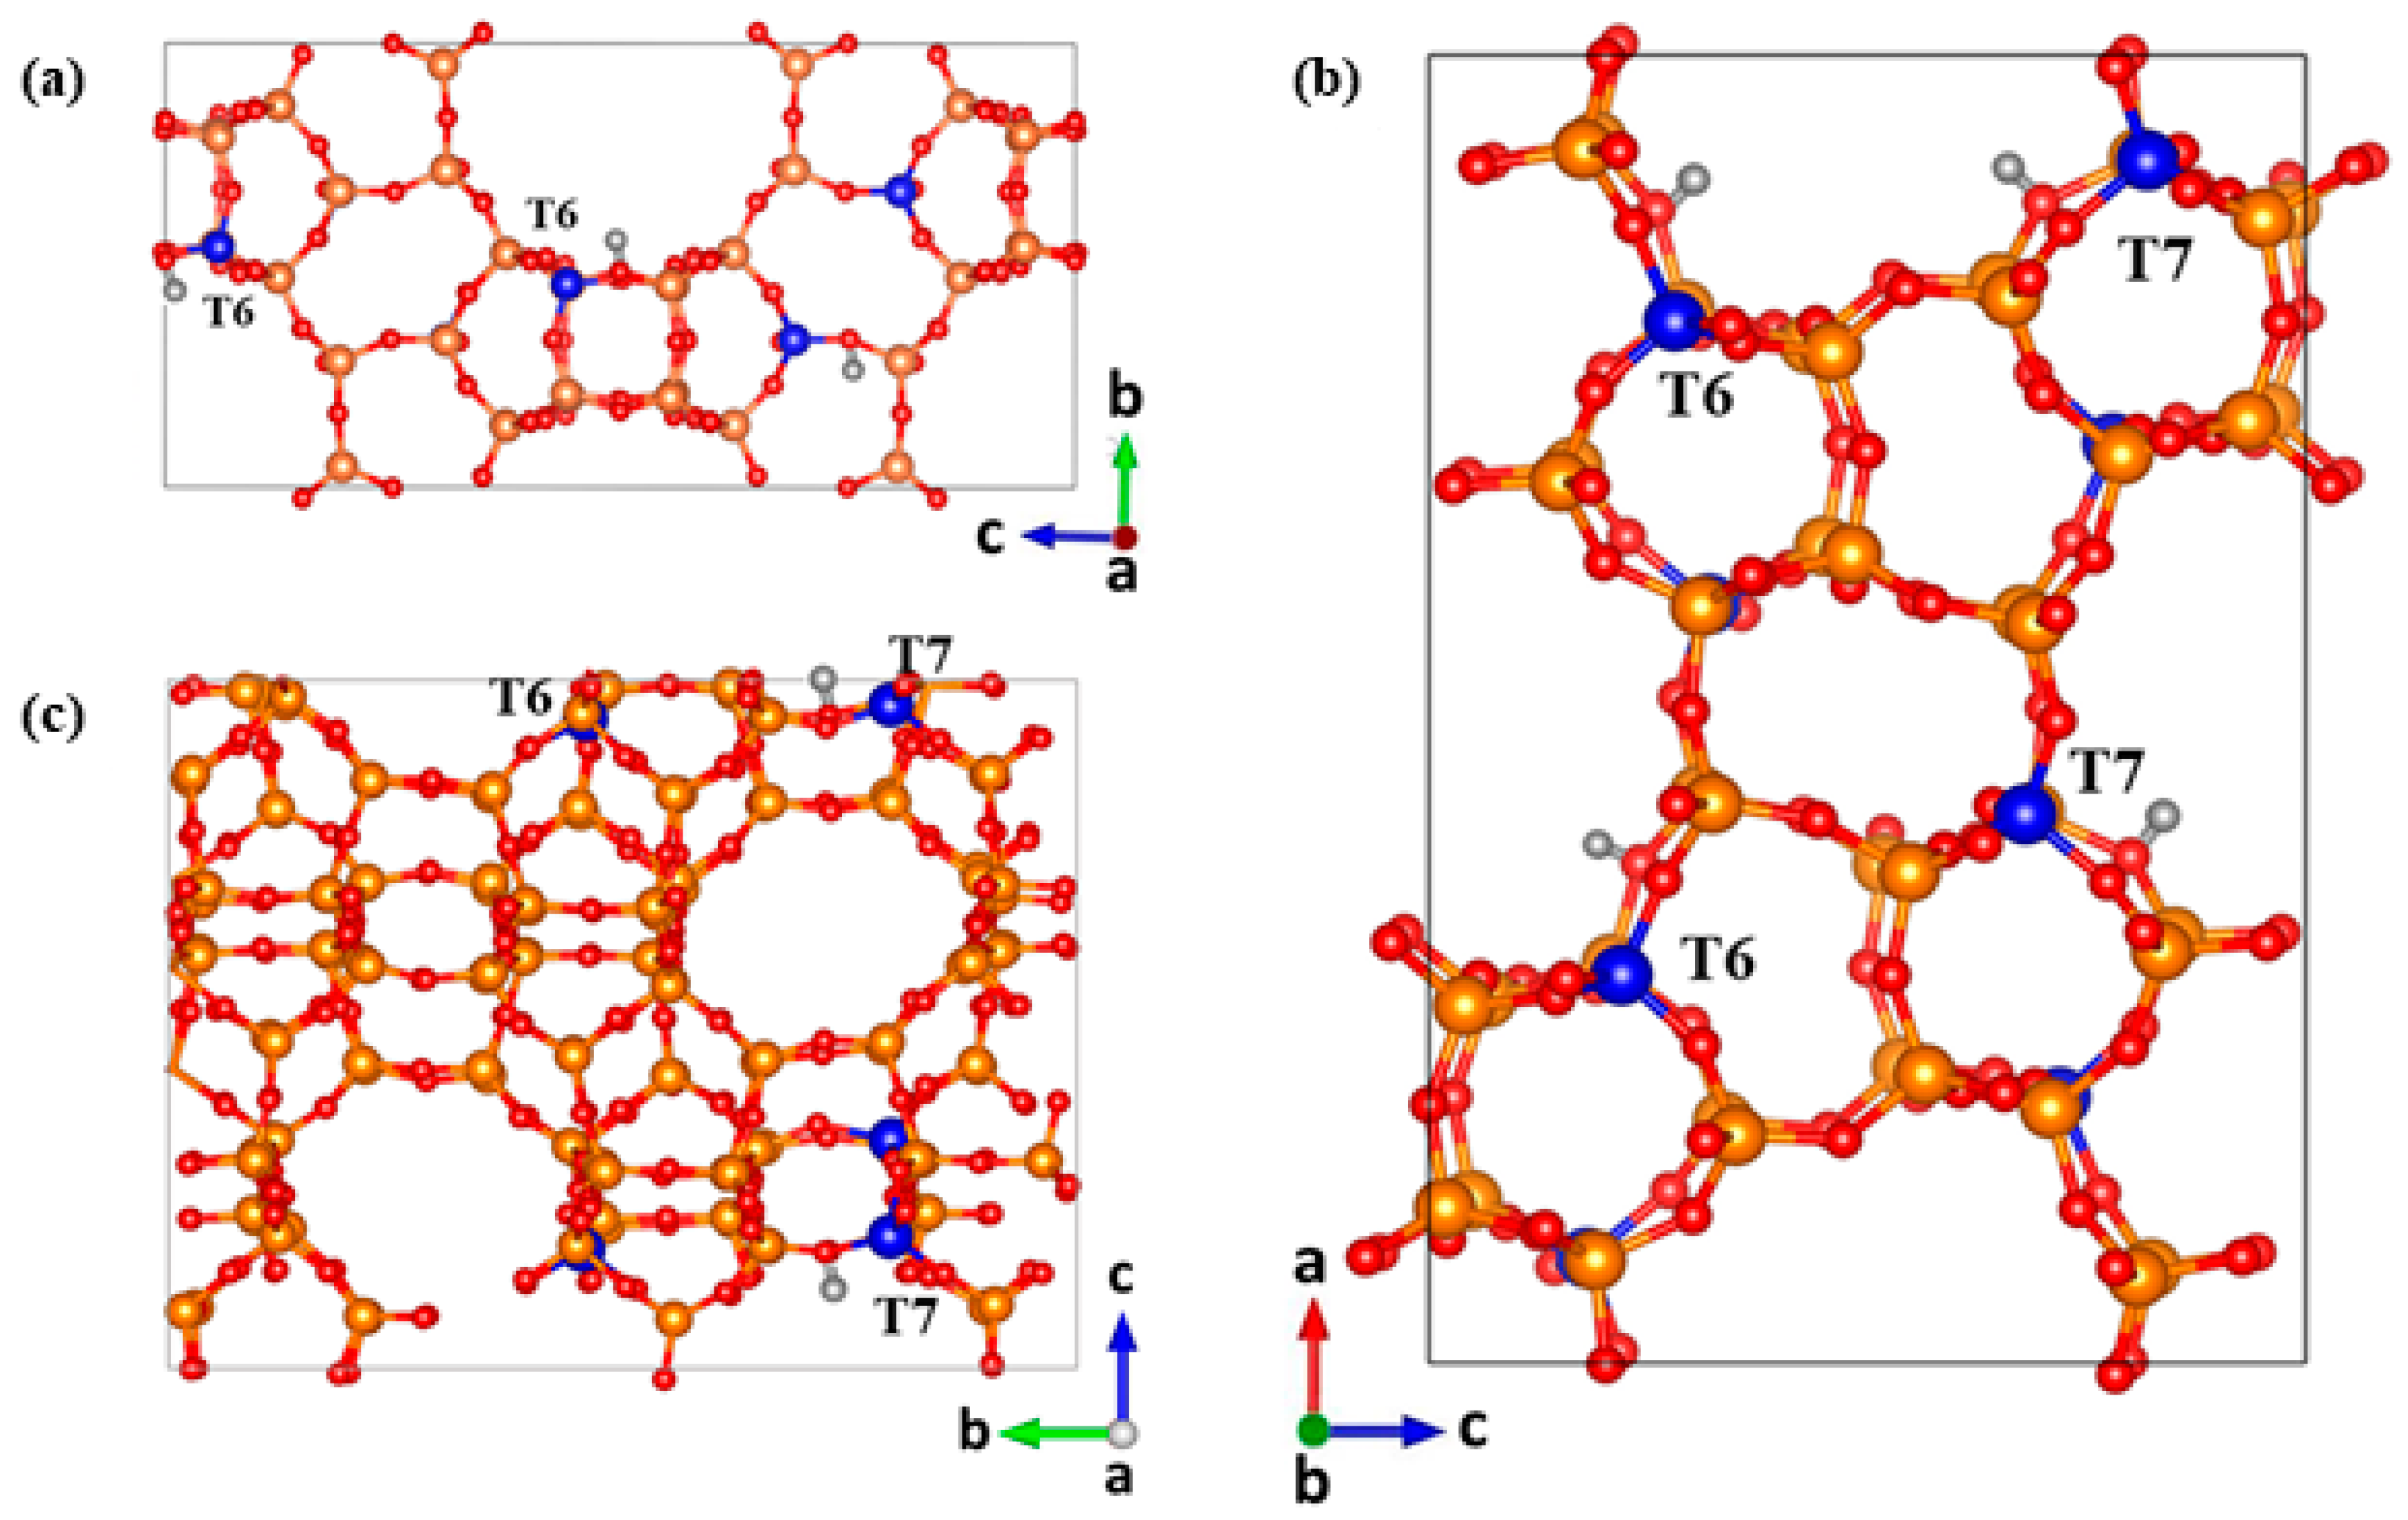
The micropore system of the MFI framework is characterized by sinusoidal channels, running along the a direction, in addition to straight channels, which are aligned parallel to the b direction, plus the intersections between sinusoidal and straight channels. In the present work, we have replaced a number of Si by Al and placed the acidic protons in such a way that each of these structural features is represented in the model. The Al substitution in the sinusoidal channel takes place at the T7 site, binding the acidic proton to the oxygen O18. The site T7 is also used for the straight channel, but this time binding the proton to the oxygen O17. The intersection region is covered by replacing Si by Al at site T6, with the proton bound to O13. Unlike zeolite MFI, the framework of zeolite Beta has the same straight 12 MR channels along the a and b directions, requiring substitution only at the tetrahedral site T6, as shown in Figure 7. A Si/Al ratio of 31 is employed for both zeolites, with the acid sites having an adequate spatial separation consistent with Dempsey’s rule [50].

3.2. Interatomic Potentials

The Born model of ionic solids, which uses a series of energy equations to describe the interactions between ions, is employed in the description of the zeolite structures and adsorbates [51]. The charges for methanol were obtained by a Mulliken population analysis of ab initio DFT calculations by Blanco and Auerbach [52]. These parameters were scaled by Plant and associates [53] to attain a more polarized methyl group corresponding to methanol at acidic sites in zeolite frameworks. Methanol intramolecular harmonic potentials for covalent bonds, angles, and dihedrals were determined using ab initio DFT calculation at the quadratic configuration interaction calculation with single and double excitations (QCISD) level of theory to attain the ground state energy and electron density distribution [52]. The data obtained were in good agreement with results from electron diffraction [54] and millimeter-wave spectroscopic analysis of methanol [55]. The selected Lennard–Jones potentials listed in Table 3, which describe the methanol–methanol interactions, are empirically fitted values from the consistent valence force field (CVFF) [56] to reproduce diffusion coefficients similar to that of liquid-phase methanol [57].
The zeolite atoms Si, Al, and non-acidic O are assigned formal charges +4.00, +3.00, and −2.00 respectively, with fractional charges of −1.426 for the acidic oxygen bridging Si and Al atoms (labelled Oa) and +0.426 for the proton of the Brønsted acid site (labeled as Ha). Buckingham potentials are used to describe the short-range interactions between the atomic pairs Si-O, O-O and Al-O based on parameters reported by Sanders et al. [58] and Catlow et al. [59], while the bridging hydroxyl group is represented by a Morse potential derived by Schroder and collaborators [55]. Three-body harmonic potentials are utilized to describe the bends of the angles O-Si-O, O-Al-O, O-Si-Oa, and O-Al-Oa(labeled as O-T-O). The full set of potentials is listed in Table 4.
Table 5 shows the Lennard–Jones potentials employed to represent the dispersion forces involved in the methanol–zeolite interactions. These parameters originate from a combination of studies from Shubbin and associates [60] on the diffusion of iso-butanol in H-ZSM-5 and methanol diffusion in all-silica faujasite from Blanco and Auerbach’s work [52]. The potentials employed in this work have been applied extensively in previous studies of micro- and meso-porous materials and have been shown to accurately describe the adsorption behavior in zeolites [61,62,63,64].

3.3. Simulations

All simulations are carried out with the DL_POLY 4.0 code [65]. Visualizations and plots for this study are constructed using visualization for electronic and structural analysis (VESTA) and visual molecular dynamics (VMD) [66,67]. The MD simulations are initiated by an equilibration, which is conducted first under an NVE ensemble over 2 ns, followed by 2 ns employing an NVT ensemble. Afterward, the production run consists of 12 ns of an NVE ensemble. A time step of 0.5 fs is used in the simulation, saving the atomic coordinates every 1 ps. The simulations are carried out at the temperatures 373, 423, and 473 K. The Berendsen thermostat is applied to regulate the temperature during the equilibration with the NVT ensemble, with a time constant of 1 ps [68]. Two different loadings of methanol molecules are employed to analyze the effect of the molecular concentration on the diffusion. At the lower loading, 64 and 93 methanol molecules are adsorbed in the supercells of zeolites Beta and MFI, i.e., 2 and ≈3 mpuc, respectively, while a twofold increase is used for the higher concentrations, i.e., 128 and 186 molecules, resulting in 4 and ≈5 molecules per unit cell, respectively. For each loading, the two zeolites both have the same ratio between the number of molecules and the volume of the supercell. The multiple initial times t0 method is employed to average the trajectory from a total of 12 ns of production run into 1 ns, shifting the initial time t0 every 30 ps. This allows a reduction in statistical noise that may be generated in the mean square displacement (MSD) plots. The MSD plots allow the determination of self-diffusion coefficients (Ds) from the Einstein relationship:
D s   =   1 6 lim t d d t [ r ( t ) r ( 0 ) ] 2 .
The calculated activation energies for diffusion are subsequently determined using the Arrhenius equation:
l n ( D s )   =   l n ( A ) E a k b
where kb is the Boltzmann constant and A is a pre-exponential factor. The value of activation energy Ea is derived from the slope of the linear regression obtained from the plot of ln(Ds) vs. 1 T . The good linearity observed in the MSD plots demonstrates that 1 ns is enough to achieve true self-diffusion. Radial distribution function (RDF) plots are used to elucidate the average kinetic relationship between the adsorbate and the zeolite framework, which allows an easy identification of H-bonding.
The contact correlation function C(t) between methanol and the acidic proton is calculated with the following equations:
C ( t )   =   1 N i   =   1 N p i ( t ) n i ( t o ) n i ( t 0 )
p i ( t )   =   n i ( t 0 ) t 0 t n i ( t )
where N is the total number of methanol molecules. The function ni(t) acquires the value of 1 if methanol is within a chosen distance from the acidic proton (in the present work, we use a cut-off of 3.5 Å) or it equals 0 otherwise. Function C(t) provides the probability of finding methanol near the acidic proton at time t if the molecule was in this region at times t0 and t − Δt. The residence time tr is calculated from the integration of the function C(t):
t r   =     0 C ( t ) d t .
When C(t) displays an exponential decay, it can be expressed as C(t) = et/τ, which allows to equal tr to τ [69].

4. Conclusion

We have used molecular dynamics simulations for an in-depth investigation of methanol diffusion in zeolites MFI and Beta. Measurements at temperatures of between 373 and 473 K yielded diffusion coefficients within the range of 2.0–10.0 × 10⁻¹⁰ m2s−1 for acidic zeolite MFI, with coefficients of two orders of magnitude larger in zeolite Beta, suggesting greater methanol mobility in the larger microporous system of zeolite Beta. The activation energy of translational diffusion was calculated for both zeolites, giving values in acidic zeolite MFI of between 13.0 and 15.4 kJ·mol−1, compared to zeolite Beta with values of between 6.0 and 8.0 kJ·mol−1. The analysis of methanol diffusion in the all-silica zeolites indicates that the presence of acid sites results in a significant reduction in methanol diffusion, especially in zeolite MFI. Examination of the MSD and RDF plots showed a higher probability of methanol protonation in zeolite MFI, whereas zeolite Beta exhibited lower peak intensities between the hydroxyl O atom of the methanol molecule and the protons of the Brønsted acid sites. Considering the atomic pairs (*Om, Ha), (*C, O), (*H, O), and (*Hm, O), the side-on adsorption configuration was determined to be the most likely methanol conformation in both zeolites, with zeolite MFI displaying higher occurrence. Methanol clustering was shown to be more prevalent in zeolite Beta, due to its 12 MR channels that offer less confinement, hence resulting in more frequent methanol–methanol interactions. This study demonstrates the performance of 10-membered channels against larger-pore zeolites, which contributes to the elucidation of micro-catalytic processes involved in methanol dehydration and the MTH reactions.

Supplementary Materials

The following are available online at https://www.mdpi.com/2073-4344/10/11/1342/s1, Figure S1: Plots of contact auto-correlation function for the H-Beta (a) 2 mpuc with (b) 4 mpuc and H-MFI (c) 3 mpuc with (d) 5 mpuc models calculating the residence time of methanol molecules at the Brønsted acid site. The curves represent the exponential fitting for the simulation data.

Author Contributions

C.H.B. performed the molecular dynamics simulations and data analysis and with C.H.-T. has written the paper. A.J.O., N.Y.D., and C.H.-T. contributed to the simulation set-up and data analysis. N.H.d.L. led on the research and study design and R.T. and E.A. contributed to the scientific discussion of the results. All authors have read and agreed to the published version of the manuscript.

Funding

The authors acknowledge the UK Natural Environment Research Council (N.H.d.L.: grant no. NE/R009376) and the Royal Society and the UK Department for International Development for funding under the Africa Capacity Building Initiative (ACBI), which have supported this research. We also acknowledge funding from the UK Engineering and Physical Sciences Research Council (N.H.d.L.: grant no. EP/K009567; N.Y.D.: grant no. EP/S001395/1).

Acknowledgments

We thank Prof. Richard Catlow for valuable discussions. A.J.O would like to acknowledge Roger and Sue Whorrod for the funding of a Whorrod Fellowship. Computing resources of the Advanced Research Computing @Cardiff (ARCCA) Division were used for the calculations in this work.

Conflicts of Interest

The authors declare no conflict of interest.

References

  1. Arcoumanis, C.; Bae, C.; Crookes, R.; Kinoshita, E. The potential of di-methyl ether (DME) as an alternative fuel for compression-ignition engines: A review. Fuel 2007, 87, 1014–1030. [Google Scholar] [CrossRef]
  2. Arcoya, A.; González, J.A.; Travieso, N.; Seoane, X.L. Physicochemical and Catalytic Properties of a Modified Natural Clinoptilolite. Clay Miner. 1994, 29, 123–131. [Google Scholar] [CrossRef]
  3. Yu, Y.; Li, X.; Su, L.; Zhang, Y.; Wang, Y.; Zhang, H. The role of shape selectivity in catalytic fast pyrolysis of lignin with zeolite catalysts. Appl. Catal. A Gen. 2012, 447–448, 115–123. [Google Scholar] [CrossRef]
  4. Corma, A.; Rey, F.; Valencia, S.; Jordá, J.L.; Rius, J. A zeolite with interconnected 8-, 10- and 12-ring pores and its unique catalytic selectivity. Nat. Mater. 2003, 2, 493–497. [Google Scholar] [CrossRef]
  5. Teketel, S.; Skistad, W.; Benard, S.; Olsbye, U.; Lillerud, K.P.; Beato, P.; Svelle, S. Shape selectivity in the conversion of methanol to hydrocarbons: The catalytic performance of one-dimensional 10-ring zeolites: ZSM-22, ZSM-23, ZSM-48, and EU-1. ACS Catal. 2011, 2, 26–37. [Google Scholar] [CrossRef] [Green Version]
  6. Müller, S.; Liu, Y.; Kirchberger, F.M.; Tonigold, M.; Sanchez-Sanchez, M.; Lercher, J.A. Hydrogen Transfer Pathways during Zeolite Catalyzed Methanol Conversion to Hydrocarbons. J. Am. Chem. Soc. 2016, 138, 15994–16003. [Google Scholar] [CrossRef]
  7. Teketel, S.; Olsbye, U.; Lillerud, K.P.; Beato, P.; Svelle, S. Selectivity control through fundamental mechanistic insight in the conversion of methanol to hydrocarbons over zeolites. Microporous Mesoporous Mater. 2010, 136, 33–41. [Google Scholar] [CrossRef]
  8. Dessau, R.M.; LaPierre, R.B. On the mechanism of methanol conversion to hydrocarbons over HZSM-5. J. Catal. 1982, 78, 136–141. [Google Scholar] [CrossRef]
  9. Chang, C.D.; Lang, W.H.; Smith, R.L. The Conversion of methanol and other O-compounds to hydrocarbons over zeolite catalysts. J. Catal. 1977, 47, 249–259. [Google Scholar] [CrossRef]
  10. Ono, Y.; Mori, T. Mechanism of methanol conversion into hydrocarbons over ZSM-5 zeolite. J. Chem. Soc. Faraday Trans. 1 Phys. Chem. Condens. Phases 1981, 77, 2209–2221. [Google Scholar] [CrossRef]
  11. Olsbye, U.; Svelle, S.; Lillerud, K.P.; Wei, Z.H.; Chen, Y.Y.; Li, J.F.; Wang, J.G.; Fan, W.B. The formation and degradation of active species during methanol conversion over protonated zeotype catalysts. Chem. Soc. Rev. 2015, 44, 7155–7176. [Google Scholar] [CrossRef] [PubMed]
  12. Teketel, S.; Erichsen, M.W.; Bleken, F.L.; Svelle, S.; Lillerud, K.P.; Olsbye, U. Shape selectivity in zeolite catalysis. The Methanol to Hydrocarbons (MTH) reaction. Catalysis 2014, 26, 179–217. [Google Scholar]
  13. Tang, Q.; Xu, H.; Zheng, Y.; Wang, J.; Li, H.; Zhang, J. Catalytic dehydration of methanol to dimethyl ether over micro-mesoporous ZSM-5/MCM-41 composite molecular sieves. Appl. Catal. A Gen. 2012, 413–414, 36–42. [Google Scholar] [CrossRef]
  14. Yang, J.Z.; Chen, Y.; Zhu, A.M.; Liu, Q.L.; Wu, J.Y. Analyzing diffusion behaviors of methanol/water through MFI membranes by molecular simulation. J. Membr. Sci. 2008, 318, 327–333. [Google Scholar] [CrossRef]
  15. Haw, J.F.; Song, W.; Marcus, D.M.; Nicholas, J.B. The mechanism of methanol to hydrocarbon catalysis. Acc. Chem. Res. 2003, 36, 317–326. [Google Scholar] [CrossRef]
  16. Yarulina, I.; Chowdhury, A.D.; Meirer, F.; Weckhuysen, B.M.; Gascon, J. Recent trends and fundamental insights in the methanol-to-hydrocarbons process. Nat. Catal. 2018, 1, 398–411. [Google Scholar] [CrossRef]
  17. Gogate, M.R. New insights into reaction mechanisms of the methanol-to-hydrocarbons (MTH) reactions: The formation of first C–C bond. Pet. Sci. Technol. 2019, 37, 28–37. [Google Scholar] [CrossRef]
  18. Omojola, T.; Silverwood, I.P.; O’Malley, A.J. Molecular behaviour of methanol and dimethyl ether in H-ZSM-5 catalysts as a function of Si/Al ratio: A quasielastic neutron scattering study. Catal. Sci. Technol. 2020, 10, 4305–4320. [Google Scholar] [CrossRef]
  19. Haase, F.; Sauer, J. Ab initio molecular dynamics simulation of methanol interacting with acidic zeolites of different framework structure. Microporous Mesoporous Mater. 2000, 35–36, 379–385. [Google Scholar] [CrossRef]
  20. O’Malley, A.J.; Parker, S.F.; Chutia, A.; Farrow, M.R.; Silverwood, I.P.; García-Sakai, V.; Catlow, C.R.A. Room temperature methoxylation in zeolites: Insight into a key step of the methanol-to-hydrocarbons process. Chem. Commun. 2016, 52, 2897–2900. [Google Scholar] [CrossRef] [Green Version]
  21. Forester, T.R.; Howe, R.F. In Situ FTIR Studies of Methanol and Dimethyl Ether in ZSM-5. J. Am. Chem. Soc. 1987, 109, 5076–5082. [Google Scholar] [CrossRef]
  22. Wang, W.; Buchholz, A.; Seiler, M.; Hunger, M. Evidence for an Initiation of the Methanol-to-Olefin Process by Reactive Surface Methoxy Groups on Acidic Zeolite Catalysts. J. Am. Chem. Soc. 2003, 125, 15260–15267. [Google Scholar] [CrossRef] [PubMed]
  23. Yarulina, I.; Kapteijn, F.; Gascon, J. The importance of heat effects in the methanol to hydrocarbons reaction over ZSM-5: On the role of mesoporosity on catalyst performance. Catal. Sci. Technol. 2016, 6, 5320–5325. [Google Scholar] [CrossRef] [Green Version]
  24. Catizzone, E.; Aloise, A.; Migliori, M.; Giordano, G. Dimethyl ether synthesis via methanol dehydration: Effect of zeolite structure. Appl. Catal. A Gen. 2015, 502, 215–220. [Google Scholar] [CrossRef]
  25. Zhang, M.; Xu, S.; Wei, Y.; Li, J.; Chen, J.; Wang, J.; Zhang, W.; Gao, S.; Li, X.; Wang, C.; et al. Methanol conversion on ZSM-22, ZSM-35 and ZSM-5 zeolites: Effects of 10-membered ring zeolite structures on methylcyclopentenyl cations and dual cycle mechanism. RSC Adv. 2016, 6, 95855–95864. [Google Scholar] [CrossRef]
  26. Rojo-Gama, D.; Etemadi, S.; Kirby, E.; Lillerud, K.P.; Beato, P.; Svelle, S.; Olsbye, U. Time- and space-resolved study of the methanol to hydrocarbons (MTH) reaction-influence of zeolite topology on axial deactivation patterns. Faraday Discuss. 2017, 197, 421–446. [Google Scholar] [CrossRef] [PubMed]
  27. Shen, Y.; Le, T.T.; Fu, D.; Schmidt, J.E.; Filez, M.; Weckhuysen, B.M.; Rimer, J.D. Deconvoluting the Competing Effects of Zeolite Framework Topology and Diffusion Path Length on Methanol to Hydrocarbons Reaction. ACS Catal. 2018, 8, 11042–11053. [Google Scholar] [CrossRef]
  28. Park, J.W.; Kim, S.J.; Seo, M.; Kim, S.Y.; Sugi, Y.; Seo, G. Product selectivity and catalytic deactivation of MOR zeolites with different acid site densities in methanol-to-olefin (MTO) reactions. Appl. Catal. A Gen. 2008, 349, 76–85. [Google Scholar] [CrossRef]
  29. Derouane, E.G.; Nagy, J.B.; Fernandez, C.; Gabelica, Z.; Laurent, E.; Maljean, P. Diffusion of alkanes in molecular sieves. Evidence for Confinement Effects. Appl. Catal. 1988, 40, L1–L10. [Google Scholar] [CrossRef]
  30. Smit, B.; Maesen, T.L.M. Molecular simulations of zeolites: Adsorption, diffusion, and shape selectivity. Chem. Rev. 2008, 108, 4125–4184. [Google Scholar] [CrossRef] [PubMed]
  31. Jae, J.; Tompsett, G.A.; Foster, A.J.; Hammond, K.D.; Auerbach, S.M.; Lobo, R.F.; Huber, G.W. Investigation into the shape selectivity of zeolite catalysts for biomass conversion. J. Catal. 2011, 279, 257–268. [Google Scholar] [CrossRef]
  32. O’Malley, A.J.; García Sakai, V.; Silverwood, I.P.; Dimitratos, N.; Parker, S.F.; Catlow, C.R.A. Methanol diffusion in zeolite HY: A combined quasielastic neutron scattering and molecular dynamics simulation study. Phys. Chem. Chem. Phys. 2016, 18, 17294–17302. [Google Scholar] [CrossRef] [PubMed]
  33. Hernandez-Tamargo, C.; O’Malley, A.; Silverwood, I.P.; De Leeuw, N.H. Molecular behaviour of phenol in zeolite Beta catalysts as a function of acid site presence: A quasielastic neutron scattering and molecular dynamics simulation study. Catal. Sci. Technol. 2019, 9, 6700–6713. [Google Scholar] [CrossRef] [Green Version]
  34. Omojola, T.; Cherkasov, N.; McNab, A.I.; Lukyanov, D.B.; Anderson, J.A.; Rebrov, E.V.; Van Veen, A.C. Mechanistic Insights into the Desorption of Methanol and Dimethyl Ether Over ZSM-5 Catalysts. Catal. Lett. 2018, 148, 474–488. [Google Scholar] [CrossRef] [Green Version]
  35. Caro, J.; Bülow, M.; Richter-Mendau, J.; Kärger, J.; Hunger, M.; Freude, D.; Rees, L.V.C. Nuclear magnetic resonance self-diffusion studies of methanol-water mixtures in pentasil-type zeolites. J. Chem. Soc. Faraday Trans. 1 Phys. Chem. Condens. Phases 1987, 83, 1843–1849. [Google Scholar] [CrossRef]
  36. Jobic, H.; Renouprez, A.; Bee, M.; Poinsignon, C. Quasi-elastic neutron scattering study of the molecular motions of methanol adsorbed on H-ZSM-5. J. Phys. Chem. 1986, 90, 1059–1065. [Google Scholar] [CrossRef]
  37. Nguyen, V.T.; Nguyen, P.T.M.; Dang, L.X.; Mei, D.; Wick, C.D.; Do, D.D. A comparative study of the adsorption of water and methanol in zeolite BEA: A molecular simulation study. Mol. Simul. 2014, 40, 1113–1124. [Google Scholar] [CrossRef]
  38. Mikkelsen, O.; Kolboe, S. The conversion of methanol to hydrocarbons over zeolite H-beta. Microporous Mesoporous Mater. 1999, 9, 173–184. [Google Scholar] [CrossRef]
  39. Park, J.W.; Seo, G. IR study on methanol-to-olefin reaction over zeolites with different pore structures and acidities. Appl. Catal. A Gen. 2009, 356, 180–188. [Google Scholar] [CrossRef]
  40. Chua, Y.T.; Stair, P.C. An ultraviolet Raman spectroscopic study of coke formation in methanol to hydrocarbons conversion over zeolite H-MFI. J. Catal. 2003, 213, 39–46. [Google Scholar] [CrossRef]
  41. Rownaghi, A.A.; Rezaei, F.; Hedlund, J. Uniform mesoporous ZSM-5 single crystals catalyst with high resistance to coke formation for methanol deoxygenation. Microporous Mesoporous Mater. 2012, 151, 26–33. [Google Scholar] [CrossRef]
  42. Jiang, Y.; Hunger, M.; Wang, W. On the reactivity of surface methoxy species in acidic zeolites. J. Am. Chem. Soc. 2006, 128, 11679–11692. [Google Scholar] [CrossRef] [PubMed]
  43. Shah, R.; Gale, J.D.; Payne, M.C. Methanol adsorption in zeolites—A first-principles study. J. Phys. Chem. 1996, 100, 11688–11697. [Google Scholar] [CrossRef]
  44. Blaszkowski, S.R.; Van Santen, R.A. Density functional theory calculations of the activation of methanol by a Brønsted zeolitic proton. J. Phys. Chem. 1995, 99, 11728–11738. [Google Scholar] [CrossRef]
  45. Nastase, S.A.F.; O’Malley, A.J.; Catlow, C.R.A.; Logsdail, A.J. Computational QM/MM investigation of the adsorption of MTH active species in H-Y and H-ZSM-5. Phys. Chem. Chem. Phys. 2019, 21, 2639–2650. [Google Scholar] [CrossRef] [Green Version]
  46. Mirth, G.; Lercher, J.A.; Anderson, M.W.; Klinowski, J. Adsorption complexes of methanol on zeolite ZSM-5. J. Chem. Soc. Faraday Trans. 1990, 86, 3039–3044. [Google Scholar] [CrossRef]
  47. Krishna, R.; Van Baten, J.M. Hydrogen bonding effects in adsorption of water-alcohol mixtures in zeolites and the consequences for the characteristics of the Maxwell-Stefan diffusivities. Langmuir 2010, 26, 10854–10867. [Google Scholar] [CrossRef]
  48. Newsam, J.M.; Treacy, M.M.J.; Koetsier, W.T.; De Gruyter, C.B. Structural characterization of zeolite beta. Proc. R. Soc. London, Ser. A Math. Phys. Sci. 1988, 420, 375–405. [Google Scholar]
  49. Olson, D.H.; Kokotailo, G.T.; Lawton, S.L.; Meler, W.M. Crystal Structure and Structure-Related Properties of ZSM-5. J. Phys. Chem. 1981, 85, 2238–2243. [Google Scholar] [CrossRef]
  50. Dempsey, E.; Kühl, G.H.; Olson, D.H. Variation of the lattice parameter with aluminum content in synthetic sodium faujasites. Evidence for ordering of the framework ions. J. Phys. Chem. 1969, 73, 387–390. [Google Scholar] [CrossRef]
  51. Born, M.; Huang, K.; Lax, M. Dynamical Theory of Crystal Lattices. Am. J. Phys. 1955, 23, 474. [Google Scholar] [CrossRef]
  52. Blanco, C.; Auerbach, S.M. Nonequilibrium molecular dynamics of microwave-driven zeolite-guest systems: Loading dependence of athermal effects. J. Phys. Chem. B 2003, 107, 2490–2499. [Google Scholar] [CrossRef]
  53. Plant, D.F.; Maurin, G.; Bell, R.G. Diffusion of methanol in zeolite NaY: A molecular dynamics study. J. Phys. Chem. B 2007, 111, 2836–2844. [Google Scholar] [CrossRef] [PubMed]
  54. Kimura, K.; Kubo, M. Structures of dimethyl ether and methyl alcohol. J. Chem. Phys. 1959, 30, 151–158. [Google Scholar] [CrossRef]
  55. Lees, R.M.; Baker, J.G. Torsion-vibration-rotation interactions in methanol. I. Millimeter wave spectrum. J. Chem. Phys. 1968, 48, 5299–5318. [Google Scholar] [CrossRef]
  56. Dauber-Osguthorpe, P.; Roberts, V.A.; Osguthorpe, D.J.; Monique, G.; Hagler, A.T. Adsorbate-induced lattice deformation in IRMOF-74 series. Porteins Struct. Funct. Genet. 1988, 4, 31–47. [Google Scholar] [CrossRef] [PubMed]
  57. Rehfinger, A.; Hoffmann, U. Kinetics of methyl tertiary butyl ether liquid phase synthesis catalyzed by ion exchange resin-II. Macropore diffusion of methanol as rate-controlling step. Chem. Eng. Sci. 1990, 45, 1619–1626. [Google Scholar] [CrossRef]
  58. Sanders, M.J.; Leslie, M.; Catlow, C.R.A. Interatomic potentials for SiO2. J. Chem. Soc. Chem. Commun. 1984, 1271–1273. [Google Scholar] [CrossRef]
  59. Catlow, C.R.A.; Stoneham, A.M. Ionicity in solids. J. Phys. C Solid State Phys. 1983, 16, 4321–4338. [Google Scholar] [CrossRef]
  60. Shubin, A.A.; Catlow, C.R.A.; Thomas, J.M.; Zamaraev, K.I. A computational study of the adsorption of the isomers of butanol on silicalite and H-ZSM-5. Proc. R. Soc. Lond. Ser. A Math. Phys. Sci. 1994, 446, 411–427. [Google Scholar]
  61. Sastre, G.; Catlow, C.R.A.; Corma, A. Diffusion of benzene and propylene in MCM-22 zeolite. A molecular dynamics study. J. Phys. Chem. B 1999, 103, 5187–5196. [Google Scholar] [CrossRef]
  62. Raj, N.; Sastre, G.; Catlow, C.R.A. Diffusion of octane in silicalite: A molecular dynamics study. J. Phys. Chem. B 1999, 103, 11007–11015. [Google Scholar] [CrossRef]
  63. Schröder, K.P.; Sauer, J. Potential functions for silica and zeolite catalysts based on ab initio calculations. A shell model ion pair potential for silica and aluminosilicates. J. Phys. Chem. 1996, 100, 11043–11049. [Google Scholar] [CrossRef]
  64. Schröder, K.P.; Sauer, J.; Leslie, M.; Catlow, C.R.A.; Thomas, J.M. Bridging hydrodyl groups in zeolitic catalysts: A computer simulation of their structure, vibrational properties and acidity in protonated faujasites (HY zeolites). Chem. Phys. Lett. 1992, 188, 320–325. [Google Scholar] [CrossRef]
  65. Todorov, I.T.; Smith, W.; Trachenko, K.; Dove, M.T. DL_POLY_3: New dimensions in molecular dynamics simulations via massive parallelism. J. Mater. Chem. 2006, 16, 1911–1918. [Google Scholar] [CrossRef] [Green Version]
  66. Momma, K.; Izumi, F. VESTA 3 for three-dimensional visualization of crystal, volumetric and morphology data. J. Appl. Crystallogr. 2011, 44, 1272–1276. [Google Scholar] [CrossRef]
  67. Humphrey, W.; Dalke, A.; Schulten, K. VMD: Visual Molecular Dynamics. J. Mol. Graph. 1996, 14, 33–38. [Google Scholar] [CrossRef]
  68. Berendsen, H.J.C.; Postma, J.P.M.; Van Gunsteren, W.F.; Dinola, A.; Haak, J.R. Molecular dynamics with coupling to an external bath. J. Chem. Phys. 1984, 81, 3684–3690. [Google Scholar] [CrossRef] [Green Version]
  69. Brandt, E.G.; Lyubartsev, A.P. Systematic Optimization of a Force Field for Classical Simulations of TiO2-Water Interfaces. J. Phys. Chem. C 2015, 119, 18110–18125. [Google Scholar] [CrossRef]
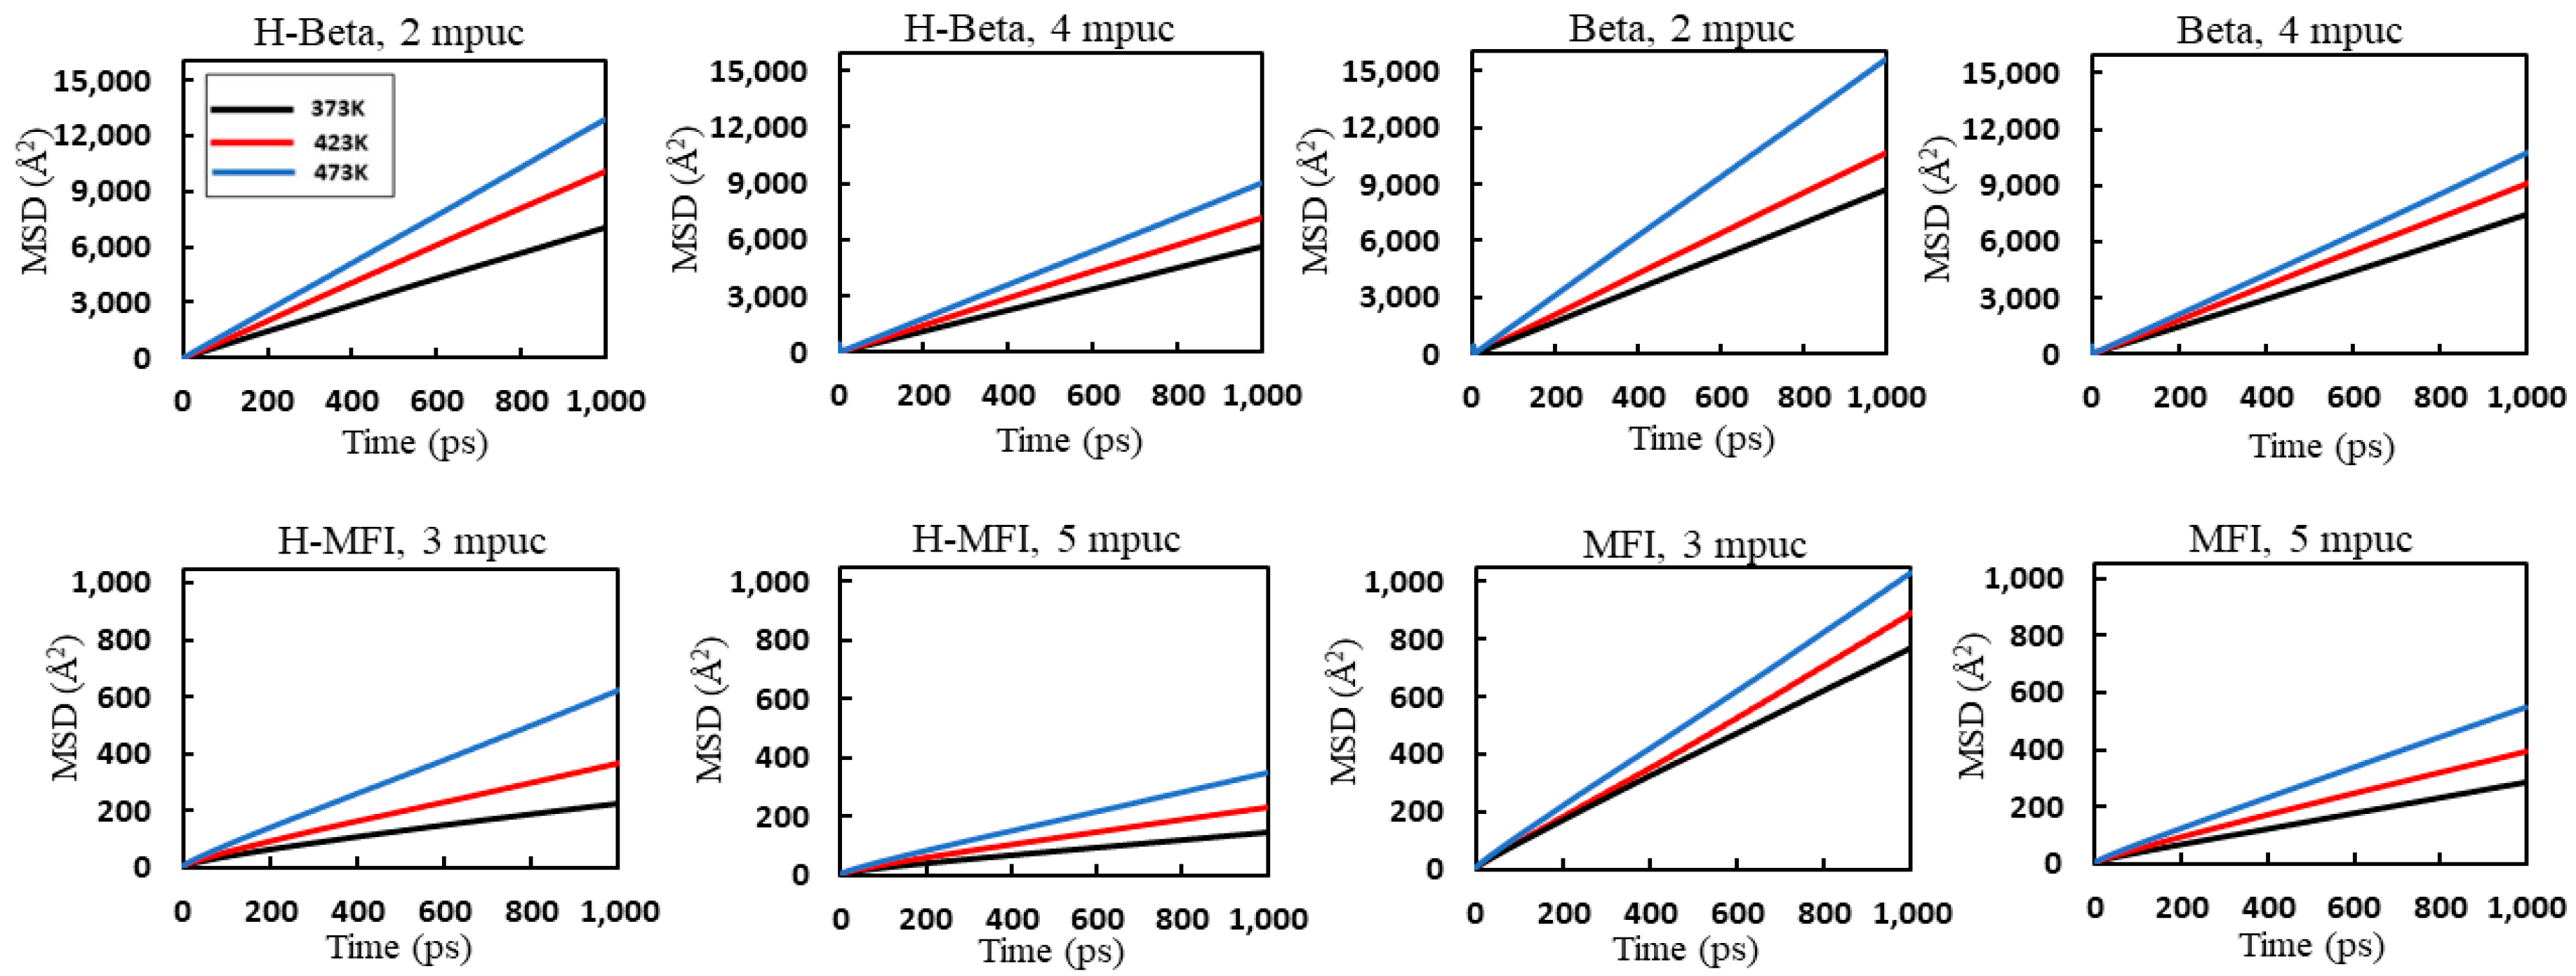
Figure 1. Mean square displacement (MSD) of methanol in zeolite Beta (at loadings of 2 and 4 molecules per unit cell (mpuc)) and zeolite MFI (loadings of 3 and 5 mpuc) at the temperatures 373, 423, and 473 K.
Catalysts 10 01342 g001
Figure 2. Trajectory of a single methanol molecule at 473 K in (a) H-Beta (b) all-silica Beta c direction at a loading of 4 mpuc, and in (c) H-MFI and (d) all-silica MFI c direction at a loading of 5 mpuc. Element color code: O (red), Si (orange), Al (blue), center of mass for CH3OH (green).
Catalysts 10 01342 g002
Figure 3. The radial distribution function and its integration for *Om-Ha showing H-bonding between the acid site and methanol as a function of temperature in H-Beta for loadings of (a) 2 and (b) 4 mpuc, and in H-MFI for loadings of (c) 3 and (d) 5 mpuc.
Catalysts 10 01342 g003
Figure 4. Radial distribution function (RDF) for *H-O, *Hm-O, and *C-O in zeolite Beta at loadings of (ac) 2 and (df) 4 mpuc; and zeolite MFI loadings of (gi) 3 and (jl) 5 mpuc at the temperatures 373, 423, and 473 K.
Catalysts 10 01342 g004
Figure 5. Representation of the adsorption of methanol in a side-on configuration in zeolite MFI where the molecule is arranged to fit the distances obtained from the RDF of the atomic pairs *Om-Ha, *H-O, *Hm-O, and *C-O. Element color code: O (red), Si (orange), Al (blue), H (gray), C (black).
Catalysts 10 01342 g005
Figure 6. The radial distribution function for *C–*C showing the probability for methanol agglomeration as a function of temperature in H-Beta with loadings of (a) 2 and (b) 4 mpuc; in all-silica Beta with loadings of (c) 2 and (d) 4 mpuc; in H-MFI with loadings of (e) 3 and (f) 5 mpuc; and all-silica MFI with loadings of (g) 3 and (h) 5 mpuc.
Catalysts 10 01342 g006
Figure 7. (a) Zeolite Beta with substituted Al at tetrahedral site T6 and proton on O12. Zeolite MFI showing the substituted Al at (b) T7 and T6 with protons on O17 and O13 for straight and the intersection between channels, respectively and (c) site T7 with proton on O18 for the sinusoidal channel. Element color code: O (red), Si (orange), Al (blue), H (gray).
Catalysts 10 01342 g007
Table 1. Self-diffusion coefficients (Ds [×10−10 (m2s−1)]) for methanol in zeolites Beta and MFI with the derived activation energies Ea (kJ·mol−1).
Acidic BetaAll-Silica Beta
Temp (K)2 mpuc4 mpuc2 mpuc4 mpuc
373112.489.9139.11119.6
423161.1114.1171.3146.5
473205.5143.0250.1171.7
Ea8.96.88.55.3
Acidic MFIAll-Silica MFI
Temp (K)3 mpuc5 mpuc3 mpuc5 mpuc
3733.42.212.14.5
4235.73.514.06.2
4739.75.416.28.6
Ea15.413.04.39.5
Table 2. Residence times τ obtained after the exponential fit of the contact correlation function C(t) at 373, 423 and 473 K.
Zeolite Structure and Loadings373 K423 K473 K
Beta 2 mpuc2.51.91.7
Beta 4 mpuc2.31.61.5
MFI 3 mpuc5.63.72.9
MFI 5 mpuc5.13.62.7
Table 3. Potential parameters describing the intra- and inter-molecular interactions for methanol a.
AtomsCharges (a.u.)
C−0.093
H0.100
Om−0.432
Hm0.225
Harmonic bonds U ( r i j )   =   k   2   ( r i j r 0 ) 2
Bondsk (eV·Å−2) r0 (Å)
C-H29.561.105
C-Om33.331.420
Hm-Om46.970.945
Harmonic bond angles U ( θ i j k )   =   k 2   ( θ i j k θ 0 ) 2
Anglesk (eV·rad−2)θ0 (˚)
H-C-H4.4108.38
H-C-Om5.5106.90
C-Om-Hm5.6108.32
Harmonic dihedral U ( φ i j k l )   = k   [ 1 + c o s   ( β φ i j k l α )    
Dihedralk (eV)α (˚)β
Hm-Om-C-H0.007621.03.0
Lennard–Jones U ( r i j )   =   4 ε i j   [ ( σ i j r i j ) 12 ( σ i j r i j ) 6 ]
Atomic pairs ε i j ( e V ) σ i j   ( Å )
C-C0.006943.475
C-H0.003382.920
C-Om0.008283.150
C-Hm0.003382.920
H-H0.001652.450
H-Om0.004042.650
H-Hm0.001652.450
Om-Om0.009882.860
Om-Hm0.0040402.650
Hm-Hm0.0016502.450
aOm and Hm denote the O and hydroxyl H atom of methanol, respectively.
Table 4. Potentials describing the interatomic interactions within the zeolite framework and the Brønsted acid sites a.
Buckingham Potentials   U ( r i j ) = A · exp ( r i j ρ ) C r i j 6
Atomic PairsA (eV)ρ (Å)C (eV·Å6)
O-O22764.00000.1490027.88000
O-Oa22764.00000.1490027.88000
O-Ha311.97000.250000.00000
Si-O1283.90700.3205210.66158
Si-Oa983.55660.3205210.66158
Al-O1460.30000.299120.00000
Al-Oa1142.67750.299120.00000
Morse potential U ( r i j ) = D 0 { 1 exp [ k ( r i j r 0 ) ] } 2 D 0
Ionic PairD0 (eV)k−1)r0 (Å)
Ha-Oa7.052502.198600.94850
Three-body potentials U ( θ i j k ) = k 2   ( θ i j k θ 0 ) 2
Anglesk (eV·rad−2)θ0 (˚)
O-T-O b2.09724109.47
a Oa and Ha denote the bridging hydroxyl O and the proton of the Brønsted acid sites respectively. b The same three-body potential is used for the atomic triads O-Si-O, O-Al-O, O-Si-Oa, and O-Al-Oa.
Table 5. Lennard–Jones potential describing the zeolite–methanol a interaction.
Lennard–Jones Potentials   U ( r i j )   =   4 ε i j   [ ( σ i j r i j ) 12 ( σ i j r i j ) 6 ]
Atomic Pairsεij (eV)σij (Å)
*C-O0.0059104.310
*C-Oa0.0059104.310
*C-Ha0.0029912.806
*H-O0.0049872.557
*H-Oa0.0049872.557
*H-Ha0.0008511.785
*Om-O0.0105452.764
*Om-Oa0.0105452.764
*Om-Ha0.0049872.557
*Hm-O0.0049872.557
*Hm-Oa0.0049872.557
*Hm-Ha0.0008511.785
a The asterisk denotes the atoms of the methanol molecule.
Publisher’s Note: MDPI stays neutral with regard to jurisdictional claims in published maps and institutional affiliations.