Article

Characterization of Anaerobic Biofilms Growing on Carbon Felt Bioanodes Exposed to Air

by
Raúl M. Alonso
1,
Guillermo Pelaz
1,
María Isabel San-Martín
1,
Antonio Morán
1 and
Adrián Escapa
1,2,*
1
Chemical and Environmental Bioprocess Engineering Group, Natural Resources Institute (IRENA), Universidad de León, Avda. de Portugal 41, E-24009 Leon, Spain
2
Department of Electrical Engineering and Automatic Systems, Campus de Vegazana s/n, Universidad de León, E-24071 León, Spain
*
Author to whom correspondence should be addressed.
Catalysts 2020, 10(11), 1341; https://doi.org/10.3390/catal10111341
Submission received: 14 October 2020 / Revised: 9 November 2020 / Accepted: 16 November 2020 / Published: 18 November 2020

Abstract

:
The role of oxygen in anodic biofilms is still a matter of debate. In this study, we tried to elucidate the structure and performance of an electrogenic biofilm that develops on air-exposed, carbon felt electrodes, commonly used in bioelectrochemical systems. By simultaneously recording the current density produced by the bioanode and dissolved oxygen concentration, both inside and in the vicinity of the biofilm, it was possible to demonstrate the influence of a protective aerobic layer present in the biofilm (mainly formed by Pseudomonas genus bacteria) that prevents electrogenic bacteria (such as Geobacter sp.) from hazardous exposure to oxygen during its normal operation. Once this protective barrier was deactivated for a long period of time, the catalytic capacity of the biofilm was severely affected. In addition, our results highlighted the importance of the material’s porous structure for oxygen penetration in the electrode.

Graphical Abstract

1. Introduction

The term microbial electrochemical technologies (METs) covers a group of bio-based electrochemical devices that hold great potential for practical applications in the fields of bioremediation and energy production/management [1]. The anodic processes of many METs (typically microbial fuel cells and microbial electrochemical cells) rely on the biocatalytic conversion of organic matter into electricity, requiring the presence of certain types of microorganisms, frequently referred to as electrogens, electricigens, or electrogenic microorganisms [2], which are capable of performing extracellular electron transfer to a solid electrode.
Mimicking natural processes, most of these electrogenic microorganisms can carry out their life cycle forming biofilms on the surface of the electrodes [3,4], where they benefit from favourable physical–chemical (micro)environments and useful trophic relationships. These microenvironments are caused by diffusive and/or reactive gradients of different substances, such as electron acceptors or donors that do not exist outside these multi-organism scaffolds [3]. Normally, anodic biofilms are colonised by electrogens, and it is very common that, depending on the source of the inoculum, carbon source, physicochemical parameters, and operational conditions, very complex microbial communities thrive on the surface of bioanodes [4]. In this regard, the presence of dissolved oxygen (DO) in an anodic medium can determine, to a significant extent, the structure of anodic biofilms, as many microorganisms involved in their functioning are anaerobic or facultative anaerobic [5]. In addition, the role and impact of oxygen in the performance of bioanodes has aroused some controversy [6]. On one hand, some authors claim that oxygen can have a beneficial impact on the degradation of complex organic compounds [6] and even improve the overall performance under some conditions [7]. On the other hand, several authors maintain that oxygen can promote the proliferation of aerobic microorganisms that compete with electrogens for organic matter, decreasing the coulombic efficiency (i.e., reducing the percentage of electrons initially available in the organic matter that are converted to electrical current in the external circuit), which explains why the bioanodes of METs frequently operate under anaerobic conditions [8].
Microsensors can provide an invaluable tool for understanding the nature, structure, and metabolic interactions within biofilms. They were initially applied to the study biofilms in the area of human diseases [9], and today, their use is widespread in microbial ecology for both natural and engineered systems [10], including METs [11]. For METs in particular, microsensors have been used to monitor chemical parameters (e.g., pH or redox potential) or the concentration of substances, such as hydrogen [12], acetate [13], nitrite [14], or oxygen [15] within biofilms. Focusing on oxygen, some publications are dedicated to revealing the local distribution of DO concentrations in specific biofilms, extracting significant conclusions [16,17], such as the importance of pH control in aerobic biocathodes [16] or the role of cathodic biofilms as oxygen diffusion barriers in single-chamber microbial fuel cells [17]. However, these investigations are mainly carried out on flat surfaces and rarely on porous surfaces, such as carbon felt, which is frequently used in METs and is also a good candidate for potential real-life applications [18]. The characterization of DO profiles inside biofilms growing on porous electrodes could provide valuable information on the implications of oxygen diffusion inside these elements and its consequences on biofilm development and functioning.
The objective of this research is to study the distribution of DO in electrogenic biofilms and their surroundings when these microbial aggregates grow, exposed to air, in carbon felt electrodes. It also tries to understand the effect of DO on the catalytic activity of an anodic biofilm fed with acetate.

2. Results and Discussion

After inoculation, the bioanode was operated in batch mode (electrode potential: +0.1 V vs. Ag/AgCl) with the anodic compartment open to air, so oxygen could freely diffuse into the anodic medium. The end of every batch cycle was determined by a drop in the current density (CD), below 10% of the maximum value achieved in that particular cycle. This resulted in an average cycle duration of approximately five days. Total organic carbon (TOC) was monitored daily, and at the end of each batch cycle (TOC was <10 mg·L−1), the reactor was replenished with fresh medium and carbon source, providing an acetate concentration of 10 mM. After the first cycle (six days of operation), a biofilm was clearly visible on the electrode surface. To ensure pseudo-steady state conditions, the anode was operated in this manner for 42 additional days before the experimental period began.

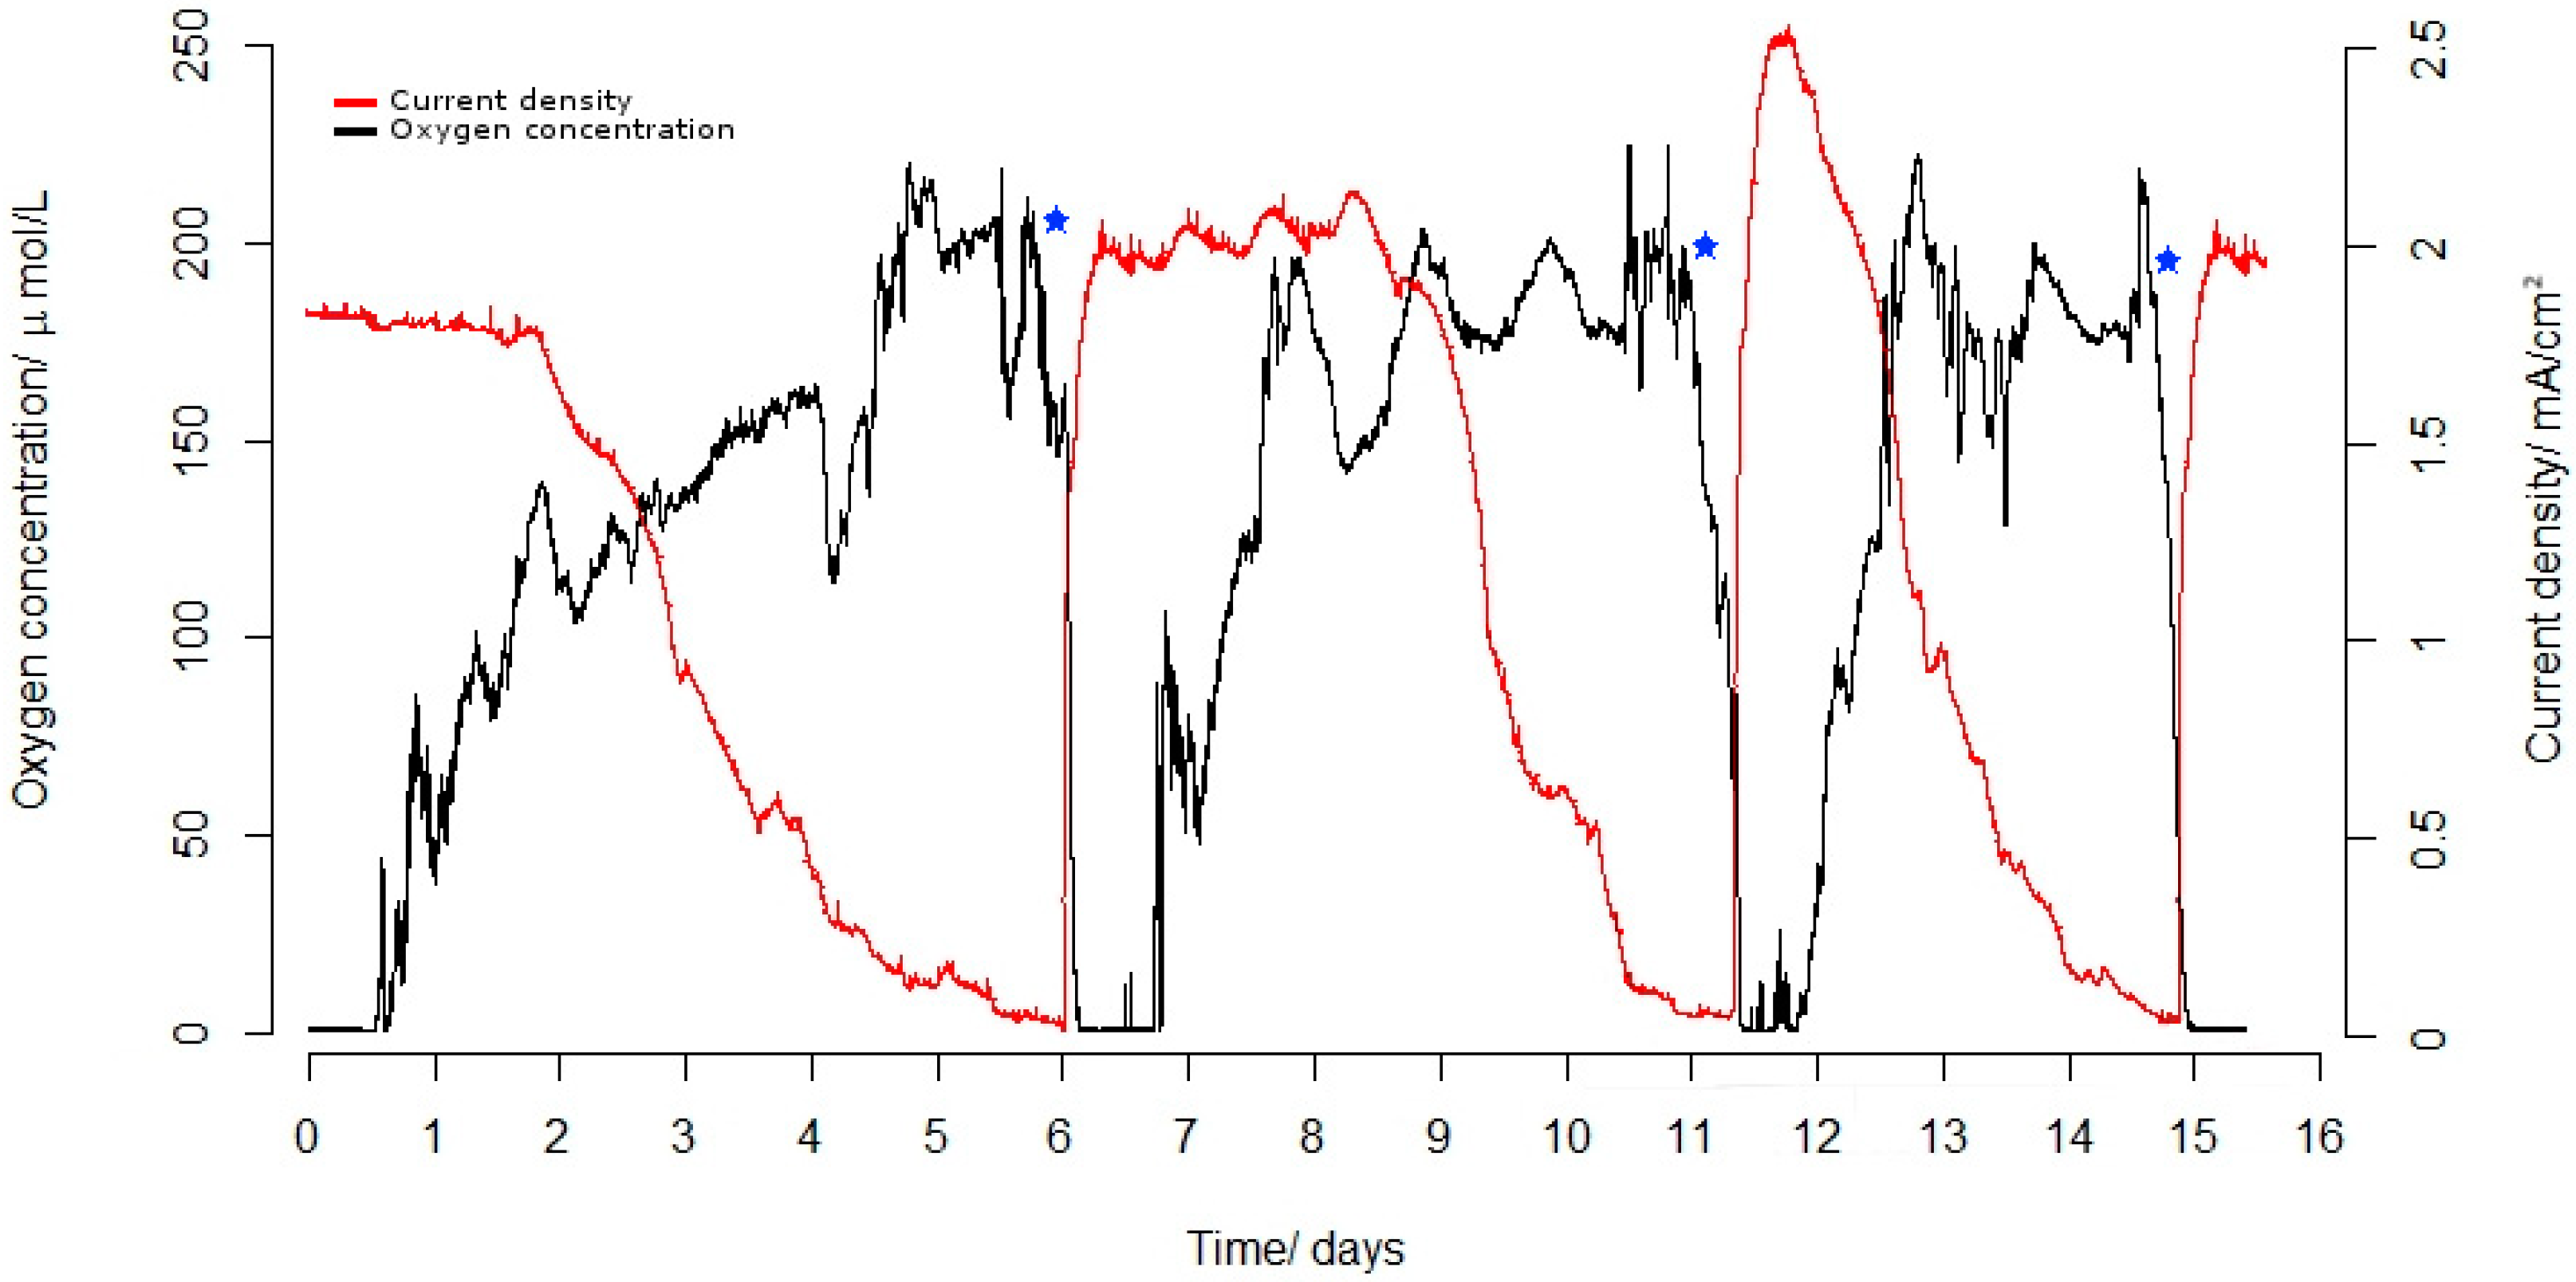
2.1. The Interplay between DO and CD

To understand the behaviour of the exoelectrogenic biofilm when oxygen is present in the anodic medium, both the CD and the DO concentration, at a fixed height of 100 μm above the apparent surface of the biofilm, were simultaneously recorded for 15 days (Figure 1). Like the acclimation period, when the current fell below 10% of the maximum value, the TOC was checked to be less than 10 mg·L−1, and then, the cell medium was spiked (the medium was not replaced) with sodium acetate to reach a final (theoretical) acetate concentration of 10 mM. After the addition of sodium acetate (blue stars in Figure 1), the CD immediately increased, while the oxygen concentration in the liquid phase declined abruptly, suggesting the existence of at least two competing processes: electrogenic and aerobic metabolisms. When the substrate was available again, the metabolism of aerobic and electrogenic microorganisms was reactivated. The role of microorganisms present in the planktonic phase can be seen as marginal due to the replacement of the medium in each feeding cycle.
Using a coculture of Escherichia coli and Geobacter Sulfurreducens, Qu et al. [19] also reported oxygen depletion in the bulk of the anolyte of a microbial fuel cell (MFC), showing the importance of microorganisms other than exoelectrogens in the maintenance of anoxic conditions in anodes exposed to oxygen. In the referred study, exoelectrogenesis was inhibited without the presence of E. Coli (the main oxygen scavenger), demonstrating its essential role in this anodic microbial community. In our experiments, the near-zero DO concentration was maintained for 12–18 h and then increased, agreeing with an expected decrease in the carbon source, deduced from the current profile (Figure 1). This fact indicates that the acetate concentration is the limiting factor in oxygen consumption. Figure 1 also shows that the biofilm is capable of maintaining exoelectrogenic activity, despite the presence of DO in the bulk. In the following experimental section, we will go into the biofilm and will try to clarify, among other things, if DO ever penetrates the biofilm during substrate oxidation cycles.

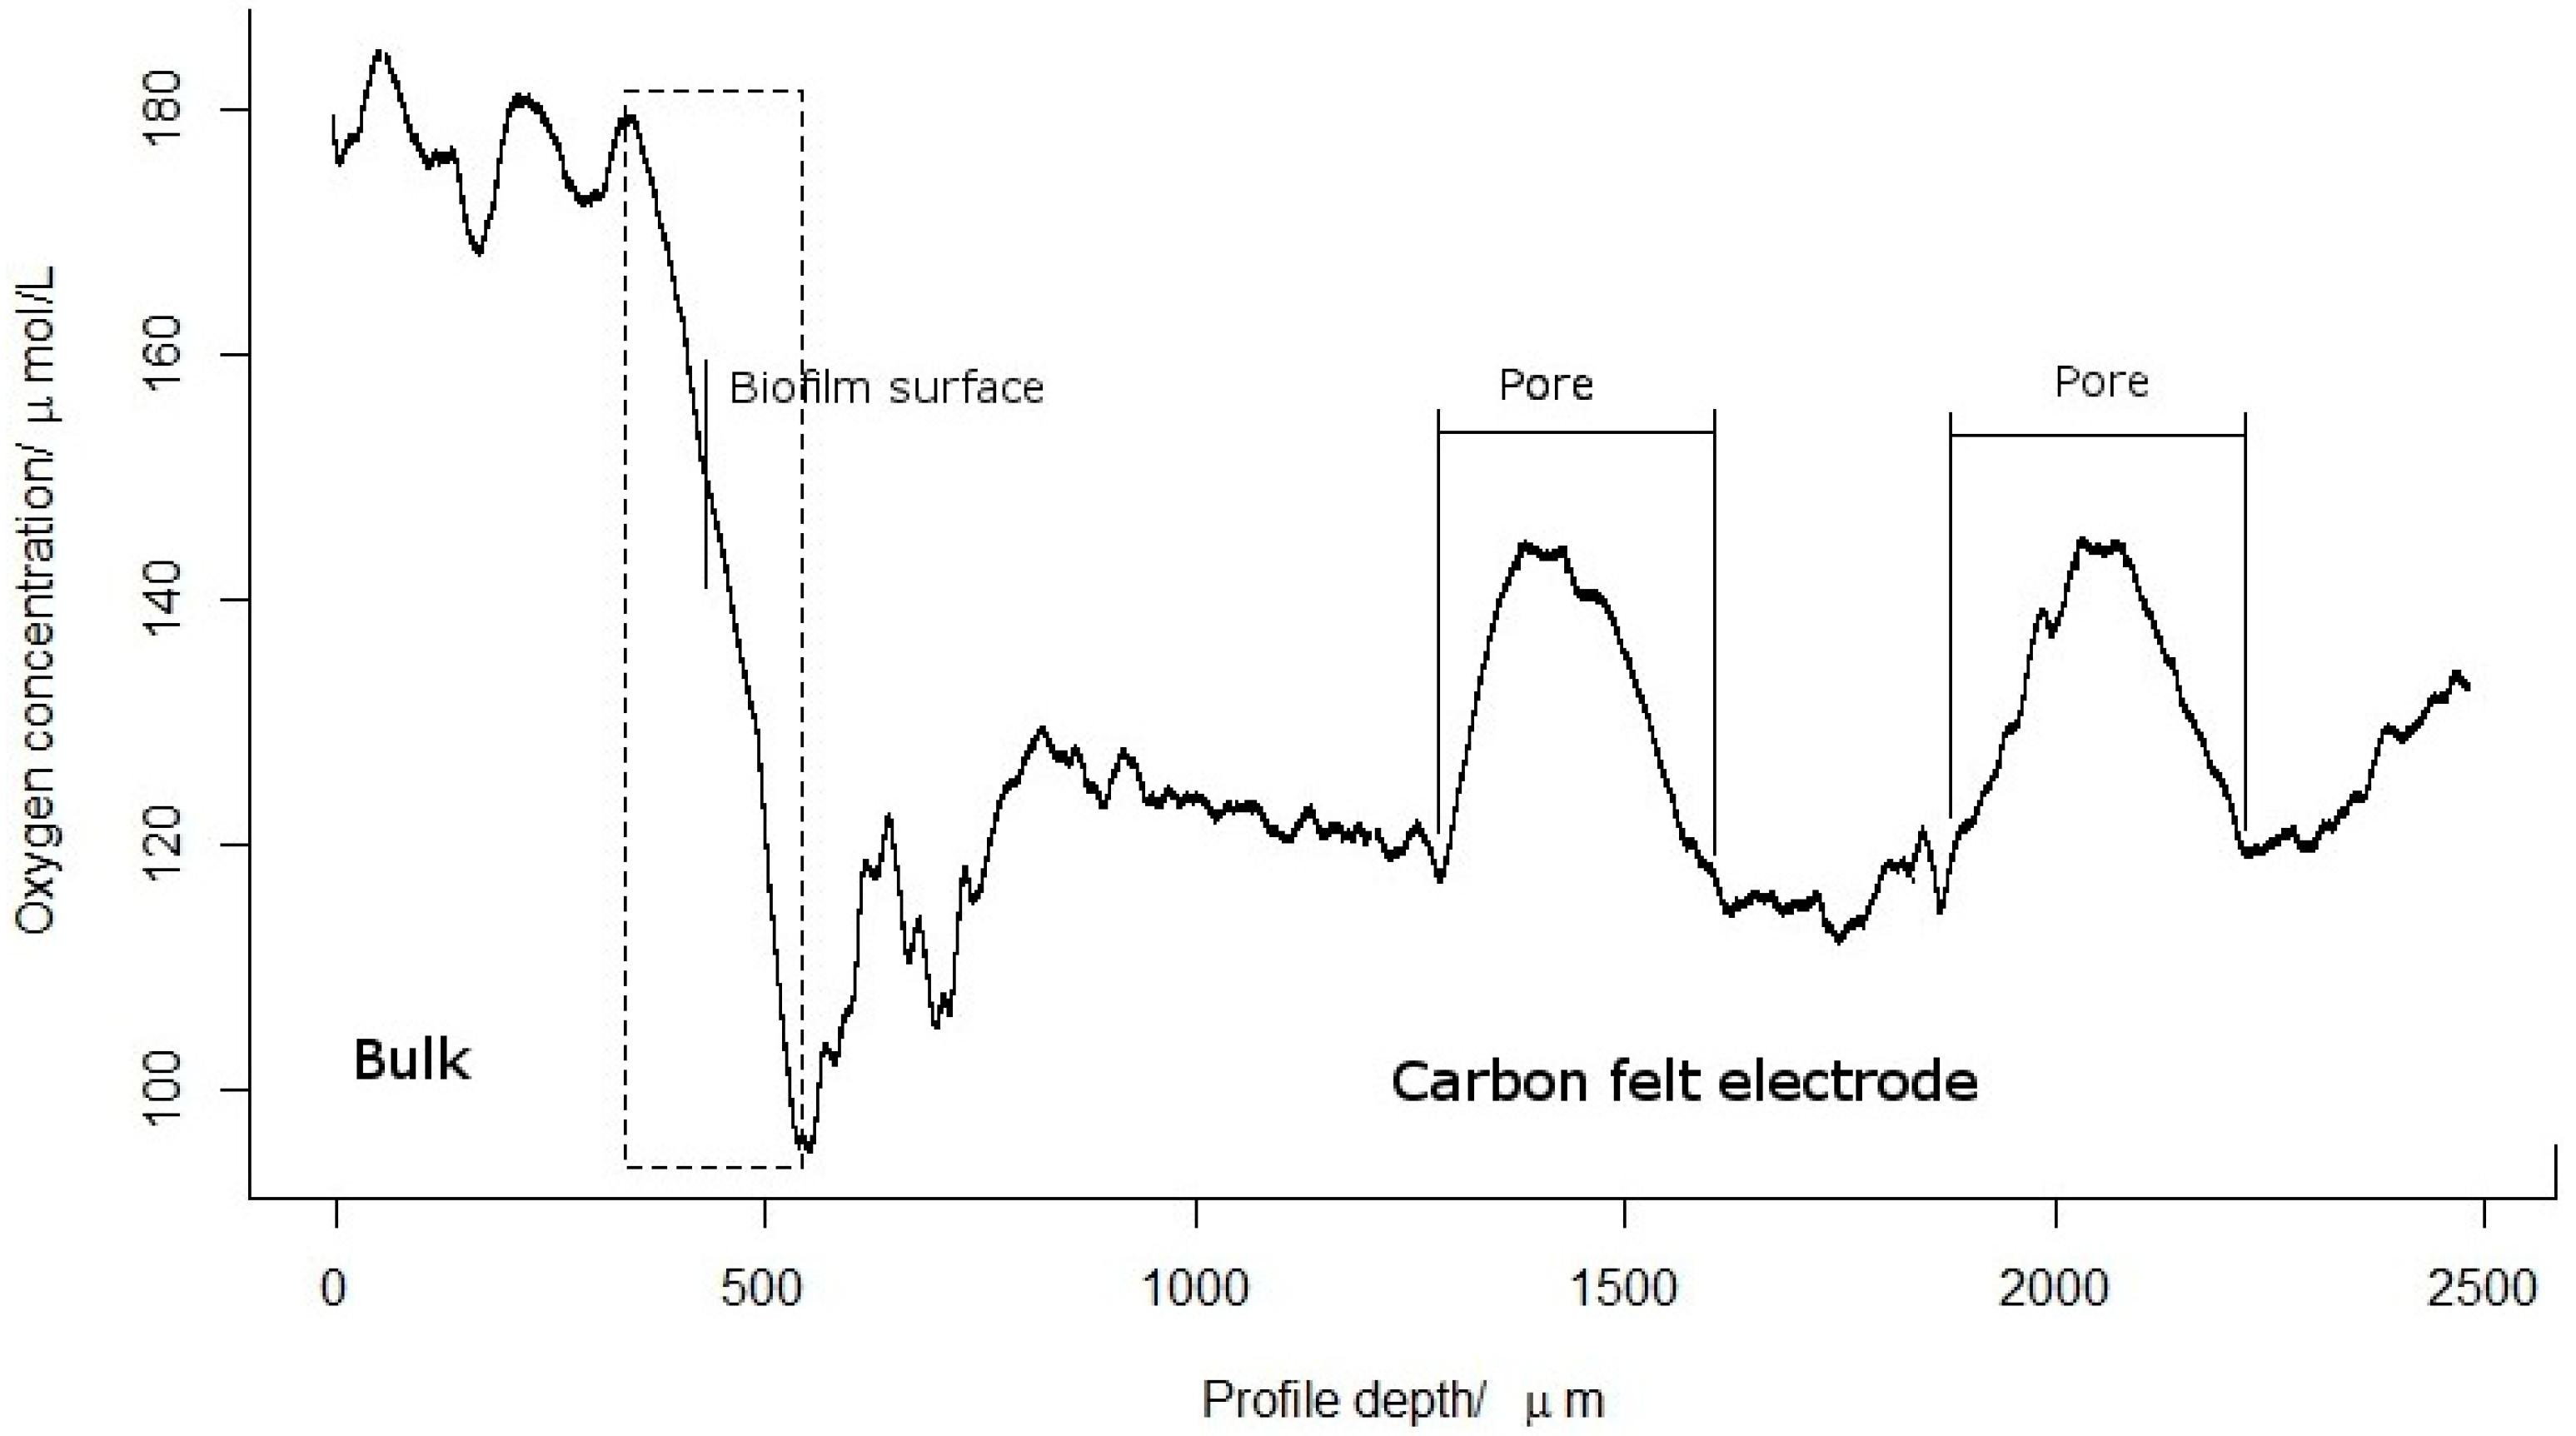
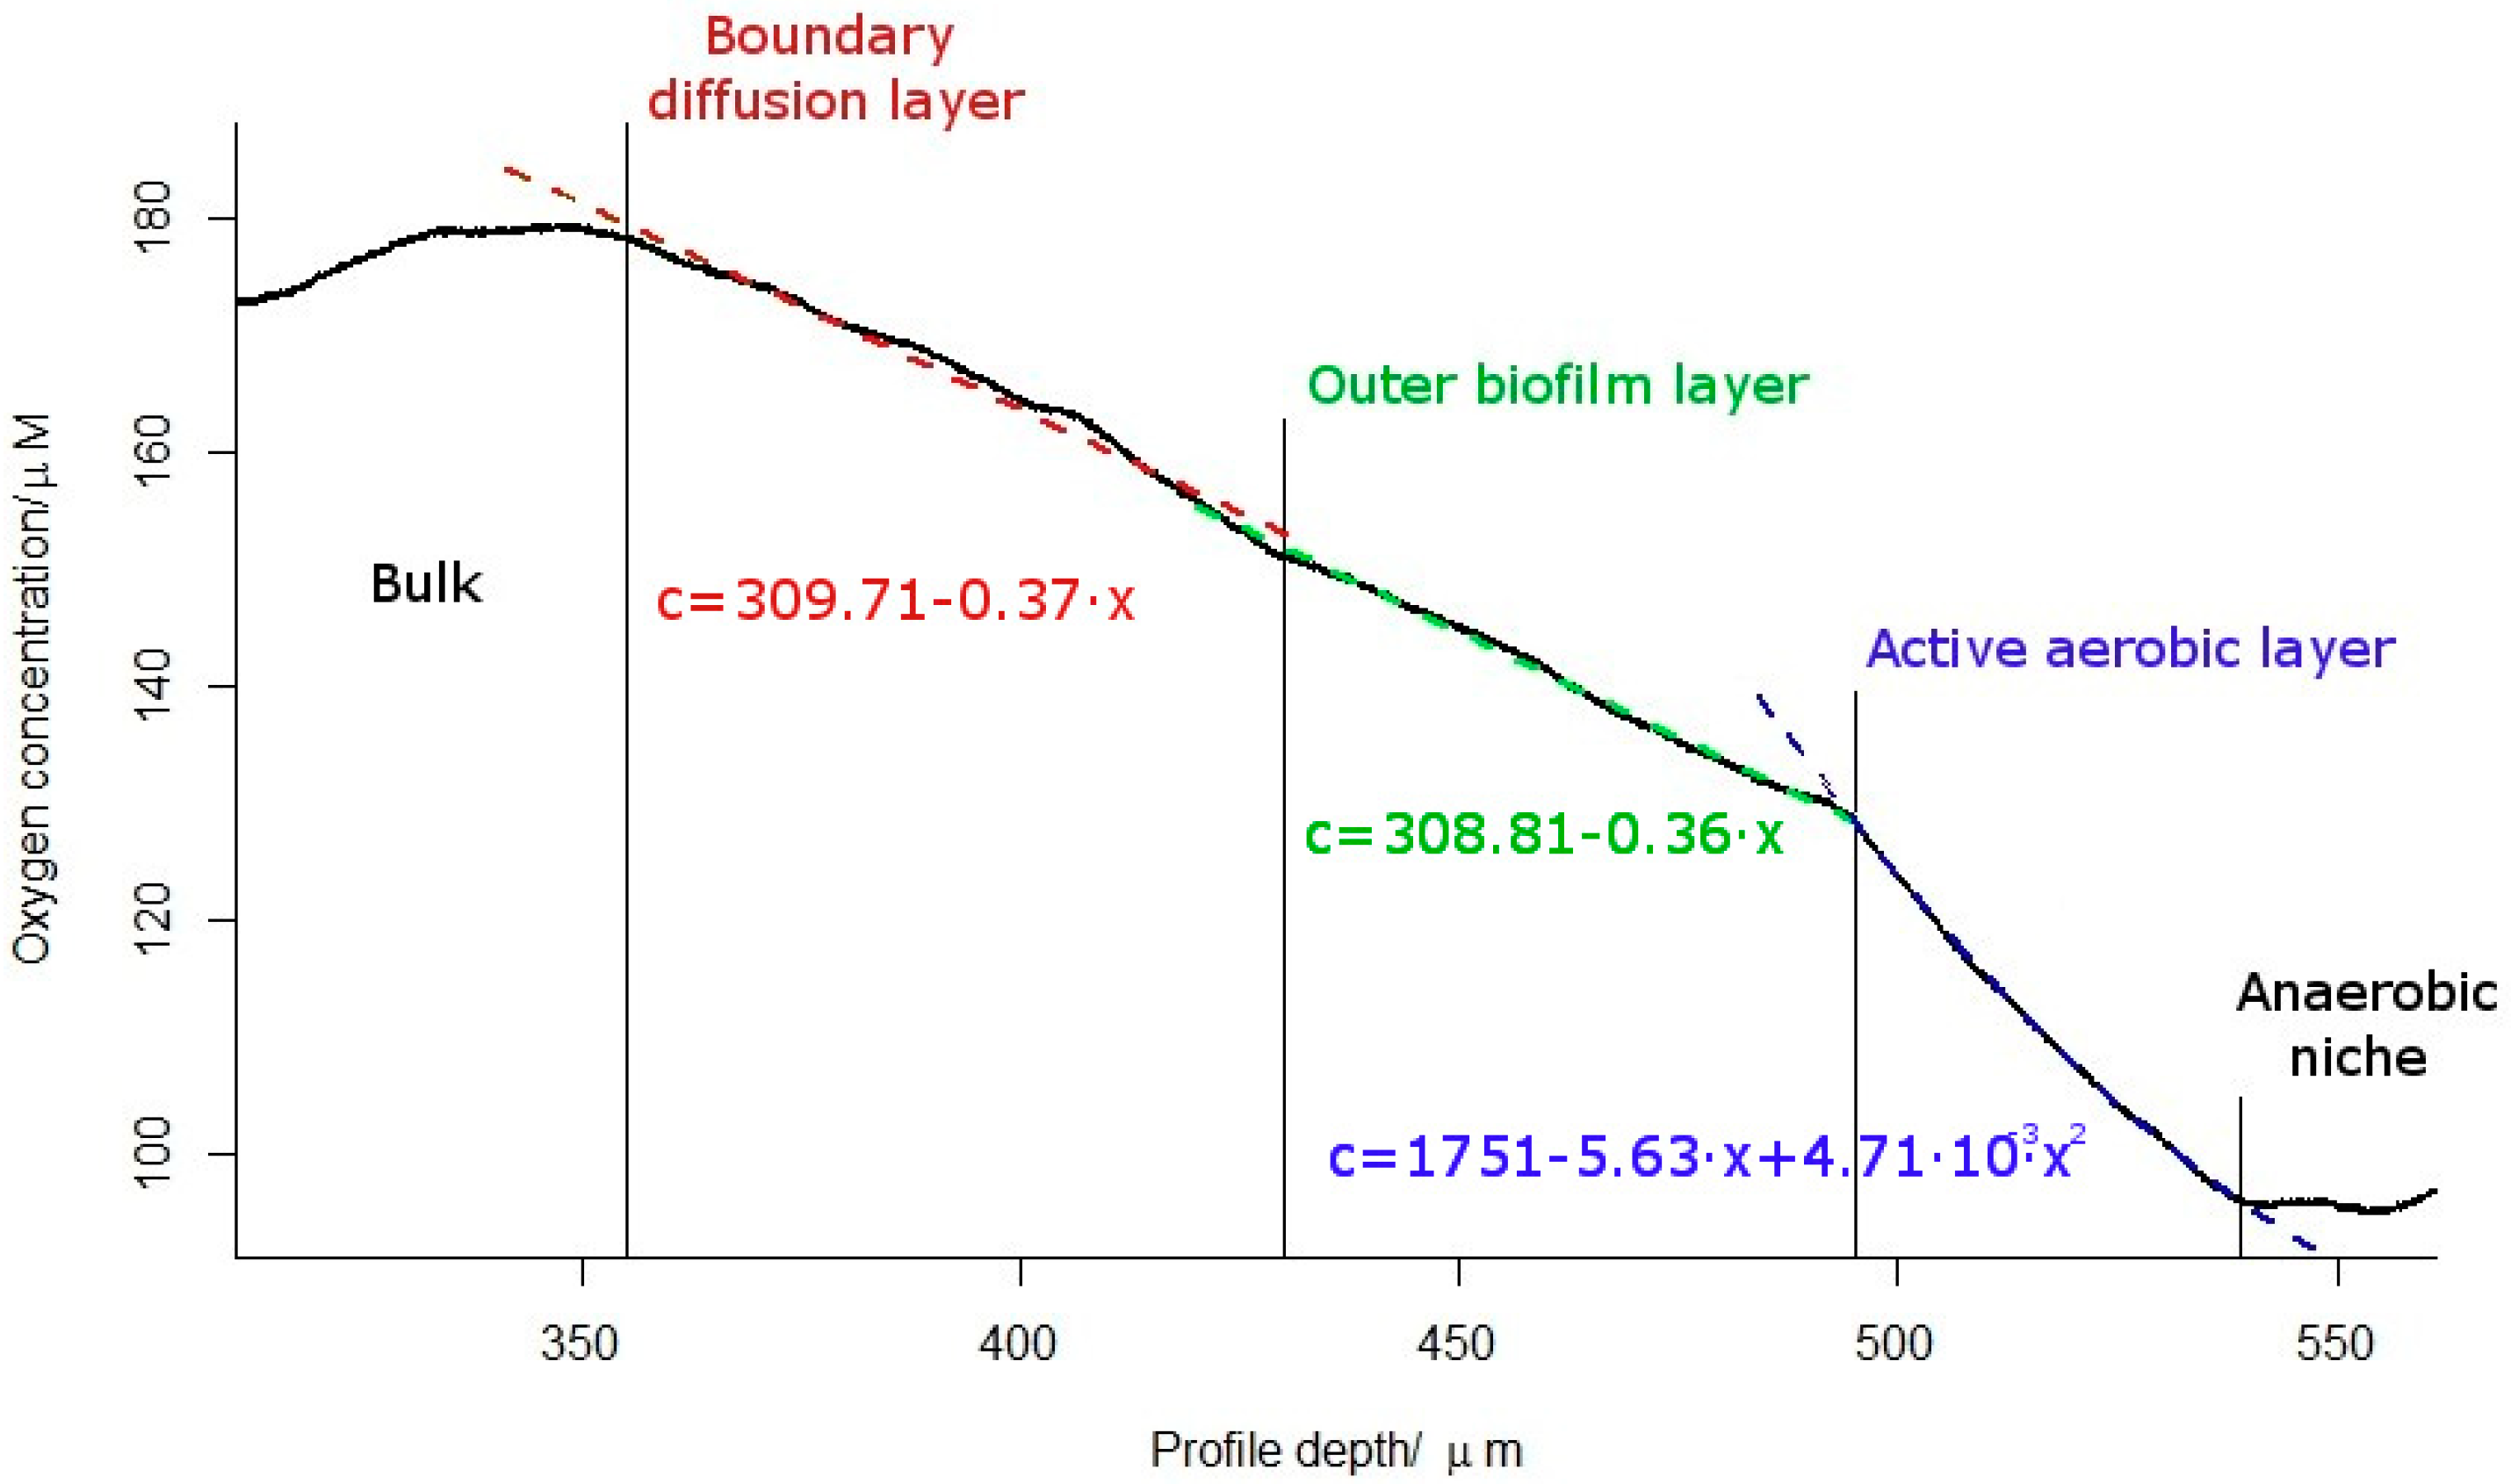
2.2. Oxygen Concentration Profile within the Biofilm

By studying the DO profile from the bulk to the interior of the electrode, functional aspects of the assembly liquid phase/biofilm/porous electrode can be understood. The experimental procedure leading to the achievement of the DO profiles proved to be challenging, since it is necessary to keep the cell in stationary conditions for an extended period of time. As Supplementary Materials, two prematurely interrupted DO profiles, not used in the subsequent analysis, were included. The oxygen probe was initially placed in the bulk within the vicinity of the electrode at an apparent distance of 500 μm from the biofilm surface. This height was taken as the reference position with a value of 0 μm (Figure 2) with the help of a camera (Figure 1). This initial position (0 μm) was the height where the profiling process began, and from here, the DO profile was periodically recorded at different depths (Figure 2). The DO concentration in the bulk did not change during the experiment. The reader can observe how the height reference and experimental procedure were different from the reference system used in Section 3.1. After all, in this section, the microelectrode moved, and in the previous experiment, it remained stationary. At a depth of about 355 μm, the DO concentration started to decline, almost linearly (slope −0.353 μM·μm−1), which is indicative that the probe is entering the diffusion boundary layer (DBL). In the biofilm vicinity (from 290 to 570 μm), which has been amplified in Figure 3, we found at least three sub-regions that can be distinguished by changes to the shape of the DO concentration profiles. As mentioned before, the first sub-region could be associated with the DBL, which is in direct contact with the biofilm. From Figure 2, we can estimate its thickness as approximately 75 μm, a value which is in agreement with the thickness of the DBL found by other authors for aerobic biofilms composed of bacteria of the genus Pseudomonas [20]. Interestingly, this genus was found in a high relative abundance in our biofilm; for more details, see Section 3.4. The second sub-region, with a quite similar slope to the previous one, was slightly less steep (−0.360 μM·μm−1), suggesting that the probe was entering a new phase, most probably the biofilm. The small difference between the slopes of the first and second sub-regions reinforces the idea that the diffusion coefficient in the outer layers of the biofilm is close to that of oxygen in water [21]. The oxygen flux (J) in this zone, calculated from Equation (6), was 7.39 × 10⁻⁷ mol·m−2·s−1, a value which is on the same order of magnitude as others reported in the literature for aerobic biofilms [22,23].
A clearer change in the DO profile came at a depth of ~495 μm, which can be attributed to significant oxygen consumption (Equation (1)) and (in the absence of another apparent oxygen sink) to the presence of an aerobic metabolism. This oxygen consumption was distributed over a 45 μm-thick region, in which a concave profile (positive second spatial derivative) could be observed. The reactive consumption criterion in biofilms and sediments has been extensively detailed by Berg et al. [24]. The fitting of a second-degree polynomic model allowed the oxygen consumption rate (OCR) to be estimated, following Equation (5). The resulting value was 9.42 × 10⁻³ mol·s−1·m−3, which is on the same order of magnitude as other OCRs reported in literature for aerobic biofilms [25,26]. Below this presumable aerobic layer, the DO concentration stabilised for ~20 μm. The resulting, almost flat profile, reveals the existence of another biofilm region, in which oxygen is no longer being consumed. This led us to hypothesise that this zone is mainly inhabited by microorganisms other than aerobes, which thrive because of the “oxygen-diffusion barrier” provided by the upper layers of the biofilm. This narrow microenvironment seems to be the logical candidate to host the Geobacter population, which is the most important exoelectrogen found in our biofilm (see Section 3.4). Several authors maintain that these low DO conditions are optimal for the growth and development of Geobacter; however, this is still an issue subject to some controversy, as discussed in a recent review by Reguera and Kashefi [27]. This review summarises research that concludes a certain tolerance of Geobacter to oxygen, as reflected in its capacity to encode proteins of the oxidative stress response and to adapt to microaerophilic conditions.
The relatively small thickness of this “exoelectrogen” layer does not contradict the high CD observed in our set-up (~2 mA·cm−2), which is in agreement with previous studies that show that the exoelectrogenic activity of Geobacter is due to “active” layers of little thickness relative to the total width of the biofilm [28,29].
When the microsensor tip was placed at a depth of 550 μm (leaving the biofilm vicinity and entering the bulk of the carbon felt electrode), the oxygen concentration began to slightly increase again, and over a very wide region (spanning depths from ~800 to 2500 μm), the average DO was about 130 μM. In this zone, the DO concentration profile presented two very pronounced “hills” that can be attributed to the existence of large cavities within the carbon felt (Figure 1). These hills showed similar slope values to those found in the DBL of the external surface of the electrode, thus, suggesting a common subjacent phenomenon. Likely, these cavities are acting as “channels” that allow the transport of DO through the electrode, revealing a complex structure that has been extensively studied in electrochemical energy-storage systems [30,31,32]. A relevant reason for the lack of colonisation by exoelectrogens of carbon felt electrodes in deep layers may be due to its porous structure that may be channelling DO to the inner domain. Although, the size of the pores (~300 μm, see Figure 2) also suggests that the limited diffusion of the buffering substances is a plausible hypothesis for this lack of colonisation, as has been pointed out in recent research [33]. In this investigation, for cavities in bioanodes between 100 and 500 μm, the limiting factor for the development of the biofilm was determined to be the accumulation of metabolites that triggers local acidification. As a consequence of these results, this same structure could be relevant to carry or remove other substances related to the microbial metabolism (e.g., substrate, inhibitors, protons), highlighting the importance of the optimization of the volume/active area electrode relationship in different applications of METs, an aspect which has been remarked on in other studies [33,34,35,36]. The behaviour of carbon felt anodes without attached biofilm has not been analysed in this study, since there is an extensive literature on the subject and the results obtained have been acceptably consistent with the expected cavity distributions [37,38].

2.3. The Biofilm under Substrate Limited Conditions

In the final phase of the experiment, the anodic biofilm was kept under starving conditions for seven days (once CD declined below 10% of its maximum value, no acetate was fed to the anode). After this period, when acetate was fed again, the oxygen concentration decreased, as observed previously (results not shown, the behaviour was similar to that depicted in Figure 1), revealing a hypothetic reactivation of the aerobic metabolism. However, CD profiles did not resume previous values and remained below 5% of the maximum current value, which suggests that electrogenic microorganisms were affected by either the lack of a carbon source, the prolonged exposure to oxygen, or both. However, the lack of carbon source can be ruled out, since previous work has shown that electrogenic biofilms can remain active for long periods of time in the absence of a carbon source [39,40]. In contrast, the exposure to oxygen seems a more plausible explanation. Indeed, when acetate is present and available to the aerobic microorganisms, these are capable of depleting oxygen from the bulk (Figure 1), thus, protecting the electrogenic microorganisms in contact with the electrode from DO. In the absence of a carbon source, the aerobic microorganisms are no longer capable of consuming oxygen, and the “barrier effect” is lost, which increases the local DO concentration and exposure times in deep layers of the biofilm. However, this is a hypothesis that needs to be supported by further experiments.

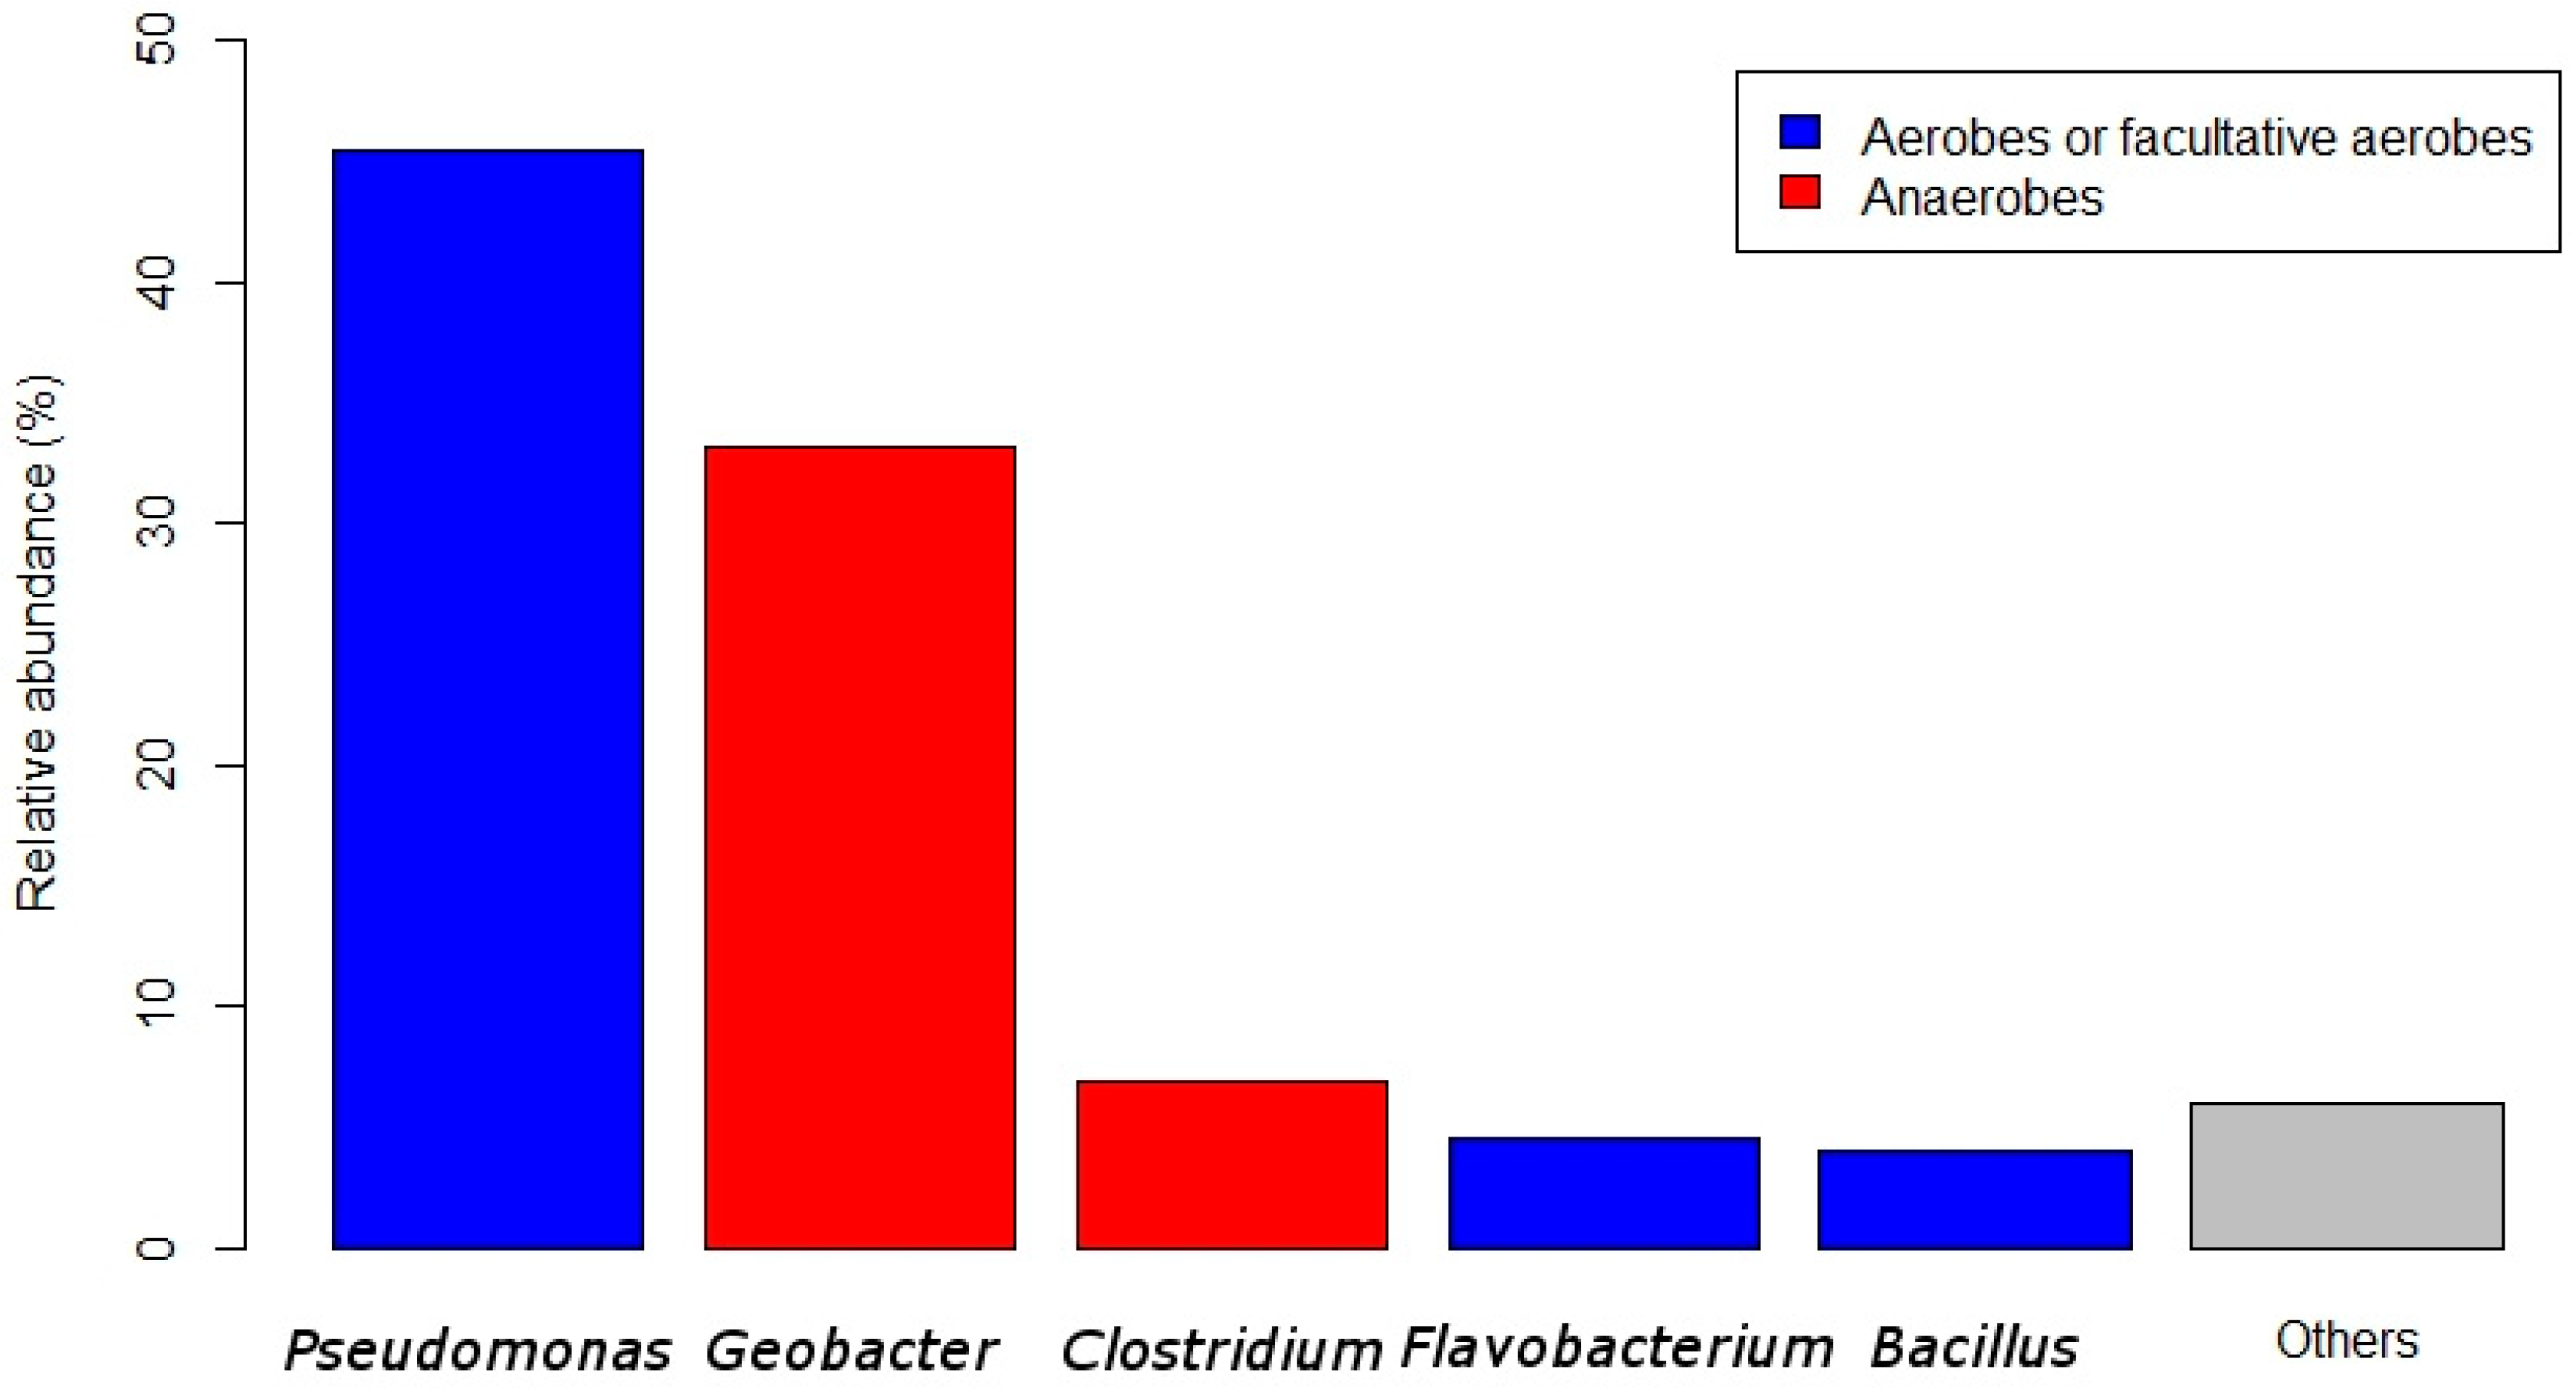
2.4. Biofilm Composition

The microbial composition of the biofilm was analysed by pyrosequencing after 90 days of operation. The total number of pyrosequencing reads were 41,523, and the valid reads were 26,002 (62.6%). The number of operational taxonomic units (OTUs) found in the sample was 126, a number that indicates the high specialization of this community.
The taxonomic composition at the genus level (Figure 4) of the anodic community shows a great relative abundance of the exoelectrogen Geobacter (33.2%). The presence of this anaerobic bacteria in an air-exposed surface is not surprising in light of other research that has shown the presence of Geobacter in both natural [41] and engineered aerobic biofilms [19,42]. The stratification of DO through the carbon felt (see Figure 3 and Figure 4) probably promoted the appearance of “low oxygen” microenvironments, coherent with the tolerance of Geobacter to the presence of DO [27]. The most abundant genus on the biofilm was Pseudomonas (45.5%), which is considered a facultative anaerobe that could be favoured as a result of microaerophilic conditions [43] and has been recognised as electroactive. However, Pseudomonas can be discarded as the main exoelectrogen in our study since the reported current densities for this genus are lower than expected for Geobacter-based electrogenic biofilms [7,44], which are in accordance with those observed in this study (~2 mA·cm−2). Species assigned to this taxon, such as P. aeruginosa, are capable of oxidising organic matter using oxygen as a terminal electron acceptor, inducing steep gradients in DO concentrations in pure culture biofilms [7,20]. Another less prevalent genus in the sample was Clostridium (6.9%), a strict anaerobic that can ferment a variety of substrates. The genera Flavobacterium (4.5%) and Bacillus (4.1%) can generally be considered aerobic. However, their role in this community is not fully understood. Flavobacterium has also been identified in cathodic biofilms exposed to oxygen [17].

3. Experimental

3.1. Reactor Set-Up and Biofilm Growth

Tests were carried out on a biofilm growing in a porous electrode in a specially designed single-chamber microbial electrolysis cell under aerobic conditions for all experimental procedures (Figure 1). The methacrylate reactor allowed for the easy handling of the microelectrode, while using a three-electrode electrical arrangement, establishing a working electrode (WE) potential of +0.1 V with respect to the reference electrode (RE).
A carbon-felt WE (Sigracell® GFA 6, SGL, Wiesbaden, Germany), a commercial RE microelectrode (Ag/AgCl, +0.197 vs. SHE, Unisense, Aarhus, Denmark), and a platinum mesh (Goodfellow, London, UK) counter electrode (CE) was used. The dimensions of the WE and CE were 8 × 2 cm and 2 × 2 cm, respectively. The inoculation procedure consisted of mixing fluvial sediment, freshly obtained with growth medium, in a 1:5 volume ratio. The growth medium composition per litre was 0.87 g of K2HPO4, 0.68 g of KH2PO4, 0.25 g of NH4CL, 0.453 g of MgCl2·6H2O, 0.1 g of KCl, 0.04 g of CaCl2·2H2O, and 10 mL of mineral solution. The mineral solution composition was detailed by Marshall et al. [45]. Sodium acetate was added to the mixture as a carbon source to reach a final concentration of 6.1 mM in the start-up cycle. The reactor was kept at room temperature (22 ± 2 °C). Feeding was done in batch mode (i.e., by replacing the entire medium at the beginning of every new cycle). Sodium acetate was added to achieve a 10 mM concentration in the medium (except in the start-up cycle) when the current dropped below 10% of the maximum value. The biofilm was maintained for 60 days in the described growing conditions (acclimation period) before starting the analyses of this study.

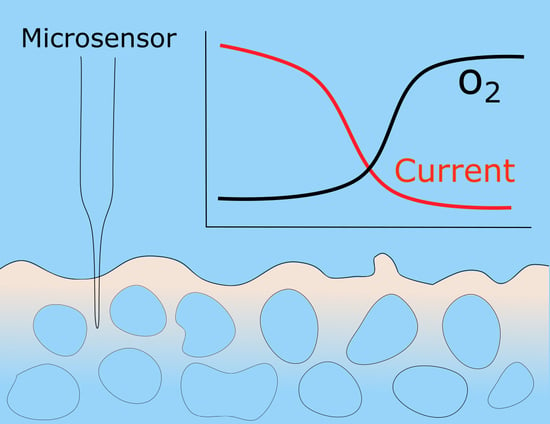
3.2. DO Concentration Measurement

DO concentration in the exoelectrogenic biofilm was measured using a microelectrode (OX-10, UNISENSE, Aarhus, Denmark) that works as a Clark-type electrode [46]. The tip diameter chosen was approximately 10 μm, which ensures an adequate relationship with the estimated thickness of the biofilm (less than 100 μm). The microelectrode was introduced into the thin film cell using a programmable micropositioning system. The step size in the z axis (axis in which the microelectrode passes through the electrode vertically to its surface, Figure 5) was 1 μm ± 20 nm. The permanence time of the microsensor in each position was 3 s, since the response time to reach 90% of the signal, as detailed by the manufacturer, is 1–3 s. The current signal was acquired and registered using a specific amplifier (Microsensor Multimeter, UNISENSE, Aarhus, Denmark) and the associated software (UNISENSE logger). The sensor was calibrated with a two-point procedure. First, it was placed in an air-saturated medium, and then, the zero level was obtained by generously bubbled nitrogen in the same medium. In order to place the microsensor tip at the desired height over the biofilm surface, a video microscope system (Model VCAM3) was used. The analysis of the DO concentration profiles was based on the one-dimensional form of Fick’s first law, assuming the biofilm can be considered a flat slab (Equation (1)):
c t = D · 2 c 2 x O C R
where c is the concentration (mol·m−3), D is the diffusion coefficient (m2·s−1), and OCR (mol·m−3·s−1) is the oxygen consumption rate (OCR is assumed to be constant during the experiment). The D value for oxygen in water at 20 °C (2.27 × 10⁻⁹ m2·s) was obtained from de Beer et al. [22]. For the biofilm, D was corrected using a relative effective diffusion coefficient (Equation (2)):
D b i o = D a q · γ
where Dbio is the oxygen diffusion coefficient in the biofilm, Daq is the oxygen diffusion coefficient in water, and γ is the effective diffusion coefficient, with a value taken as 0.88, according to Lewandowski et al. [21], and it is consistent with other studies [47]. The steady-state solutions to Equation (1) yields Equations (3)–(5):
2 c 2 x = O C R D b i o
c x = O C R D b i o x + A
c = O C R D b i o x 2 + A x + B
Equation (5), where A and B are constants, allows us to detect the presence of net oxygen consumption and calculate the OCR in the biofilm if the quadratic term is present (the sign of the second spatial derivative of the DO concentration profile can be used to discern between oxygen consumption or production [24]). In this sense, if the quadratic term is not present, it is possible to estimate the oxygen flux (J), following Equation (4) with OCR = 0 (Equation (6)):
J = D b i o c x
where J is in mol·m−2·s−1. The first or second order models have been used to calculate the coefficients in Equation (3), according to convenience, in each zone of the profile, using R software [48] to perform the least squares regression. R has also been used to elaborate the graphs.

3.3. Experimental Procedure

DO concentration profiles were recorded at various stages during the substrate degradation cycles, once the start-up and stabilization period was completed. The most stable profiles, like those analysed in this article, were produced during the constant part of the current cycle, which occurs between the feeding and final decay. To perform the DO concentration profiles, the microelectrode tip was placed 500 μm from the apparent surface of the biofilm and then moved 5 mm through the carbon felt electrode. The position of the microelectrode was changed every 3 s for profile recording, assuming that the nominal response time was less than this interval. For a constant height measurement, the microelectrode was held outside the diffusion boundary layer (DBL), 100 μm above the apparent surface of the biofilm. Total organic carbon (TOC) was determined by a TOC multi N/C 3100 (Analytikjena, Jena, Germany).

3.4. Microbial Community Analysis

Once the experiment was completed, a sample was taken for the analysis of microbial communities. For this purpose, a 1 × 1 cm portion of carbon felt was cut using sterilised scissors. Genomic DNA from the electrodic sample was extracted with the PowerSoil® DNA Isolation Kit (MoBio Laboratories Inc., Carlsbad, CA, USA), following the manufacturer’s instructions. The entire DNA extract was used for the pyrosequencing of the 16S-rRNA gene-based massive library, targeting the eubacterial region V1–V3 16S-rRNA, and performed at MR DNA (www.mrdnalab.com, Shallowater, TX, USA), utilising MiSeq equipment (Illumina, San Diego, CT, USA). The primer set used was 27Fmod (5′-AGRGTTTGATCMTGGCTCAG-3′) /519 R modBio (5′-GTNTTACNGCGGCKGCTG-3′). Diluted DNA extracts were used as a template for polymerase chain reaction (PCR) reactions. The obtained DNA reads were compiled in FASTq files for further bioinformatics processing. The trimming of the 16S-rRNA bar-coded sequences into libraries was carried out using QIIME software, version 1.8.018 [49]. Quality filtering of the reads was performed at Q25 quality prior to grouping into operational taxonomic units (OTUs) at a 97% sequence homology cut-off. The following steps were performed using QIIME, a denoising procedure using a denoiser algorithm [50]. Final OTUs were taxonomically classified using BLASTn against a database derived from the Ribosomal Database Project II (RDPII, http://rdp.cme.msu.edu) and the National Centre for Biotechnology Information (NCBI, www.ncbi.nlm.nih.gov).

4. Conclusions

The proliferation and biocatalytic activity of Geobacter in air-exposed anodes depends on the anaerobic microenvironment provided by the aerobic microorganisms present in outer layers of the biofilm, which consume DO. The porous structure of the carbon felt causes the channelling of DO in internal zones. This study confirms Geobacter’s tolerance to sustained oxygen concentrations below 90 μM. During periods in which the biofilm is maintained without substrate, oxygen diffuses through the biofilm height. If these periods without substrate are longer than six days, the inner electroactive layers seem to be irreversibly affected, and the exoelectrogenic activity does not resume again after feeding.

Supplementary Materials

The following are available online at https://www.mdpi.com/2073-4344/10/11/1341/s1, Figure S1: Dissolved oxygen profile. Rejected because the data acquisition system was accidentally interrupted at the end of the experiment; Figure S2: Another dissolved oxygen profile. Rejected because the data acquisition system was accidentally interrupted at the end of the experiment.

Author Contributions

R.M.A. contributed to the conceptual design of the experiment, carrying out the experimental procedures, data analysis, results interpretation and drafting the manuscript. G.P.: performed the microbiological analysis and provided assistance in the laboratory. M.I.S.-M. also provided assistance in the laboratory and contributed to results’ interpretation. A.M.: contributed to results interpretation, being responsible for project administration and funding acquisition. A.E.: contributed to the conceptualization, results interpretation, project supervision and writing/reviewing the manuscript. All authors have read and agreed to the published version of the manuscript.

Funding

This research was possible thanks to the financial support by ‘Consejería de Educación de la Junta de Castilla y León’ (ref: LE320P18), a project co-financed by FEDER funds. R. M. Alonso thanks the University of León for his predoctoral contract.

Conflicts of Interest

The authors declare that the research was conducted in the absence of any commercial or financial relationships that could be construed as a potential conflict of interest.

References

  1. Escapa, A.; Mateos, R.; Martínez, E.J.; Blanes, J. Microbial electrolysis cells: An emerging technology for wastewater treatment and energy recovery. From laboratory to pilot plant and beyond. Renew. Sustain. Energy Rev. 2016, 55, 942–956. [Google Scholar] [CrossRef]
  2. Logan, B.E. Exoelectrogenic bacteria that power microbial fuel cells. Nat. Rev. Microbiol. 2009, 7, 375–381. [Google Scholar] [CrossRef]
  3. Flemming, H.-C.; Wingender, J.; Szewzyk, U.; Steinberg, P.; Rice, S.A.; Kjelleberg, S. Biofilms: An emergent form of bacterial life. Nat. Rev. Microbiol. 2016, 14, 563–575. [Google Scholar] [CrossRef] [PubMed]
  4. Koch, C.; Harnisch, F. Is there a specific ecological niche for electroactive microorganisms? ChemElectroChem 2016, 3, 1282–1295. [Google Scholar] [CrossRef]
  5. Wang, C.; Shen, J.; Chen, Q.; Ma, D.; Zhang, G.; Cui, C.; Xin, Y.; Zhao, Y.; Hu, C. The inhibiting effect of oxygen diffusion on the electricity generation of three-chamber microbial fuel cells. J. Power Sources 2020, 453, 227889. [Google Scholar] [CrossRef]
  6. Yang, L.-H.; Zhu, T.-T.; Cai, W.-W.; Haider, M.R.; Wang, H.-C.; Cheng, H.-Y.; Wang, A.-J. Micro-oxygen bioanode: An efficient strategy for enhancement of phenol degradation and current generation in mix-cultured MFCs. Bioresour. Technol. 2018, 268, 176–182. [Google Scholar] [CrossRef]
  7. Yong, X.-Y.; Yan, Z.-Y.; Shen, H.-B.; Zhou, J.; Wu, X.-Y.; Zhang, L.-J.; Zheng, T.; Jiang, M.; Wei, P.; Jia, H.-H.; et al. An integrated aerobic-anaerobic strategy for performance enhancement of Pseudomonas aeruginosa-inoculated microbial fuel cell. Bioresour. Technol. 2017, 241, 1191–1196. [Google Scholar] [CrossRef]
  8. Zhang, X.; Cheng, S.; Wang, X.; Huang, X.; Logan, B.E. Separator characteristics for increasing performance of microbial fuel cells. Environ. Sci. Technol. 2009, 43, 8456–8461. [Google Scholar] [CrossRef] [PubMed]
  9. Saxena, P.; Joshi, Y.; Rawat, K.; Bisht, R. Biofilms: Architecture, resistance, quorum sensing and control mechanisms. Indian J. Microbiol. 2019, 59, 3–12. [Google Scholar] [CrossRef] [PubMed]
  10. Lewandowski, Z.; Beyenal, H. Fundamentals of Biofilm Research; CRC Press: Boca Raton, FL, USA, 2013. [Google Scholar]
  11. Beyenal, H.; Babauta, J.T. Biofilms in Bioelectrochemical Systems: From Laboratory Practice to Data Interpretation; John Wiley & Sons: Hoboken, NJ, USA, 2015. [Google Scholar]
  12. Maegaard, K.; Garcia-Robledo, E.; Kofoed, M.V.W.; Agneessens, L.M.; de Jonge, N.; Nielsen, J.L.; Ottosen, L.D.M.; Nielsen, L.P.; Revsbech, N.P. Biogas upgrading with hydrogenotrophic methanogenic biofilms. Bioresour. Technol. 2019, 287, 121422. [Google Scholar] [CrossRef]
  13. Atci, E.; Babauta, J.T.; Sultana, S.T.; Beyenal, H. Microbiosensor for the detection of acetate in electrode-respiring biofilms. Biosens. Bioelectron. 2016, 81, 517–523. [Google Scholar] [CrossRef] [PubMed] [Green Version]
  14. Lee, W.H.; Wahman, D.G.; Pressman, J.G. Amperometric carbon fiber nitrite microsensor for in situ biofilm monitoring. Sens. Actuators B Chem. 2013, 188, 1263–1269. [Google Scholar] [CrossRef]
  15. Zhou, L.; Yan, X.; Yan, Y.; Li, T.; An, J.; Liao, C.; Li, N.; Wang, X. Electrode potential regulates phenol degradation pathways in oxygen-diffused microbial electrochemical system. Chem. Eng. J. 2020, 381, 122663. [Google Scholar] [CrossRef]
  16. Wang, Z.; Deng, H.; Chen, L.; Xiao, Y.; Zhao, F. In situ measurements of dissolved oxygen, pH and redox potential of biocathode microenvironments using microelectrodes. Bioresour. Technol. 2013, 132, 387–390. [Google Scholar] [CrossRef] [PubMed]
  17. Montpart, N.; Rago, L.; Baeza, J.A.; Guisasola, A. Oxygen barrier and catalytic effect of the cathodic biofilm in single chamber microbial fuel cells. J. Chem. Technol. Biotechnol. 2018, 93, 2199–2207. [Google Scholar] [CrossRef]
  18. San-Martín, M.I. Bioelectrochemical Systems for Energy Valorization of Waste Streams; Leicester, D.D., Ed.; IntechOpen: Rijeka, Yugoslavia, 2018; Chapter 8; ISBN 978-1-78923-711-5. [Google Scholar]
  19. Qu, Y.; Feng, Y.; Wang, X.; Logan, B.E. Use of a coculture to enable current production by geobacter sulfurreducens. Appl. Environ. Microbiol. 2012, 78, 3484–3487. [Google Scholar] [CrossRef] [Green Version]
  20. Kragh, K.N.; Hutchison, J.B.; Melaugh, G.; Rodesney, C.; Roberts, A.E.L.; Irie, Y.; Jensen, P.Ø.; Diggle, S.P.; Allen, R.J.; Gordon, V.; et al. Role of multicellular aggregates in biofilm formation. MBio 2016, 7, e00237-16. [Google Scholar] [CrossRef] [Green Version]
  21. Lewandowski, Z.; Walser, G.; Characklis, W.G. Reaction kinetics in biofilms. Biotechnol. Bioeng. 1991, 38, 877–882. [Google Scholar] [CrossRef]
  22. De Beer, D.; Stoodley, P.; Roe, F.; Lewandowski, Z. Effects of biofilm structures on oxygen distribution and mass transport. Biotechnol. Bioeng. 1994, 43, 1131–1138. [Google Scholar] [CrossRef]
  23. Mclamore, E.S.; Zhang, W.; Porterfield, D.M.; Banks, M.K. Membrane-aerated biofilm proton and oxygen flux during chemical toxin exposure. Environ. Sci. Technol. 2010, 44, 7050–7057. [Google Scholar] [CrossRef]
  24. Berg, P.; Risgaard-Petersen, N.; Rysgaard, S. Interpretation of measured concentration profiles in sediment pore water. Limnol. Oceanogr. 1998, 43, 1500–1510. [Google Scholar] [CrossRef] [Green Version]
  25. Ning, Y.-F.; Chen, Y.-P.; Shen, Y.; Zeng, N.; Liu, S.-Y.; Guo, J.-S.; Fang, F. A new approach for estimating aerobic–anaerobic biofilm structure in wastewater treatment via dissolved oxygen microdistribution. Chem. Eng. J. 2014, 255, 171–177. [Google Scholar] [CrossRef]
  26. Stewart, P.S. Diffusion in biofilms. J. Bacteriol. 2003, 185, 1485–1491. [Google Scholar] [CrossRef] [PubMed] [Green Version]
  27. Reguera, G.; Kashefi, K. The electrifying physiology of Geobacter bacteria, 30 years on. Adv. Microb. Physiol. 2019, 74, 1–96. [Google Scholar]
  28. Sun, D.; Chen, J.; Huang, H.; Liu, W.; Ye, Y.; Cheng, S. The effect of biofilm thickness on electrochemical activity of geobacter sulfurreducens. Int. J. Hydrogen Energy 2016, 41. [Google Scholar] [CrossRef]
  29. Sun, D.; Cheng, S.; Wang, A.; Li, F.; Logan, B.E.; Cen, K. Temporal-spatial changes in viabilities and electrochemical properties of anode biofilms. Environ. Sci. Technol. 2015, 49, 5227–5235. [Google Scholar] [CrossRef]
  30. Banerjee, R.; Bevilacqua, N.; Eifert, L.; Zeis, R. Characterization of carbon felt electrodes for vanadium redox flow batteries—A pore network modeling approach. J. Energy Storage 2019, 21, 163–171. [Google Scholar] [CrossRef]
  31. Döner, A.; Karcı, İ.; Kardaş, G. Effect of C-felt supported Ni, Co and NiCo catalysts to produce hydrogen. Int. J. Hydrogen Energy 2012, 37, 9470–9476. [Google Scholar] [CrossRef]
  32. González, Z.; Sánchez, A.; Blanco, C.; Granda, M.; Menéndez, R.; Santamaría, R. Enhanced performance of a Bi-modified graphite felt as the positive electrode of a vanadium redox flow battery. Electrochem. Commun. 2011, 13, 1379–1382. [Google Scholar] [CrossRef] [Green Version]
  33. Chong, P.; Erable, B.; Bergel, A. Effect of pore size on the current produced by 3-dimensional porous microbial anodes: A critical review. Bioresour. Technol. 2019, 289, 121641. [Google Scholar] [CrossRef] [Green Version]
  34. Blanchet, E.; Erable, B.; De Solan, M.-L.; Bergel, A. Two-dimensional carbon cloth and three-dimensional carbon felt perform similarly to form bioanode fed with food waste. Electrochem. Commun. 2016. [Google Scholar] [CrossRef] [Green Version]
  35. Brunschweiger, S.; Ojong, E.T.; Weisser, J.; Schwaferts, C.; Elsner, M.; Ivleva, N.P.; Haseneder, R.; Hofmann, T.; Glas, K. The effect of clogging on the long-term stability of different carbon fiber brushes in microbial fuel cells for brewery wastewater treatment. Bioresour. Technol. Rep. 2020, 11, 100420. [Google Scholar] [CrossRef]
  36. Flexer, V.; Jourdin, L. Purposely designed hierarchical porous electrodes for high rate microbial electrosynthesis of acetate from carbon dioxide. Acc. Chem. Res. 2020, 53, 311–321. [Google Scholar] [CrossRef]
  37. Ma, P.; Ma, H.; Galia, A.; Sabatino, S.; Scialdone, O. Reduction of oxygen to H2O2 at carbon felt cathode in undivided cells. Effect of the ratio between the anode and the cathode surfaces and of other operative parameters. Sep. Purif. Technol. 2019, 208, 116–122. [Google Scholar] [CrossRef]
  38. Smith, R.E.G.; Davies, T.J.; Baynes, N.d.B.; Nichols, R.J. The electrochemical characterisation of graphite felts. J. Electroanal. Chem. 2015, 747, 29–38. [Google Scholar] [CrossRef] [Green Version]
  39. Marozava, S.; Röling, W.F.M.; Seifert, J.; Küffner, R.; von Bergen, M.; Meckenstock, R.U. Physiology of geobacter metallireducens under excess and limitation of electron donors. Part II. Mimicking environmental conditions during cultivation in retentostats. Syst. Appl. Microbiol. 2014, 37, 287–295. [Google Scholar] [CrossRef] [Green Version]
  40. Lin, B.; Westerhoff, H.V.; Röling, W.F.M. How geobacteraceae may dominate subsurface biodegradation: Physiology of geobacter metallireducens in slow-growth habitat-simulating retentostats. Environ. Microbiol. 2009, 11, 2425–2433. [Google Scholar] [CrossRef]
  41. Commault, A.S.; Barrière, F.; Lapinsonnière, L.; Lear, G.; Bouvier, S.; Weld, R.J. Influence of inoculum and anode surface properties on the selection of Geobacter-dominated biofilms. Bioresour. Technol. 2015, 195, 265–272. [Google Scholar] [CrossRef]
  42. Nevin, K.P.; Zhang, P.; Franks, A.E.; Woodard, T.L.; Lovley, D.R. Anaerobes unleashed: Aerobic fuel cells of Geobacter sulfurreducens. J. Power Sources 2011, 196, 7514–7518. [Google Scholar] [CrossRef]
  43. Peix, A.; Ramírez-Bahena, M.-H.; Velázquez, E. Historical evolution and current status of the taxonomy of genus Pseudomonas. Infect. Genet. Evol. 2009, 9, 1132–1147. [Google Scholar] [CrossRef]
  44. Su, W.; Zhang, L.; Li, D.; Zhan, G.; Qian, J.; Tao, Y. Dissimilatory nitrate reduction by Pseudomonas alcaliphila with an electrode as the sole electron donor. Biotechnol. Bioeng. 2012, 109, 2904–2910. [Google Scholar] [CrossRef] [PubMed]
  45. Marshall, C.W.; Ross, D.E.; Fichot, E.B.; Norman, R.S.; May, H.D. Electrosynthesis of commodity chemicals by an autotrophic microbial community. Appl. Environ. Microbiol. 2012, 78, 8412–8420. [Google Scholar] [CrossRef] [PubMed] [Green Version]
  46. Revsbech, N.P. An oxygen microsensor with a guard cathode. Limnol. Oceanogr. 1989, 34, 474–478. [Google Scholar] [CrossRef]
  47. Stewart, P.S. A review of experimental measurements of effective diffusive permeabilities and effective diffusion coefficients in biofilms. Biotechnol. Bioeng. 1998, 59, 261–272. [Google Scholar] [CrossRef]
  48. R Core Team. R: A Language and Environment for Statistical Computing; R Foundation for Statistical Computing: Vienna, Austria, 2015. [Google Scholar]
  49. Caporaso, J.G.; Kuczynski, J.; Stombaugh, J.; Bittinger, K.; Bushman, F.D.; Costello, E.K.; Fierer, N.; Pena, A.G.; Goodrich, J.K.; Gordon, J.I.; et al. QIIME allows analysis of high-throughput community sequencing data. Nat. Methods 2010, 7, 335–336. [Google Scholar] [CrossRef] [PubMed] [Green Version]
  50. Reeder, J.; Knight, R. Rapidly denoising pyrosequencing amplicon reads by exploiting rank-abundance distributions. Nat. Methods 2010, 7, 668–669. [Google Scholar] [CrossRef]
Figure 1. Biofilm current density (CD) and dissolved oxygen (DO) concentration profiles at a constant depth of 100 μm on the apparent surface of the biofilm during three consecutive feeding cycles. The blue stars denote spiking with sodium acetate (to a theoretical concentration of 10 mM).
Catalysts 10 01341 g001
Figure 2. DO concentration profile in a carbon felt electrode colonised by an exoelectrogenic biofilm.
Catalysts 10 01341 g002
Figure 3. Detailed DO concentration profile in the vicinity of the biofilm. In the colours corresponding to each zone, fitted regression models are provided.
Catalysts 10 01341 g003
Figure 4. Microbial community composition of the anodic biofilm at the genus level.
Catalysts 10 01341 g004
Figure 5. Experimental set-up: camera (1); three-axis micropositioner (2); microelectrode (3); connections to the potentiostat (4); methacrylate cell (5); counter electrode (CE) (6); reference electrode (RE) adapter (7); working electrode (WE) (8); and microelectrode sampling hole (9).
Catalysts 10 01341 g005
Publisher’s Note: MDPI stays neutral with regard to jurisdictional claims in published maps and institutional affiliations.

