Article

Thermodynamics of Chemical Processes in the System of Nanocrystalline Iron–Ammonia–Hydrogen at 350 °C

by
Bartłomiej Wilk
1,*,
Artur Błachowski
2,
Zofia Lendzion-Bieluń
1 and
Walerian Arabczyk
1
1
Department of Inorganic Chemical Technology and Environment Engineering, Faculty of Chemical Technology and Engineering, West Pomeranian University of Technology, Pułaskiego St. 10, 70-322 Szczecin, Poland
2
Mössbauer Spectroscopy Laboratory, Institute of Physics, Pedagogical University, Podchorążych St. 2, 30-084 Kraków, Poland
*
Author to whom correspondence should be addressed.
Catalysts 2020, 10(11), 1242; https://doi.org/10.3390/catal10111242
Submission received: 7 October 2020 / Revised: 23 October 2020 / Accepted: 25 October 2020 / Published: 27 October 2020

Abstract

:
Nanocrystalline iron nitriding and the reduction of nanocrystalline iron nitrides in steady states at 350 °C are described using the chemical potential programmed reaction (CPPR), thermogravimetry (TG), 57Fe Mössbauer spectroscopy (MS), and X-ray diffraction (XRD) methods. It was determined that during the process of nitriding of nanocrystalline iron, larger nanocrystallites formed the γ’ phase and the smallest nanocrystallites (about 4%) were transformed into the α” phase. Both phases were in chemical equilibrium, with the gas phase at the temperature of 350 °C. Stable iron nitride α” was also formed in the ε iron nitride reduction process. Taking the α” phase in the system of nanocrystalline Fe-NH3-H2 into account, it was found that at certain nitriding potentials in the chemical equilibrium state, three solid phases in the nitriding process and four solid phases in the reduction process may coexist. It was also found that the nanocrystallites of ε iron nitride in their reduction process were transformed according to two mechanisms, depending on their size. Larger nanocrystallites of iron nitride ε were transformed into the α-iron phase through iron nitride γ’, and smaller nanocrystallites of ε nitride went through iron nitride α”. In the passivation process of nanocrystalline iron and/or nanocrystalline iron nitrides, amorphous phases of iron oxides and/or iron oxynitrides were formed on their surface.

Graphical Abstract

1. Introduction

The process of the gaseous nitriding of metals and their alloys is one of the most common thermo-chemical treatment techniques carried out to improve their physicochemical properties. The extensive literature on steel finishing covers the practical aspects of the nitriding of solid and coarse-crystalline materials [1,2,3,4,5,6,7]. The first detailed analysis of an iron–nitrogen system, along with the systematization of the state of knowledge, was carried out by Jack, who developed the widely recognized phase system of iron–nitrogen [8,9,10]. The system was then extended to include temperatures above 900 °C [11] and below 400 °C [12,13].
The physicochemical properties of iron and iron nitrides in an iron–nitrogen system differ depending on whether these materials are coarse-crystalline or nanocrystalline, and the size of nanocrystallites affects the course of phase changes [14,15,16,17].
The thermodynamic and kinetic parameters of nitriding and reduction processes in a system of nanocrystalline iron–ammonia–hydrogen depend on the size of the nanocrystallites present in the system [18,19,20,21,22,23,24,25,26,27,28,29].
Nanocrystalline iron can be obtained by reducing an alloy of iron oxides with hardly reducible alumina, calcium, and potassium oxides [30,31].
After the process, a two-dimensional structure of hardly reducible oxides is formed on the surface of nanocrystalline iron, in which iron atoms connect through oxygen bridges with metal atoms from oxides. When the sum of two energies—Gibbs energy required to create this structure and the surface energy of nanocrystalline iron—is minimal, then the iron nanocrystallite present in the reducing atmosphere (ammonia/hydrogen/nitrogen/inert gases) stays in chemical equilibrium state [32].
While studying the nitriding of nanocrystalline iron and the reduction of the obtained nanocrystalline iron nitrides, it was found that a stationary state existed at a constant temperature and with a constant nitriding potential of the ammonia–hydrogen mixture. In the stationary state, the rate of reaction of nitriding equals zero (a constant concentration of nitrogen in the analyzed sample) and the reaction of catalytic ammonia decomposition proceeds at a constant rate. In this state in the nanocrystalline iron–ammonia–hydrogen system, chemical equilibrium holds where the nitrogen chemical potentials—both in the gas phase and on the surface of iron nanocrystallite, as well as in nanocrystallite volume—are equal to one another [33,34,35]. After exceeding the critical nitrogen concentration, the nanocrystallite of the solution of nitrogen in iron, α-Fe(N), is transformed into iron nitride, γ’-FeN0.25. By increasing the gas mixture nitriding potential, nanocrystalline iron nitrides γ’-FeN0.25, ε-FeNx, and ζ-FeN0.5 can be obtained [14,17,36,37,38].
With the same equilibrium nitriding potential, the nitriding degree of nanocrystalline iron in the process of nitriding of nanocrystalline iron is smaller than that in the reduction process of iron nitride nanocrystallites. Hysteresis phenomena involving the dependence of the iron nitriding degree on nitriding potential for processes carried out at temperatures of 300 [29], 350 [26,27], 400 [34,39,40], 450 [34], 475 [35,41], 500 [34,35,42], and 550 °C [34] have been studied in stationary conditions.
For the phase changes of α-Fe↔γ’-FeN0.25 in stationary states or close to stationary states, the minimum nitriding potential needs to carry out the phase transformation of specified nanocrystallites, depending on nanocrystallite size [26,27,28,34,40,43,44,45]. Based on experimental results that supported theoretical calculations, it has been shown that the nanocrystallite phase transformation between the iron α and the iron nitride γ’ phases, in both directions, occurs throughout their volume from the largest to the smallest [27,28,42,45]. A new method was developed to determine the nanocrystallite size distribution by analyzing the dependence of the iron nitriding degree on gas phase nitriding potential [46].
Analyses of nitriding process of nanocrystalline iron and reduction process of the obtained nanocrystalline iron nitrides have shown that phase transformations are observed in a wide range of nitriding potentials at a given temperature [26,27,28,29,34,39,40,42]. In the process of nanocrystalline iron nitriding, apart from the single component areas, there are areas where two phases coexist, and in the reduction process of nanocrystalline iron nitride ε, there are also areas where three solid phases coexist [26,27,28,29,35,41,43]. On the basis of the well-known Lehrer’s diagram for systems of coarse-crystalline iron–ammonia–hydrogen [13,47,48,49,50], the phenomena occurring in a nanocrystalline system cannot be explained [26,27,28,29,33,38,39,40,42,51,52]. Observed differences between nanocrystalline and coarse-crystalline systems can be explained by introducing an additional degree of freedom—the size of nanocrystallites into the Gibbs phase rule [45].
During the study of the nanocrystalline iron–ammonia–hydrogen system by X-ray diffraction, iron nitride α-FeN0.125 has been found. Iron nitride α” was detected by other authors in their works [53,54]. These works have shown the processes of nitriding of nanocrystalline iron in the form of powders, and the iron nitride obtained at temperatures below 170 °C is a metastable phase.
X-ray studies, especially on nanocrystalline materials with low phase content, are not precise enough. Therefore, in order to determine phase content during research, a more accurate method, 57Fe Mössbauer spectroscopy [55,56,57,58], has been applied.
The aim of this work was to determine, in detail, the phase composition changes during the nitriding of nanocrystalline iron and nanocrystalline iron nitride reduction carried out at stationary states in 350 °C. In summary, an interpretation of results was based on a comparison of results obtained using three methods: thermogravimetry (TG), X-ray diffraction (XRD), and Mössbauer spectroscopy (MS).

2. Results and Discussion

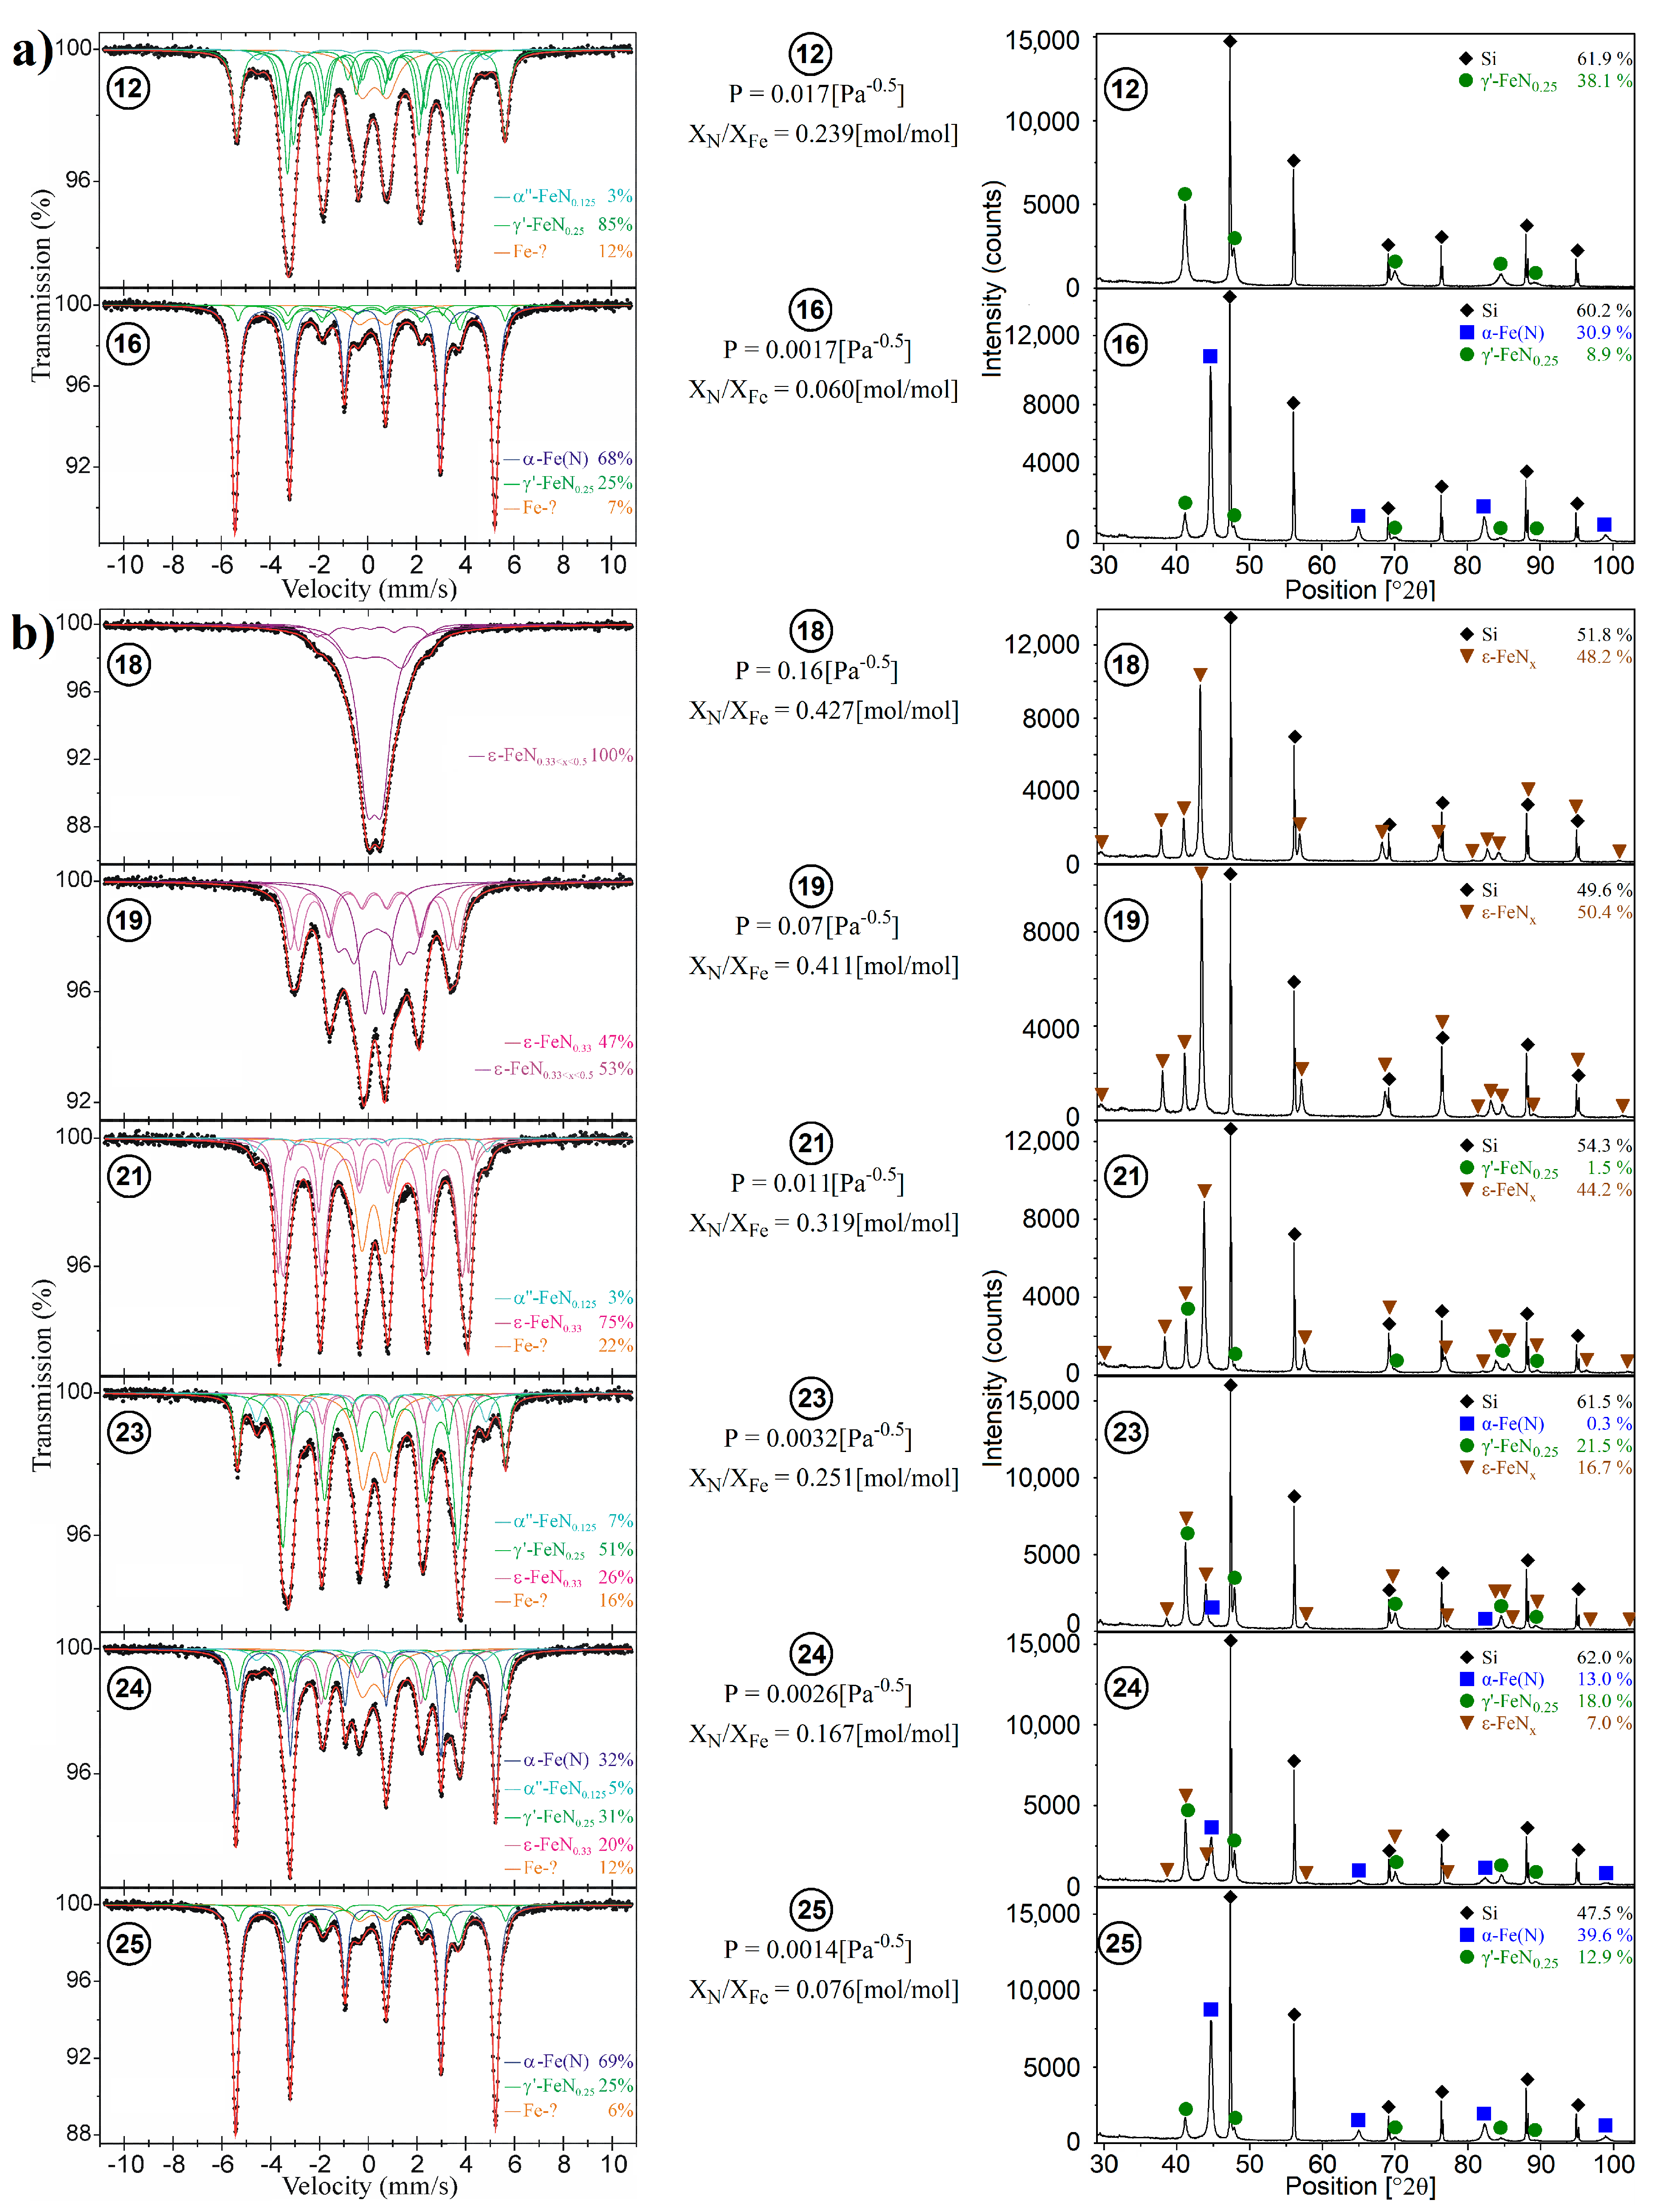
For selected samples, Figure 1 and Figure 2 show that the diffractograms and Mössbauer spectra are compiled. Each spectrum has been separated into the component spectra of phases present in the sample. The Mössbauer parameters for selected spectra and representatives of the identified iron phases are given in Table 1. On the basis of the Mössbauer sub-spectra cross section areas, the distribution of the iron atoms into identified Fe-containing phases was determined.
By taking the phase composition of the samples determined by the XRD method into account and assuming the stoichiometric composition of the phases, the iron content in the phases present in the samples and the summary content of iron in those samples were calculated. Based on that content, the distribution of iron in the given phases for all samples was calculated. The iron contribution in the studied sample in a given phase based on measurement by the XRD and MS methods is shown in Table 2. Additionally, the final values of the nitriding potential at which the samples were obtained and the corresponding values of the nitriding degree (chemical potential programmed reaction-thermogravimetry (CPPR-TG) method) are shown in Table 2.
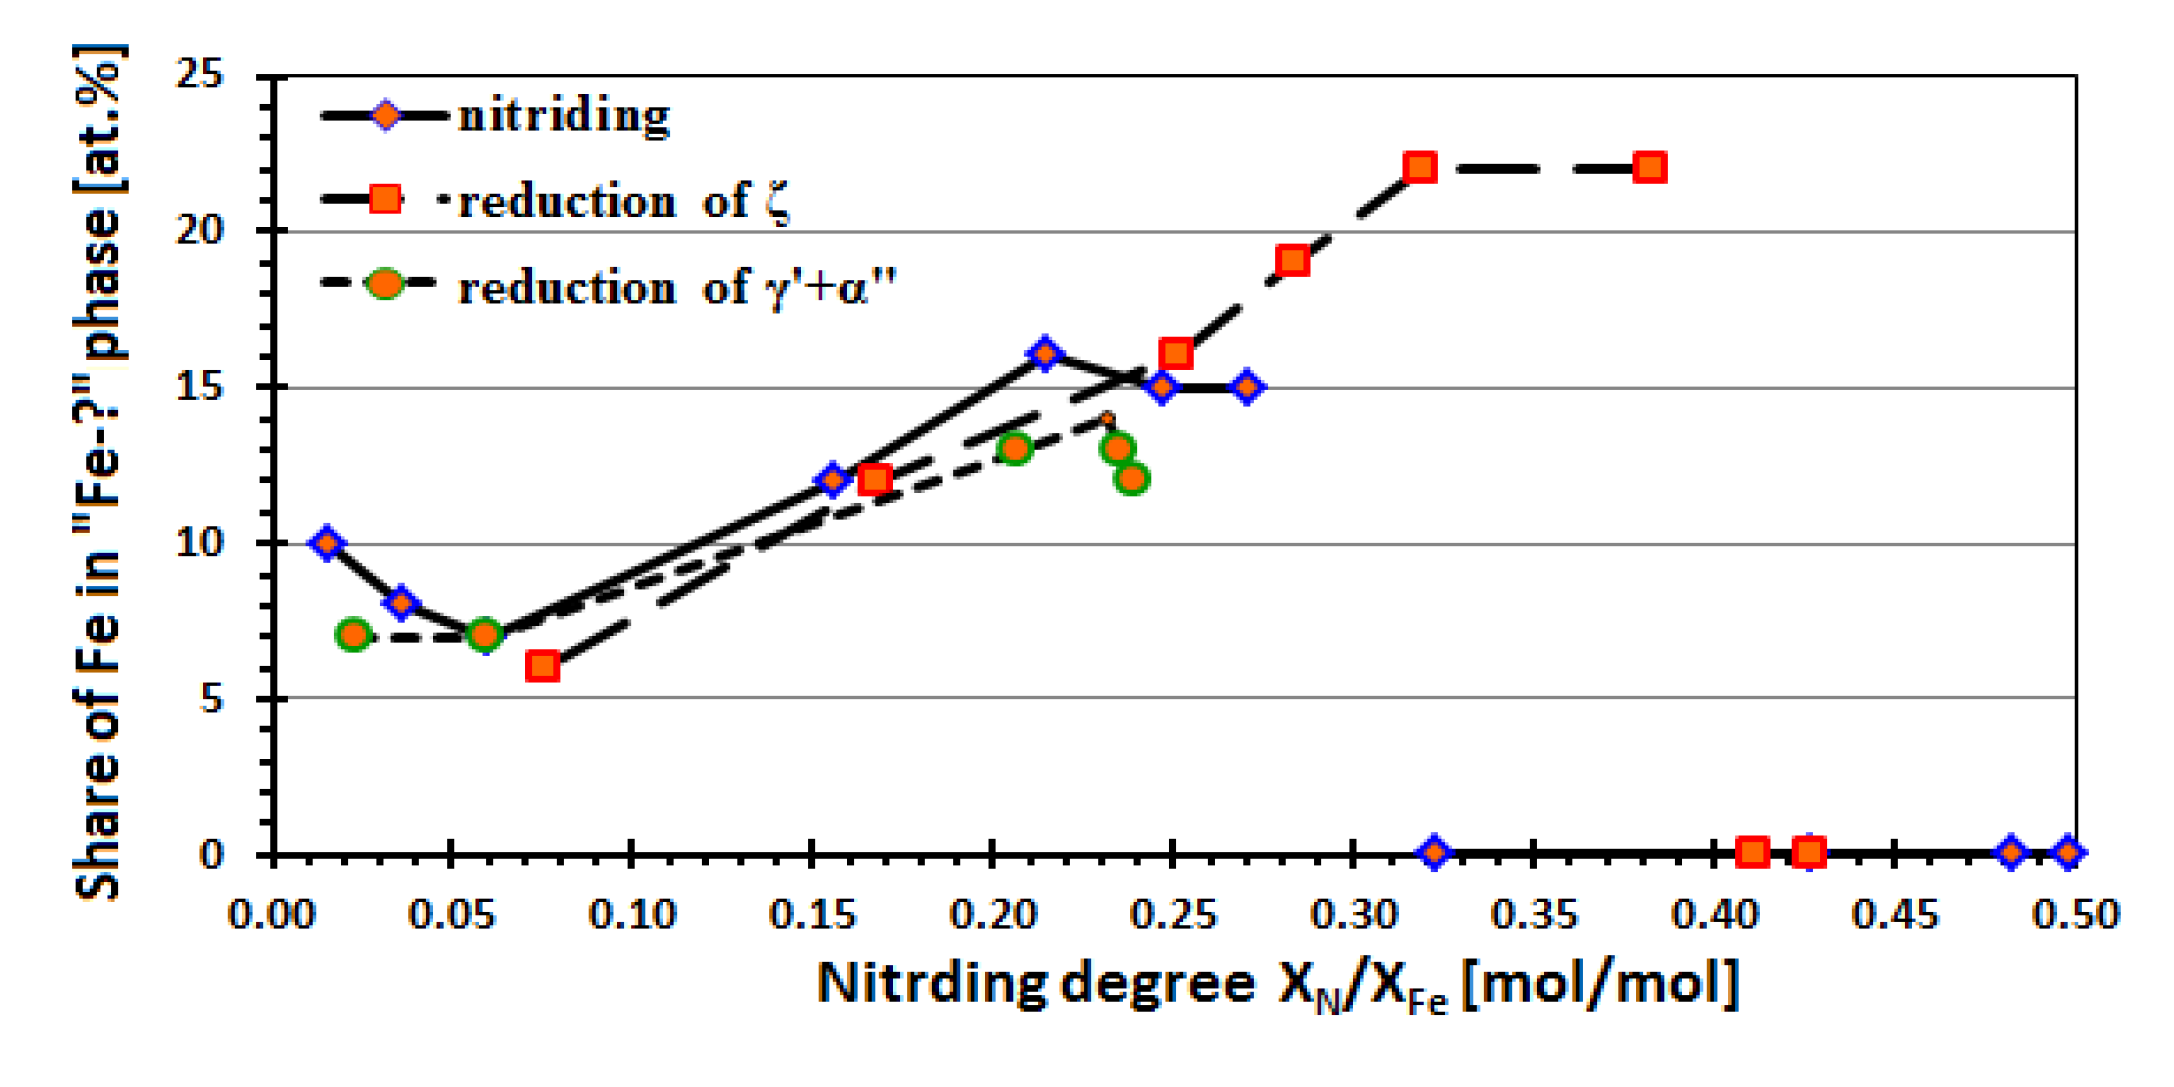
To compare the distribution of iron in the phases of the samples based on measurement by the XRD and MS methods, the following simplifications were used for obtained data using the MS method. The phase marked as “Fe-?” was assumed to be an amorphous phase, which is a layer of iron oxides and/or iron oxynitrides formed on the surface of nanocrystallites in the process of passivation. Figure 3 presents the dependence of iron content in the amorphous phase on the nitriding degree of the samples. The amorphous phase was not observed in X-ray studies, so the distribution of iron in this phase according to the MS method was divided into the remaining phases in proportion to the phase composition obtained by the XRD method.
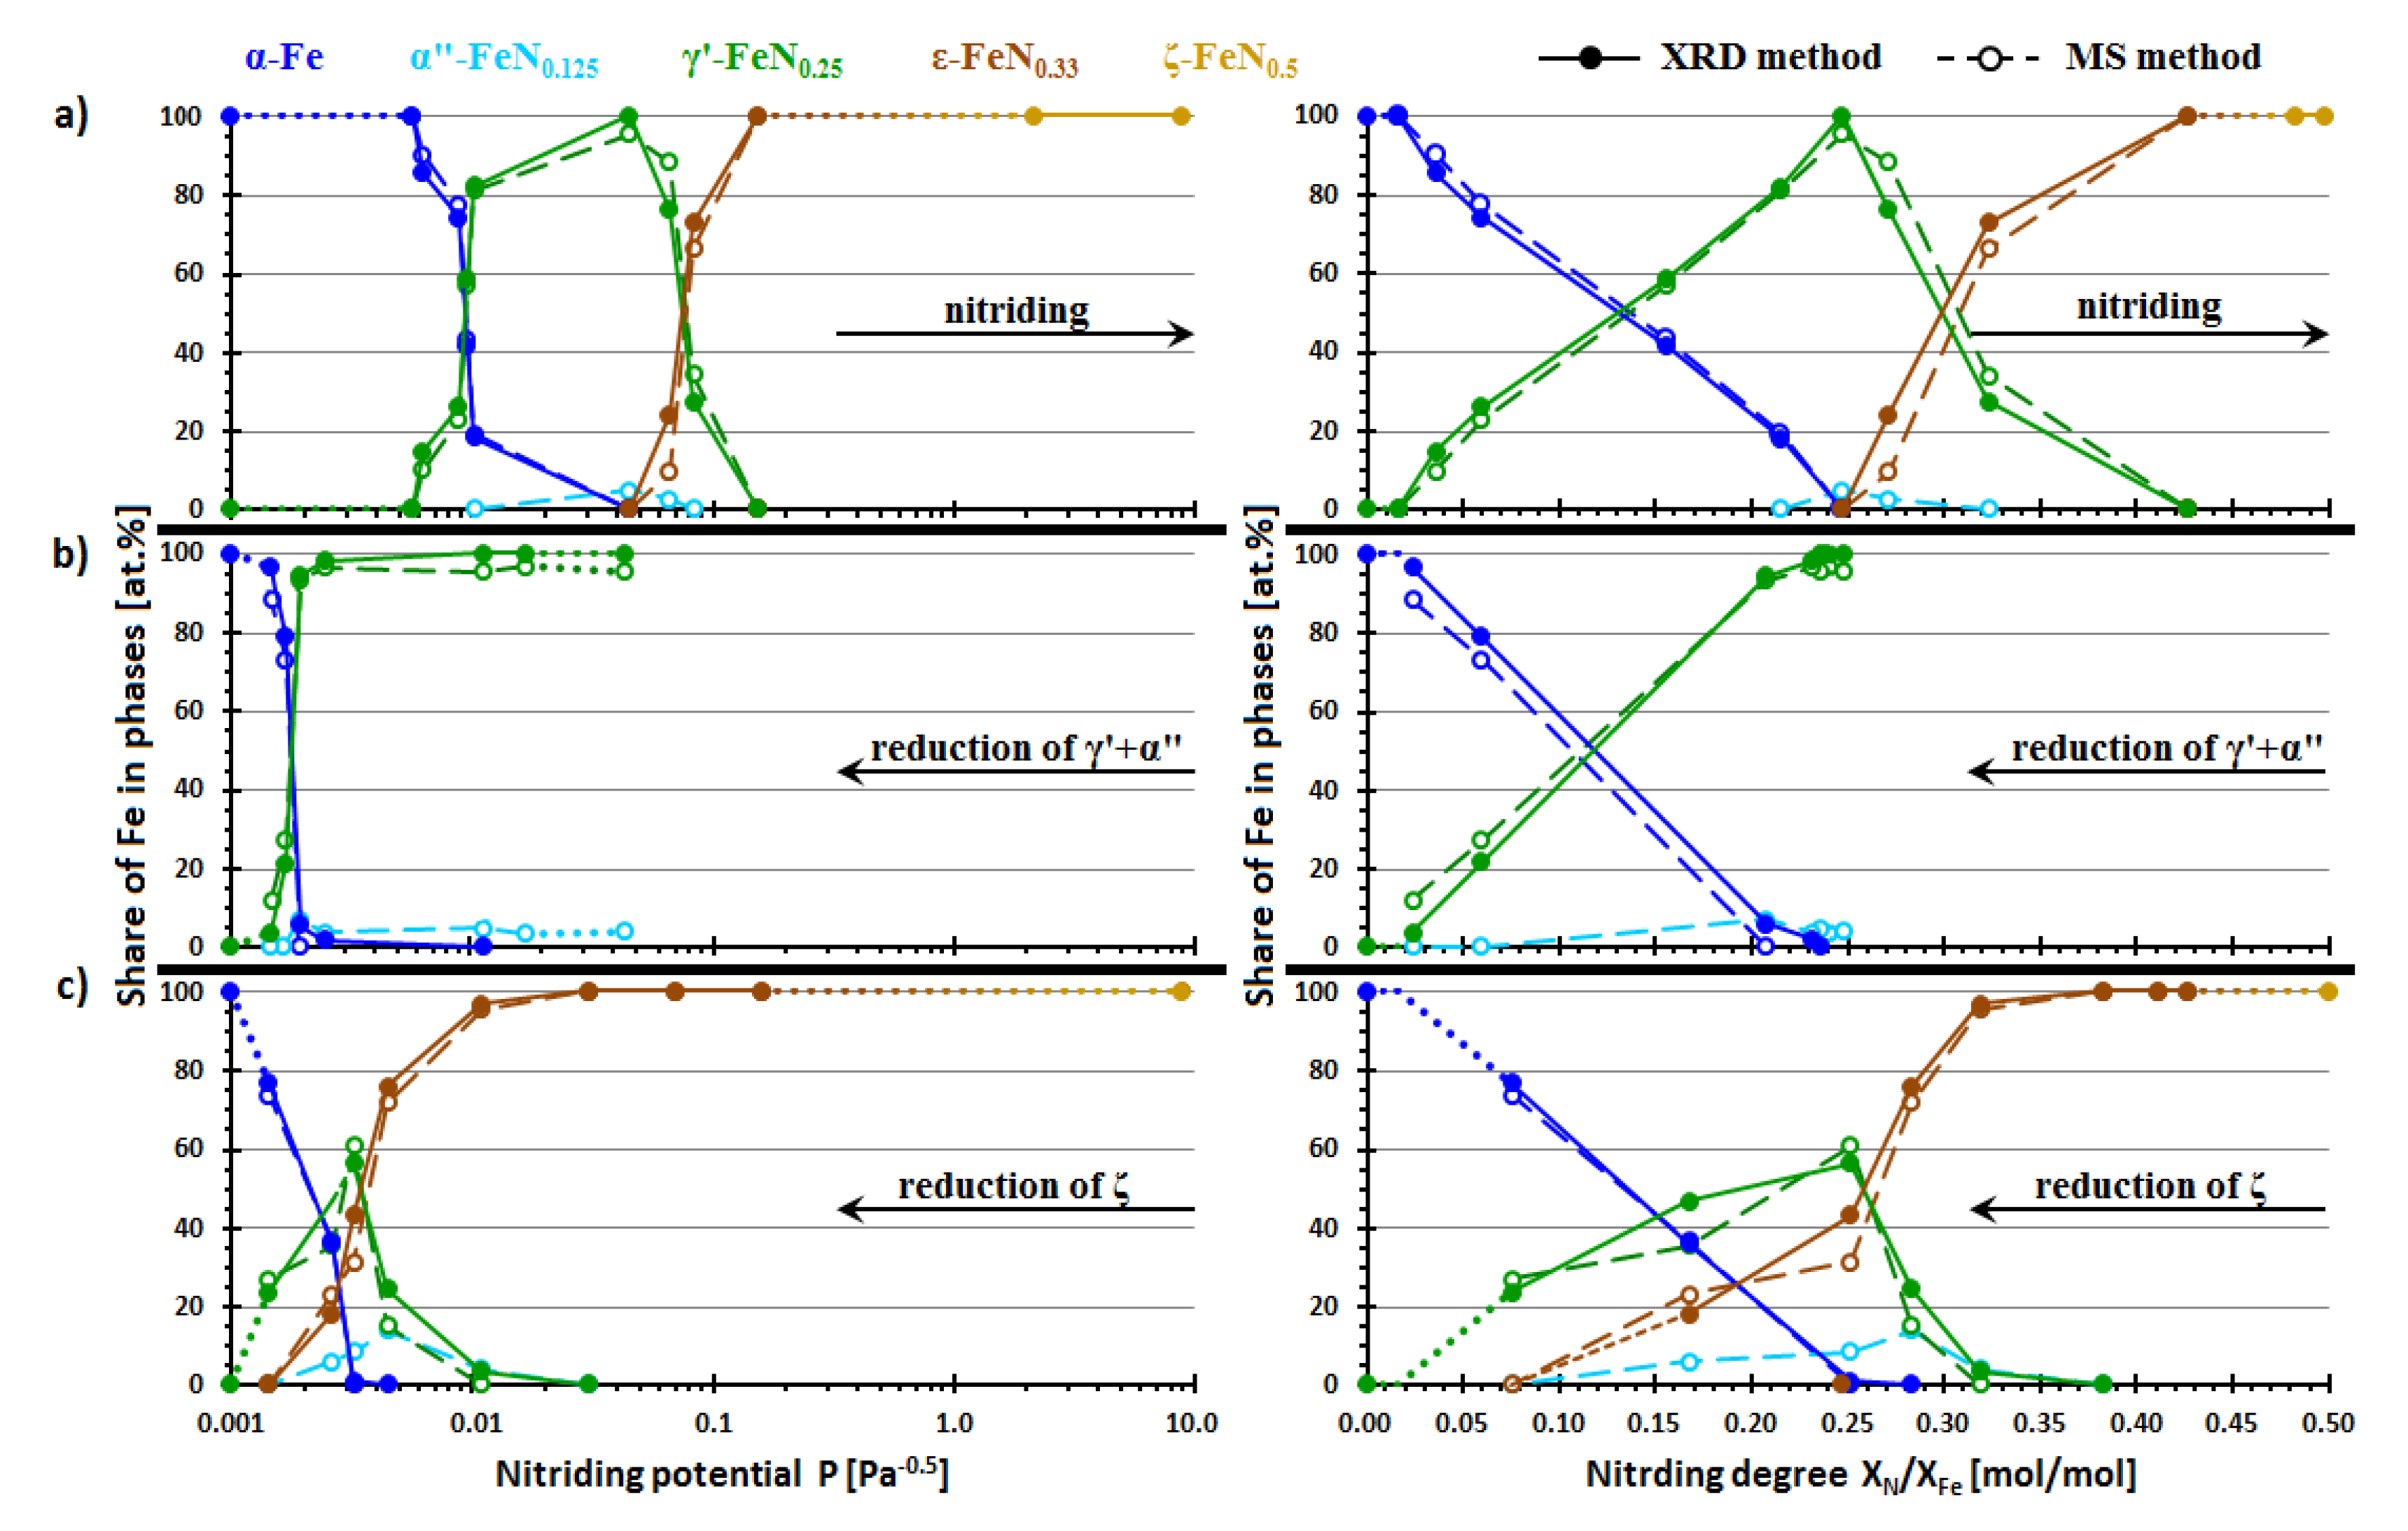
With regard to the presented simplifications, the dependencies of the distribution of iron in the phases present in the samples on nitriding potential and nitriding degree for all processes were prepared for the processes of: the nitriding of nanocrystalline iron (a), the reduction of the nanocrystalline nitrides γ’-FeN0.25 and α”-FeN0.125 mixture (b), and the reduction of nanocrystalline nitride ζ-FeN0.5 (c); these are presented in Figure 4.
Through the Mössbauer spectroscopy method in samples 6,7,12–15, and 21–24, iron nitride α” was identified. Phase α”-FeN0.125 was not observed in these samples using the XRD method. Difficulties in detecting iron nitride α” by the XRD method resulted from its low content in the samples and the location of its diffraction reflections in the area of reflection angles, at which there were reflections of high intensity coming from the other phases.
As confirmed by the MS method, the presence of the α”-FeN0.125 phase in the studied system of nanocrystalline iron-ammonia-hydrogen at 350 °C was the basis for updating the description of the phase transformations taking place in it [26,27,59].
With increasing nitriding potential in the process of nitriding, the following transitions of phases were observed: starting from nitrogen solution in nanocrystalline iron (α-Fe(N)), through phase mixtures of α-Fe(N) + γ’-FeN0.25, α”-FeN0.125 + γ’-FeN0.25, α”-FeN0.125 + γ’-FeN0.25 + ε-FeNx, γ’-FeN0.25 + ε-FeNx, and iron nitride ε-FeNx with varying degrees of nitrogen saturation to iron nitride ζ-FeN0.5. It was found that not only one or two but even three phases could coexist in the iron nitriding process in certain ranges of nitriding potentials. According to previous studies [26,27,59], a maximum of two phases could coexist during in the process of nitriding.
In the reduction reaction of nanocrystalline iron nitrides γ’ and α” mixture along with decreasing nitriding potential, the following phase changes were observed in the samples: starting from these two phases through the phase mixtures of α-Fe(N) + α”-FeN0.125 + γ’-FeN0.25, and α-Fe(N) + γ’-FeN0.25 to a solution of nitrogen in nanocrystalline iron.
When the nitriding potential was decreasing during the nanocrystalline iron nitride ζ reduction process, the following phase changes were observed: from the phase of ζ-FeN0.5, through iron nitride ε-FeNx with varying degrees of nitrogen saturation, over to phase mixtures of α”-FeN0.125 + γ’-FeN0.25 + ε-FeNx, α-Fe(N) + α”-FeN0.125 + γ’-FeN0.25 + ε-FeNx, and α-Fe(N) + γ’-FeN0.25 to a nitrogen solution in nanocrystalline iron. It was found that in the reduction process of iron nitride ζ, in certain ranges of nitriding potentials, four phases could coexist. According to previous studies [26,27,59], in the process of reduction, a maximum of three phases could coexist in the system.
The average sizes of nanocrystals of each phase were determined with the Rietveld method. In Figure 5, the dependencies of average nanocrystallites size on both nitriding potential, as well as the nitriding degree, are presented, and the regions of presence of iron nitride α” according to the MS method are marked.
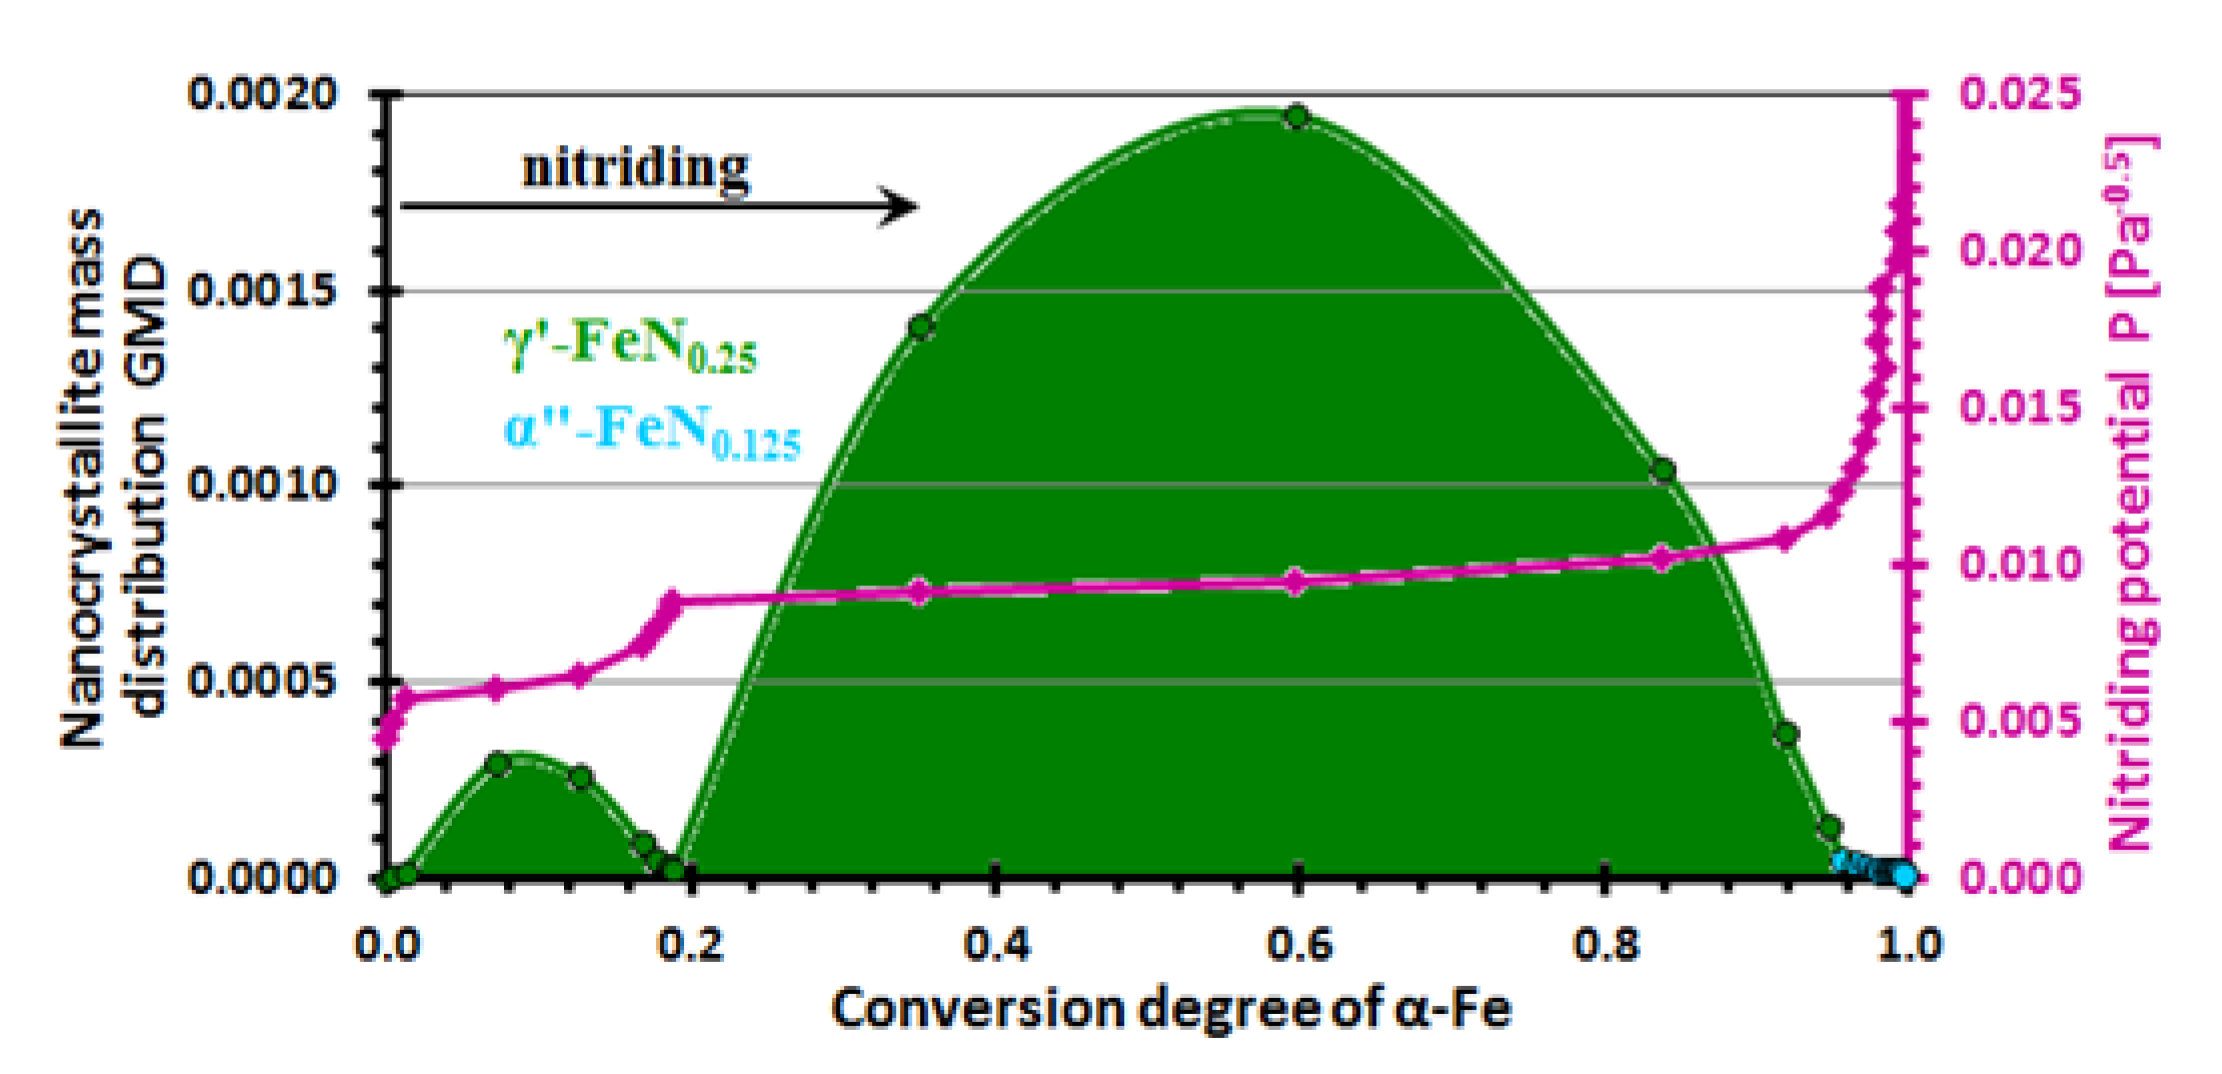
While the nitriding potential (nitriding degree) increased during the nitriding process, the average nanocrystal sizes of all phases decreased. This indicated that during the nitriding process in conditions close to chemical equilibrium, nanocrystallites were transformed in the order of their sizes from the largest to the smallest. The phenomenon has already been observed in the works of [27,28,42,45]. For the phase transformation of α-Fe(N)↔γ’-FeN0.25, the distribution of nanocrystallite size by mass was determined as a dependence on the degree of the conversion of the nanocrystalline α-Fe(N) to γ’-FeN0.25 (Figure 6). Taking the results obtained by the MS and XRD methods into account, it was found that during the nitriding process, the smallest nanocrystallites (about 4%), undetectable by the XRD method, were converted to iron nitride α”. With the further increasing of the nitriding potential, there was a transformation of the nanocrystallites of both nitrides (α” and γ’) into iron nitride ε and then to iron nitride ζ.
In XRD analysis, small nanocrystallites of α”-FeN0.125 present in samples may have lowered the obtained average nanocrystallite size of iron nitride γ’. The reduction process of the mixture of nanocrystalline iron nitrides γ’ and α” began with nanocrystallites of about the average nanocrystallite size obtained in the preceding nitriding process. The average nanocrystallite size of iron nitride γ’-FeN0.25 (Figure 5b) increased despite the fact that the transformation of γ’-FeN0.25 into α-Fe(N) started from larger γ’-FeN0.25 nanocrystallites. This effect can be explained by the simultaneous transformation of small nanocrystallites of α”-FeN0.125 to α-Fe(N). Therefore, the changes of the average nanocrystallite size of iron in this process were relatively small in comparison to those of phase transformation during other processes. Along with the phase transformation of the subsequent γ′ and α” iron nitrides, the average nanocrystallite size of the iron of α-Fe(N) decreased to 45 nm, the value of pure iron.
In the reduction of nanocrystalline iron nitride ζ, the average nanocrystallite sizes of iron nitrides ε and γ’ changed from the largest to the smallest due to the fact that nanocrystallites start their transformation in the order according to their sizes from largest to smallest. Nanocrystallites of iron nitride ζ, with a decreasing nitriding potential, were converted to a nitrogen solution in iron nitride ε and ε-FeN0.33<x<0.48 with a decreasing nitrogen content. At a nitrogen content close to the stoichiometric composition of iron nitride ε, nanocrystallites underwent other transformations depending on their size. For larger nanocrystallites, they were converted to stoichiometric nitride ε-FeN0.33. These nanocrystallites were further converted to iron nitride γ’. When the nitriding potential changed in the same way, smaller nanocrystallites were converted into an unsaturated nitrogen solution in the nitride ε-FeNx <0.33 and then transformed into the solution of nitrogen in nanocrystalline α-iron going through iron nitride α”. With further changes in nitriding potential, the nanocrystallites of iron nitride γ’ (a product of the transformation of ε-FeN0.33 into γ’-FeN0.25) were transformed into nanocrystallites α-Fe(N) of larger sizes. Following this order of the phase transformation of iron nitride nanocrystallites into α-Fe(N), the dependence of the average nanocrystallite sizes of iron showed an upward trend (Figure 5c) in the reduction of nanocrystalline iron nitride ζ. The average sizes of α-iron nanocrystallites after the finished process of the reduction corresponded to their average nanocrystallite sizes before the nitriding process.

3. Experimental

An industrial pre-reduced iron catalyst for ammonia synthesis was used in this study [60]. The chemical composition was determined by the atomic emission spectrometry with inductively coupled plasma (ICP-AES) method using a Optime 5300DV spectrometer by Perkin Elmer (Waltham, MA, United States). In addition to metallic iron, the sample of the catalyst contained (wt %) 3.3% Al2O3, 2.8% CaO, and 0.65% K2O [61]. The phase composition analysis of the samples was performed using the method of X-ray diffraction (a Philips-X’Pert X-ray apparatus with a copper lamp and X’Pert HighScore Plus software by Panalytical-Almelo, The Netherlands). The average iron nanocrystallite size in the starting sample measured by the Rietveld method was equal to 45 nm. A bimodal distribution of nanocrystallite size was found by measuring the nitriding reaction rate in the tested catalyst sample [44]. The specific surface was determined to be 12 m2/g using a Quadrasorb SI (Quantachrome Instruments, Automated Surface Area and Pore Size Analyzer) (Boynton Beach, FL, United States)device with the gas thermal desorption method [62].
The processes of the nitriding of nanocrystalline iron and the reduction of the obtained nanocrystalline iron nitrides were performed using gases supplied by Messer Polska: ammonia of a purity of 99.98% and hydrogen of a purity of 99.999%.
The studies were carried out by the chemical potential programmed reaction (CPPR) method [63] in a differential tubular reactor equipped with a thermogravimetric mass measurement device (SYSPA–Szczecin, Poland) and a hydrogen analyzer (handmade in Lodz University of Technology, Łódź, Poland) [35]. Gases were supplied to the reactor using an electronic system that strictly regulated gas flow [44]. Samples of nanocrystalline iron weighing about 1 g and a piece of grains within the range of 1.0–1.2 mm were placed on a platinum basket in the form a single layer of grains.
The passive layer on the surface of nanocrystalline iron in the atmospheric-pressure hydrogen was reduced, polythermally increasing the temperature of the process to up to 500 °C (10 °C/min). Samples were heated at 500 °C for 3 h to stabilize their nanocrystalline structure [64].
The processes of nanocrystalline iron nitriding and the reduction of obtained nanocrystalline iron nitrides were carried out at 350 °C using the CPPR method, with the simultaneous changes of flows of hydrogen and ammonia according to a predefined program. In the process of nitriding, the ratio of NH3:H2 in the nitriding mixture was gradually increased, starting with pure hydrogen and finishing with pure ammonia. The reduction of nanocrystalline iron nitride started with pure ammonia or a specific nitriding gaseous mixture and ended with pure hydrogen. After each gas phase composition change, the sample was kept under certain conditions for 12 h in order to establish a stationary state.
Based on hydrogen concentration measurement results at the inlet and the outlet of the reactor, it was found that the catalytic decomposition rate of ammonia at 350 °C was very low and did not affect the nitriding mixture composition. After knowing the gas phase composition, the nitriding potential of the gas mixture was determined, as described with Equation (1) [65]:
P = P N H 3 P H 2 3 / 2 [ P a 0.5 ]
where P N H 3 and P H 2 are the partial pressures of ammonia and hydrogen, respectively, in the gas phase. Each setpoint of nitriding potential at stationary states, both in the process of nanocrystalline iron nitriding and in the process of reducing nanocrystalline iron nitrides, corresponded to a different constant value of nitriding degree. The nitriding degree is the molar ratio of nitrogen to iron included in a sample, XN/XFe [mol/mol].
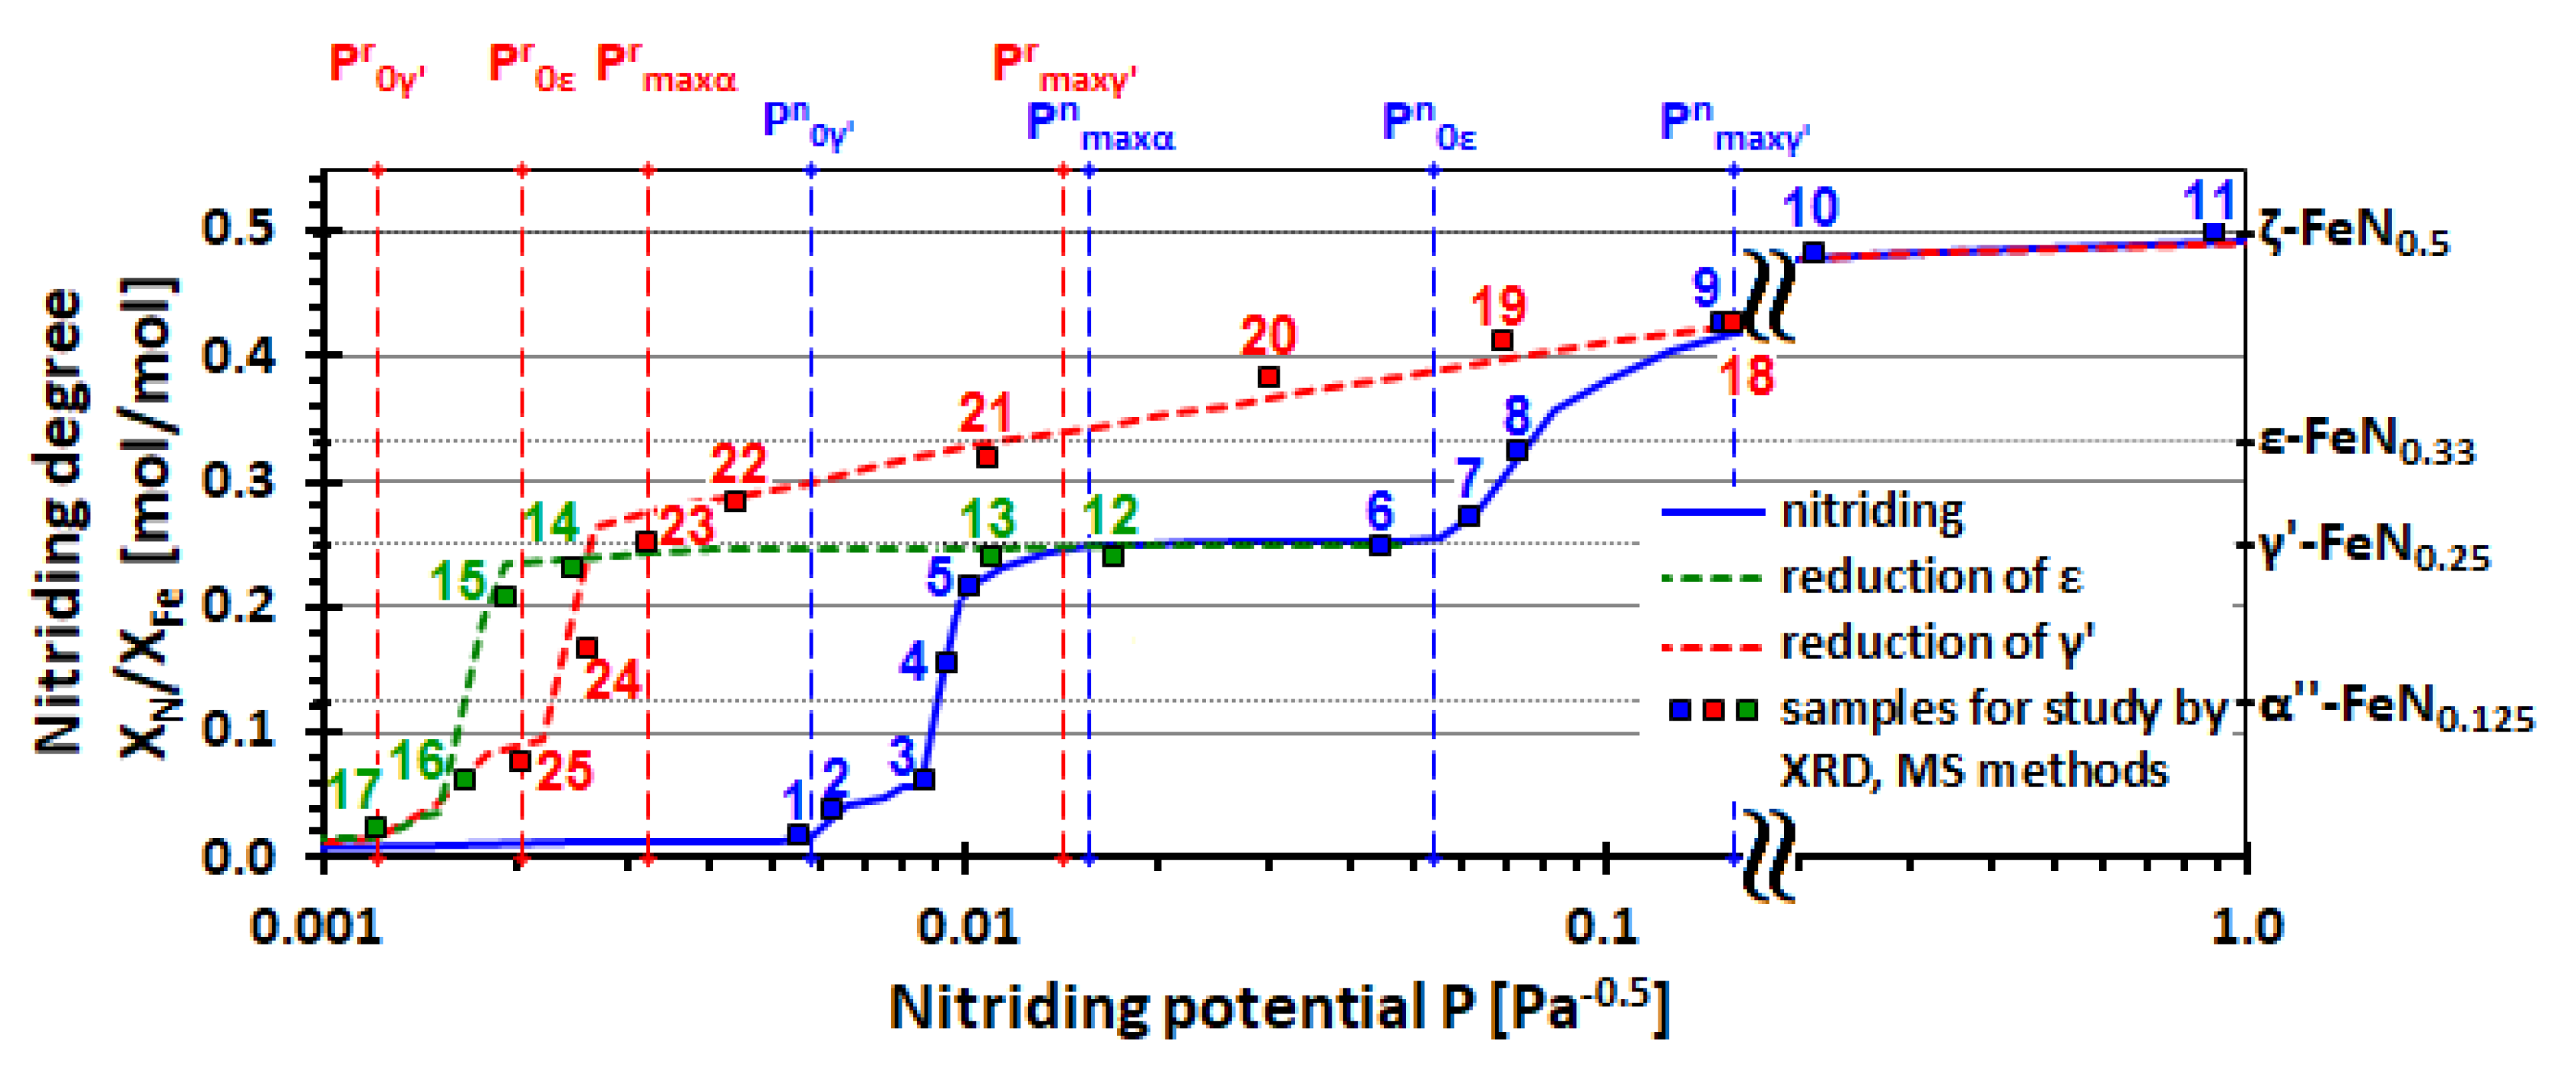
Based on the cycles of the nitriding processes of nanocrystalline iron and the reduction of the obtained nanocrystalline iron nitrides, the dependence of the nitriding degree on the nitriding potential of hysteresis nature was developed [27]. On the basis of these dependencies, 25 samples were prepared for the selected nitriding potential values and their corresponding nitriding degrees for testing using XRD and MS (Figure 7). For this purpose, the nitriding/reduction processes were stopped by rapidly cooling the samples to room temperature under a nitrogen flow with a purity of 99.996%. After cooling, the samples were passivated at low temperature with nitrogen containing 1.0 vol% of oxygen. The increase of mass corresponded to the process of oxide layer formation, which was approximately 1.5 nm thick, on the surface of iron nitride nanocrystallites, like on the iron catalyst surface [66].
The obtained samples were mixed with the standard coarse-crystalline silicon powder with a purity of 99% from MilliporeSigma (St. Louis, MO, USA), and then their phase composition and the average size of nanocrystallites were determined with XRD. For the analysis of the obtained diffractograms, crystallographic data from identification cards from the database Powder Diffraction File (PDF-4+) of the International Centre for Diffraction Data (ICDD) database were used: 04-004-2482–α-Fe, 01-078-1865–α”-FeN0.125, 04-004-9107–γ’-FeN0.25, 01-076-0091–ε-FeN0.33, 04-011-7278–ζ-FeN0.5, and 04-006-6436–Si.
The Mössbauer spectroscopy measurements in transmission geometry and at room temperature were applied for the additional qualitative and quantitative identification of iron-containing phases. Mössbauer spectra were recorded for the 14.41 keV resonance line of iron isotope 57Fe. A RENON MsAa-3 spectrometer (Kraków, Poland) equipped with a proportional detector and a standard 57Co(Rh) gamma radiation source made by RITVERC GmbH (St. Petersburg, Russia) was used. The Mössbauer absorbers were prepared using 30 mg of the studied material, and the absorber thickness (surface density) amounted to 15 mg/cm2. The obtained Mössbauer spectra were numerically processed by the transmission integral method using a MOSGRAF software package (Kraków, Poland). The relative distribution of iron atoms in the identified iron-containing phases in relation to the total iron content in the studied sample was determined with an accuracy of about 1 at.% as a Mössbauer sub-spectral cross section area.

4. Conclusions

The processes of nanocrystalline iron nitriding and the reduction of the obtained nanocrystalline iron nitrides in steady states with stepwise nitriding potential increments at 350 °C were carried out according to the CPPR method coupled with XRD and MS.
The influence of nanocrystallite size on phase transformations at 350 °C was found. In the nitriding process of nanocrystalline iron, larger nanocrystallites formed the γ’ phase, and the smallest nanocrystals (about 4%) transformed into the α” phase. Both phases were in chemical equilibrium with the gas phase. Additionally, the reduction process of iron nitride ε nanocrystallites followed two mechanisms. Larger nanocrystallites of iron nitride ε transformed into the α-iron phase through iron nitride γ’, and smaller nanocrystallites formed through iron nitride α”. The obtained nanocrystalline iron nitride α” was stable (in both phase transformations), which has not been observed in previous studies at 350 °C.
As the nitriding potential in the nanocrystalline iron nitriding process increased in the system, the following phases/mixtures of solid phases were observed: α-Fe(N), α-Fe(N) + γ’-FeN0.25, α”-FeN0.125 + γ’-FeN0.25, α”-FeN0.125 + γ’-FeN0.25 + ε-FeNx, γ’-FeN0.25 + ε-FeNx, ε-FeNx, and ζ-FeN0.5. With the decreasing nitriding potential in the reduction process of the mixture of nanocrystalline iron nitrides γ’ and α”, the following phases/mixtures of solid phases were observed: α”-FeN0.125 + γ’-FeN0.25, α-Fe(N) + α”-FeN0.125 + γ’-FeN0.25, α-Fe(N) + γ’-FeN0.25, and α-Fe(N). Whereas in the reduction process of nanocrystalline iron nitride ζ, the following phases were observed: ζ-FeN0.5, ε-FeNx, α”-FeN0.125 + γ’-FeN0.25 + ε-FeNx, α-Fe(N) + α”-FeN0.125 + γ’-FeN0.25 + ε-FeNx, α-Fe(N) + γ’-FeN0.25, and α-Fe(N).
It was found that in the nanocrystalline Fe-NH3-H2 system, at certain ranges of nitriding potentials, three solid phases could coexist during the process of nitriding, and four solid phases could exist during the reduction process. In previous studies of these processes, nitriding potential ranges of phase coexistence with a smaller maximum number were observed.

Author Contributions

Conceptualization, B.W. and W.A.; methodology, B.W. and W.A.; validation, B.W., A.B., Z.L.-B. and W.A.; formal analysis, B.W. and A.B.; investigation, B.W., A.B. and W.A.; resources, A.B., Z.L.-B., and W.A.; data curation, B.W. and A.B.; writing—original draft preparation, B.W. and W.A.; writing—review and editing, B.W., A.B., Z.L.-B., and W.A.; visualization, B.W. and A.B.; supervision, Z.L.-B. and W.A.; project administration, W.A.; funding acquisition, W.A. All authors have read and agreed to the published version of the manuscript.

Funding

The scientific work was financed by The National Science Centre, Poland under the program “Opus”, project no. 2017/27/B/ST8/02947.

Conflicts of Interest

The authors declare no conflict of interest.

References

  1. Pye, D. Practical Nitriding and Ferritic Nitrocarburizing, 1st ed.; ASM International: Cleveland, OH, USA, 2003. [Google Scholar]
  2. Grosch, J. Heat Treatment with Gaseous Atmospheres. In Steel Heat Treatment Handbook, 2nd ed.; Totten, G.E., Ed.; Taylor & Francis: Portland, OR, USA, 1997; pp. 415–474. [Google Scholar]
  3. Davis, J.R. Metals Handbook Desk Edition, 2nd ed.; ASM International: Cleveland, OH, USA, 1998. [Google Scholar]
  4. Alpaslan, Ö.; Atar, E.; Çimenoğlu, H. Tribological behaviour of duplex treated AISI 4140 steel. JESTECH 2012, 15, 39–43. [Google Scholar]
  5. Chen, H.T.; Yan, M.F.; You, Y. Effect of N distribution on elastic and electronic properties of hexagonal ε-Fe6Nx by first-principles calculations. J. Magn. Magn. Mater. 2014, 354, 200–204. [Google Scholar] [CrossRef]
  6. Mittemeijer, E.J.; Sommers, M.A.J. Thermochemical Surface Engineering of Steels, 1st ed.; Woodhead Publishing: London, UK, 2015. [Google Scholar]
  7. Bell, T.; Akamatsu, K. Stainless Steel 2000: Thermochemical Surface Engineering of Stainless Steel, 1st ed.; Maney Publishing: London, UK, 2001. [Google Scholar]
  8. Jack, K.H. The iron-nitrogen system: The preparation and the crystal structures of nitrogen-austenite (γ) and nitrogen-martensite (a’). Proc. Royal Soc. 1951, 208, 200–215. [Google Scholar]
  9. Jack, K.H. The iron-nitrogen system: The crystal structures of ε-phase iron nitrides. Acta Crystallogr. 1952, 5, 404–411. [Google Scholar] [CrossRef]
  10. Jack, K.H. The synthesis, structure, and characterization of α″-Fe16N2 (invited). J. Appl. Phys. 1994, 76, 6620–6625. [Google Scholar] [CrossRef]
  11. Wriedt, H.A.; Gokcen, N.A.; Nafziger, R.H. The Fe-N (Iron-Nitrogen) System. Bull. Alloy Phase Diagr. 1987, 8, 355–377. [Google Scholar] [CrossRef]
  12. Göhring, H.; Fabrichnaya, O.; Leineweber, A.; Mittemeijer, E.J. Thermodynamics of the Fe-N and Fe-N-C Systems: The Fe-N and Fe-N-C Phase Diagrams Revisited. Metall. Mater. Trans. A 2016, 47, 6173–6186. [Google Scholar] [CrossRef] [Green Version]
  13. Du Marchie van Voorthuysen, E.H.; Chechenin, N.C.; Boerma, D.O. Low-Temperature extension of the Lehrer diagram and the iron-nitrogen phase diagram. Metall. Mater. Trans. A 2002, 33, 2593–2598. [Google Scholar] [CrossRef]
  14. Tong, W.P.; Tao, N.R.; Wang, Z.B.; Zhang, H.W.; Lu, J.; Lu, K. The formation of ε-Fe3–2N phase in a nanocrystalline Fe. Scr. Mater. 2004, 50, 647–650. [Google Scholar] [CrossRef]
  15. Tong, W.P.; He, C.S.; He, J.C.; Zuo, L.; Tao, N.R.; Wang, Z.B. Strongly enhanced nitriding kinetics by means of grain refinement. Appl. Phys. Lett. 2006, 89, 021918/1–021918/3. [Google Scholar] [CrossRef]
  16. Wang, J.; Zhang, G.; Sun, J.; Bao, Y.; Zhuang, L.; Ning, H. Low temperature nitriding of iron by alternating current pretreatment. Surf. Coat. Technol. 2006, 200, 6666–6670. [Google Scholar] [CrossRef]
  17. Tong, W.P.; Liu, C.Z.; Wang, W.; Tao, N.R.; Wang, Z.B.; Zuo, L.; He, J.C. Gaseous nitriding of iron with a nanostructured surface layer. Scr. Mater. 2007, 57, 533–536. [Google Scholar] [CrossRef]
  18. Wohlfarth, E.P. Recent developments in solid state magnetism with special reference to transition metal compounds. Pure Appl. Chem. 1985, 57, 1403–1406. [Google Scholar] [CrossRef]
  19. Nakajima, H.; Ohashi, Y.; Shiiki, K. Effect of N atom and lattice constant on electronic structures andmagnetic properties of Fe16N2 calculated by band structure calculation based on local-density approximation. J. Magn. Magn. Mater. 1997, 167, 259–263. [Google Scholar] [CrossRef]
  20. Bhattacharyya, S.; Shivaprasad, S.M.; Gajbhiye, N.S. Variation of magnetic ordering in ε-Fe3N nanoparticles. Chem. Phys. Lett. 2010, 496, 122–127. [Google Scholar] [CrossRef]
  21. Schnepp, Z.; Thomas, M.; Glatzel, S.; Schlichte, K.; Palkovits, R.; Giordano, C. One pot route to sponge-like Fe3N nanostructures. J. Mater. Chem. 2011, 21, 17760–17764. [Google Scholar] [CrossRef]
  22. Tagawa, K.; Kita, E.; Tasaki, A. Synthesis of fine Fe4N powder and its magnetic characteristics. Jpn. J. Appl. Phys. 1982, 21, 1596–1598. [Google Scholar] [CrossRef]
  23. Coey, J.M.D.; Smith, P.A.I. Magnetic nitrides. J. Magnet. Magnet. Mater. 1999, 200, 405–424. [Google Scholar] [CrossRef]
  24. Bezdicka, P.; Kláriková, A.; Paseka, I.; Závêta, K. Magnetic properties of α’-FeNx and α”-Fe16N2 nitrides. J. Alloys Comp. 1998, 274, 10–17. [Google Scholar] [CrossRef]
  25. Utsushikawa, Y.; Niizuma, K. The saturation magnetization of Fe-N films prepared by nitriding treatment in N2 plasma. J. Alloys Comp. 1995, 222, 188–192. [Google Scholar] [CrossRef]
  26. Wilk, B.; Arabczyk, W. Badanie procesów azotowania i redukcji w układzie nanokrystaliczne żelazo-amoniak-wodór. Przem. Chem. 2014, 93, 1036–1040. [Google Scholar]
  27. Wilk, B.; Arabczyk, W. Investigation of nitriding and reduction processes in a nanocrystalline iron–ammonia–hydrogen system at 350 °C. Phys. Chem. Chem. Phys. 2015, 17, 20185–20193. [Google Scholar]
  28. Arabczyk, W.; Ekiert, E.; Pelka, R. Size-dependent transformation of α–Fe into γ’-Fe4N in nanocrystalline the Fe−NH3−H2 system. J. Phys. Chem. C 2016, 120, 17989–17995. [Google Scholar] [CrossRef]
  29. Wilk, B.; Kiełbasa, K.; Arabczyk, W. Azotowanie nanokrystalicznego żelaza mieszaniną amoniaku i wodoru w temperaturze 300 °C. Przem. Chem. 2015, 94, 1816–1820. [Google Scholar]
  30. Barański, A.; Bielański, A.; Pattek, A. Kinetics of reduction of iron catalysts for ammonia synthesis. J. Catal. 1972, 26, 286–294. [Google Scholar] [CrossRef]
  31. Liu, H. Amonia Synthesis Catalyst: Inovation and Practice; World Scientific Publishing Co. Pte. Ltd.: Singapore, 2013. [Google Scholar]
  32. Arabczyk, W.; Narkiewicz, U.; Moszyński, D. Double-layer model of the fused iron catalyst for ammonia synthesis. Langmuir 1999, 15, 5785–5789. [Google Scholar] [CrossRef]
  33. Pelka, R.; Arabczyk, W. Studies of the Kinetics of Reaction between Iron Catalysts and Ammonia—Nitriding of Nanocrystalline Iron with Parallel Catalytic Ammonia Decomposition. Top. Catal. 2009, 52, 1506–1516. [Google Scholar] [CrossRef]
  34. Moszyńska, I.; Moszyński, D.; Arabczyk, W. Zjawisko histerezy procesów azotowania i redukcji w układzie nanokrystaliczne żelazo–amoniak–wodór. Przem. Chem. 2009, 88, 526–529. [Google Scholar]
  35. Kiełbasa, K.; Pelka, R.; Arabczyk, W. Studies of the kinetics of ammonia decomposition on promoted nanocrystalline iron using gas phases of different nitriding degree. J. Phys. Chem. A 2010, 114, 4531–4534. [Google Scholar] [CrossRef]
  36. Yu, M.; Xu, Y.; Mao, Q.; Li, F.; Wang, C. Electromagnetic and absorption properties of nano-sized and micro-sized Fe4N particles. J. Alloy. Compd. 2016, 656, 362–367. [Google Scholar] [CrossRef]
  37. Nishimaki, K.; Ohmae, S.; Yamamoto, T.A.; Katsura, M. Formation of iron-nitrides by the reaction of iron nanoparticles with a stream of ammonia. Nanostruct. Mater. 1999, 12, 527–530. [Google Scholar] [CrossRef]
  38. Wohlschlögel, M.; Welzel, U.; Mittemeijer, E.J. Unexpected formation of ε iron nitride by gas nitriding of nanocrystalline α-Fe films. Appl. Phys. Lett. 2007, 91, 141901/1–141901/3. [Google Scholar] [CrossRef]
  39. Moszyński, D.; Moszyńska, I. Przemiany fazowe podczas procesów azotowania nanokrystalicznego żelaza. Przem. Chem. 2013, 92, 1332–1335. [Google Scholar]
  40. Moszyński, D. Nitriding of nanocrystalline iron in the atmospheres with variable nitriding potential. J. Phys. Chem. C 2014, 118, 15440–15447. [Google Scholar] [CrossRef]
  41. Kiełbasa, K.; Arabczyk, W. Studies of the ammonia decomposition over a mixture of α-Fe(N) and γ’-Fe4N. Pol. J. Chem. Technol. 2013, 15, 97–101. [Google Scholar]
  42. Moszyński, D.; Moszyńska, I.; Arabczyk, W. The transformation of α-Fe into γ’-Fe4N in nanocrystalline Fe-N system: Influence of Gibbs-Thomson effect. Appl. Phys. Lett. 2013, 103, 253108/1–253108/4. [Google Scholar] [CrossRef]
  43. Moszyński, D.; Kiełbasa, K.; Arabczyk, W. Influence of crystallites’ size on iron nitriding and reduction of iron nitrides in nanocrystalline Fe-N system. Mater. Chem. Phys. 2013, 141, 674–679. [Google Scholar] [CrossRef]
  44. Wilk, B.; Pelka, R.; Arabczyk, W. Study of the iron catalyst for ammonia synthesis by CPPR method. J. Phys. Chem. C 2017, 121, 8548–8556. [Google Scholar] [CrossRef]
  45. Arabczyk, W.; Ekiert, E.A.; Pelka, R. Hysteresis phenomenon in a reaction system of nanocrystalline iron and a mixture of ammonia and hydrogen. Phys. Chem. Chem. Phys. 2016, 18, 25796–25800. [Google Scholar] [CrossRef]
  46. Pelka, R. A method of determining nanoparticle size distribution in iron ammonia synthesis catalyst by measuring mass changes during the nitriding process. Catal. Today 2017, 286, 118–123. [Google Scholar] [CrossRef]
  47. Lehrer, E. Über das Eisen-Wasserstoff-Ammoniak-Gleichgewicht. Z Electrochem. 1930, 36, 383–392. [Google Scholar]
  48. Kunze, J. Nitrogen and Carbon in Iron and Steel Thermodynamics, 1st ed.; Akademie-Verlag: Berlin, Germany, 1990. [Google Scholar]
  49. Du Marchie van Voorthuysen, E.H.; Feddes, B.; Chechenin, N.G.; Inia, D.K.; Vredenberg, A.M.; Boerma, D.O. Low-temperature nitridation of iron layers in NH3–H2 Mixtures. Phys. Stat. Sol. A 2000, 177, 127–133. [Google Scholar] [CrossRef]
  50. Sokołowska, A.; Rudnicki, J.; Beer, P.; Małdziński, L.; Tacikowski, J.; Baszkiewicz, J. Nitrogen transport mechanisms in low temperature ion nitriding. Surf. Coat. Technol. 2001, 142–144, 1040–1045. [Google Scholar] [CrossRef]
  51. Arabczyk, W.; Wróbel, R. Study of the kinetics of nitriding of nanocrystalline iron using TG and XRD methods. Solid State Phenom. 2003, 94, 185–188. [Google Scholar] [CrossRef]
  52. Pelka, R.; Arabczyk, W. Modelling of nanocrystalline iron nitriding process—Influence of specific surface area. Chem. Pap. 2011, 65, 198–202. [Google Scholar] [CrossRef]
  53. Li, J.; Yuan, W.; Peng, X.; Yang, Y.; Xu, J.; Wang, X.; Hong, B.; Jin, H.; Jin, D.; Ge, H. Synthesis of fine α”-Fe16N2 powders by low-temperature nitridation of α-Fe from magnetite nanoparticles. AIP Adv. 2016, 6, 125104/1–125104/5. [Google Scholar] [CrossRef] [Green Version]
  54. Dirba, I.; Schwöbel, C.A.; Diop, L.V.B.; Duerrschnabel, M.; Molina-Luna, L.; Hofmann, K.; Komissinskiy, P.; Kleebe, H.-J.; Gutfleisch, O. Synthesis, morphology, thermal stability and magnetic properties of α”-Fe16N2 nanoparticles obtained by hydrogen reduction of γ-Fe2O3 and subsequent nitrogenation. Acta Mater. 2017, 123, 214–222. [Google Scholar] [CrossRef]
  55. Borsa, D.M.; Boerma, D.O. Phase identification of iron nitrides and iron oxy-nitrides with Mössbauer spectroscopy. Hyperfine Interact. 2003, 151, 31–48. [Google Scholar] [CrossRef]
  56. Ksenofontov, V.; Reiman, S.; Waldeck, M.; Niewa, R.; Kniep, R.; Gütlich, P. In situ—High temperature Mössbauer spectroscopy of iron nitrides and nitridoferrates. Z. Anorg. Allg. Chem. 2003, 629, 1787–1794. [Google Scholar] [CrossRef]
  57. Qi, Q.; O’Donnell, K.; Touchais, E.; Coey, J.M.D. Mössbauer spectra and magnetic properties of iron nitrides. Hyperfine Interact. 1994, 94, 2067–2073. [Google Scholar] [CrossRef]
  58. Hinomura, T.; Nasu, S. 57Fe Mössbauer study of Fe nitrides. Il Nuovo Cimento 1996, 18, 253–257. [Google Scholar] [CrossRef]
  59. Arabczyk, W.; Pelka, R.; Wilk, B. Studies of phase transitions occurring in the system of nanocrystalline Fe/NH3/H2. Mater. Chem. Phys. 2019, 237, 121853/1–121853/10. [Google Scholar] [CrossRef]
  60. Arabczyk, W.; Jasińska, I. Obecny stan wiedzy o katalizatorze żelazowym do syntezy amoniaku. Przem. Chem. 2006, 85, 130–137. [Google Scholar]
  61. Lendzion-Bieluń, Z. A comparison of the distribution of promoters in reduced and oxidized form of iron catalyst for ammonia synthesis. Pol. J. Chem. 2007, 81, 433–440. [Google Scholar]
  62. Arabczyk, W.; Jasińska, I.; Lubkowski, K. The surface properties of iron catalyst for ammonia synthesis. React. Kinet. Catal. Lett. 2004, 83, 385–392. [Google Scholar] [CrossRef]
  63. Arabczyk, W.; Pelka, R.; Wilk, B.; Hełminiak, A. Sposób Badania Nanomateriałów Poprzez Określenie ich Właściwości Fizykochemicznych. PL 229686 B1, 31 August 2018. [Google Scholar]
  64. Jasińska, I.; Arabczyk, W. Kinetic studies of the recrystallization process of iron catalyst for ammonia synthesis. Chem. Pap. 2005, 59, 496–499. [Google Scholar]
  65. Mittemeijer, E.J.; Slycke, J.T. Chemical potentials and activities of nitrogen and carbon imposed by gaseous nitriding and carburizing atmospheres. Surf. Eng. 1996, 12, 152–162. [Google Scholar] [CrossRef]
  66. Ekiert, E.A.; Pelka, R.; Lubkowski, K.; Arabczyk, W. The possibility of implementation of spent iron catalyst for ammonia synthesis. Pol. J. Chem. Technol. 2009, 11, 28–33. [Google Scholar] [CrossRef] [Green Version]
Figure 1. The comparison of 57Fe Mössbauer spectra and X-ray diffractograms for selected samples obtained in the nitriding process of nanocrystalline iron.
Catalysts 10 01242 g001
Figure 2. The comparison of 57Fe Mössbauer spectra and X-ray diffractograms for selected samples obtained during the processes of: reduction of: a mixture of nanocrystalline nitrides γ’-FeN0.25 and α”-FeN0.125 (a) and nanocrystalline nitride ζ-FeN0.5 (b).
Catalysts 10 01242 g002
Figure 3. The dependence of the share of iron in the amorphous phase “Fe-?” in samples (by the MS method) on their nitriding degree.
Catalysts 10 01242 g003
Figure 4. The dependence of the share of iron in the phases present in the samples on nitriding potential and nitriding degree for: the nitriding process of nanocrystalline iron (a), the reduction reaction of the mixture of nanocrystalline iron nitrides γ’-FeN0.25 and α”-FeN0.125 (b), and the reduction of nanocrystalline iron nitride ζ-FeN0.5 (c).
Catalysts 10 01242 g004
Figure 5. The dependence of average nanocrystallites size on nitriding potential and nitriding degree for the nitriding of nanocrystalline iron (a), the reduction of the nanocrystalline nitrides γ’-FeN0.25 and α”-FeN0.125 mixture (b), and the reduction of nanocrystalline nitride ζ-FeN0.5 (c).
Catalysts 10 01242 g005
Figure 6. The dependencies of distribution of nanocrystallite size and nitriding potential on the degree of the conversion of nanocrystalline α-Fe(N) to γ’-FeN0.25.
Catalysts 10 01242 g006
Figure 7. The dependence of the nitriding degree on nitriding potential, P, in the iron nitriding process (solid line) and nanocrystalline iron nitride reduction (dashed lines) at stationary states (350 °C): superscripts n and r—nitriding and reduction, respectively; α, γ’, and ε—the designation of the phases of α-Fe(N), γ’-FeN0.25, and ε-FeNx, respectively; subscripts 0 and max—the minimum and maximum nitriding potential, respectively, at which the phase exists [27].
Catalysts 10 01242 g007
Table 1. The Mössbauer parameters for selected spectra representative of the identified iron phases: α-Fe, α”-FeN0.125, γ’-FeN0.25, ε-FeN0.33, ε-FeN0.33<x<0.5, and ζ-FeN0.5.
PhaseA (%)C (%)IS (mm/s)QS (mm/s)B (T)Γ (mm/s)Sample
α-Fe90900.010.0032.980.181
Fe-?10100.281.25-1.5
α”-FeN0.125770.220.0229.190.3723
γ’-FeN0.2551110.230.0234.120.19
400.30-0.2022.250.36
ε-FeN0.332690.440.2722.300.22
170.300.2022.020.18
Fe-?16160.340.92-0.58
γ’-FeN0.2585190.210.0734.110.2712
180.28-0.3721.620.26
210.420.2021.400.27
260.250.1121.650.25
α”-FeN0.125330.240.0629.00.42
Fe-?12120.401.05-0.9
ε-FeN0.3375220.33-0.0324.190.1921
500.32-0.0422.790.43
30.490.3223.130.10
α”-FeN0.125330.080.3029.560.28
Fe-?22220.330.97-0.56
ε-FeN0.33<x<0.5100180.300.0815.000.909
510.370.69-0.67
310.49-0.057.010.88
ζ-FeN0.5100920.420.25-0.2711
80.340.66-0.22
A—relative content (distribution) of iron for the appropriate Fe-containing phase (in at.%) in relation to the total Fe content in studied sample; C—relative contribution of the sub-spectral component; IS—isomer (total) shift relative to α-Fe; QS—quadrupole splitting; B—hyperfine magnetic field; Γ—absorption line width (within transmission integral approximation).
Table 2. The comparison of iron content (distribution) for the phases found in studied samples according to the X-ray diffraction (XRD) and 57Fe Mössbauer spectroscopy (MS) methods.
Sample No. (Figure 1)P [Pa−0.5]XN/XFe
[mol/mol]
The Relative Content of Iron for Given Phases Found in Studied Samples
[at. %]
XRD Results57Fe-MS Results
α-Fe(N)γ’-FeN0.25ε-FeNxζ-FeN0.5α-Fe(N)α”-FeN0.125γ’-FeN0.25ε-FeN0.33ε-FeN0.33<x<0.5ζ-FeN0.5Fe-?
The nitriding process of nanocrystalline iron
1.0.00560.016100.0---90-----10
2.0.00620.03685.414.6--83-9---8
3.0.00880.06074.125.9--72-21---7
4.0.00950.15541.658.4--38-50---12
5.0.0100.21518.181.9--16-68---16
6.0.0450.247-100.0---481---15
7.0.0660.271-76.123.9--275-8-15
8.0.0830.323-27.472.6---342442--
9.0.150.427--100.0-----100--
10.2.140.482---100.0-----100-
11.pure NH30.498---100.0-----100-
The reduction process of a mixture of nanocrystalline iron nitrides α” and γ’
12.0.0170.239-100.0---385---12
13.0.0110.235-100.0---483---13
14.0.00250.2311.898.2---383---14
15.0.00190.2075.794.3---681---13
16.0.00170.06078.721.3--68-25---7
17.0.00150.02496.53.5--82-11---7
The reduction process of nanocrystalline iron nitride ζ
18.0.160.427--100.0-----100--
19.0.070.411--100.0----4753--
20.0.030.383--100.0-----78-22
21.0.0110.319-3.396.7--3-75--22
22.0.00440.283-24.275.8--111258--19
23.0.00320.2510.856.342.9--75126--16
24.0.00260.16735.746.517.8-3253120--12
25.0.00140.07676.523.5--69-25---6
Publisher’s Note: MDPI stays neutral with regard to jurisdictional claims in published maps and institutional affiliations.