Abstract
Synthesis of Ni- and N-doped Titania Nanotube Arrays (Ni-N-TiNTAs) was conducted to produce photocatalysts for hydrogen production from a glycerol–water mixture. Ni-N-TiNTAs were synthesized in two steps, namely anodization and chemical reduction. Ti foil was anodized at 50 V for two h in an electrolyte solution containing 0.2% urea as a source of N atoms. Ni doping (at various content of 5%, 10%, 15%, and 20% wt) was performed by one-hour chemical reduction with sodium borohydride as a reducing agent. The photocatalyst was annealed at different temperatures, i.e., 500 °C, 550 °C, and 600 °C under 60 mL/min N2 gas for two h. On the basis of X-ray Diffraction (XRD) patterns, Ni-N-TiNTAs are mostly of anatase crystallite phase when annealed at 500 °C and 550 °C, while that of rutile was observable when calcination was done at 600 °C. The morphology of the photocatalysts was scrutinized by means of Field Emission Scanning Electron Microscopy (FESEM) imaging, which reveals nanotubular structures, with elemental composition measured by Energy Dispersive X-ray (EDX). The bandgap of the photocatalysts was analyzed using Ultraviolet Diffuse Reflectance Spectroscopy (UV DRS), which showed a lower value for the case of Ni-N-TiNTAs as compared to those of TiNTAs and N-TiNTAs. Photocatalytic tests showed that the highest amount of hydrogen produced (ca. 30973 μmol/m2) was obtained in the case of Ni-N-TiNTAs with a Ni content of 10wt%.
1. Introduction
The development of technology is currently challenged by the increase in energy demand and declining fossil-based energy sources. Finding alternative energy sources that are clean and renewable is thus of paramount importance. Hydrogen, in particular, is of interest owing to its high energy density and emission-free features it offers. It is well documented that the combustion of hydrogen would produce CO2 or other harmful emissions such as smoke and particulate matters [1,2,3]. Besides, hydrogen can be obtained virtually from any organic compound. One promising candidate in this context is glycerol, obtained from the biodiesel industry as a mass-produced undesired byproduct [4,5].
Technological development for efficient hydrogen production has been sought by many researchers around the world. Water splitting is one of the most popular production routes, due to its reasonably simple reaction and the fact that it does not produce CO2. However, it is often limited by its energy-demanding nature [6]. Photocatalysis, which utilizes photon energy for activation, has been developed and deemed promising for the future application of hydrogen production, due to its cost-effectiveness, non-toxicity, and resistance to deactivation [1]. Among many photocatalysts, TiO2 has been recognized as the most prominent because of its thermodynamic feature that fits water splitting. The energy levels of its conduction band and valence band were situated such that they straddle the redox potentials of both hydrogen and oxygen. However, the effectiveness of using TiO2 as a photocatalyst, particularly in the absorption of solar photons, is limited by its large bandgap (3.2 eV for anatase and 3 eV for rutile), which only allows photoexcitation under UV [7,8]. Moreover, the issues of limited surface area and the high rate of electron-hole recombination have also been barriers to practical applications [9].
Synthesis of TiO2 by anodization of Ti plates to obtain films with nanotubular morphology is one of the most effective strategies to improve the properties of TiO2. The one-dimensional structure of nanotubes is expected to provide effective charge transport; thus, it can reduce the recombination of electron and hole [10]. On the other hand, doping of TiO2 with non-metals, such as N, B, C, F, S, or I, can be sought to improve its ability to be activated by visible light illumination. It is also well documented in the literature that loading of metallic cations, such as Pt, Ni, Cu, Zn, Zr, or Fe, can effectively trap and transfer the photo-excited electrons to redox targets [11].
Studies on photocatalytic hydrogen production have been continuously developing for the past decade, mostly based on titania and its various modifications. In a review reported by Zhang et al. (2010), it was particularly highlighted that doping of N onto TiO2 is subject to instability and relatively low kinetics of photo-oxidation [12]. They also suggested that the addition of metals into photocatalyst composite could increase the stability of N, while, at the same time, hindering electron-hole recombination for better photocatalytic redox kinetics. Metal doping is a practical approach to inhibit the rate of electron-hole recombination so that the lifetime of excitons can be significantly expanded. Metals with higher work functions than TiO2 such as Pt, Au, Pd, Ni, Cu, and Ag can act as electron trappers to prevent the electron-hole recombination, thereby increasing photocatalytic efficiency [13].
In our previous study [11], we synthesized and utilized Pt-N-TiO2 nanotubes for the production of hydrogen, revealing better photocatalytic properties as compared to unmodified TiO2 nanotubes. Although Pt possesses an adequately high work function, which makes it an excellent electron trapper and acts as an agent to increase TiO2 stability [14], it is not particularly cost-effective. In the present study, we replace Pt with a cheaper metal, Ni, as a co-catalyst for N-doped TiO2 nanotubes. The work function of Ni is known to be 5.35 eV, which is deemed adequate as an electron trapper yet is much less costly than Pt.
Our present study is a continuation of our previous one on the effect of nitrogen doping on titania nanotube properties [15]. Herein, we present the synthesis of Ni- and N-doped titania nanotubes as photocatalysts for hydrogen production from a glycerol–water mixture. Ni-N-TiNTAs was prepared by anodization of the Ti plate, followed by chemical reduction by sodium borohydride, and thermal annealing. The effects of Ni doping on a titania nanotube as a photocatalyst was investigated in detail. The photocatalytic performance of Ni-N-TiNTAs on hydrogen production was compared to its undoped and N-doped counterparts. The doping of Ni on titania nanotubes can increase not only the photocatalytic hydrogen production but also improve the stability of titania nanotubes. We also propose the possible scheme of Ni-N-TiNTAs in improving the photocatalytic properties of titania nanotubes.
2. Results and Discussion
2.1. Characterization of Modified Titania Nanotube Arrays
FESEM micrographs of the undoped TiNTAs and Ni-N-TiNTAs samples with various Ni loading are presented in Figure 1. We have previously reported that nitrogen doping did not affect the structure of nanotubes even though the surface is covered by a layer that was predicted to be nitrogen atoms accumulating on the surface [15]. In this study, however, we found slight distinctions between TiO2 nanotubes before and after nickel doping. It is inferred from Figure 1 that the addition of Ni via chemical reduction did not damage the original morphology and superstructure of TiNTAs. Chemical reduction of Ni(NO3)2·6H2O solution in the presence of NaBH4 can be written as follows [16]:
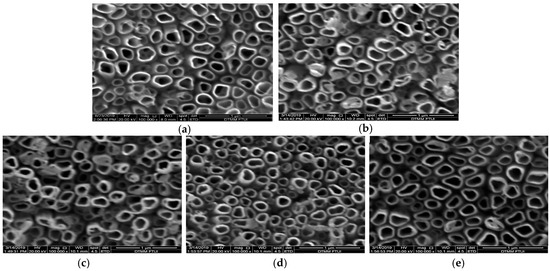
Figure 1.
FESEM top image of (a) TiNTAs; (b) 5 Ni-N-TiNTAs; (c) 10%Ni-N-TiNTAs; (d) 15%Ni-N-TiNTAs and (e) 20%Ni-N-TiNTAs; with a magnification of 100 k.
Deposits of Ni and N on TiNTAs can be observed in Figure 1b as there are agglomerates on top of the tubes. A similar phenomenon occurred in research conducted by Hasan et al. (2010), in which agglomeration of Pt was observable on top of the tubes [10]. The effect of Ni loading on the apparent elemental composition (presented as an average of three different areas) is illustrated in the EDX spectra (Figure 2). The signal of N is detected as they are incorporated into the matrix of TiNTAs during anodization. N atoms expectedly come from urea, although they can also come from NH4F, presumably to a smaller extent. This finding agrees well with our previous results [11]. The results of the EDX analysis in Table 1 confirm the presence of Ni and N atoms in TiNTAs photocatalysts. Table 1 also shows an increase in the content of elemental Ni deposited on the photocatalyst as the concentration of Ni precursor increases. The EDX mapping confirmed that Ni was successfully loaded on the surface of the titania nanotube. The elemental distribution of Ni-N-TiNTAs samples is also shown in Figure 3. The yellow, red, green, and white colors represent the distributions of Ti, O, Ni, and N, respectively. The density of color signals in the images can be related to the content of each element based on EDX analysis.
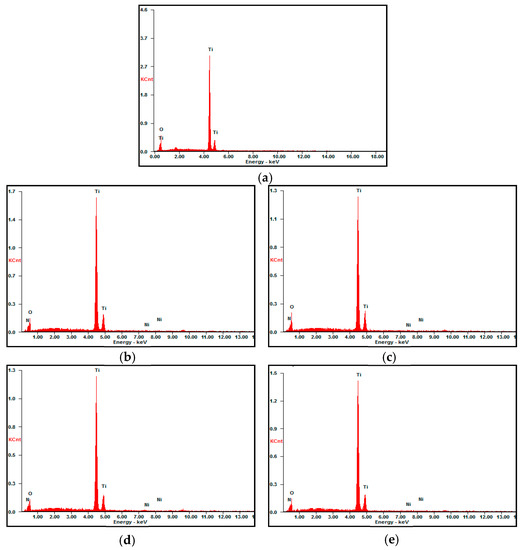
Figure 2.
EDX spectra of (a) TiNTAs; (b) 5%Ni-N-TiNTAs; (c) 10%Ni-N-TiNTAs; (d) 15%Ni-N-TiNTAs and (e) 20%Ni-N-TiNTAs.

Table 1.
EDX results of undoped TiNTAs and doped TiNTAs.
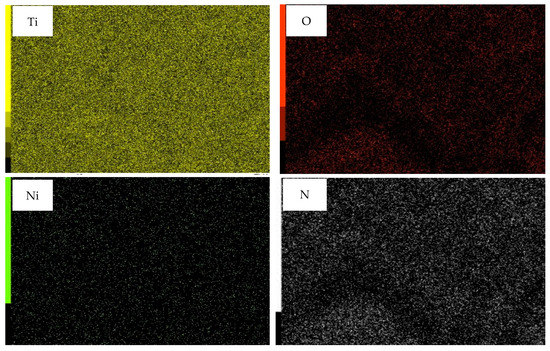
Figure 3.
Elemental mapping of Ni-N-TiNTAs.
XRD analysis was performed to probe the crystallite structure of titania nanotubes and to observe the effects of Ni and N addition on the original crystallite features of titania. Figure 4a shows the XRD pattern for TiNTA, N-TiNTA, and Ni-N-TiNTA samples, annealed at 500 °C, revealing that all exhibit an anatase crystallite phase. Alteration or shift of 2 was not observed in TiNTA, N-TiNTA, and Ni-N-TiNTA samples, which denotes that the presence of impurities, in this case, does not interfere with TiO2 crystallite structure.
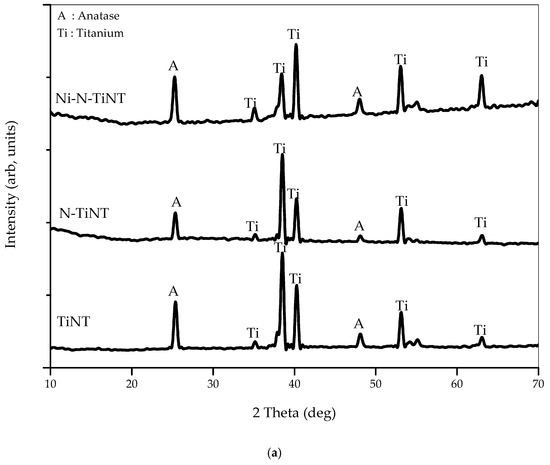
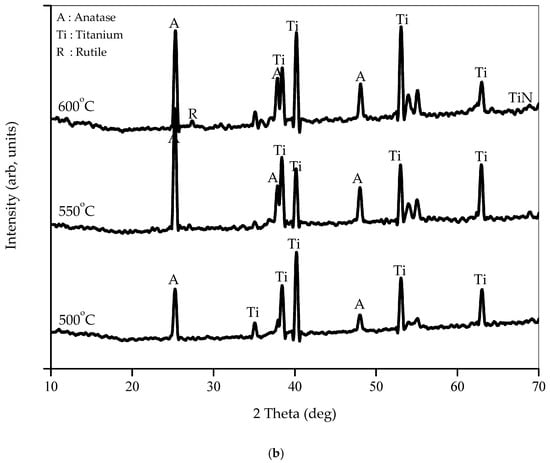
Figure 4.
XRD patterns of (a) undoped and doped TiNTAs; (b) Ni-N-TiNTAs with various annealing temperatures.
Figure 4b illustrates the XRD pattern for Ni-N-TiNTA samples, annealed at different temperatures (500 °C, 550 °C, and 600 °C). The diffraction patterns show six signals at 2θ = 25.3°, 37.9°, and 48.4°, respectively, attributable to (101), (004), and (200) anatase crystallite orientations, according to JCPDS No.21-1272 [17,18]. Calculation of crystallite size was pursued by applying the Scherrer–Debye equation [9,19], on the main peak at 25.3°, revealing the values of 26, 28, and 29 nm for Ni-N-TiNTA samples at 500 °C, 550 °C, and 600 °C, respectively. Expectedly, the crystallite size increases with increasing annealing temperature, as thermal energy would generate crystal seeds, which further grows with temperature [20]. It is also inferred from Figure 4b that a rutile crystallite phase started to be detectable when annealing was conducted at 600 °C, indicated by a mild diffractive signal at 27.8°, which is known as a typical (110) rutile crystallite orientation [21].
Interestingly, a moderate diffractive signal is detected at 2θ of 68.3°, which might be attributed to a titanium nitride crystal. We speculatively believe that, during annealing at 600 °C under N2 atmosphere, nitrogen incorporated onto the TiO2 lattice by replacing some of the oxygen atoms, generating crystallite titanium nitride. Furthermore, there was no characteristic signal of Ni detected in the XRD. According to Barakat et al. [22], Ni was not detected in the XRD pattern because Ni was evenly dispersed on the titania nanotubes, occupying vacant sites within the nanotubular structure.
UV-Vis Diffuse Reflectance Spectroscopy (UV-Vis DRS) was carried out to probe the optical absorption of the samples in a spectral interval of 300–800 nm. The effects of N and Ni doping on the optical absorption are presented in Figure 5a, inferring that the absorbance of the N-doped and Ni-N-doped samples is red-shifted. The bandgap of the photocatalyst samples was estimated by the Kubelka–Munk function and Tauc plot [23] as follows:
where F(R) = (1 − R)2/2R; R is reflectance, hυ is photon energy, and K is the constant characteristic of TiO2. For photocatalyst TiO2, Tauc plot [F(R).hυ]1/2 on hυ provides a linear line on optical light absorption, as shown in Figure 5b. By extrapolating the Tauc line to intercept x-axis, the bandgap energy can be calculated as presented in Table 2. TiNTA has an apparent bandgap of 3.17 eV, which is typical to that of typical anatase (3.20 eV). The bandgap narrowing might be attributed to incorporating N into the TiNTA structure during calcination under N2 atmosphere. The bandgap is further narrowed in the case N-TiNTAs, in which N is purposefully incorporated by adding urea during preparation, resulting in the bandgap of 2.89 eV. It was earlier suggested that the formation of N-Ti-O bonds causes the valence band to shift toward higher energy levels hence narrowing the bandgap [24].
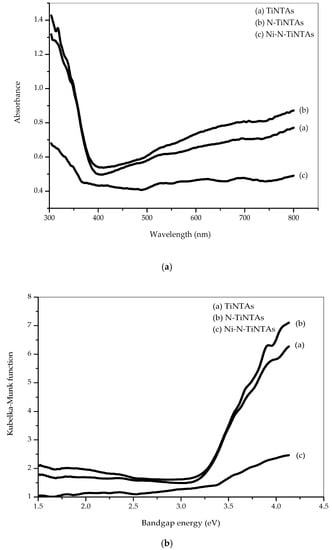
Figure 5.
UV-DRS reflectance spectrum of the photocatalysts: (a) absorption behavior; (b) Tauc plot of the Kubelka–Munk function.
Table 2.
Bandgap Energy of Photocatalysts.
A more noticeable bandgap narrowing was achieved by Ni-N-TiNTAs, revealing a bandgap of 2.75 eV. In this case, the shift of valence band imposed by the addition of N is accompanied by the shift of conduction band to lower energy levels due to 3d metal hybridization between Ti and Ni [25]. According to Lin et al. (2012), electrons in the valence band were photoexcited to the impurities level within the forbidden gap upon absorbing relatively low photon energy, before switching to the conduction band. It increased the effectiveness of photoexcitation and created a red shift of the absorption edge.
The chemical reduction process was carried out at 25 °C and 1 atm. During this process, we measured the pH and oxidation-reduction potential (ORP) of the solution (Figure 6). This measurement is aimed to predict the process of reducing Ni2+ to Ni thermodynamically. The pH and ORP data from this process were compared to the Pourbaix diagram of the nickel-water system [26]. According to the Pourbaix diagram, the pH and ORP conditions were still in the Ni2+ region. However, the decreasing ORP during the chemical reduction process indicates that the reduction of Ni2+ to Ni is still in effect, although it is expected that the reaction does not occur completely, considering the small amount of reducing agent and short reaction time. The reduction of nickel was rather tricky, especially in the presence of dissolved oxygen, which allows the formation of oxides. According to the study conducted by Dostanic et al. (2019), the XPS results showed the peak of Ni2+ being higher than that of Ni(0) species. The presence NiO in their samples was suggestively originated from the partial oxidation of Ni during sample transfer before measurements. It was evident that nickel was oxidized relatively easily at room temperature and pressure [27]. However, the presence of NiO did not completely nullify its function as an electron trapper; rather, it could still improve the performance of hydrogen production, as confirmed in the study reported by Dostanic et al. (2019) and Melian et al. (2014), in whose work NiO plays an electron-trapping role [27,28].
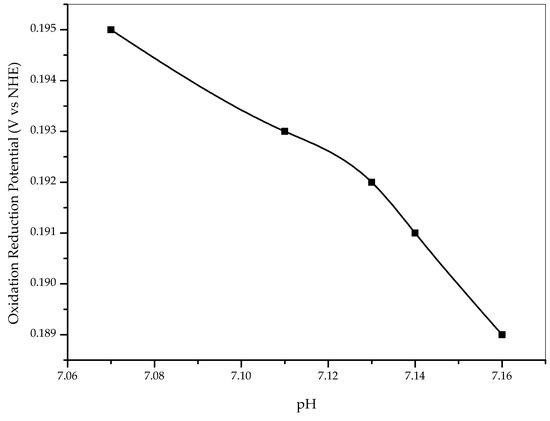
Figure 6.
The oxidation-reduction potential of mix solution during the pH changes.
Furthermore, the reduction of Ti4+ to Ti3+ is not thermodynamically feasible under the given condition. Based on the Pourbaix diagram, the pH and oxidation and reduction potential (ORP) during the chemical reduction process are in the TiO2 region and are very far from the Ti3+ region. So, we concluded that TiO2 was not reduced to Ti3+ due to the presence of NaBH4.
2.2. Effect of Annealing Temperature on Hydrogen Production
Figure 7 illustrates the photocatalytic hydrogen production over TiNTA samples annealed at different temperatures. The samples annealed at 500 °C and 550 °C exhibit similar hydrogen yield (after 4 h illumination) of ca. 28,739 µmol/m2 and ca. 29,634 µmol/m2, respectively, which are appreciably higher than that revealed by the sample annealed at 600 °C (22,739 µmol/m2). This result can be related to our findings regarding the crystallinity of TiNTAs samples annealed at different temperatures (Figure 4b). From the XRD patterns, it was observed that the rutile crystalline phase started to be detectable only when the annealing temperature is 600 °C. It is well established that photocatalytic activity is strongly influenced by the crystallinity of photocatalysts used. As far as photocatalytic kinetics is concerned, TiO2 of the anatase crystallite phase is generally a better photocatalyst than that of rutile [29], which explains our findings in Figure 8. A plausible explanation was also provided by Kusdianto et al. (2017), who suggested that anatase and rutile differ in the manner in which electrons and holes interact, which in turn affect their photocatalytic properties [30].
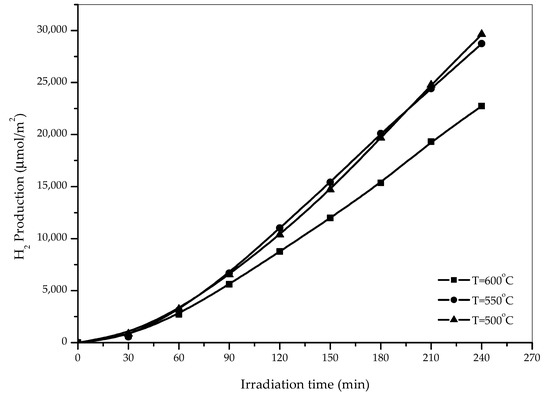
Figure 7.
Effects of Temperature Annealing on the Production of H2 from glycerol–water mixture (10%v glycerol).
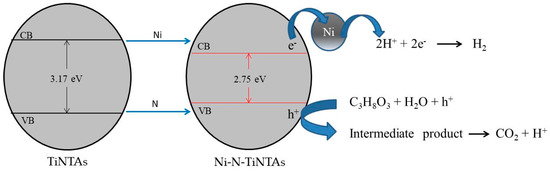
Figure 8.
The mechanism of photocatalytic hydrogen production using Ni-N-TiNTAs.
2.3. Effect of Addition Non-Metal N and Ni Metal for Production Hydrogen
Figure 8 shows the mechanism of hydrogen production from a glycerol–water mixture using Ni-N-TiNTAs. The presence of N is expected to give rise to the hybridization of 2p orbitals between O and N in the valence band of TiO2. This causes an increase in energy level, thereby narrowing the bandgap. Ni plays a role in increasing the energy level in the conduction band as well as anchoring photo-generated electrons. Upon interfacial contact between Ni and TiNTAs, electrons are transferred from the conduction band to the Fermi level of Ni until an electrostatic equilibrium is obtained, suppressing the electron-hole recombination. The photo-generated holes subsequently oxidize glycerol into CO2 and H+, while electrons reduce H+ to H2. Slamet et al. (2017) reported their studies about intermediate products from the photoreformation of glycerol. The intermediate products are identified as ethylene glycol, methanol, formaldehyde, acetone, acetic acid, and ethanol in the gas phase and ethylene glycol and acetic acid in the liquid phase [31].
Figure 9 shows the effects of N and Ni as TiNTA modifiers on the photocatalytic production of hydrogen from a glycerol–water solution over 240 min of illumination. The doping of N into TiNTAs has an apparent adverse effect on the yield of hydrogen produced, as N-TiNTA was observed to offer around 22,000 µmol/m2, noticeably lower than that achieved by its unmodified counterpart. Although N doping has been recognized as one of the most effective strategies for enhancing photocatalytic activity of TiO2 under visible light, it comes with a major drawback with regards to exciton recombination. A low-bandgap photocatalyst allows photoexcitation at relatively low energy levels; however, the excitons are more likely to recombine hence impeding the intended photo-redox reactions.
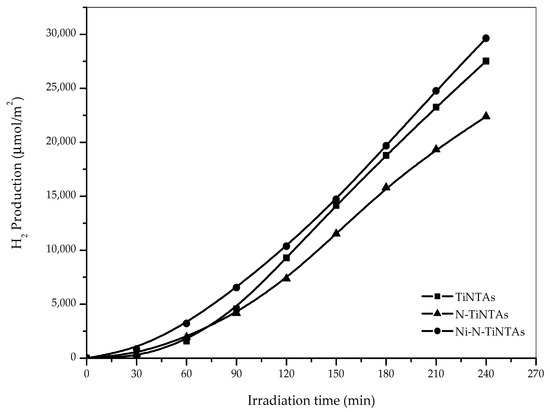
Figure 9.
Effect of doped photocatalyst on the production of H2 from glycerol–water mixture (10%v glycerol).
Importantly, the addition of Ni to N-TiNTAs is proven to be an effective strategy in reviving the photocatalytic properties—it was, in fact, slightly outperforming the original TiNTAs. The presence of Ni enables more effective charge carrier separation and transport, hence hindering undesired carrier recombination. The effectiveness of a metal serving as an electron trapper in TiO2-based photocatalysis is governed to a large extent by its thermionic work function. Any metal with a virtually higher work function than that of TiO2 is expected to have the capacity for trapping electrons. In this case, Ni with a work function of 5.35 eV is an excellent electron trapper, considering that TiO2 has a much lower work function of 4.6 eV [32].
Along with electron trapping, metal co-catalysts serve the purpose of overcoming the high overpotential of water splitting. It is well documented that the metal-semiconductor interface induces the formation of Schottky barrier, which enables more effective electron flow the rate of recombination of holes and electrons through Schottky barrier electron trapping [33]. The presence of metal in the N-TiO2 system is also known to improve the stability of N atoms in TiO2 lattice, contributing to not only charge carrier separation but also to maintain visible-light responsivity of N-promoted titania [12].
2.4. Effect of Variations in the Concentration of Ni on Hydrogen Production
The effects of Ni content on the hydrogen yield were investigated, the results of which are illustrative in Figure 10. In the present case, Ni content was varied from 5% to 20%, while the content of N was fixed, which constitutes a variation in Ni/N ratio. In the case of 5% Ni loading, ca. 25,438 µmol/m2 of hydrogen is produced after 4 h of illumination, which is noticeably improved to ca. 30,973 µmol/m2 upon increasing the content of Ni to 10%. Interestingly, the hydrogen yield slightly reduces when more Ni (15%) is added to N-TiNTAs, revealing the value of ca. 29,634 µmol/m2. In fact, further increase of Ni content is evidently detrimental to the photocatalytic activities where only 22,187 µmol/m2 can be yielded from photocatalytic hydrogen production from the glycerol–water mixture—comparable to that which is obtained by its N-TiNTA counterpart. The presence of a critical value of co-catalyst loading is quite typical in photocatalytic hydrogen production. Liu et al. (2014) reported optimum Ni content of 6% in the range of 0%–12% Ni [34]. A photoelectrochemical study on Ni-doped TiO2 nanotubes photoanode that was conducted by Dong et al. (2018) also showed a similar phenomenon [35]. While the presence of an adequate number of Ni promotes charge transfer, an excessive amount would lead to a shielding effect, a condition in which bulk Ni particles forbid the incoming photons impinging the photo-active sites of photocatalysts. Besides, when the amount of Ni is so high, it serves as a recombination center instead [36].
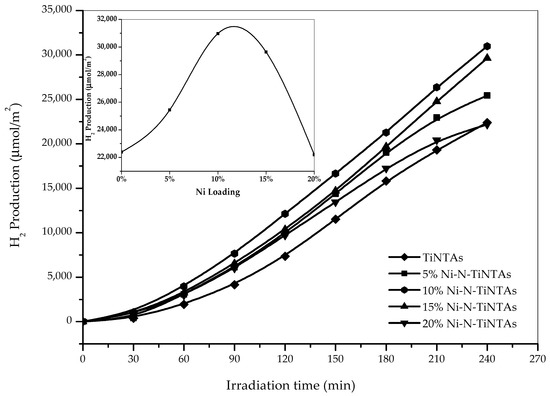
Figure 10.
Effect of Ni loading on H2 Production from glycerol–water mixture (10%v glycerol).
2.5. Photocurrent Density Response
The activity of photocatalysts to produce hydrogen can also be seen from photocurrent density responses. At this stage, the measurement of photocurrent density was conducted for Ni-N-TiNTAs with optimum loading (10% Ni), N-TiNTAs, and TiNTAs. Figure 11 shows that Ni doping significantly affected the photocurrent density of titania nanotube. The results implied that Ni doping could improve the photoactivity of titania nanotube. The data were also indicated as a preliminary test for comparing the stability of photocatalytic activity in various photocatalysts, both undoped and doped TiNTAs.
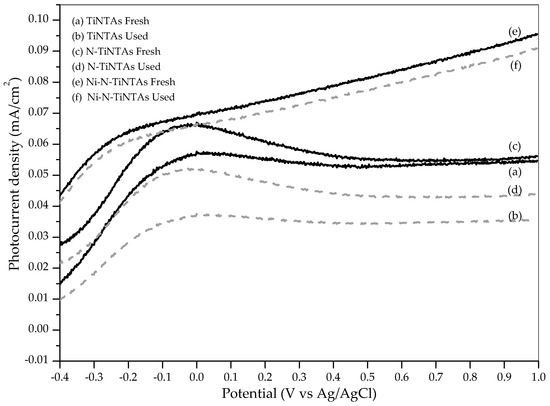
Figure 11.
The photocurrent density of TiNTAs, N-TiNTAs, and Ni-N-TiNTAs in the various cycle.
The stability is an important parameter to assess the practicability and the possibility of reuse of the photocatalyst. The photocatalyst should be capable of maintaining photocatalytic activity even after abundant usage. The stability of the photocatalyst was evaluated by means of photocurrent density measurement for fresh and used samples. After each run for 4 h, samples were cleaned by distilled water and dried at ambient temperature, after which the photocurrent density is measured. Figure 11 represented the photocurrent density of each sample before and after use. The photocurrent densities of the Ni-N-TiNTAs photocatalysts exhibit prominent stability compared to other samples. It is evident that Ni can maintain its function as an electron trapper and that the addition of Ni can improve the sustainability of the photocatalytic activity. This finding verifies that the Ni-N-TiNTAs is efficient to use in photocatalytic hydrogen production. It has also been reported by Lakshmi et al. (2019) and Shaban et al. (2019) that Ni-doped TiO2 could enhance the stability of photocatalytic activity [37,38].
3. Materials and Methods
3.1. Materials
Titanium foils with a purity of 99% were assigned as the raw material to produce TiO2 nanotubes. For chemical polishing, HNO3 (Merck, 65%, Darmstadt, Germany), HF (Merck, 40%), and distilled water were used. The source of nitrogen for N doping is Urea (Merck, P.A), while Ni(NO3)2·6H2O was used as a nickel precursor and NaBH4 as a reducing agent. Electrolyte solutions during photocatalytic tests contain glycerol (Brataco, Tangerang, Indonesia), NH4F (Merck, 98%), and distilled water.
3.2. Synthesis of N-TiNTAs
The Ti foil (3.0 cm × 2.0 cm) was mechanically polished with sandpapers (1500 cc) before chemically polished in a solution containing HNO3, HF, and distilled water (1:3:6 at volume base) for 2 min. The polished Ti foil was then rinsed with distilled water and dried at ambient temperature. These steps were carried out to remove contaminants contained on the Ti foil before anodization.
Anodization of Ti foils was carried out in a beaker glass containing HF 0.5%wt, distilled water 25%wt, and urea 0.2%wt. The electrolyte solution was continuously stirred throughout anodization to ensure uniformity of the nanotube formation. Anodization is carried out in a two-electrode electrochemical system, with Ti foil as the anode and Pt as the cathode, operating at a fixed potential of 50 V (powered by a DC power supply, Escort 6030 SD, Leiderdorp, Netherlands) for the duration of 2 h. Upon anodization, TiNTAs was then rinsed with distilled water and dried in an oven at 130 °C for 1 h.
3.3. Synthesis of Ni-N-TiNTAs
Synthesis of the Ni-N-TiNTA photocatalyst was carried out by chemical reduction using Ni(NO3)2·6H2O as Ni precursor and 0.005 g of NaBH4 as a reducing agent. The concentration of Ni(NO3)2·6H2O was varied at 5%, 10%, 15%, and 20%wt, based on TiO2 nanotube weight in 60 mL water. The as-synthesized N-TiNTAs was immersed in the aforementioned solution for 1 h with continuous magnetic stirring at 150 rpm. Following this step is the thermal annealing at various temperatures of 500 °C, 550 °C, and 600 °C under 60 mL/min N2 gas flow to impose crystallite phases to the samples. The reduction-oxidation potential and pH were measured during the synthesis using a pH meter (Horiba, PH110-KN, Kyoto, Japan).
3.4. Characterization of TiNTAs, N-TiNTAs, and Ni-N-TiNTAs
The morphology of undoped and doped TiNTA was analyzed by an FESEM (FEI Inspect F50), operating at 20 kV of accelerating voltage. The elemental composition of the samples was determined by an Energy Dispersive X-ray analyzer (Oxfords XMAX 50 detector, High Wycombe, UK) which is attached to FESEM. Analysis using UV-DRS (Agilent Technologies Cary 60, Santa Clara, California, USA) was carried out in a wavelength range of 200–900 nm to reveal the bandgap of the sample, applying by the Kubelka–Munk calculation. The crystal structure of TiNTAs was analyzed by XRD (Shimadzu 7000 Maxima-X, Kyoto Japan), operated at 40 kV and 30 mA with Cu Niα (λ = 0.15406 nm) as the beam source. The scanning rate is fixed at 2° min−1 over the scan range 10–80. FWHM (full width at half maximum) is evaluated to use Scherrer equation for crystallite size estimation.
3.5. Performance Test of Hydrogen Productions
The photocatalytic hydrogen production was conducted in a 500-mL photoreactor system as seen in Figure 12, equipped with a thermocouple, a mercury lamp (Philips HPL-N 250 W/542 E40 HG ISL, 17.25% UV and 82.75% Vis), and continuous stirring. The photoreactor was placed in a box, the walls of which were applied with reflectors. The photoreactor system allows a gas line for continuous purging (60 mL/min) by argon (99.99%) which is connected directly to the column of Gas Chromatography (GC, Shimadzu GC 2014, Kyoto, Japan). The hydrogen production was performed in a 150-mL aqueous glycerol solution with a concentration of 10%v. The photocatalyst was inserted in an upright position into a photoreactor. The photocatalytic reaction was carried out for the duration of 4 h in a continuous system with sampling carried out every 30 min to analyze the amount of H2 evolved.
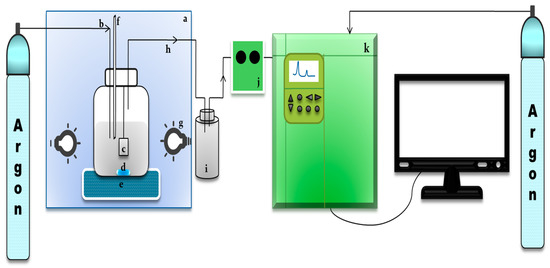
Figure 12.
Photoreactor system, including: (a). reflector box, (b). purging line, (c). photocatalyst, (d) magnetic bar, (e). magnetic stirrer, (f). thermocouple, (g). light source, (h). gas produced line, (i). water trap, (j) gas sampler, (k) Gas Chromatography.
3.6. Photocurrent Density Response
The photoelectrochemical response was examined using a photoelectrochemical cell with three electrodes. TiNTAs, N-TiNTAs, and Ni-N-TiNTAs were used as a working electrode, a platinum foil as the counter electrode, and Ag/AgCl as a reference electrode in saturated KCl. The photoelectrochemical cell consists of a cylindrical vessel which was equipped with 11 Watt UV Blacklight and 1 M Na2SO4 as electrolyte solutions. The photoelectrochemical response was measured using a potentiostat (eDAQ, version 9.1, NSW, Australia). Measurement of photocurrent density was done in a linear sweep voltammetry setup. The electrode performance test was conducted by measuring the photocurrent density in a potential range of −1.0 to 1.0 V at a scan rate of 10 mV·s−1.
4. Conclusions
Ni-N-TiNTA photocatalysts were successfully synthesized via a two-step fabrication technique. The first step involves an anodization method with in-situ N doping, in which the nanotubular structure of TiO2 is formed, and N atoms are introduced by the addition of urea in the electrolyte. The second step is intended to incorporate Ni via a chemical reduction by NaBH4, followed by the N2-conditioned annealing process for 2 h. The presence of nanotubes is evident from FESEM micrographs, while the presence elemental Ni and N is confirmed by EDX analysis. XRD analysis reveals that Ni-N-TiNTAs had an anatase crystallite phase with a crystal size of 26–29 nm depending on Ni loading, while the rutile started to be detectable when annealing was carried out at 600 °C. Bandgap energy, as calculated by the Kubelka–Munk equation and Tauc plots, is substantially narrowed upon the addition of N and Ni dopants. Ultimately, the capability of the synthesized photocatalyst in producing hydrogen was evaluated in a glycerol–water mixture. The presence of Ni as an electron trapper is crucial, not only to promote charge carrier separation but also to overcome the overpotential of water splitting and presumably improve the stability of N atoms in TiO2 lattice. The Ni content of 10% was found to be an optimum value in photocatalytic hydrogen production, offering high yield of 30,973 µmol/m2. This study also revealed that Ni doping on N-TiNTAs enhances the stability of photocatalytic activity. We believe that the approach pursued in this study is quite promising toward effective photocatalytic hydrogen production.
Author Contributions
Conceptualization and methodology—S., D.A.A.; funding acquisition—S.; formal analysis, investigation and data curation—D.A.A. and T.E.; writing—original draft preparation—D.A.A. and T.E.; writing—review and editing—S., M.I., and M.N. All authors have read and agreed to the published version of the manuscript.
Funding
This work is supported by Hibah Q1Q2 2019 funded by DRPM Universitas Indonesia grant no. NKB-0324/UN2.R3.1/HKP.05.00/2019.
Conflicts of Interest
The authors declare no conflict of interest.
References
- Jing, D.; Guo, L.; Zhao, L.; Zhang, X.; Liu, H.; Li, M.; Shen, S.; Liu, G.; Hu, X.; Zhang, X. Efficient solar hydrogen production by photocatalytic water splitting: From fundamental study to pilot demonstration. Int. J. Hydrogen Energy 2010, 35, 7087–7097. [Google Scholar] [CrossRef]
- Preethi, V.; Kanmani, S. Photocatalytic hydrogen production. Mater. Sci. Semicond. Process. 2013, 16, 561–575. [Google Scholar] [CrossRef]
- Liao, C.-H.; Huang, C.-W.; Wu, J.C.S. Hydrogen Production from Semiconductor-based Photocatalysis via Water Splitting. Catalysts 2012, 2, 490–516. [Google Scholar] [CrossRef]
- Slamet, S.; Tristantini, D.; Valentina, P.; Ibadurrohman, M. Photocatalytic hydrogen production from glycerol-water mixture over Pt-N-TiO 2 nanotube photocatalyst. Int. J. Energy Res. 2012, 37, 1372–1381. [Google Scholar] [CrossRef]
- Chang, C.-J.; Lin, Y.-G.; Weng, H.-T.; Wei, Y.-H. Photocatalytic hydrogen production from glycerol solution at room temperature by ZnO-ZnS/graphene photocatalysts. Appl. Surf. Sci. 2018, 451, 198–206. [Google Scholar] [CrossRef]
- Huang, D.-C.; Jiang, C.-H.; Liu, F.-J.; Cheng, Y.-C.; Chen, Y.-C.; Hsueh, K.-L. Preparation of Ru–Cs catalyst and its application on hydrogen production by ammonia decomposition. Int. J. Hydrogen Energy 2013, 38, 3233–3240. [Google Scholar] [CrossRef]
- Pan, X.; Xie, Q.; Chen, W.-L.; Zhuang, G.-L.; Zhong, X.; Wang, J. Tuning the catalytic property of TiO2 nanotube arrays for water splitting. Int. J. Hydrogen Energy 2013, 38, 2095–2105. [Google Scholar] [CrossRef]
- Talat-Mehrabad, J.; Khosravi, M.; Modirshahla, N.; Behnajady, M. Sol–gel preparation and characterization of Ag and Mg co-doped nano TiO2: Efficient photocatalytic degradation of C.I. Acid Red 27. Res. Chem. Intermed. 2015, 42, 595–609. [Google Scholar] [CrossRef]
- Antony, R.P.; Mathews, T.; Ramesh, C.; Murugesan, N.; Dasgupta, A.; Dhara, S.; Dash, S.; Tyagi, A. Efficient photocatalytic hydrogen generation by Pt modified TiO2 nanotubes fabricated by rapid breakdown anodization. Int. J. Hydrog. Energy 2012, 37, 8268–8276. [Google Scholar] [CrossRef]
- Hassan, F.M.; Nanjo, H.; Venkatachalam, S.; Kanakubo, M.; Ebina, T. Functionalization of electrochemically prepared titania nanotubes with Pt for application as catalyst for fuel cells. J. Power Sources 2010, 195, 5889–5895. [Google Scholar] [CrossRef]
- Ratnawati; Gunlazuardi, J.; Dewi, E.L.; Slamet. Effect of NaBF4 addition on the anodic synthesis of TiO2 nanotube arrays photocatalyst for production of hydrogen from glycerol–water solution. Int. J. Hydrogen Energy 2014, 39, 16927–16935. [Google Scholar] [CrossRef]
- Zhang, J.; Wu, Y.; Xing, M.; Leghari, S.A.K.; Sajjad, S. Development of modified N doped TiO2 photocatalyst with metals, nonmetals and metal oxides. Energy Environ. Sci. 2010, 3, 715–726. [Google Scholar] [CrossRef]
- Kumaravel, V.; Mathew, S.; Bartlett, J.; Pillai, S.C. Photocatalytic hydrogen production using metal doped TiO2: A review of recent advances. Appl. Catal. B Environ. 2019, 244, 1021–1064. [Google Scholar] [CrossRef]
- Shu, Z.; Cai, Y.; Ji, J.; Chang-Jin, T.; Yu, S.; Zou, W.; Dong, L. Pt Deposites on TiO2 for Photocatalytic H2 Evolution: Pt Is Not Only the Cocatalyst, but Also the Defect Repair Agent. Catalysts 2020, 10, 1047. [Google Scholar] [CrossRef]
- Elysabeth, T.; Redjeki, A.S. Synthesis of N doped titania nanotube arrays photoanode using urea as nitrogen precursor for photoelectrocatalytic application. In IOP Conference Series: Materials Science and Engineering; IOP Publishing: Bristol, UK, 2019; Volume 509, p. 012144. [Google Scholar]
- Raj, K.; Viswanathan, B. Synthesis of Nickel Nanoparticles with FCC and HCP Crystal Structures; NISCAIR-CSIR: New Delhi, India, 2011. [Google Scholar]
- Meng, A.; Zhang, J.; Xu, D.; Cheng, B.; Yu, J. Enhanced photocatalytic H2-production activity of anatase TiO2 nanosheet by selectively depositing dual-cocatalysts on {101} and {001} facets. Appl. Catal. B Environ. 2016, 198, 286–294. [Google Scholar] [CrossRef]
- Luo, X.; Luo, X.; Shu, H.; Tu, X.; Luo, S. Synthesis of anatase TiO2 in a vinyl-containing ionic liquid and its enhanced photocatalytic activity. Res. Chem. Intermed. 2012, 39, 2857–2865. [Google Scholar] [CrossRef]
- Wu, H.; Zhang, Z. High photoelectrochemical water splitting performance on nitrogen doped double-wall TiO2 nanotube array electrodes. Int. J. Hydrog. Energy 2011, 36, 13481–13487. [Google Scholar] [CrossRef]
- Li, H.; Shen, X.; Liu, Y.; Wang, L.; Lei, J.; Zhang, J. Facile phase control for hydrothermal synthesis of anatase-rutile TiO2 with enhanced photocatalytic activity. J. Alloy. Compd. 2015, 646, 380–386. [Google Scholar] [CrossRef]
- Nasr, M.; Chaaya, A.A.; Abboud, N.; Bechelany, M.; Viter, R.; Eid, C.; Khoury, A.; Miele, P. Photoluminescence: A very sensitive tool to detect the presence of anatase in rutile phase electrospun TiO 2 nanofibers. Superlattices Microstruct. 2015, 77, 18–24. [Google Scholar] [CrossRef]
- Barakat, N.A.M.; Ahmed, E.; Amen, M.T.; Abdelkareem, M.A.; Farghali, A. N-doped Ni/C/TiO2 nanocomposite as effective photocatalyst for water splitting. Mater. Lett. 2018, 210, 317–320. [Google Scholar] [CrossRef]
- Zhou, L.; Deng, J.; Zhao, Y.; Liu, W.; An, L.; Chen, F. Preparation and characterization of N–I co-doped nanocrystal anatase TiO2 with enhanced photocatalytic activity under visible-light irradiation. Mater. Chem. Phys. 2009, 117, 522–527. [Google Scholar] [CrossRef]
- Cheng, X.; Yu, X.; Xing, Z. Characterization and mechanism analysis of N doped TiO2 with visible light response and its enhanced visible activity. Appl. Surf. Sci. 2012, 258, 3244–3248. [Google Scholar] [CrossRef]
- Lin, Y.; Jiang, Z.; Yue, L.; Hu, X.; Zhu, H.; Zhang, X.; Fan, J.; Lin, S.H. The optical absorption and hydrogen production by water splitting of (Si,Fe)-codoped anatase TiO2 photocatalyst. Int. J. Hydrogen Energy 2013, 38, 5209–5214. [Google Scholar] [CrossRef]
- Pourbaix, M. Atlas of Electrochemical Equilibria in Aqueous Solutions; National Association of Corrosion Engineers: Houston, Texas, 1974. [Google Scholar]
- Dostanić, J.; Lončarević, D.; Pavlović, V.B.; Papan, J.; Nedeljković, J.M. Efficient photocatalytic hydrogen production over titanate/titania nanostructures modified with nickel. Ceram. Int. 2019, 45, 19447–19455. [Google Scholar] [CrossRef]
- Melián, E.P.; Suárez, M.N.; Jardiel, T.; Rodríguez, J.D.; Caballero, A.C.; Araña, J.; Calatayud, D.G.; Díaz, O.G. Egonzález-Díaz, Óscar Influence of nickel in the hydrogen production activity of TiO2. Appl. Catal. B Environ. 2014, 152, 192–201. [Google Scholar] [CrossRef]
- Tian, S.; Yang, H.; Cui, M.; Shi, R.; Zhao, H.; Wang, X.; Wang, X.; Zhang, L. Monodisperse rutile TiO2 nanorod-based microspheres with various diameters: Hydrothermal synthesis, formation mechanism and diameter- and crystallinity-dependent photocatalytic properties. Appl. Phys. A 2010, 104, 149–158. [Google Scholar] [CrossRef]
- Kusdianto, K.; Jiang, D.; Kubo, M.; Shimada, M. Effect of annealing temperature on the photocatalytic activity of Ag–TiO 2 nanocomposite films by one-step gas-phase deposition. Mater. Res. Bull. 2018, 97, 497–505. [Google Scholar] [CrossRef]
- Slamet; Ratnawati; Gunlazuardi, J.; Dewi, E.L. Enhanced photocatalytic activity of Pt deposited on titania nanotube arrays for the hydrogen production with glycerol as a sacrificial agent. Int. J. Hydrogen Energy 2017, 42, 24014–24025. [Google Scholar] [CrossRef]
- Hölzl, J.; Schulte, F.K. Work function of metals. In Solid Surface Physics; Springer: Berlin/Heidelberg, Germany, 1979; pp. 1–150. [Google Scholar]
- Wang, F.-C.; Liu, C.-H.; Liu, C.-W.; Chao, J.-H.; Lin, C.-H. Effect of Pt Loading Order on Photocatalytic Activity of Pt/TiO2 Nanofiber in Generation of H2 from Neat Ethanol. J. Phys. Chem. C 2009, 113, 13832–13840. [Google Scholar] [CrossRef]
- Liu, Y.; Wang, Z.; Fan, W.; Geng, Z.; Feng, L. Enhancement of the photocatalytic performance of Ni-loaded TiO2 photocatalyst under sunlight. Ceram. Int. 2014, 40, 3887–3893. [Google Scholar] [CrossRef]
- Dong, Z.; Ding, D.; Li, T.; Ning, C. Ni-doped TiO2 nanotubes photoanode for enhanced photoelectrochemical water splitting. Appl. Surf. Sci. 2018, 443, 321–328. [Google Scholar] [CrossRef]
- Gui, Q.; Xu, Z.; Zhang, H.; Cheng, C.; Zhu, X.; Yin, M.; Song, Y.; Lu, L.; Chen, X.; Li, D. Enhanced Photoelectrochemical Water Splitting Performance of Anodic TiO2 Nanotube Arrays by Surface Passivation. ACS Appl. Mater. Interfaces 2014, 6, 17053–17058. [Google Scholar] [CrossRef] [PubMed]
- Lakshmi, K.D.; Rao, T.S.; Padmaja, J.S.; Raju, I.M.; Kumar, M.R. Structure, photocatalytic and antibacterial activity study of Meso porous Ni and S co-doped TiO2 nano material under visible light irradiation. Chin. J. Chem. Eng. 2019, 27, 1630–1641. [Google Scholar] [CrossRef]
- Shaban, M.; Ahmed, A.M.; Shehata, N.; Betiha, M.A.; Rabie, A.M. Ni-doped and Ni/Cr co-doped TiO2 nanotubes for enhancement of photocatalytic degradation of methylene blue. J. Colloid Interface Sci. 2019, 555, 31–41. [Google Scholar] [CrossRef] [PubMed]
Publisher’s Note: MDPI stays neutral with regard to jurisdictional claims in published maps and institutional affiliations. |
© 2020 by the authors. Licensee MDPI, Basel, Switzerland. This article is an open access article distributed under the terms and conditions of the Creative Commons Attribution (CC BY) license (http://creativecommons.org/licenses/by/4.0/).