1. Introduction
Titanium dioxide (TiO
2), a typical metal oxide with a high refractive index, chemical stability, long durability, and nontoxicity, has been widely used for many applications, such as white pigments, textiles, papers, cosmetics, medicines, and ceramics. As an
n-type wide bandgap semiconductor, TiO
2 exhibits a unique photoinduced effect involving photogenerated charge carriers that initiate a strong redox reaction of adsorbed substances and hydrophilic conversion of itself [
1,
2]. This effect offers more potential applications involving photochemical processes, such as splitting hydrogen from water, a photocatalyst, a photoconductor, environment cleaning, an antibacterial purpose, chemical sensors, ultraviolet filters, and dye-sensitized solar cells (DSSCs) [
3,
4,
5].
Under normal conditions, TiO
2 exists in three main structures: stable rutile, metastable anatase, and brookite phases. For the pure phase, it is generally accepted that anatase exhibits a higher photocatalytic activity compared to that of rutile, despite its larger bandgap (3.2 eV for anatase vs. 3.0 eV for rutile). The longer lifetime for photo-excited electrons and holes in the indirect bandgap of TiO
2 anatase semiconductor is explained for this feature [
6]. In contrast, TiO
2 in the microstructure is considered a poor photocatalyst, but in a nanostructured form, due to the quantum confinement, the material shows stronger photocatalytic activity in comparison to that of the microstructure [
7]. The unique photocatalyst of TiO
2 is size- and structure-dependent. Therefore, clarification of the effect of synthesis conditions on the resulting TiO
2 nanostructures is of importance to yield effective photocatalysts and diverse photocatalytic applications.
With regard to the synthesis of TiO
2 nanostructures, a variety of techniques based on the pyrolysis of Ti precursors, such as the hydrothermal, solvothermal, sol–gel, direct oxidation, chemical vapor deposition (CVD), electrodeposition, sonochemical, and microwave methods, have been used [
8]. Pyrolysis offers a simple route to synthesize well-crystalline TiO
2 using inexpensive precursors, such as titanium (IV) tetrachloride (TiCl
4), titanium (IV) butoxide, titanium (IV) isopropoxide, amorphous TiO
2, and P
25. In addition, the pyrolysis modest medium of low temperature and adjustable pyrolysis time can provide an effective environment for the synthesis of TiO
2 with high purity, good dispersion, and controllable crystalline. From the viewpoint of chemical thermodynamics, before decomposing into TiO
2 either in the form of anatase, brookite, or rutile, the titanium precursor undergoes a series of amorphous TiO
2 complexes (or intermediates) such as Ti
xO
yCl
z(OH)
w, resulting from the pyrolysis of TiCl
4, [Ti(OH)
4−n(H
2O)
2+n]
n+ from Ti(IV)-butoxide or [Ti
3(y+1)O
4y(OBu)
4(y+3)−x(OEt)
x] from alkoxide metal M(OR)
n [
9,
10,
11,
12]. Amorphous TiO
2 complexes in general are metastable phases, so they can evolve into any crystalline phases under special conditions. The heat treatment route with appropriate reactants is usually used to achieve the transformation from amorphous to crystalline TiO
2. For example, pure anatase or rutile and brookite nanoparticles are obtained by hydrothermal treatment of amorphous TiO
2 with a variety of acid additives as reactants at different concentrations [
13,
14,
15]. Chemical vapor deposition synthesis of pure brookite TiO
2 thin films is also realized by using amorphous TiO
2 as the precursor [
16,
17]. Hence, the amorphous TiO
2 intermediates can be used as a kind of secondary precursor to produce either brookite, anatase, rutile structures, or their derivatives.
With regard to the amorphous Ti
xO
yCl
z(OH)
w complexes resulted from the pyrolysis of TiCl
4, a calculation shows that the substitution of OH for Cl radicals in the complexes does not change much in the core involving the Ti atoms, but there is a difference in the bond lengths and potential energy surfaces [
10]. From a thermodynamic point of view, a change in the relative ratio of the Cl and OH radicals modifies the potential surface energy and then the free energy of the complex TiO
2 intermediates, consequently affecting the final TiO
2 nanostructures. As examples, some works have demonstrated that the pyrolysis of aqueous TiCl
4 solutions with high HCl result in rutile and brookite structures [
18,
19]. However, anatase, which is considered to be the most active photocatalyst, was hardly observed in the resulting materials. From our perspective, the excessive Cl radicals in the reaction medium due to a large amount of HCl additive (pH < 0) resulted in the predominance of rutile and brookite. Moreover, some possible TiO
2 nanostructures in colloidal or amorphous forms left in the reaction solution may have been filtered and washed away. In a series of experiments made on the pyrolysis of an aqueous TiCl
4 solution with lesser HCl concentrations (0.0 < pH < 1.0), we found that the resulting materials were nanocrystalline mixtures of both the anatase and rutile phases. The TiO
2 anatase mainly suspended in the aqueous solution in the colloidal form, while the TiO
2 rutile predominantly precipitated and deposited in the sedimentation [
20,
21]. It was concluded that a high HCl concentration enabled the agglomeration of anatase particles and enhanced the anatase to rutile transition due to the compensation of a Cl radical for the positive charge of polyhedral complexes. Furthermore, the pyrolysis of TiCl
4 in the neutral medium, with a pH level of approximately 6–8, brought in materials of predominantly amorphous TiO
2, as well as trace amounts of anatase, but no rutile or brookite [
14,
22]. Then, the pH levels evolving to correlations between H, Cl, and OH radicals in the reaction media were assumed to be the crucial factors to modify and control the resulting TiO
2 nanostructures. Based on these considerations, in this study, an experiment was carried out to further investigate the effect of an elevated pH level (or OH radical) of the reaction media on the formation of amorphous TiO
2 complexes, as well as of the final anatase nanostructures obtained from the pyrolysis of an aqueous TiCl
4 solution.
2. Results and Discussion
The experiments show that the NH
4OH additive, a weak basic agent used to adjust the pH level of the reaction solution, significantly affects the appearance and properties of TiO
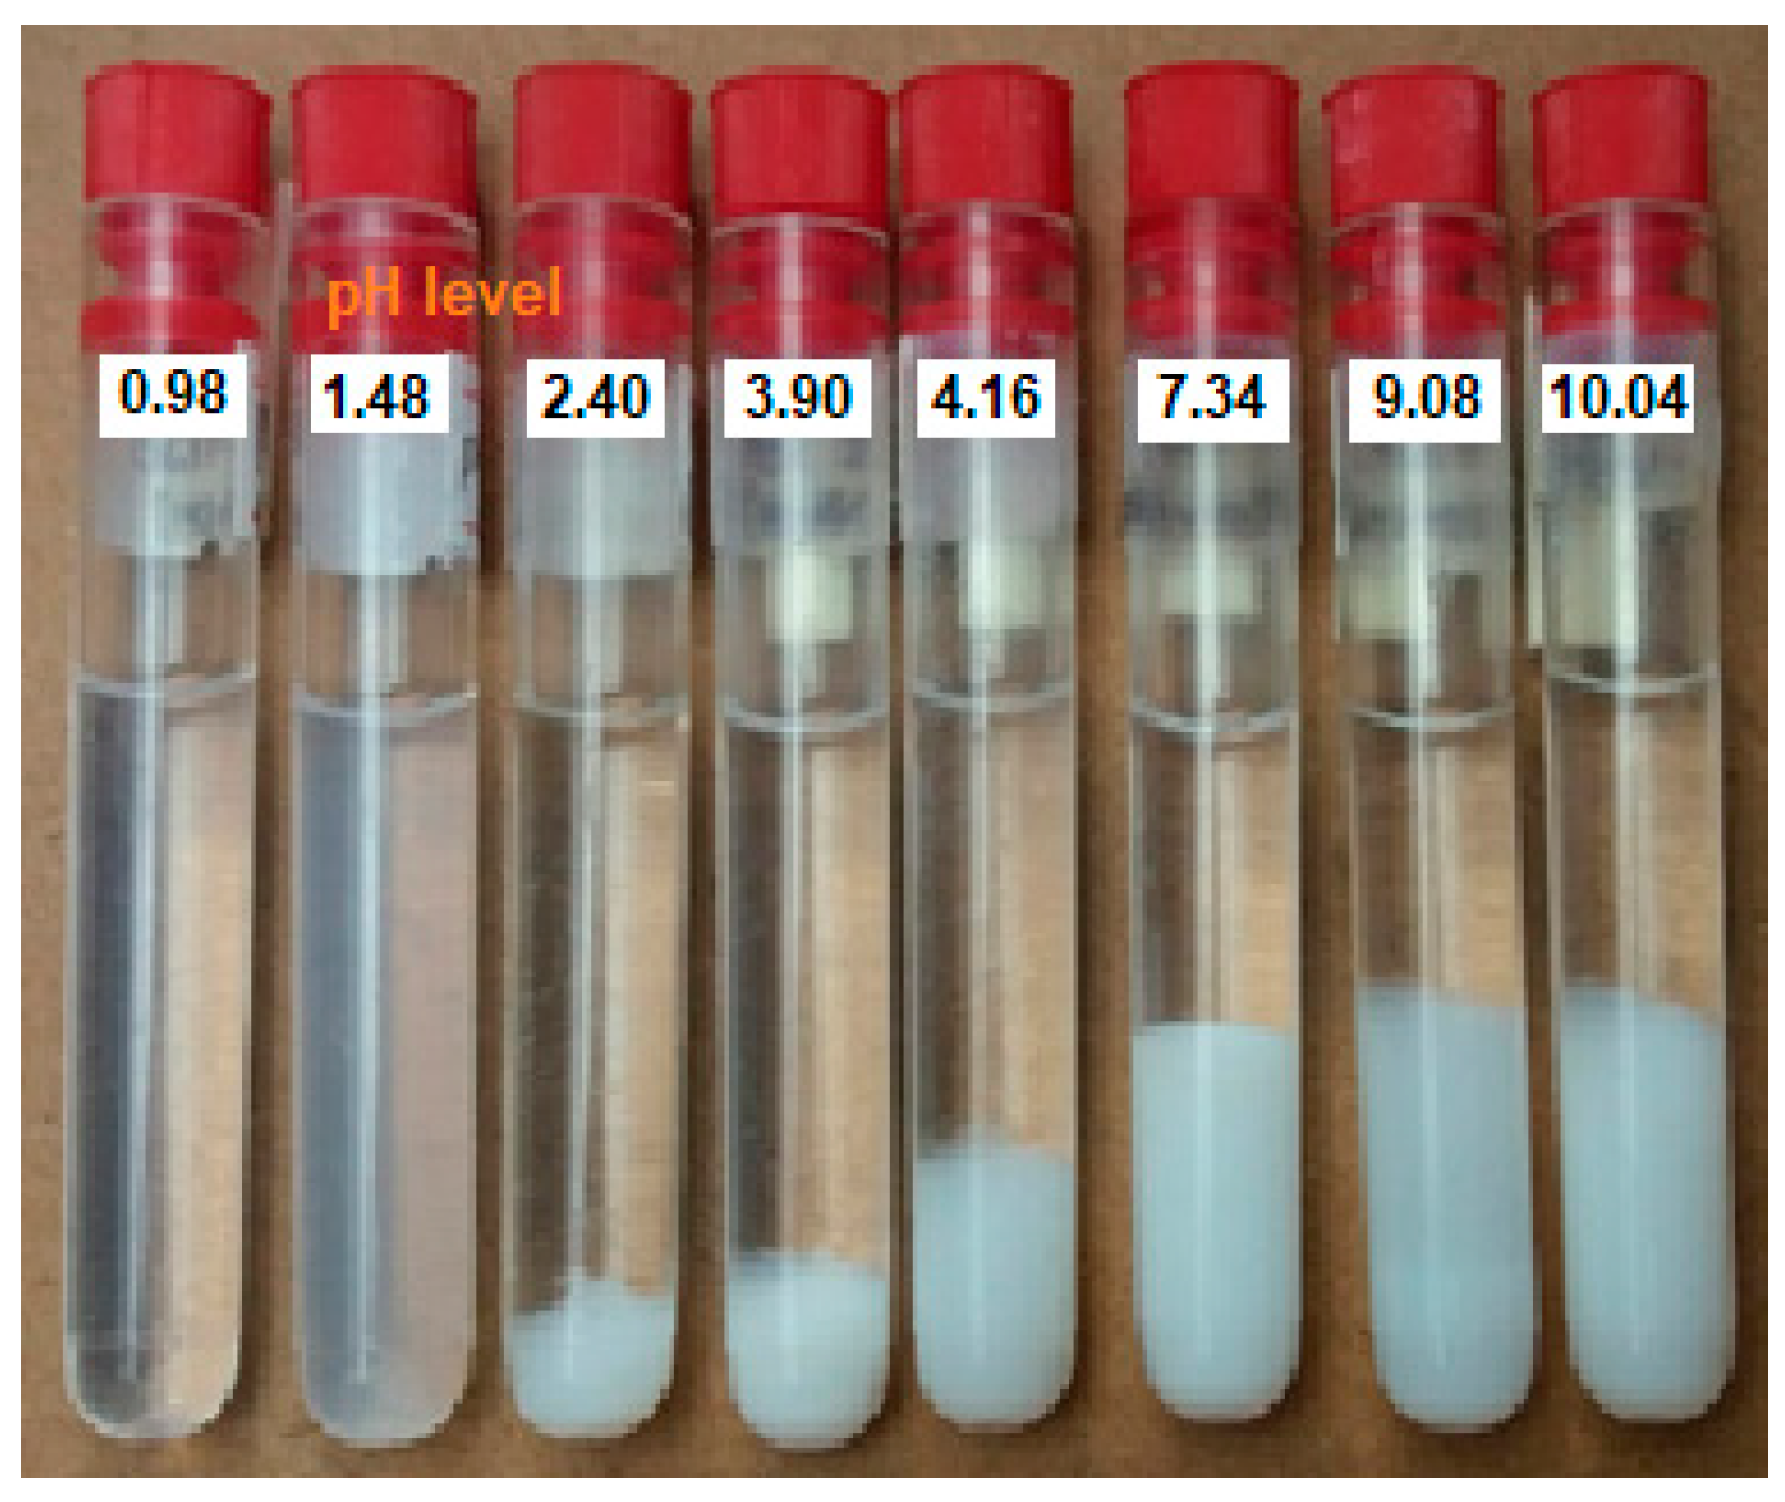
2 nanostructures in the resulting materials. As seen in
Figure 1, the resulting aqueous solution appears transparent at a low pH level but gradually changes to slightly opalescent, and then separates into transparent and milky parts when the pH level exceeds 2.40. The separated milky column increases with NH
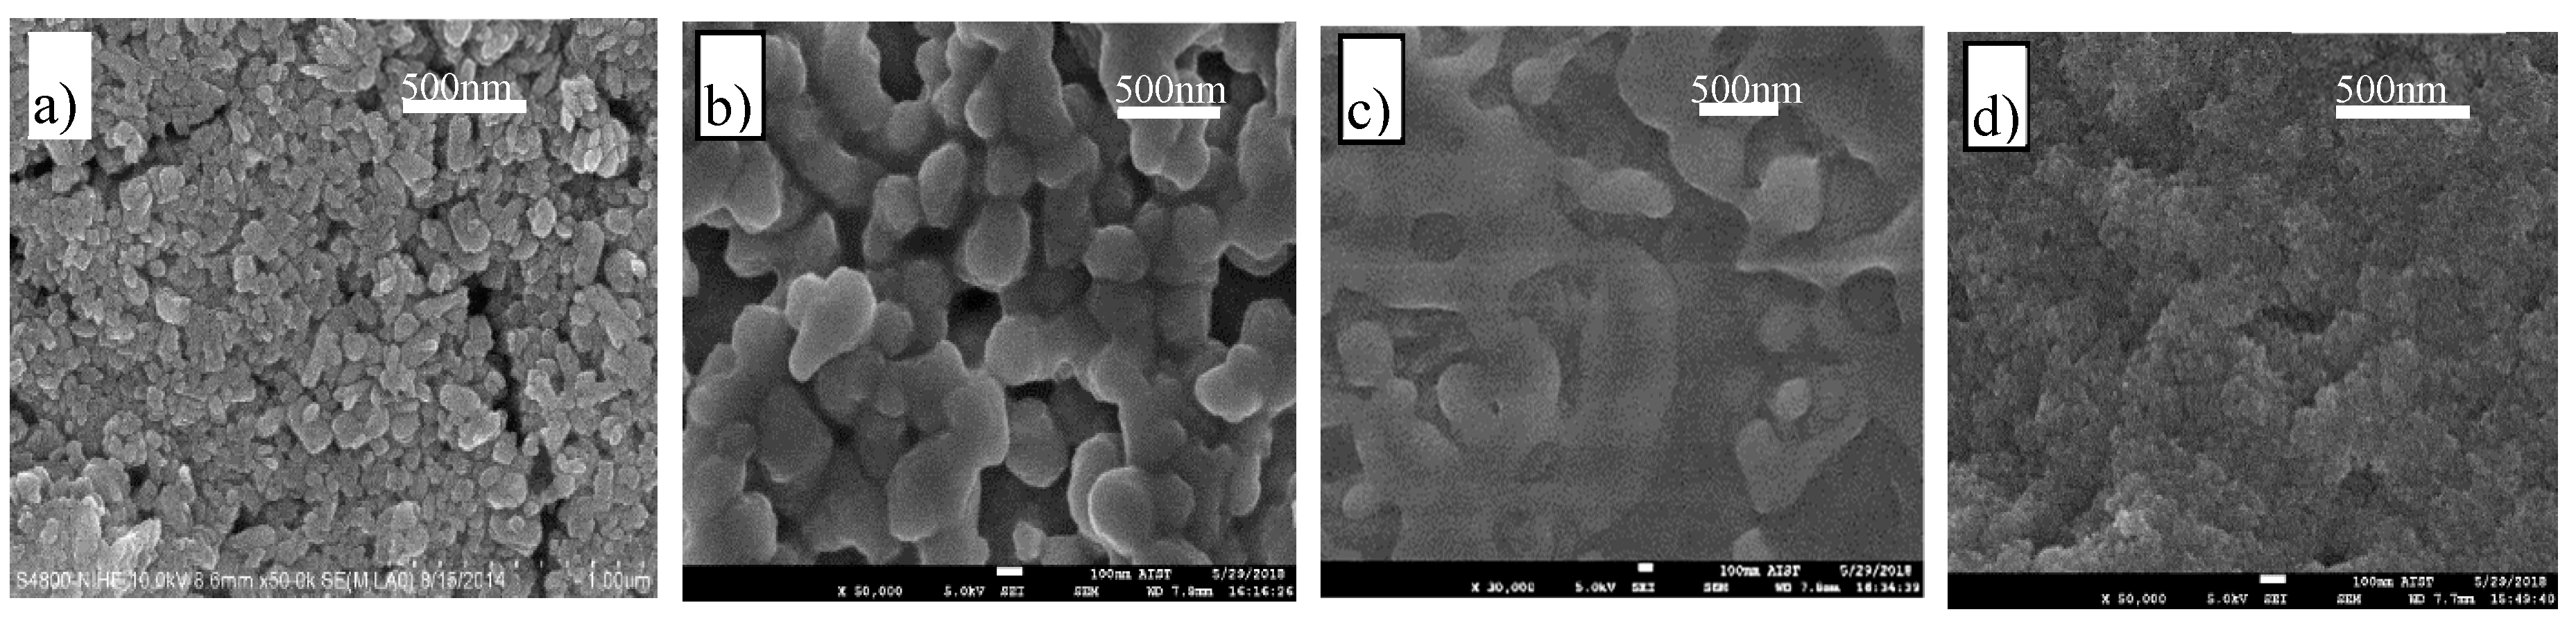
4OH and becomes unchanged as the pH level exceeds 7.34. Depending on the transparent or milky state, the surface morphology of the resulting materials transforms from a grain to a gelation structure as shown in the Scanning Electron Microscope (SEM) images in
Figure 2. In the sample with a pH of 0.98, the resulting material grains are uniformly granular with a mean size of approximately 50–70 nm, which, in turn, shows clusters of anatase nanoparticles of 4–5 nm in mean size [
20]. However, when the pH level of the reaction medium increases, the resulting material grains inflate to coagulated clusters of 150–200 nm in size and gradually become jellylike or amorphous structures, as shown in
Figure 2b–d.
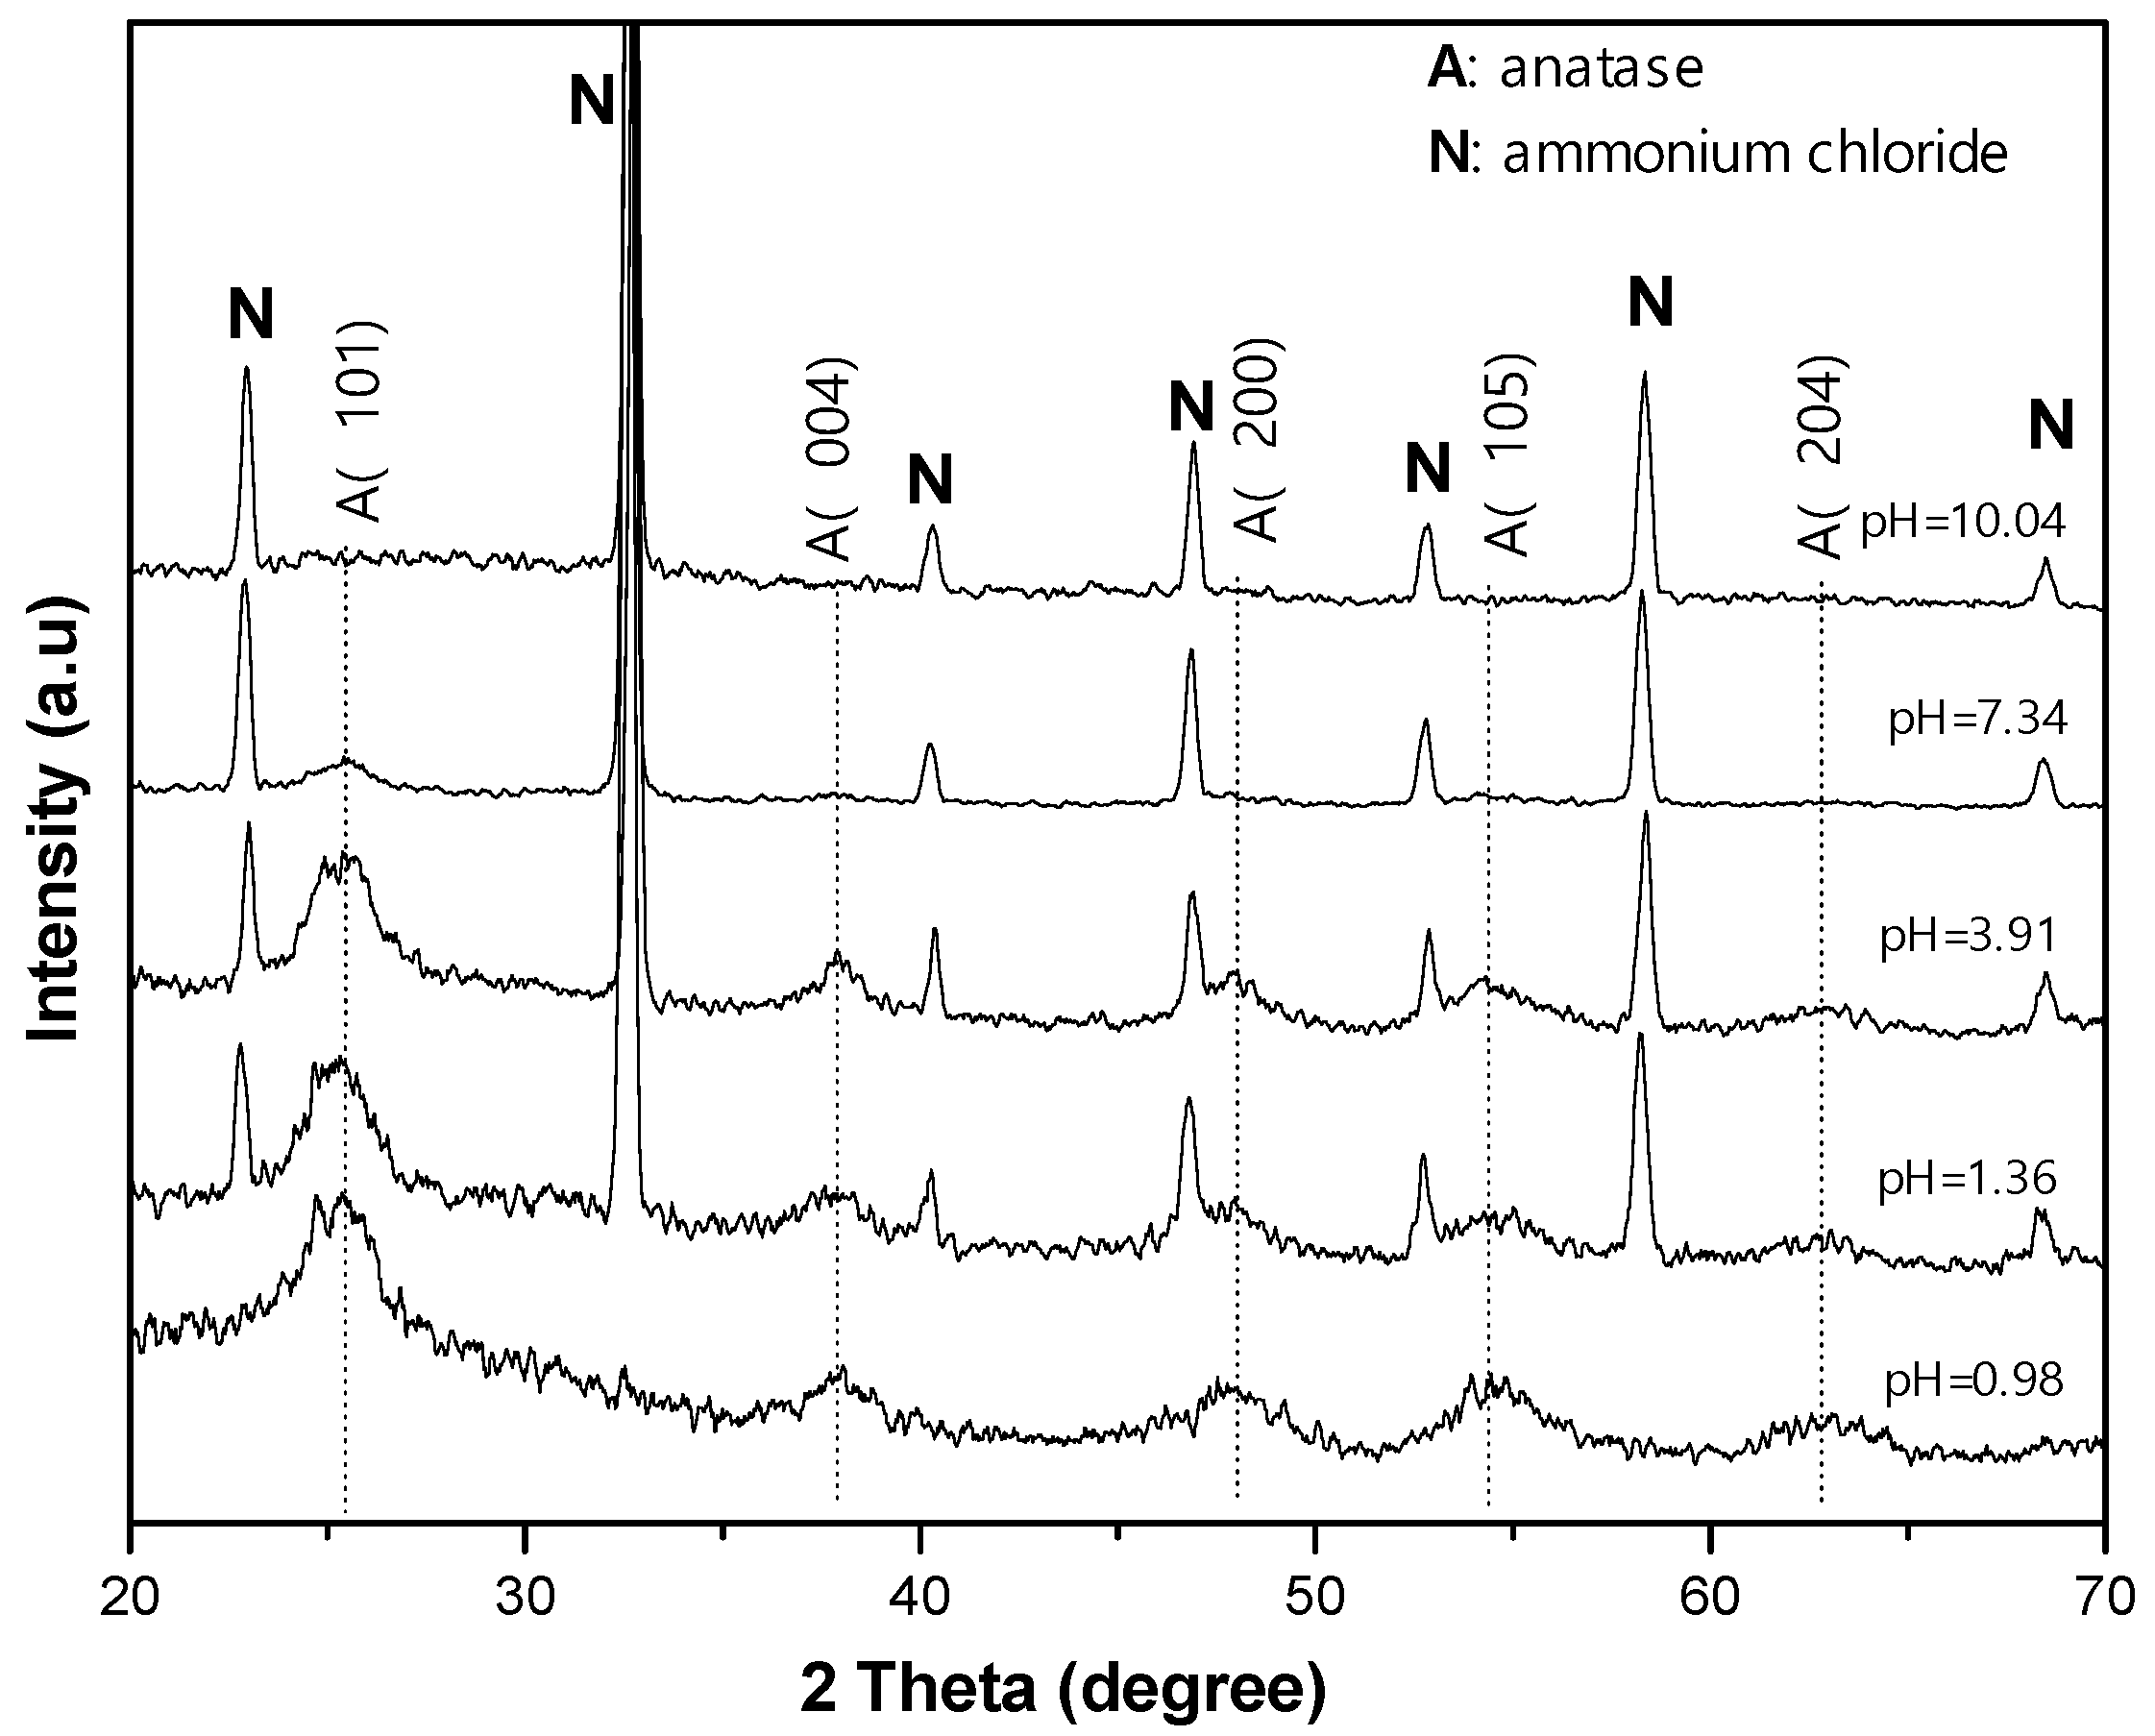
The X-ray diffraction (XRD) spectra in
Figure 3 show the evolution of the resulting materials depending on the pH level, i.e., on NH
4OH additive. In the sample with a pH level of 0.98, the XRD pattern contains a principal peak at approximately 25.29° and the other peaks at approximately 37.80°, 48.05°, 53.89°, and 62.68°, assigned to the diffractions of the anatase structure on the (101) and (004), (200), (105), and (204) planes, respectively (JCPDS no. 00-021-1272). When NH
4OH was added, together with the diffraction peaks from anatase, other sharp diffraction peaks at 22.98°, 32.69°, 40.31°, 46.88°, 52.80°, 58.29°, and 68.43° were observed for the diffractions on the (100), (110), (111), (200), (210), (211), and (220) planes, respectively, with crystals emerging from NH
4Cl [
23]. With the increase in pH level, the TiO
2 diffraction in the XRD pattern gradually disappeared, accounting for the gradual conversion from TiO
2 anatase to amorphous TiO
2 complexes. Using the Scherrer equation, i.e., D = kλ/βcosθ, where k = 0.94, λ = 0.154 nm, and β is full width at half maximum (FWHM) at diffraction angle θ according to (101) peak, to calculate the mean size D of the anatase particles, it was found that the mean sizes of the anatase particles were almost unchanged at approximately 4.5 nm, as given in
Table 1. This value is considered to be the limitation of anatase size in the conversion to amorphous TiO
2 complexes.
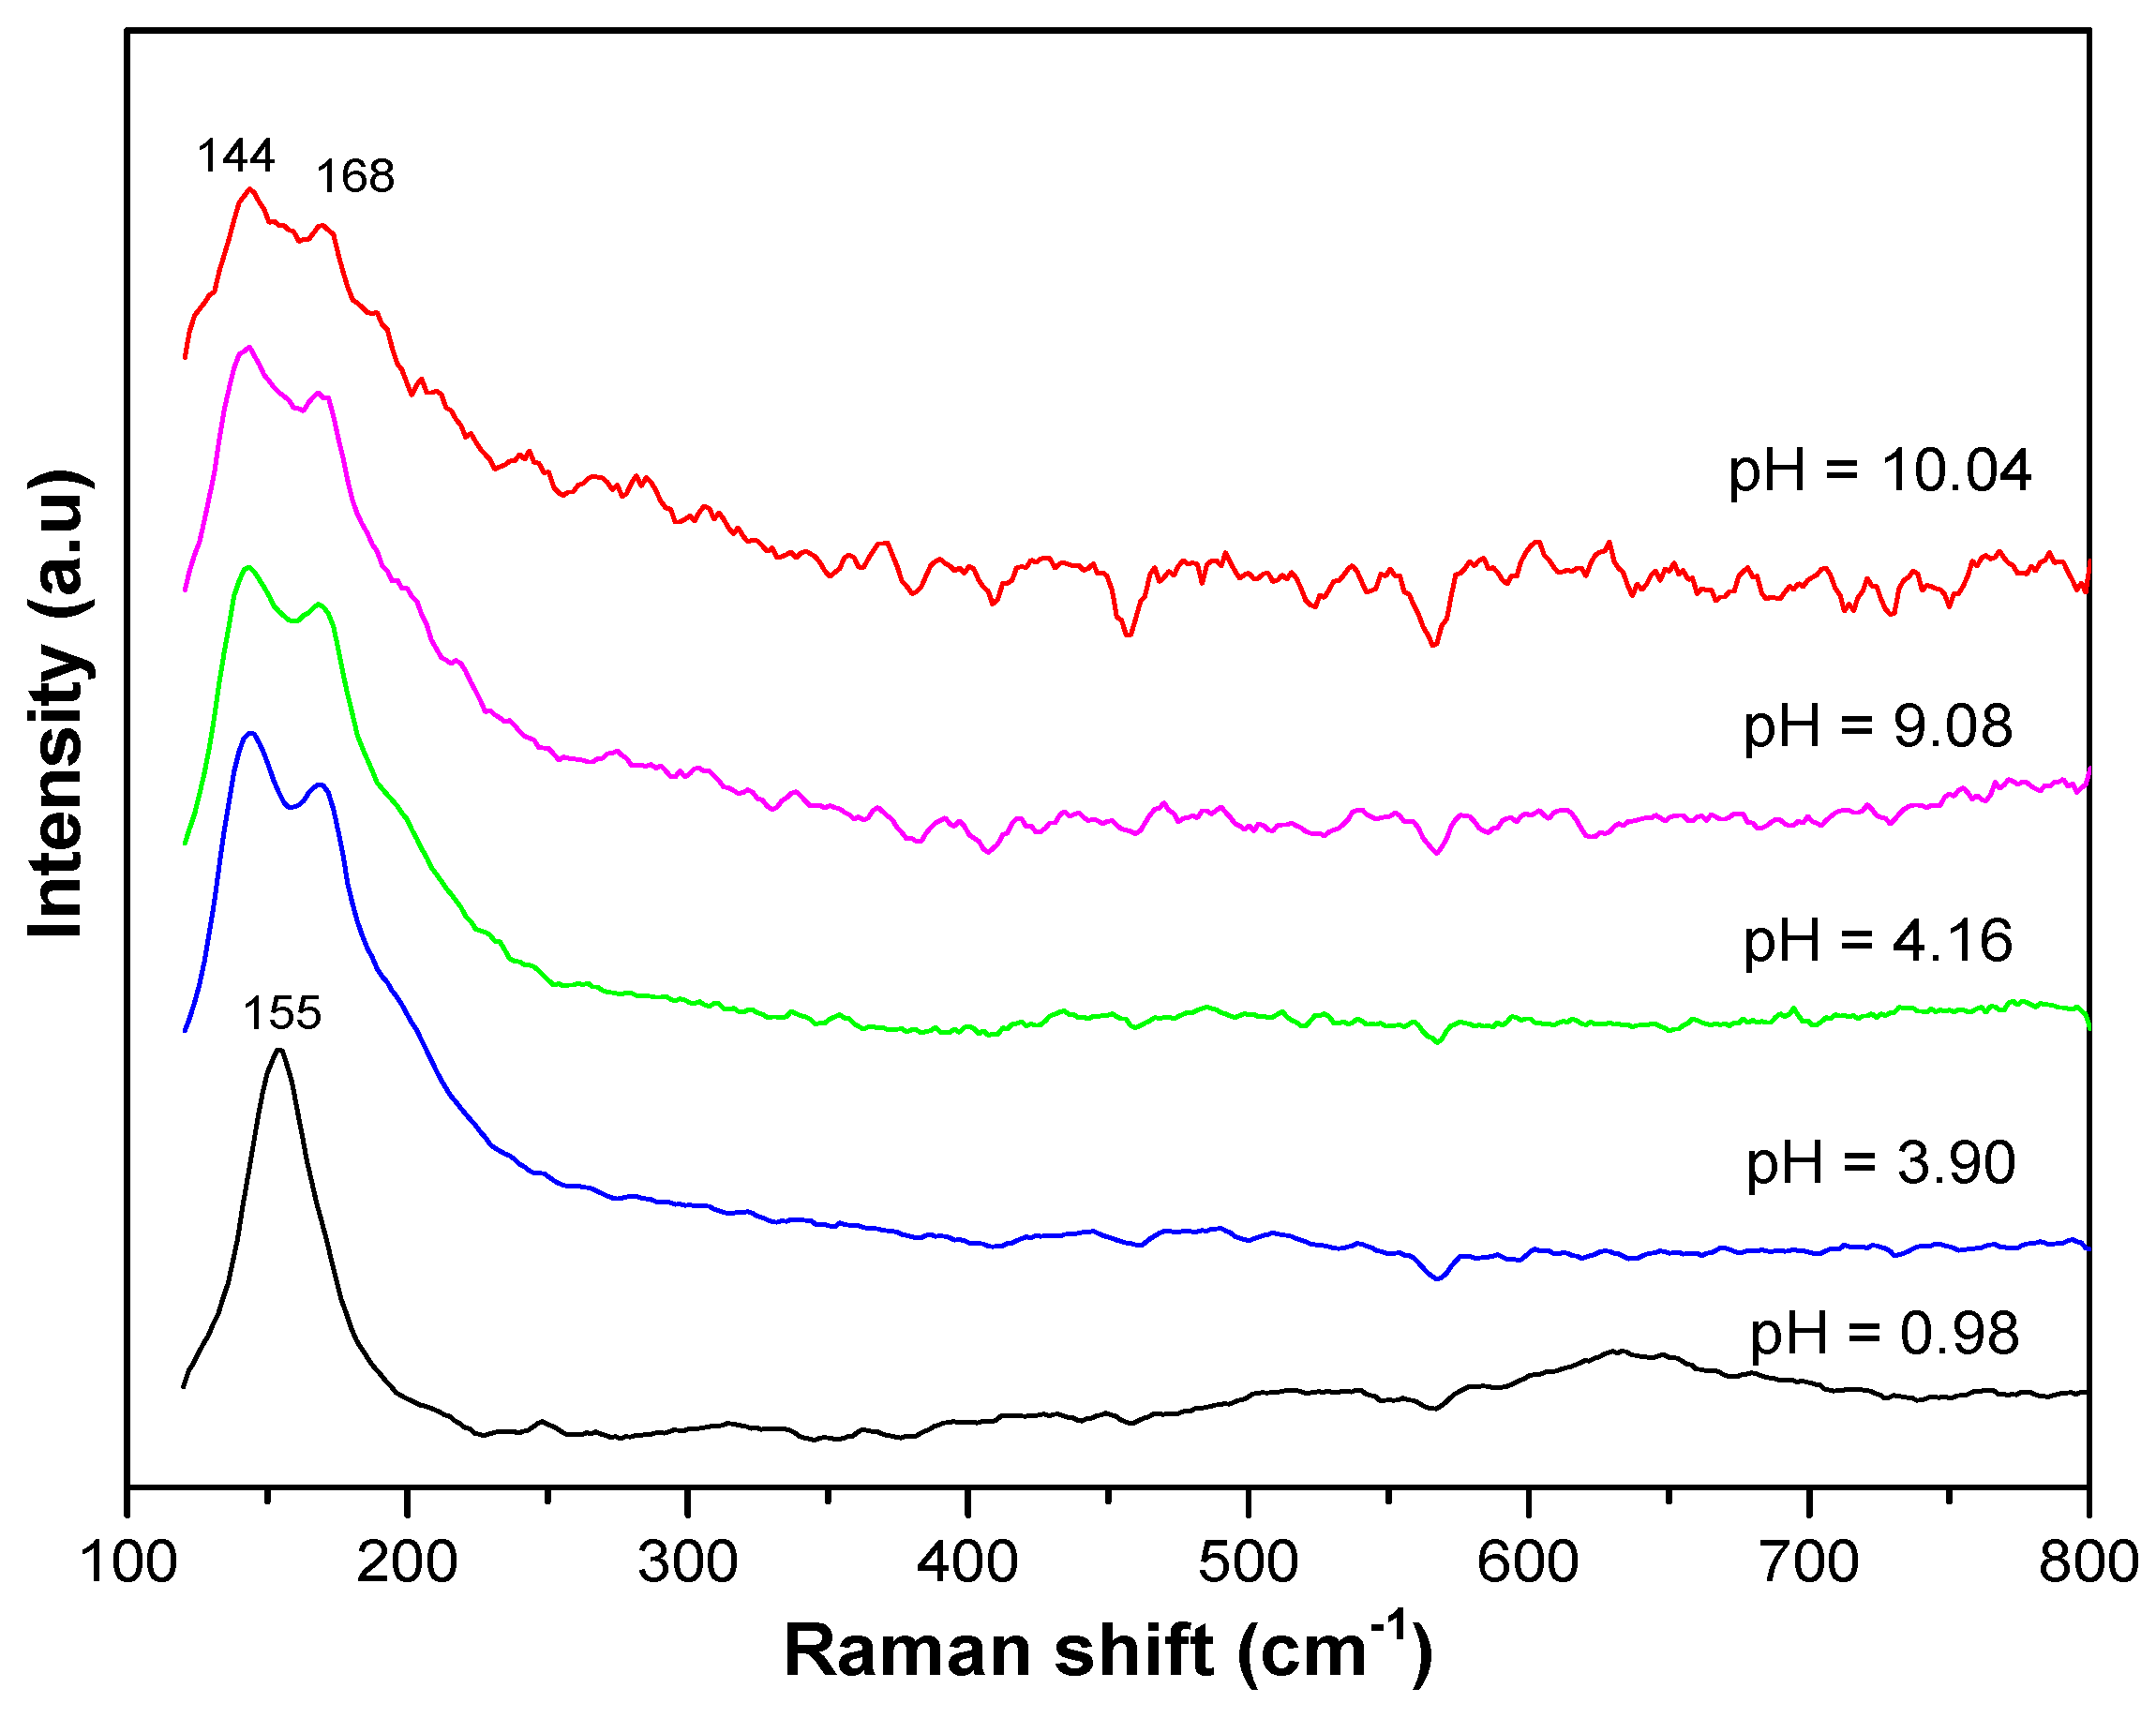
The Raman spectra also confirm the presence of anatase and NH
4Cl in the resulting materials. As shown in
Figure 4, in the starting materials, namely, the sample with a pH level of 0.98, the spectrum exhibits only vibrational modes at approximately 155 cm
−1, 399 cm
−1, 513 cm
−1, and 634 cm
−1, respectively, representing the E
g, B
1g, A
1g + B
1g, and E
g modes of the anatase structure [
24,
25]. The presence of NH
4Cl in the materials gives rise to a broad saddle spectrum consisting of two vibration modes at approximately 168 cm
−1 and 144 cm
−1 that are assumed to be the supposition of the E
g vibration mode of anatase and the ν
2, ν
3, and ν
4 vibration modes of NH
4Cl oscillating against Cl along the (100) direction and along three orthogonal directions [
26].
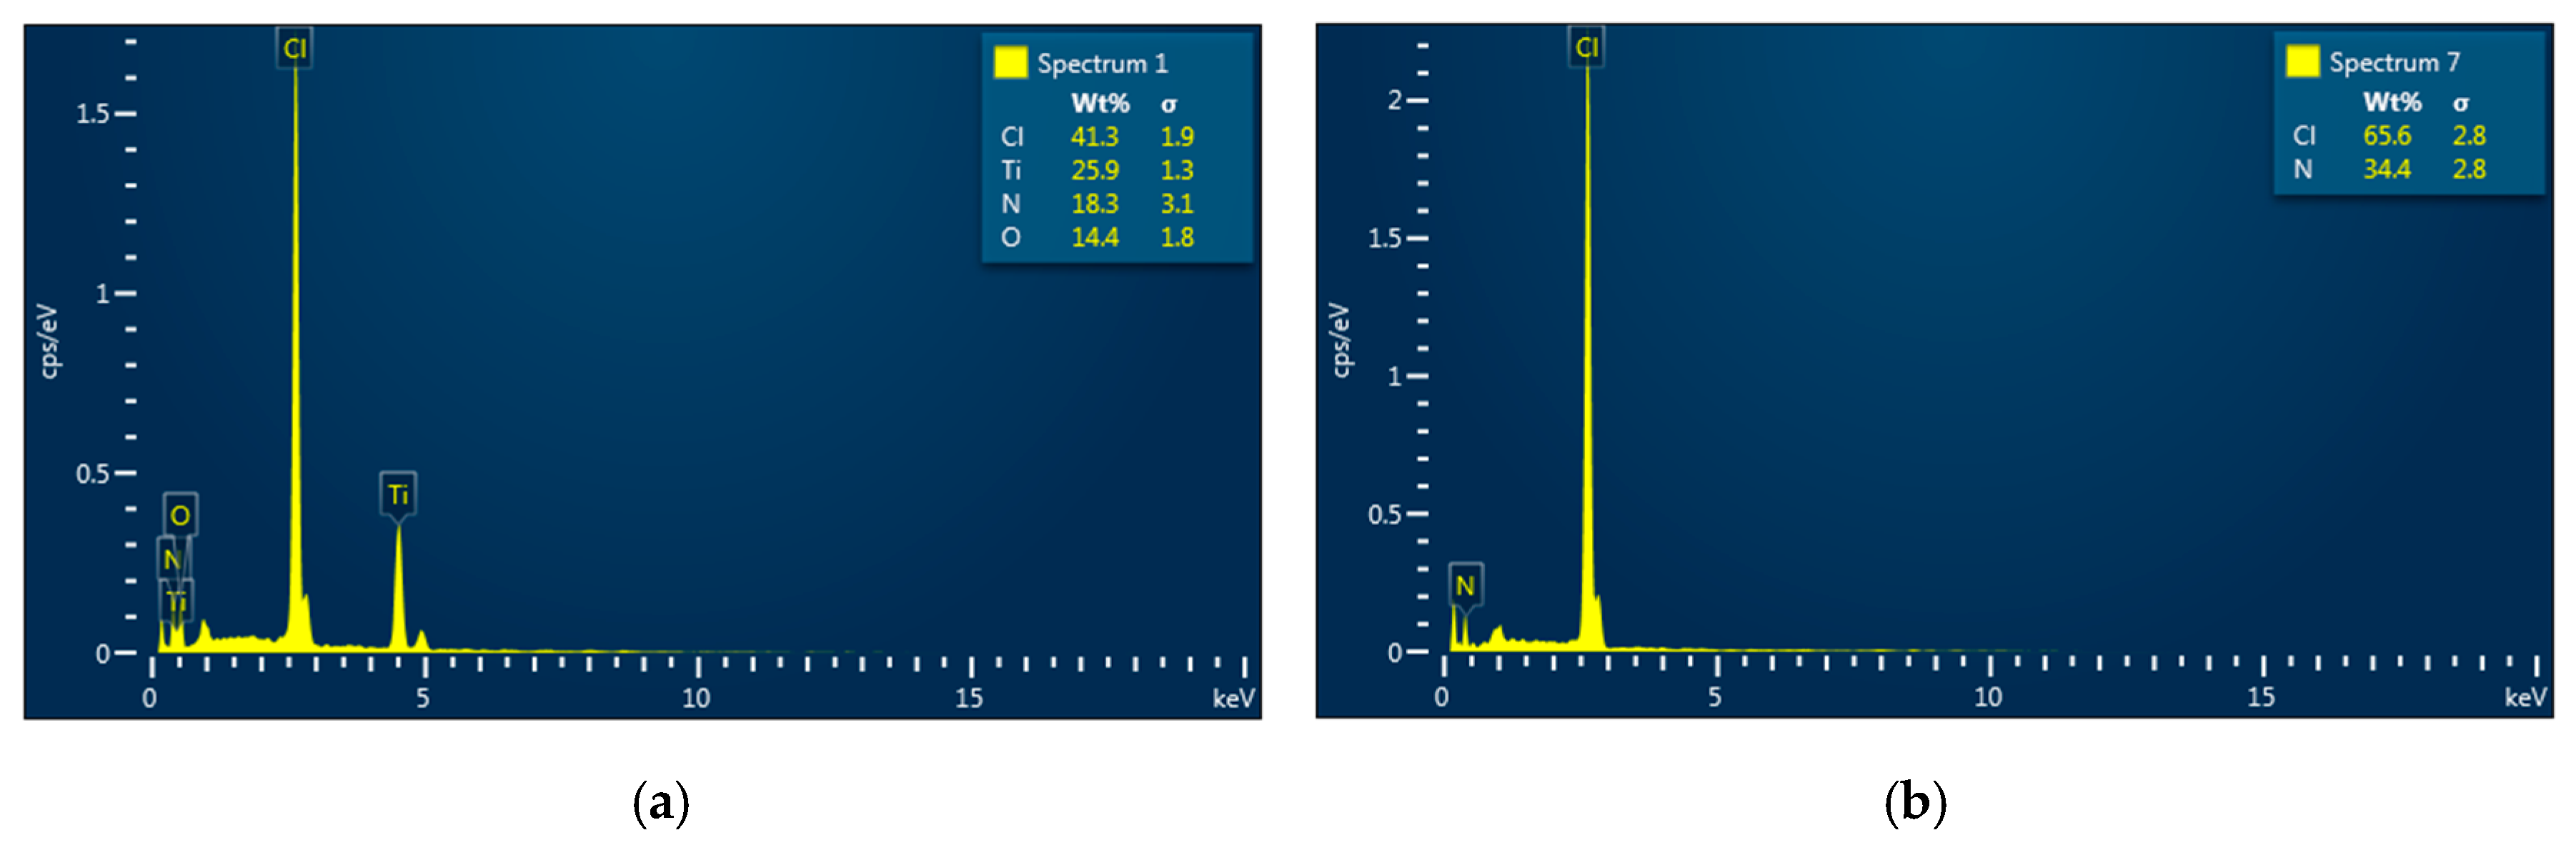
The appearance of transparent, opalescent, and separable milky parts in the solution is believed to be due to the appearance and increase of amorphous TiO
2 complexes forming in the pyrolysis medium. At a low pH level, in the acidic aqueous medium with a higher concentration of H and Cl radicals, the formation of amorphous TiO
2 complexes is negligible; the resulting anatase is crystallized in the form of grain structures with sharp boundaries. The presence of NH
4OH in the pyrolysis medium raises the pH level and then the OH radicals that promote the formation of amorphous TiO
2 complexes. Consequently, with the increase in NH
4OH additive, the separated milky fraction in the medium is gradually increased, in agreement with the gradual decrease of anatase diffraction in the XRD spectra. When the pH level exceeds 7.34, the milky column is unchanged, even though the NH
4OH additive keeps increasing. Furthermore, the Energy Dispersive X-ray Spectra (EDS) show that no trace of Ti is present in the transparent part but is in the milky part, as shown in
Figure 5. This indirectly indicates that the decomposed TiCl
4 precursor in the pyrolysis solution was totally converted into amorphous TiO
2 complexes and completely separated into the milky part as the pH level exceeded 7.34. Due to the amorphous nature, no crystalline diffraction pattern can be observed in XRD spectra as the materials were synthesized in the medium with the pH level beyond that point.
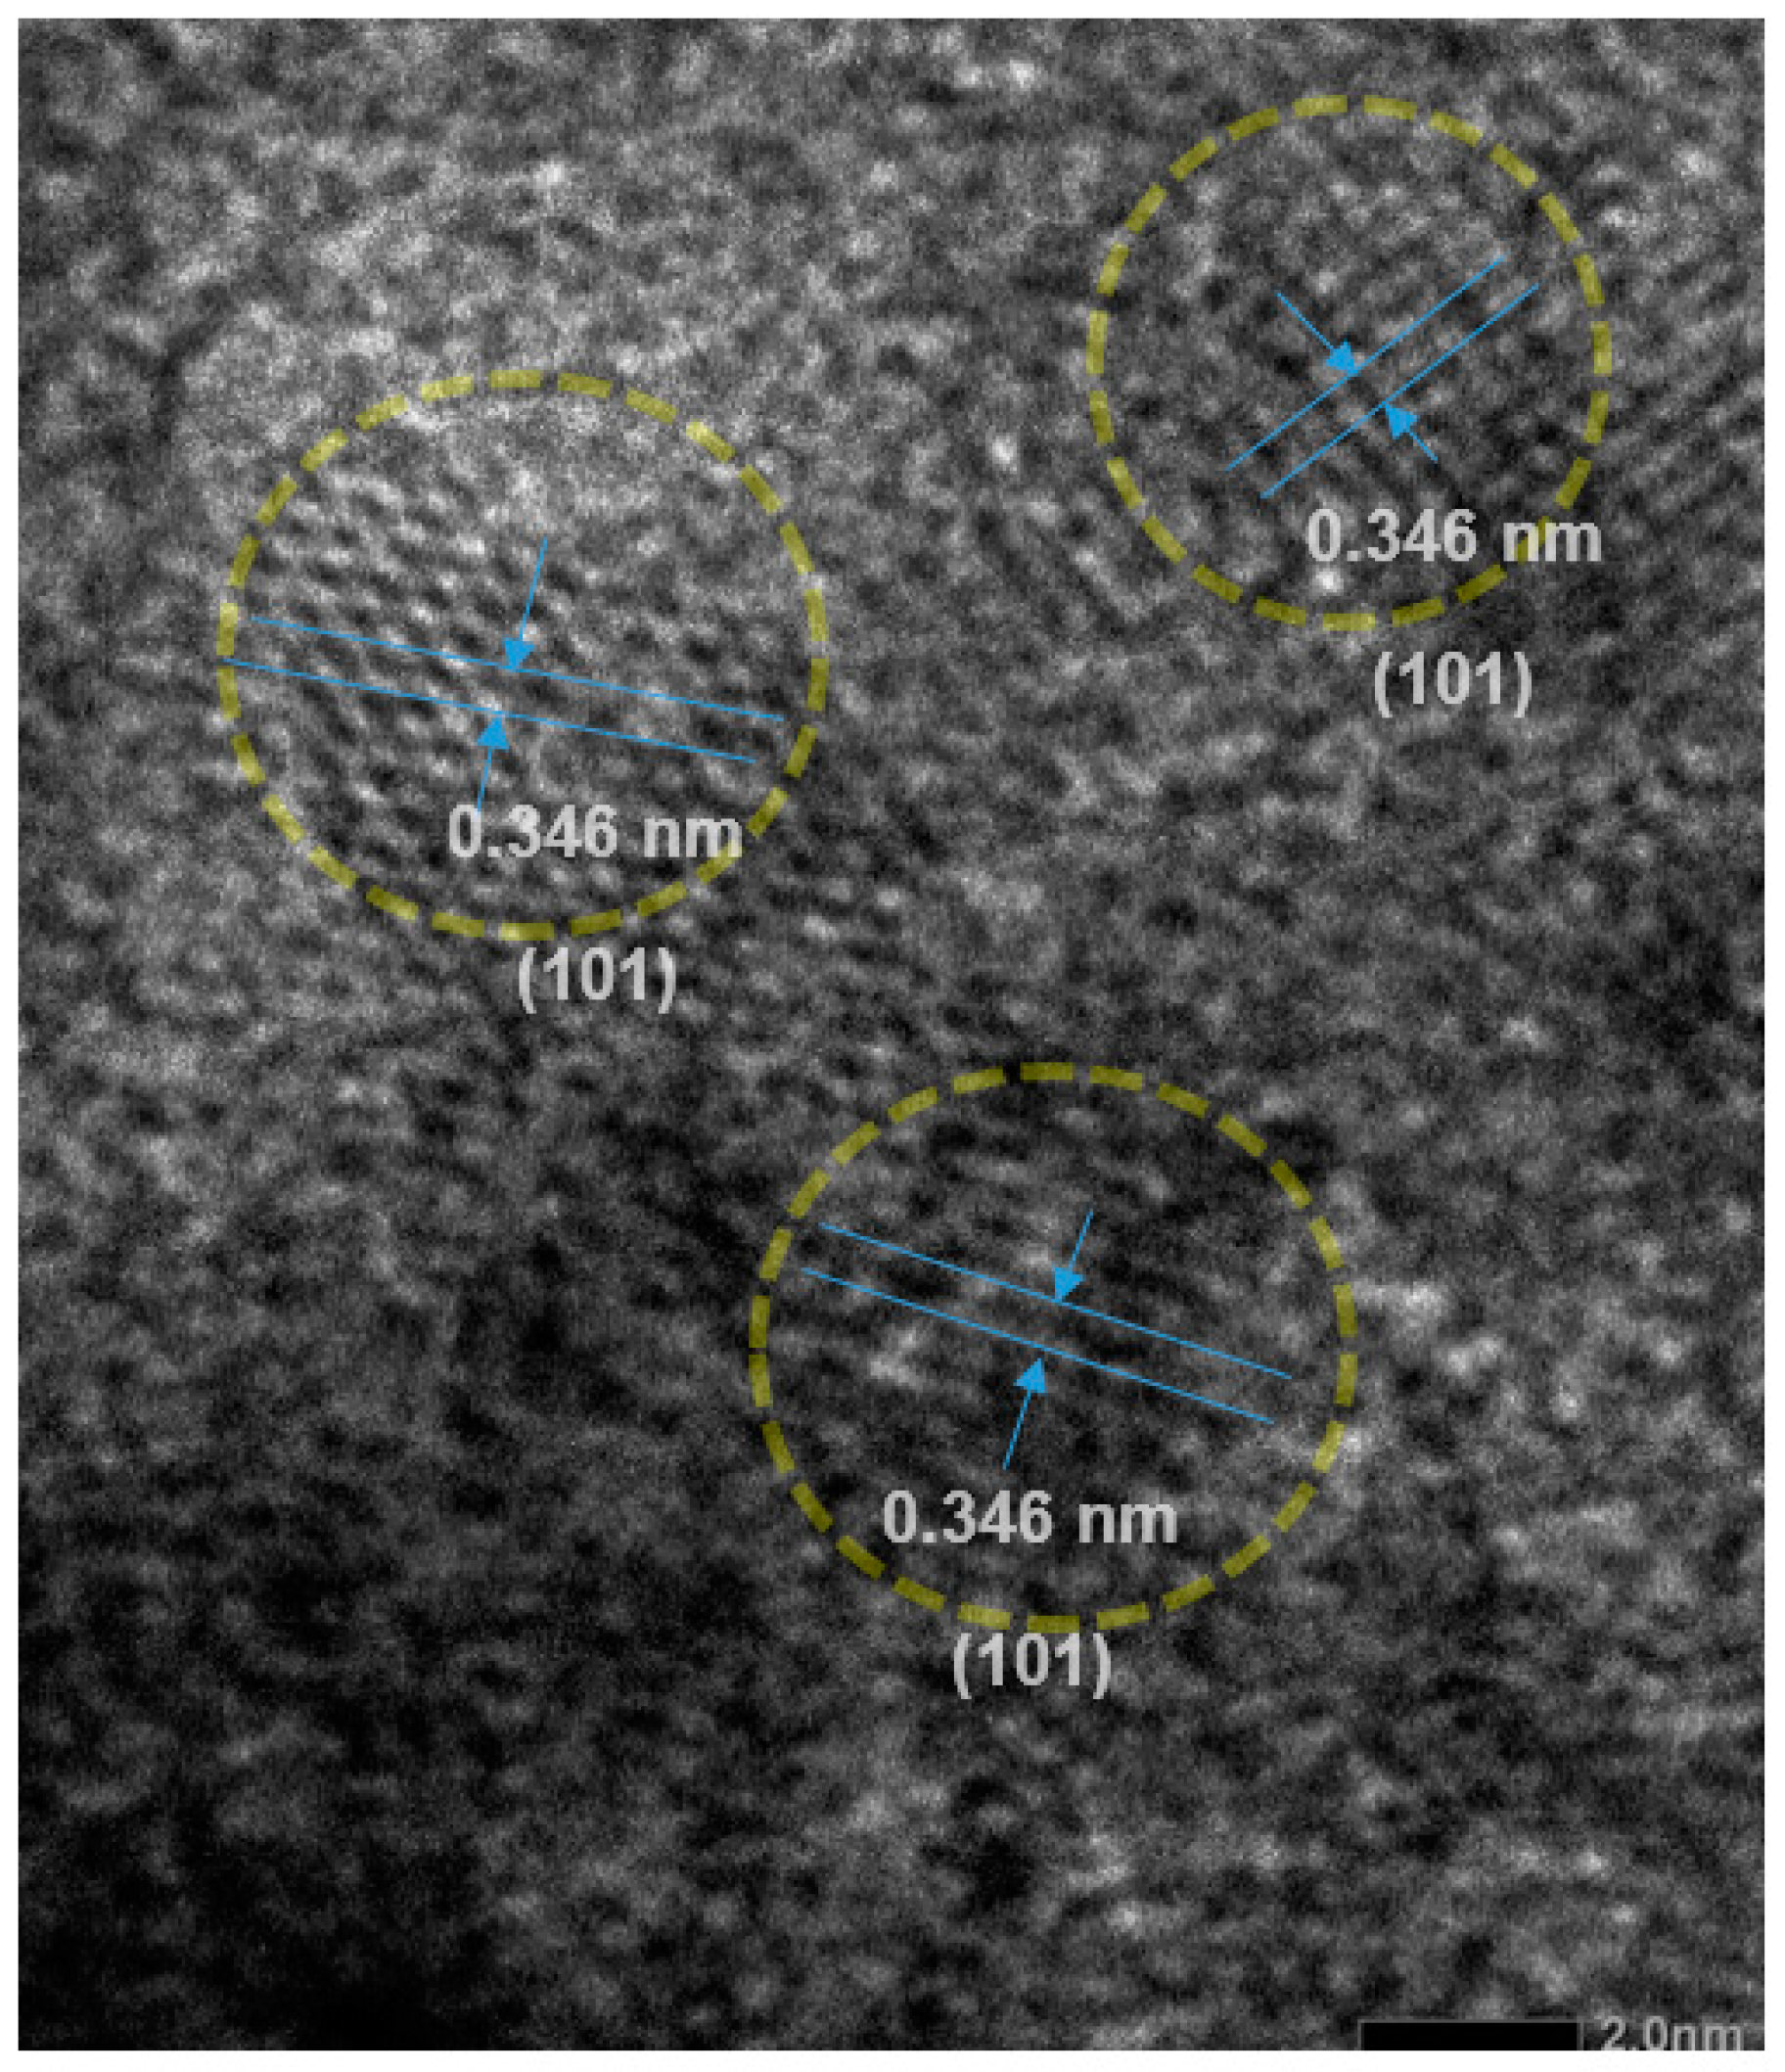
A High-resolution Transmission Electron Microscope (HRTEM) image taken from a milky sample with a pH level of 10.04, as given in
Figure 6, shows the appearance of tiny nanocrystallites scatteringly embedded in an amorphous medium. The amorphous medium surrounding the materials is considered to be the TiO
2 complexes. The lattice spacing of the tiny nanocrystallites at approximately 0.346 nm is identical to the lattice spacing of the (101) plane of TiO
2 anatase. The estimated size of the TiO
2 anatase particles is comparable to that calculated from the XRD pattern, approximately 4.5 nm, which is considered to be the size limitation of anatase in equilibrium with amorphous TiO
2 complexes. The presence of anatase nanoparticles embedded in the amorphous TiO
2 complexes elucidates the appearance of the E
g vibration mode of anatase in the Raman spectra in
Figure 4.
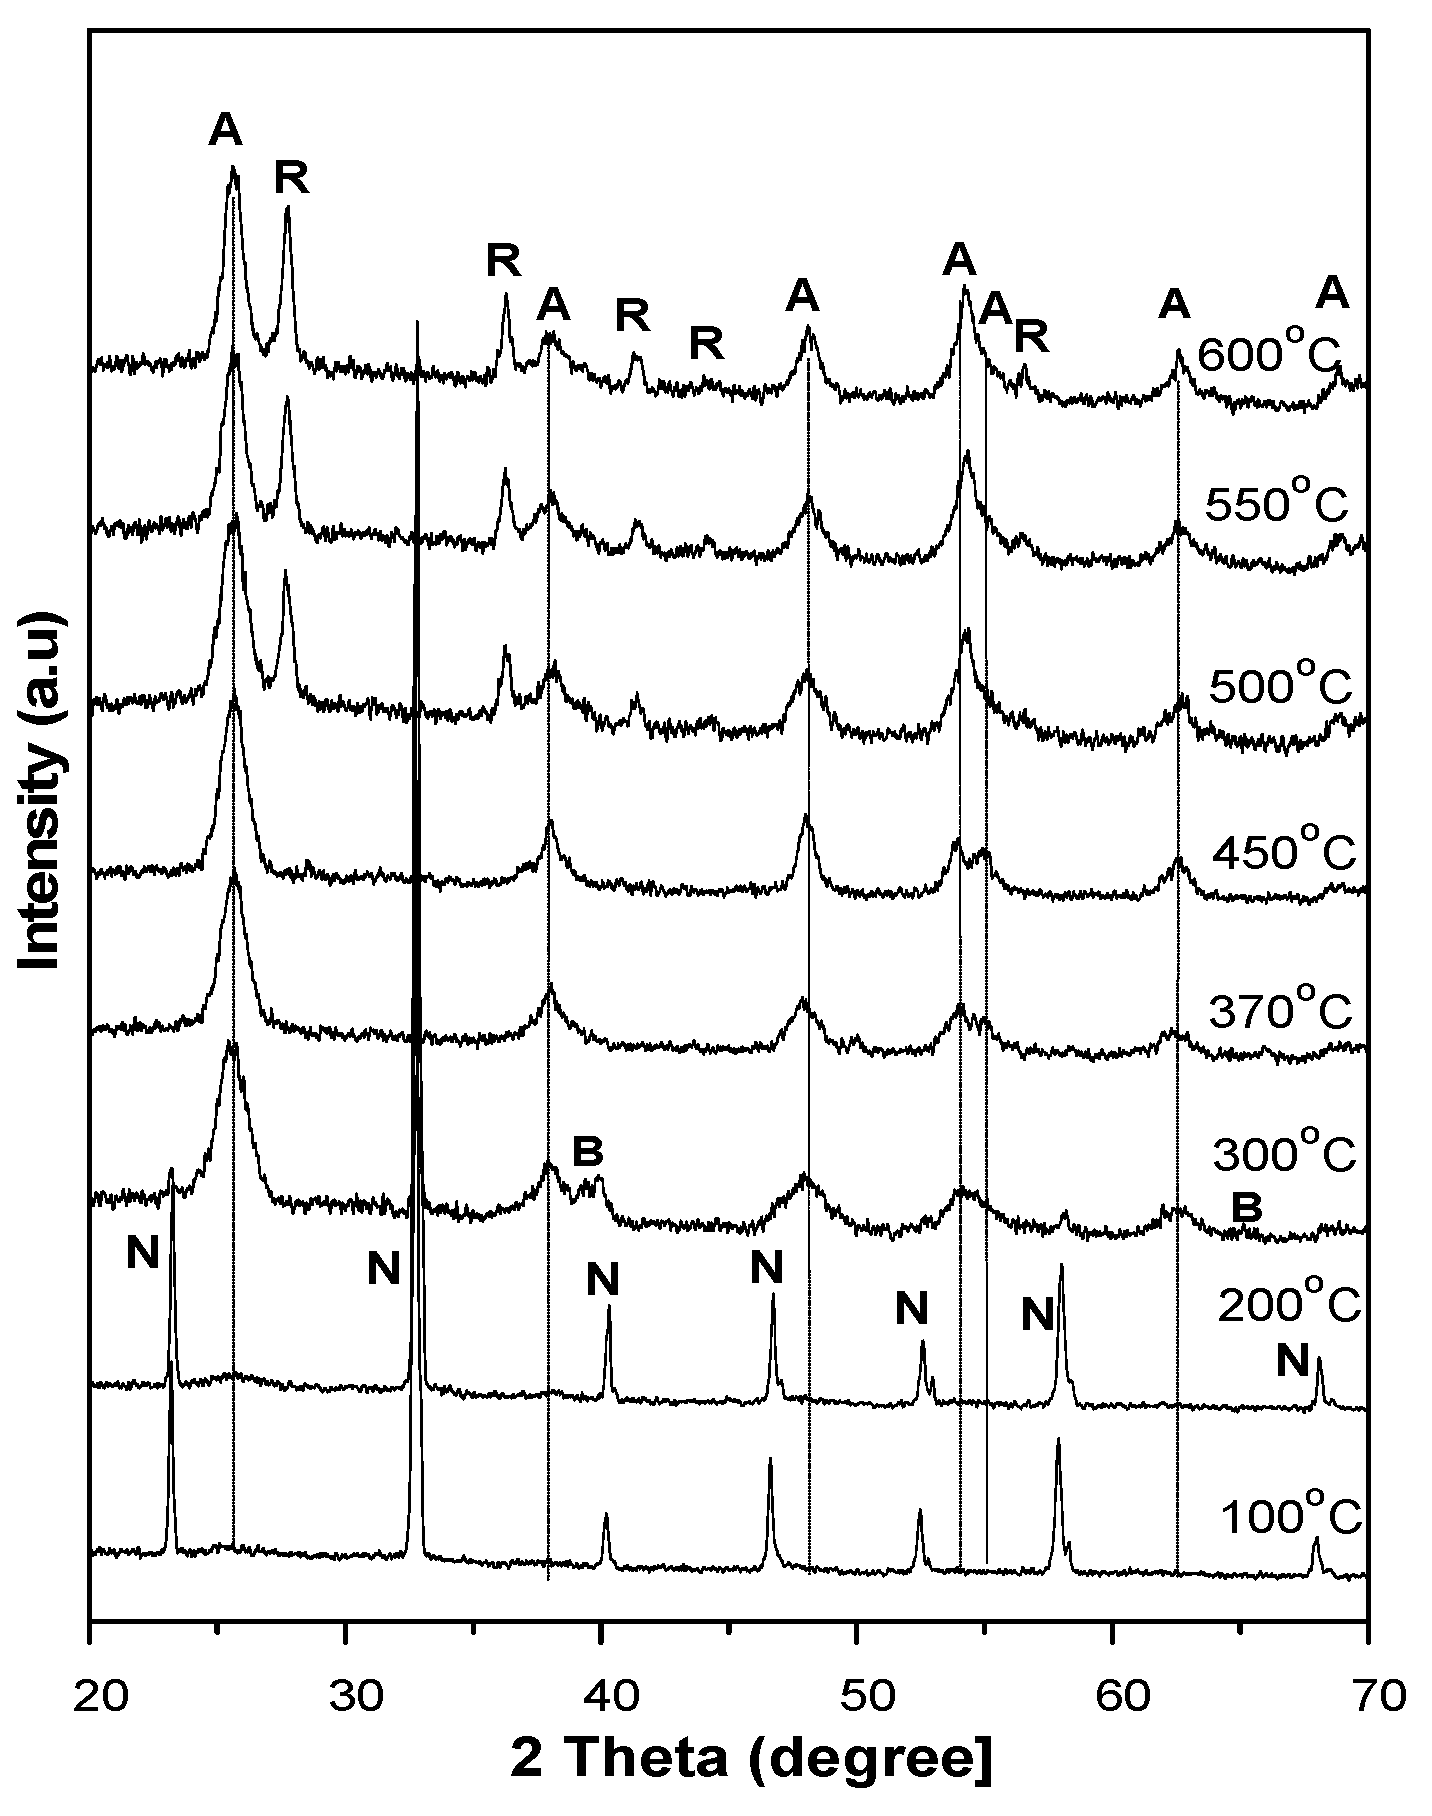
In order to further characterize the evolution of the amorphous TiO
2 complexes into the other crystalline forms, a post-heating treatment was made at an elevated temperature of up to 600 °C. The experiments reveal that the materials underwent a conversion back to anatase and then from anatase to rutile. At a heating temperature below 200 °C, the XRD pattern in
Figure 7 shows only the presence of NH
4Cl but no trace of TiO
2 structures. However, when the heating temperature exceeds 200 °C, anatase diffraction gradually emerges while NH
4Cl diffraction gradually disappears in the XRD patterns. The disappearance of NH
4Cl is accounted for by the decomposition of the materials, while the appearance of TiO
2 anatase explains the decomposition and recrystallization of amorphous TiO
2 complexes at an elevated temperature. When the heating temperature exceeds 300 °C, the NH
4Cl is completely decomposed and the complexes are totally converted into TiO
2 nanostructures that are predominantly anatase. Brookite and rutile structures are hardly observed in the XRD patterns and can be neglected in the conversion process. When the heating temperature exceeds 450 °C, the appearance of rutile diffraction in the XRD patterns indicates the onset of the anatase–rutile transition. The mean size of anatase calculated from the XRD patterns was found to grow from approximately 4.5 nm at a heating temperature of 200 °C to 8.9 nm at a heating temperature of 600 °C, as given in
Table 2. For the sample with a pH level of 0.98, anatase is predominant over amorphous TiO
2 complexes; the heat treatment is merely a means to enable the separation of anatase nanoparticles from the cluster.
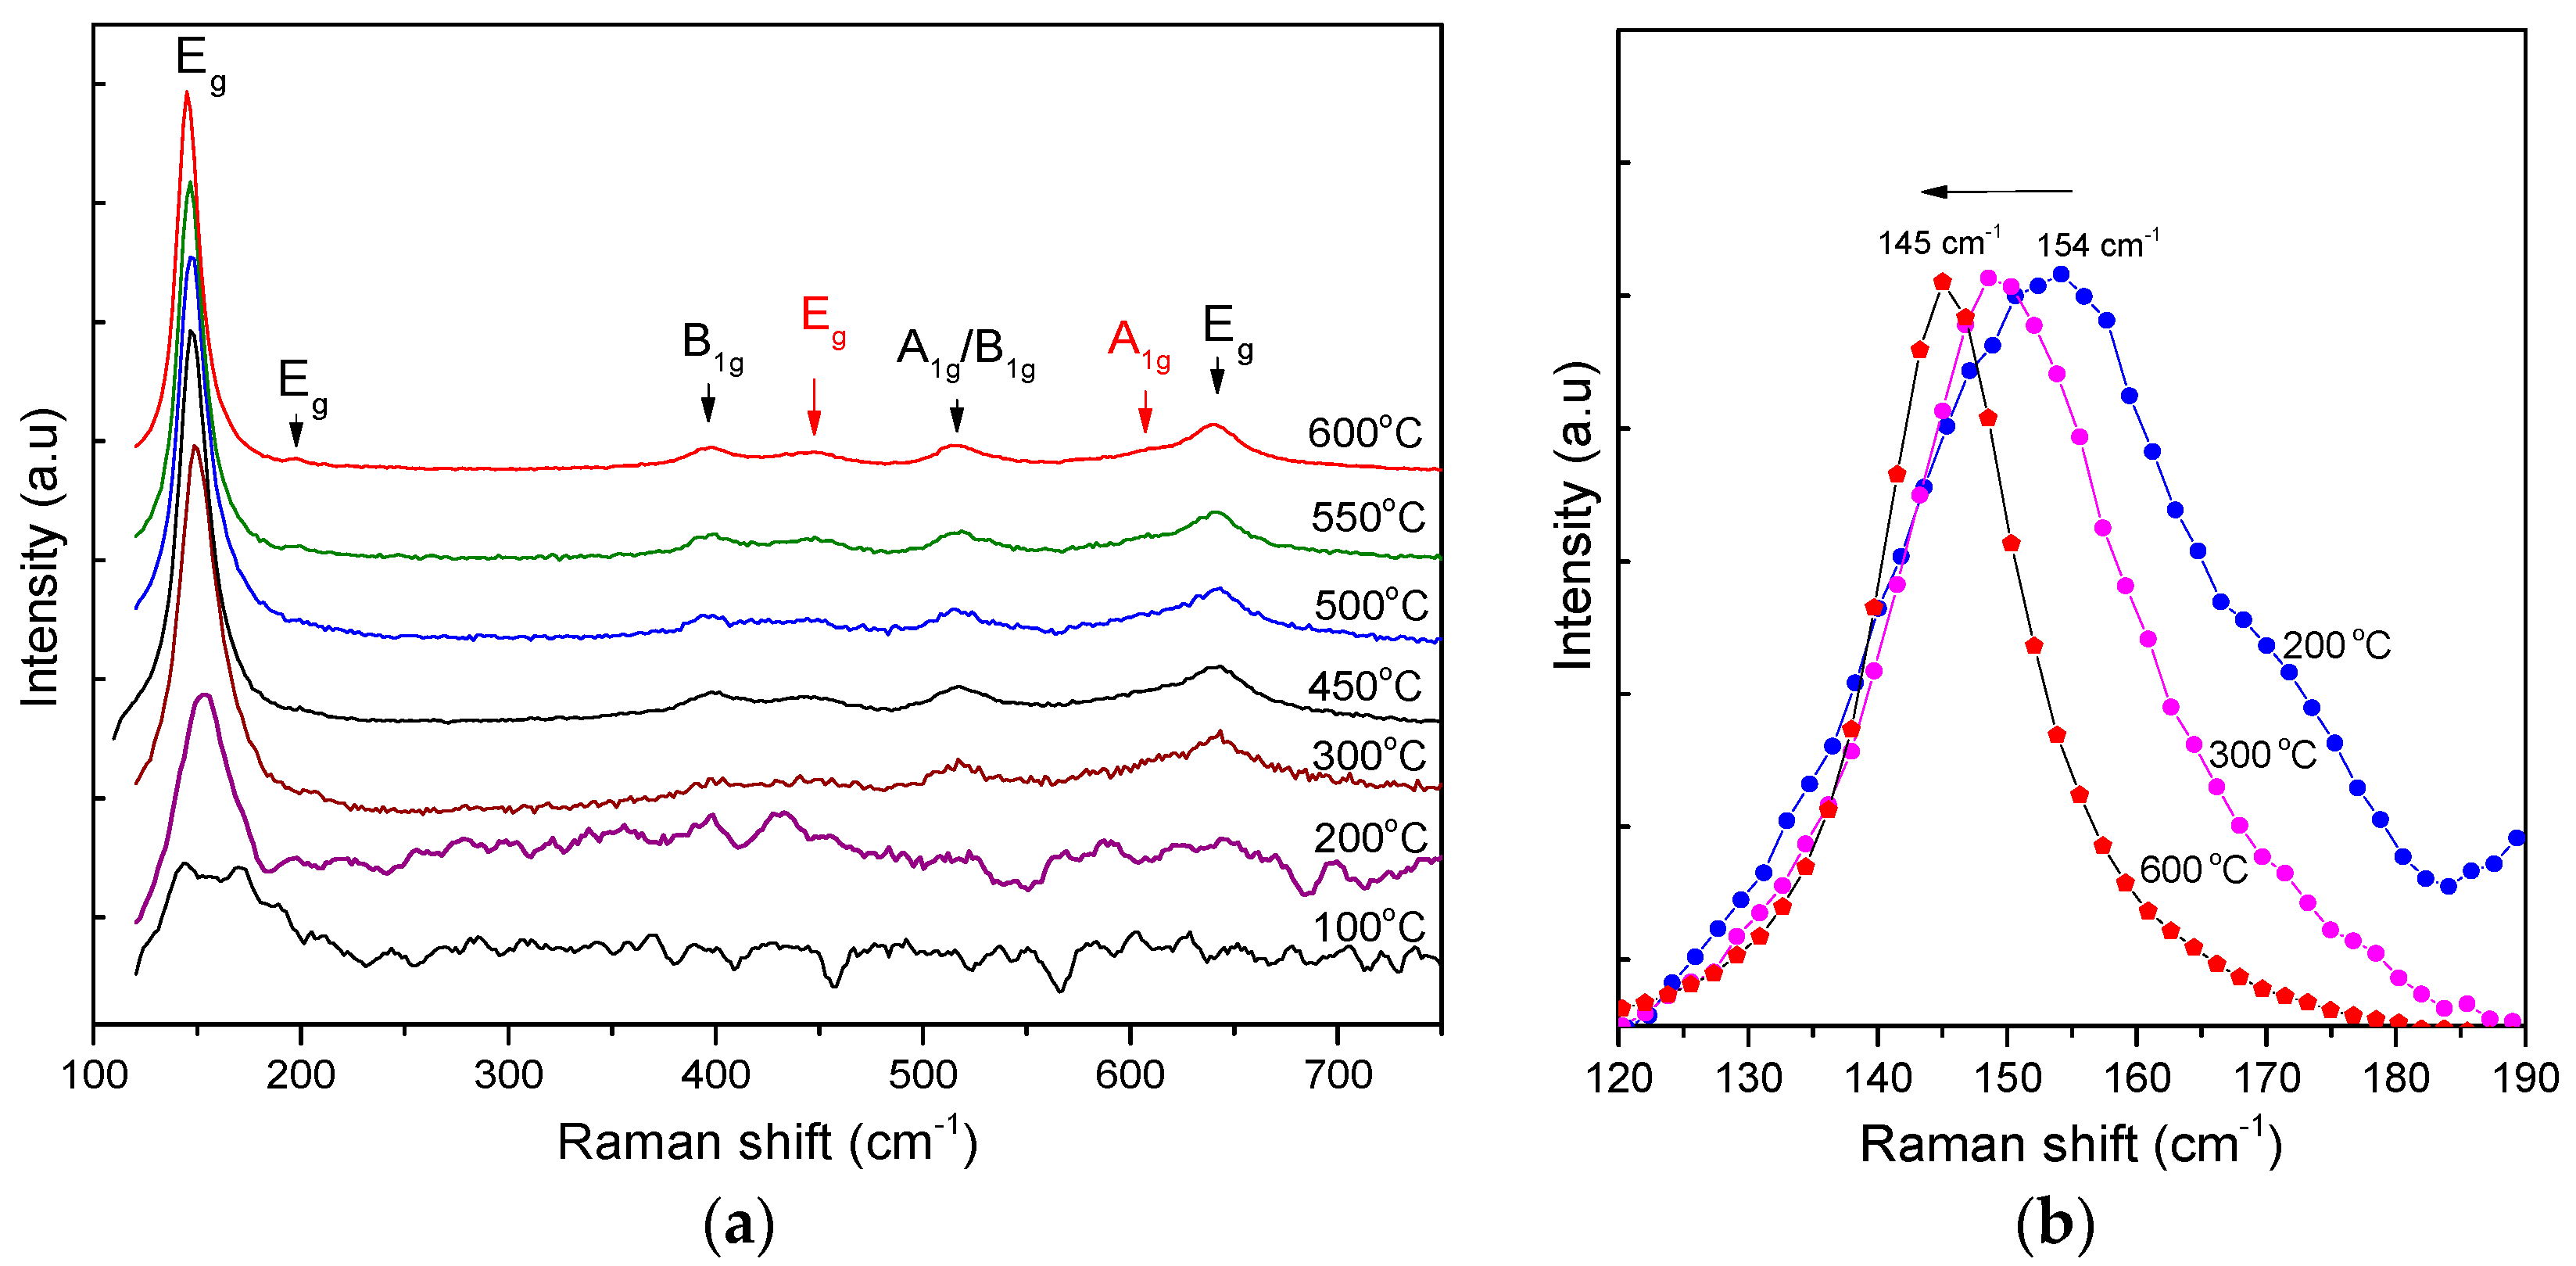
The Raman spectra also verify the conversion of anatase from the amorphous TiO
2 complexes (the milky part) when heated up, as given in
Figure 8. With a heating temperature below 200 °C, the Raman spectrum is a composition of the NH
4Cl vibration mode centered at approximately 168 cm
−1 and 144 cm
−1 and the E
g vibration mode of TiO
2 anatase at 147 cm
−1. As the heating temperature increases from 200 to 600 °C, the E
g vibration mode shows a shift in frequency from 154 to 145 cm
−1 and a shrinkage in FWHM (see
Table 2). This feature accounts for the size growth from 4.5 to 8.9 nm of the TiO
2 anatase nanocrystallites [
27].
The formation of TiO
2 nanostructures by the pyrolysis of TiCl
4 in an elevated pH medium can be explained by two mechanisms; one is the decomposition, dissolution, and recrystallization and the other is the in-situ transition [
20,
28]. At an elevated temperature exceeding 80 °C, TiCl
4 is decomposed and hydrolyzed into HCl and amorphous Ti
xO
yCl
z (or Ti
xO
yCl
z(OH)
w) complexes and then converted into TiO
2 anatase nanostructures [
10]. The component ratio of the amorphous TiO
2 complexes and TiO
2 anatase is established by an equilibrium balance between the H, OH, Cl, and NH
3 radical concentrations in the medium. At a low pH level of 0.98 to 2.40, excessive H and Cl radicals promote the formation of anatase nanocrystallites, which likely follows the first mechanism. In this medium, the mean size of the anatase particles is approximately 4.5 nm below the limitation for the anatase to rutile transition [
29,
30,
31]. Consequently, no rutile trace can be observed in the XRD diffraction pattern. In contrast, at a high pH level, the presence of OH and NH
3 radicals reduces and eliminates the activity of the Cl radical and brings in OH-dominant amorphous Ti
xO
y(OH)
w or [Ti(OH)
4−n(H
2O)
2+n]
n+ complexes with a consumption of the anatase. As a result, at a low pH level (−1.0 to 2.40), the anatase fraction is dominant, while the amorphous TiO
2 complexes are dominant at a high pH level (>7.34). The amorphous TiO
2 complexes can be converted back to TiO
2 anatase nanoparticles by a post-heat treatment at a temperature of approximately 300 °C. The amorphous–anatase transition here likely follows the in-situ transition mechanism. The relatively low transition temperature (approximately 300 °C) from amorphous TiO
2 to anatase nanoparticles is explained for the nucleation seeding effect that is due to the embedded anatase nanoparticles in the amorphous TiO
2 medium [
14].
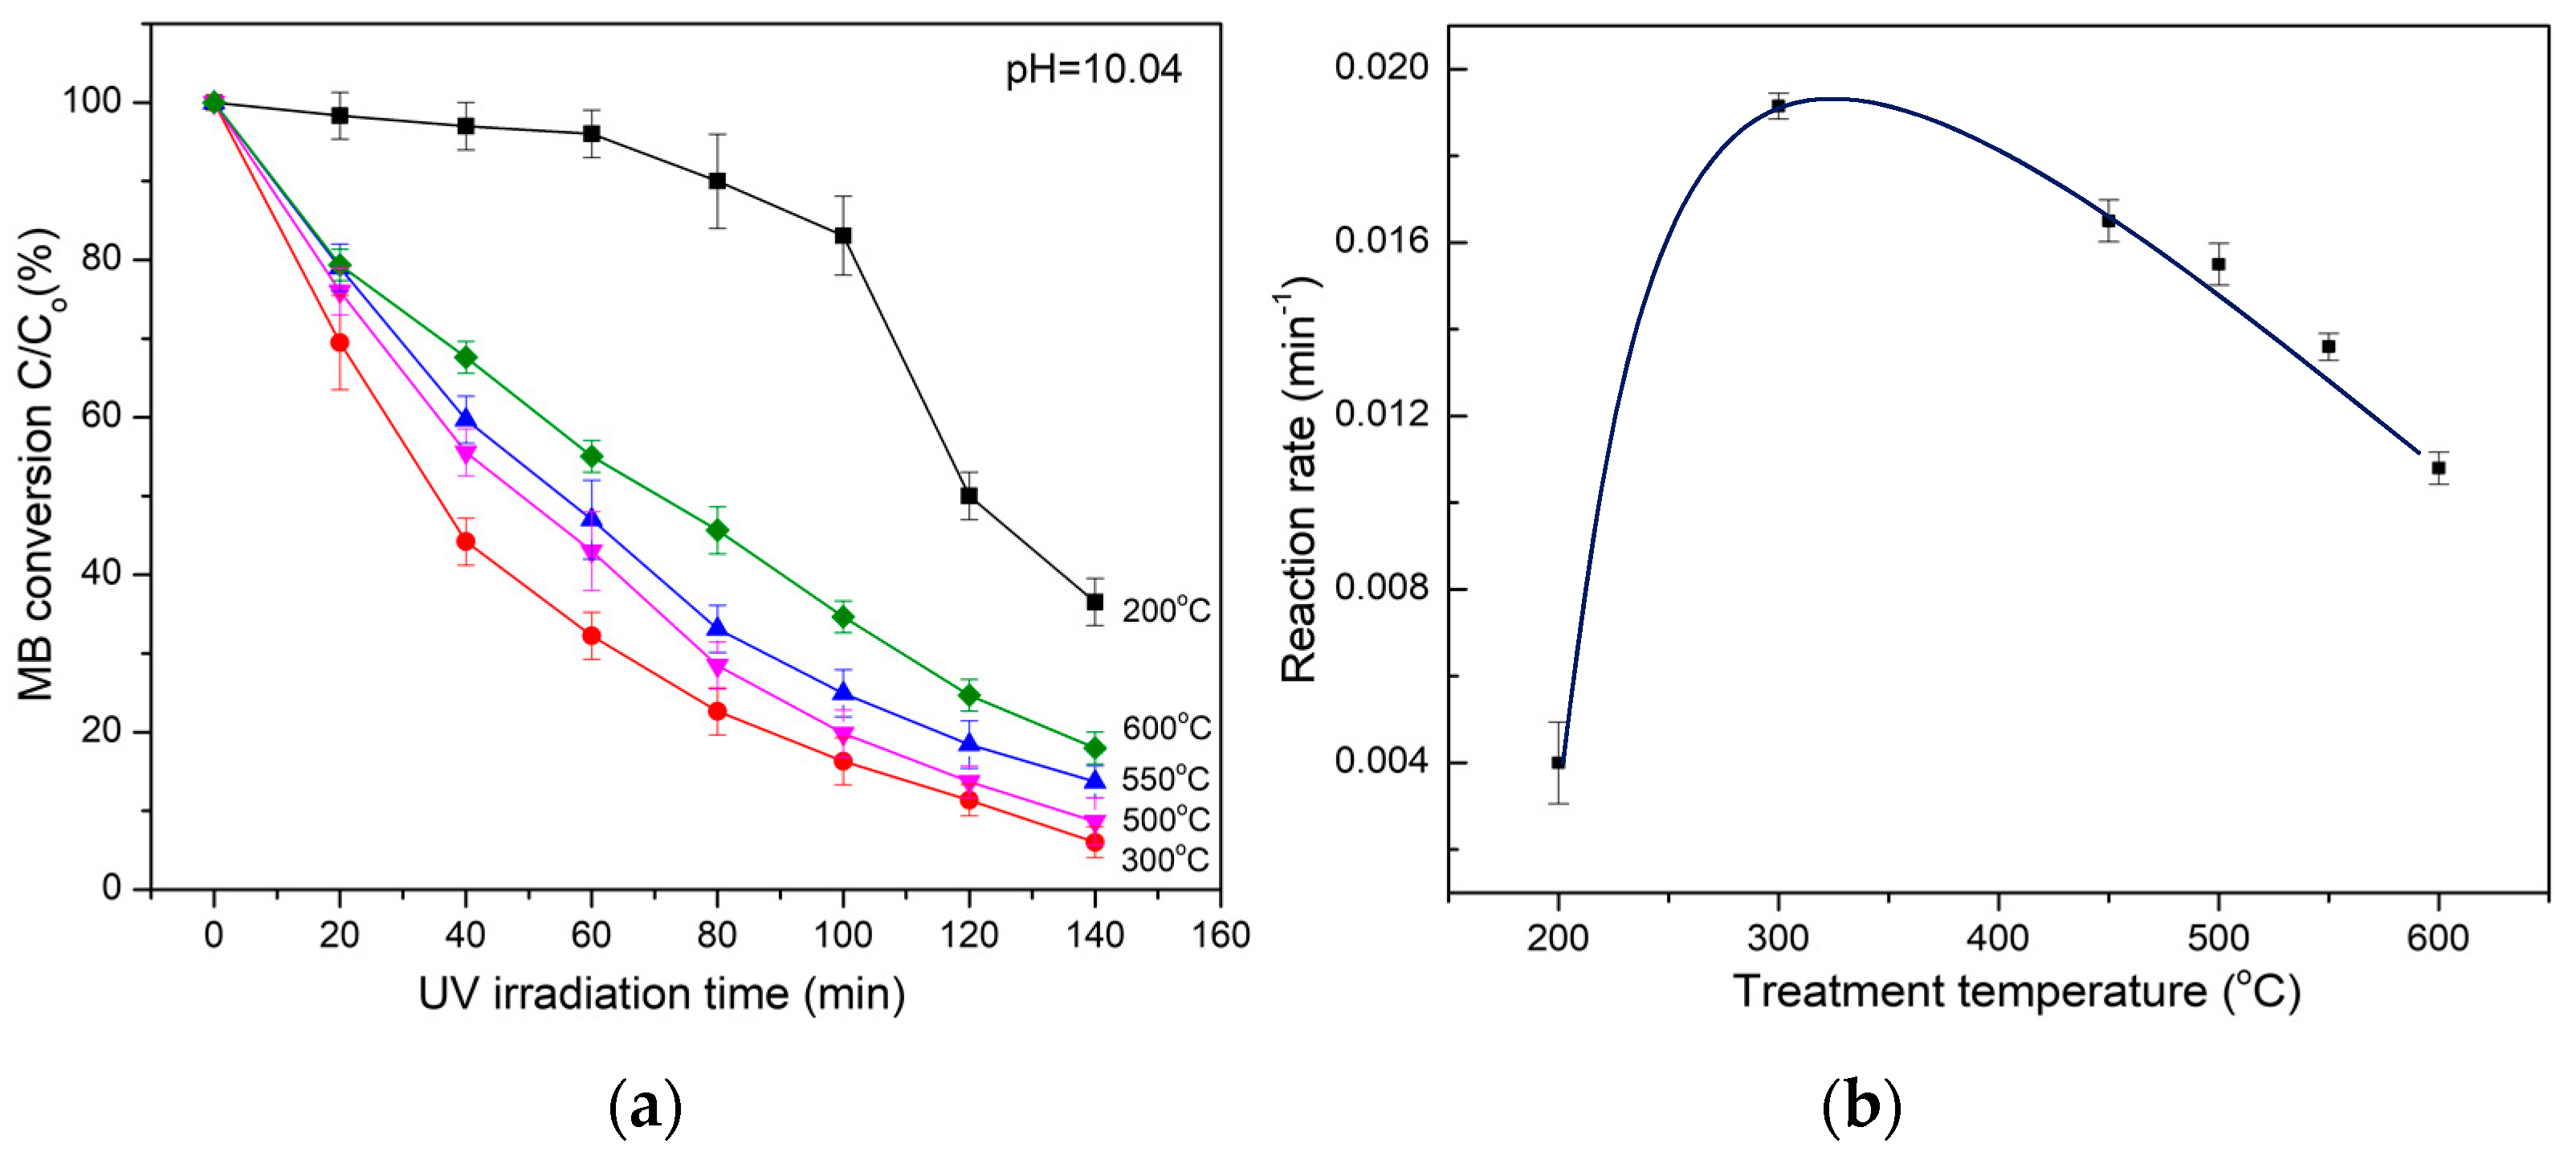
The experiments show that the amorphous TiO2 complexes exhibit strong photocatalytic activity upon exposure to UV light radiation. By comparison of the relative intensity of the methylene blue (MB) principal adsorption peak in the UV–Vis spectrum, the percentage of oxidated MB in the solution was deduced and then the photocatalytic activity of the materials was calculated.
With regard to the photocatalysis of amorphous TiO
2 complexes, the rates of photocatalytic oxidation of MB show an exponential reduction that is well fitted to the Langmuir–Hinshelwood (L–H) kinetics model [
32]. As illuminated in
Figure 9a, when the MB concentration is small, the L–H equation can be simplified to an apparent first-order: ln(C
0/C
t) = kt or C
t = C
0 exp (−kt), where C
0 is the initial concentration of MB, C
t is the concentration of the MB at UV illumination time t, and k is a constant standing for the photocatalytic redox or reaction rate. By fitting the MB decomposition curve (in
Figure 9a) to the L–H equation, the dependence of the photocatalysis of amorphous TiO
2 complexes in terms of reaction rate on the heating temperature can be observed (
Figure 9b). At a heating temperature bellow 200 °C, the photocatalysis (reaction rate) of the materials is weak but rapidly increases with increasing temperature, then reaches the maximum reaction rate at a heating temperature of approximately 300 °C. By further increasing the heating temperature, the photocatalysis of the materials declines. When NH
4Cl is evaporated and eliminated, the appearance of anatase nanostructures due to the decomposition and recrystallization of amorphous TiO
2 complexes in the materials accounts for such behavior. At a heating temperature of approximately 300 °C, the NH
4Cl and amorphous TiO
2 complexes are assumed to be totally decomposed, and the materials completely convert into pure anatase and exhibit the maximum photocatalysis. By further increasing the heat temperature, the photocatalysis is reduced due to the growth of anatase particles and the appearance of a rutile fraction resulting from the anatase–rutile transition.
3. Materials and Methods
Titanium tetrachloride (TiCl
4) of 99.9% purity (Sigma-Aldrich Chemical Co., USA) as Ti precursor was used as received. An ammonium hydroxide solution (NH
4OH) of 28% NH
3 (Merck Corp., USA) was used as a basic agent to adjust the pH of the pyrolysis medium. The TiO
2 synthesis process was straightforward, as follows: TiCl
4 was added dropwise into deionized water at 5 °C to a concentration of 0.04 M. The pH level of the solution was then dropped to approximately 0.98 (starting point). By adding a small amount of NH
4OH into the solution, the pH level was adjusted and preserved at a point in the range of 0.98 to 10.04. The solution was then poured into test tubes and placed in an oven at 80 °C, the onset point of TiCl
4 decomposition. The solution was gradually changed to an opalescent suspension, indicating that the TiCl
4 was thermally decomposed and converted into TiO
2 complexes, and then TiO
2 nanostructures accompanied the formation of HCl and NH
4Cl [
12]. The pyrolysis was carried out for approximately 3 h; then, the power was shut down and the solution was slowly cooled to room temperature. Depending on the pH level, the appearance of the resulting solution showed either transparent, opalescent, or a clear split into transparent and milky parts, as seen in
Figure 1. For characterization, these parts were separated and dried by vacuum evaporation, then thermally post-treated in an oven with a heating temperature up to 600 °C.
The structure of the resulting materials was determined by a D8 Advance Bruker diffractometer using CuKα radiation of a 0.154 nm wavelength. The mean size, D, of the TiO2 crystallites was calculated using the Scherrer equation, i.e., D = kλ/βcosθ, where k = 0.94, λ = 0.154 nm, and β is full width at half maximum (FWHM) according to the principal diffracted angle θ, i.e., (101) peak for anatase. The Raman spectra were obtained on a LabRAM HR800 (Horiba) using a 632.8 nm excitation laser at a resolution of 1.0 cm−1. High-resolution Transmission Electron Microscope (HRTEM) images were obtained using a JEOL JEM-2100 TEM. Scanning Electron Microscope (SEM) images were conducted on a JEOL JEM-7600F Field Emission SEM. The photocatalytic activity of the TiO2 nanostructures was determined by measuring the degradation rate of methylene blue (MB) under UV light radiation. Normally, a mixture of 50 mL of 0.25 µmol MB aqueous solution and 50 mg of amorphous TiO2 complexes was stirred magnetically under dark conditions for 30 min before being exposed under a UV mercury vapor lamp. After a fixed UV exposure duration, 1 mL of the aqueous solution was taken out for UV–Vis characterization. In a diluted MB solution, the MB absorbance in the UV–Vis spectra is linearly proportional to the MB concentration according to the Lambert–Beer law. The degradation rate of MB in the solution under UV light radiation was then deduced by comparing the intensity of the MB absorbance at the maximum absorption peak of 661 nm in the UV–Vis spectrum. The experiment was replicated several times with different samples under different exposure doses to obtain the relevant results. The UV–Vis was carried out using a Cary 100 UV–Visible Spectrophotometer (Agilent).


