Article

K-Modified Co–Mn–Al Mixed Oxide—Effect of Calcination Temperature on N2O Conversion in the Presence of H2O and NOx

by
Kateřina Karásková
1,
Kateřina Pacultová
1,
Květuše Jirátová
2,
Dagmar Fridrichová
1,
Martin Koštejn
2 and
Lucie Obalová
1,*
1
Institute of Environmental Technology, VSB—Technical University of Ostrava, 17. listopadu 15/2172, 708 00 Ostrava, Czech Republic
2
Institute of Chemical Process Fundamentals, Czech Academy of Sciences, Rozvojová 2/135, 165 02 Prague, Czech Republic
*
Author to whom correspondence should be addressed.
Catalysts 2020, 10(10), 1134; https://doi.org/10.3390/catal10101134
Submission received: 18 August 2020 / Revised: 21 September 2020 / Accepted: 29 September 2020 / Published: 1 October 2020
(This article belongs to the Special Issue Catalytic Decomposition of N2O and NO)

Abstract

:
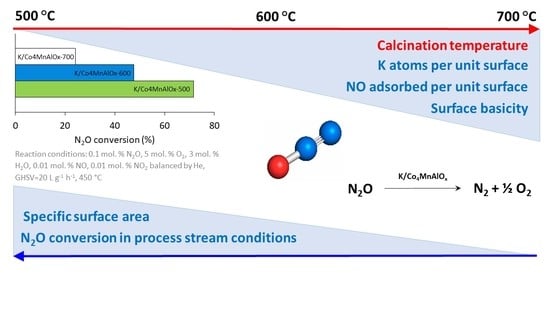
The effect of calcination temperature (500–700 °C) on physico-chemical properties and catalytic activity of 2 wt. % K/Co-Mn-Al mixed oxide for N2O decomposition was investigated. Catalysts were characterized by inductively coupled plasma spectroscopy (ICP), X-ray powder diffraction (XRD), temperature-programmed reduction by hydrogen (TPR-H2), temperature-programmed desorption of CO2 (TPD-CO2), temperature-programmed desorption of NO (TPD-NO), X-ray photoelectron spectrometry (XPS) and N2 physisorption. It was found that the increase in calcination temperature caused gradual crystallization of Co-Mn-Al mixed oxide, which manifested itself in the decrease in Co2+/Co3+ and Mn3+/Mn4+ surface molar ratio, the increase in mean crystallite size leading to lowering of specific surface area and poorer reducibility. Higher surface K content normalized per unit surface led to the increase in surface basicity and adsorbed NO per unit surface. The effect of calcination temperature on catalytic activity was significant mainly in the presence of NOx, as the optimal calcination temperature of 500 °C is necessary to ensure sufficient low surface basicity, leading to the highest catalytic activity. Observed NO inhibition was caused by the formation of surface mononitrosyl species bonded to tetrahedral metal sites or nitrite species, which are stable at reaction temperatures up to 450 °C and block active sites for N2O decomposition.

Graphical Abstract

1. Introduction

The catalytic decomposition of nitrous oxide to oxygen and nitrogen is the simplest method of N2O emissions abatement from HNO3 plants, which belong to the significant sources of this greenhouse gas. The removal of N2O from the tail gas at temperatures up to 450 °C is a technology suitable for new and also existing HNO3 plants since there is no interference with the nitric acid production process. Attention has been focused on the development of a suitable catalyst, which is resistant against water and oxygen inhibition, effective in the presence of NOx (NO + NO2) and has long-term stability in wet acidic environments [1].
Cobalt containing mixed oxides were reported to be very effective catalysts for N2O decomposition [2,3,4,5,6,7,8]. One of the possible routes of their preparation is the controlled thermal decomposition of relevant layered double hydroxides (LDHs, hydrotalcites). Layered double hydroxides have general formula [MII1-xMIIIx(OH)2]x+[An−x/n∙yH2O]x−, where MII and MIII are divalent and trivalent metal cations, An− is an n-valent anion, and x usually has values between 0.20 and 0.33 [9,10]. Since the hydrotacite structure allows for the controlled incorporation of various MII and MIII metal cations, it is ideal for study of their synergic interactions. Several LDHs were reported to be interesting precursors of catalysts for N2O decomposition—e.g., Co-Mg-Al [3], Co-Rh-Al [11], Co-Mn-Al [12,13,14] and Co-Cu mixed oxides [15]. Generally, three characteristic processes can be observed during hydrotalcite heating: the release of interlayer water (dehydratation) and water structurally bonded in the hydroxide layers (dehydroxylation) at 150–200 °C, followed by the decomposition of interlayer carbonates (decarboxylation) accompanied by a collapse of the LDH basal spacing and by the complete decomposition of the layered structure at 350–600 °C resulting in a structurally disordered, predominantly amorphous oxide mixture. This process is reversible and the crystal structure of the hydrotalcite can be restored by a rehydration reaction. Transformation from the layered structure to the disordered oxide mixture is considered as topotactic transition; this means that the final mixed oxide lattice is related to that of the LDH original material from the crystallographic point of view [16]. A further increase in the calcination temperature causes gradual crystallization and the crystalline mixed oxides are formed [17]. At higher temperatures (approx. 800–900 °C), a spinalization reaction can occur with some hydrotalcites.
The thermal stability of LDHs and the kinetics of mixed oxide crystallization strongly depend on the composition of the metal cations in hydroxide layers. Transformation from the layered structure to oxide phase is accompanied by significant changes in material properties, such as phase composition, crystallinity, specific surface area, porous structure, metal cations valence states, reducibility etc. [18,19]. Therefore, calcination temperature is an important parameter for preparation of a tailored catalyst for the given chemical reaction.
Effect of calcination temperature on the activity of catalysts for N2O decomposition in inert gas was studied in several papers and different results were obtained. While a decrease in catalytic efficiency with increasing calcination temperature from 500 to 700 °C was observed over Co-Mg/Al mixed oxide by Tao et al. [20] and over Au/Co-Al mixed oxide calcined from 300 to 550 °C by Xu et al. [21], Chmielarz et al. [17] published that an increase in the calcination temperature from 600 to 800 °C significantly activated the Co-Mg-Al and Co-Cu-Mg-Al mixed oxide catalysts prepared from LDH precursors. Moreover, calcination temperature can strongly affect the stability of catalysts containing alkali metals. The advantage of the high temperature calcination of K/Co-Al mixed oxide for N2O decomposition was published by Cheng [22]. The rearrangement of the surface alkali metal species, depending on the calcination temperature, led to various stabilities of the obtained catalytic system as was reported elsewhere [23,24]. However, there were problems with low stability of these alkali metals at reaction temperatures caused by alkali metals desorption.
Our group has been studying low temperature N2O decomposition over mixed oxides prepared by the thermal treatment of LDHs for several years. We tested different combinations of metal cations in hydroxide layers at constant MII/MIII molar ratios of 2 (MII = Co, Ni, Cu, Mg; MIII = Al, Mn, Fe; An− = CO32−) [3,25,26] and evaluated that the Co-Mn-Al mixed oxide is the best for N2O decomposition among all those tested. The manganese addition to cobalt mixed oxide was the reason of achieving higher catalytic activity not only in oxygen but predominantly in the wet atmosphere [3]. The effect of the Mn/Al ratio in the Co–Mn–Al mixed oxide was studied in [26], where both optimal surface amounts of Co and Mn and optimal amounts of components reducible in the needed temperature region for catalytic reaction (350–450 °C) were evaluated for the Co-Mn-Al mixed oxide with molar ratio Co:Mn:Al = 4:1:1. In order to obtain better catalytic activity and stability, this catalyst was promoted by different metals [2]. It was found out that potassium modified both electronic [27] and acido-basic properties of surface and optimal value of about 2 wt. % led to the high catalytic performance in the wet acid environment [12]. The long-term stability and activity of K/Co4MnAlOx was successfully verified in a pilot scale reactor connected to tail gas from the HNO3 plant down-stream of the SCR NOx/NH3 unit [28].
In all our previous experiments, the calcination temperature was kept constant at 500 °C. This temperature was chosen based on DTA results as the temperature when the HT structure is decomposed [18], and simultaneously this temperature is 50 °C higher than the highest reaction temperature of N2O catalytic decomposition to be sure that catalyst will not change during catalytic reaction. The different results published in the literature about the effect of calcination temperature of LDHs precursors on their activity for N2O decomposition led us to study this effect for the most active Co-Mn-Al mixed oxide modified by 2 wt.% potassium. Moreover, the effect of calcination temperature on catalytic activity has never been published for N2O decomposition in the presence of O2, H2O and NOx; only in [17] were the catalytic tests in the presence of oxygen but without H2O and NOx presented.
The aim of presented work is to find out whether it is possible to improve the activity of the K/Co-Mn-Al catalyst increasing calcination temperature and to check this effect in simulated off-gas from HNO3 production—i.e., in the simultaneous presence of O2, H2O and NOx. For structure-activity relationship evaluation, common characterization techniques (XRD, N2 physisorption, XPS, TPR-H2, TPD-CO2, TPD-NO) are used.

2. Results and Discussion

2.1. Chemical, Structural and Textural Properties of Catalysts

The chemical and structural properties of the K-modified Co-Mn-Al mixed oxide calcined at temperatures 500, 600, and 700 °C are shown in Table 1. As expected, Co, Mn, and Al contents are similar for all catalysts and slightly increase with increasing calcination temperature. This finding can be explained by ongoing deoxygenation and/or decarboxylation processes that are more intense at higher temperatures [18]. In accordance with [23], no decrease in potassium amount in the catalysts with increasing calcination up to 700 °C caused by volatilization was observed.
Several papers dealt with the dependence of specific surface area on the calcination temperature of different LDHs: Cu-Mg-Mn and Ni-Mg-Mn [29], Co-Al [30], Co-Mn-Al [18]. The same trend was observed for all mentioned LDHs: an increase in the specific surface area up to the temperature at which a collapse of the LDH structure occurs, subsequent gradual crystallization of new phases, and finally, particle sintering at highest temperatures accompanied by a significant decrease in surface area. The observed decrease in specific surface area from 98 to 71 m2/g (Table 1) with increasing calcination temperature from 500 to 700 °C is in accordance with above mentioned results.
The XRD patterns are shown in Figure 1. The presence of the Co-Mn-Al spinel-like mixed oxide was confirmed in all catalysts calcined at examined temperatures. No systematic shift with the calcination temperature was observed—only the increase in crystallite size from 9 to 12 nm with increasing calcination temperature was observable (Table 1). The mean crystallite size was determined from half-width of peak S (311) from Scherrer’s equation. The finding is in good agreement with the observed decrease in specific surface area. The same dependence was also described in other papers [18,30,31].

2.2. XPS

The surface compositions in the near-surface region and chemical state of the elements of the catalysts were determined by X-ray photoelectron spectrometry (XPS). Carbon tape used for fixing of the samples to the holder could manifest itself in a higher concentration of C. The calibration of the spectra was carried out according to adventitious carbon (284.8 eV). Binding energies (BE) of core level electrons and atomic percentages of the catalysts surface components are summarized in Table 2 and Table 3, respectively. Deconvoluted XPS spectra of the individual elements of the catalysts are shown in Figure S1.
In addition to the main catalytic components (Co, Mn, Al, K, O) given in Table 3, some amounts of Na and N on catalysts surfaces were registered as differing in dependence of calcination temperature. Nitrogen obviously comes from nitrates remaining in the K/Co4MnAlOx-500 catalyst after imperfect washing of the filtration cake. With increasing calcination temperature, nitrates are fully decomposed. Similarly, sodium remained in the catalysts due to imperfect washing, but its content practically did not decrease during calcination, if we do not take into account the amount of C 1s. Some variation in the Na content can be caused by inhomogeneity of the samples. On the other hand, the surface concentration of K (number of atoms/m2) gradually increases with increasing calcination temperature, which is sufficiently documented in the literature.
In all catalysts, the Co 2p region consists of two main photoemission maxima Co 2p1/2 and Co 2p3/2 with the spin-orbital splitting of 15.2 ± 0.05 eV. Comparison with the literature value (15.1 eV), together with the observed broad satellite structure [32], reveal the presence of both Co2+ and Co3+ oxidation states [33]. The distinguishing of the surface Co3+/Co2+ and Mn4+/Mn3+ molar ratios in the catalysts is, unfortunately, relatively difficult. Both pure compounds, CoO and Co3O4, have almost the same position of the Co 2p3/2 peaks, which only slightly vary in FWHM and shape. The assigning of the fitting peaks is also inconsistent among many papers. Based on our recent XPS study using appropriate standards [14,26,34] and work [35], we assigned the component with lower BE (780 eV) to tetrahedral Co2+ and the component with higher BE (782 and 783.5 eV) to octahedral Co3+. However, in the literature can also be found opposite assignment [36,37,38,39]. These findings could be explained by the position of maxima for Co(OH)2, which is located at the position of second fitting peak of Co3O4 [32]. Nevertheless, the Co 2p3/2 peak fitting was done with respect to [32] and our previous works [14,26,34] in order to preserve consistence. The positions of second and third fitting peaks from the first fitting peak were set as +1.5 and +3.6 eV, respectively.
Manganese Mn 2p3/2 spectra showed one broad peak with a maximum at 642.3–641.9 eV, indicating that higher oxidation states than Mn3+ and BE correspond to Mn3O4 and MnO2 [40]. The determination of the manganese chemical state was done based on our previous research [14,23,26]. Mn 2p3/2 was fitted by two peaks corresponding to Mn3+ (component with lower BE) and Mn4+ (component with higher BE). The position of the second fitting peak from the first fitting peak was set to +1.9 eV.
The peaks of aluminium were very similar in all samples. They could be ascribed to Al+3, though the position of the peak is slightly shifted towards lower binding energy in comparison with published data for alpha Al2O3 [41]. This shift is probably due to the presence of other metals in the spinel structure. In all samples, potassium occurred in an identical form, values of BE corresponding to KMnO4, KMn8O16, KCoO2, or a similar compound. The deconvolution of oxygen spectra revealed two peaks with binding energies of about 529.8 and 531.5 eV. The first one at 529.8 eV can be ascribed to metal oxide (lattice oxygen O2−), and the second at 531.5 eV can be ascribed to the adsorbed surface oxygen bound to metal oxides, such as O2−, O, or OH species [42,43,44] or to a non-stoichiometric spinel-like phase [30].
From the results, we can see that Mn3+ and Co2+ are prevailing on the surface of all catalysts and their contents decrease at the expense of Mn4+ and Co3+ with increasing temperature (Table 2). The observed trend is connected with the gradual crystallization of spinel phase and ordering of its structure accompanied by the decrease in (Co + Mn) mean valence [18]. In Table 4, there is a relation of surface and bulk concentrations of catalyst components. The relation documents that surface on the catalysts is enriched by potassium at the expense of Co and Mn. Surface and bulk concentrations of Al were nearly identical.

2.3. TPR-H2

The results from TPR-H2 measurements obtained in the temperature range from 25 to 1000 °C are shown in Figure 2 and Table 1. H2 consumptions were comparable for all catalysts and led to the estimation of mean (Co + Mn) oxidation states between 2.4 and 2.8. All catalysts were reduced in two temperature regions, 100–500 °C (low-temperature) and 500–950 °C (high-temperature). Both regions consist of some overlapping peaks that are more distinguishable with increasing calcination temperature. Li [45] observed a similar TPR profile over Co-Mn-Al mixed oxide prepared by coprecipitation and calcination at 500 °C. The temperature maxima observed at 180–229 °C is ascribed to the reduction of adsorbed oxygen species [46,47] and/or to Co4+, which are both formed by the oxidation of surface Co3+, according to Equation (1):
½ O2 + Co3+ → O + h. (Co4+),
where h. is positive hole—i.e., orbital without electron [48]. This agrees well with the published values of Tmax for Co4+ reduction at circa 200 °C [49].
Detailed study of the course of the Co-Mn-Al mixed oxide crystallization described segregation of Co3O4 in Co-Mn-Al hydrotalcite calcined at 400–600 °C while non-stoichiometric spinel was observed at 700 °C [18]. In agreement with this, the main low-temperature peak was ascribed to the reduction of Co3+ to Co2+ and Co2+ to Co0 [50,51] and high temperature peak was assigned to the reduction of cobalt in the spinel-like phase containing Al [51,52,53]. In both temperature regions, the reduction of manganese cations can occur according to the two-step process with Mn3O4 as intermediate: MnO2/Mn2O3 → Mn3O4 and Mn3O4 → MnO [54,55]. The reduction of MnO2/Mn2O3 can also be one-step without Mn3O4 intermediate formation [56].
With increasing calcination temperature from 500 to 600 °C, the Tmax of all peaks moved notably to higher temperatures while a further increase in calcination temperature from 600 to 700 °C did not change their positions significantly. Poorer reducibility of the catalysts calcined at higher temperatures can be connected with larger crystallites formed due to the growth of spinel-phase particles, as detected by XRD [34,52,57].

2.4. TPD-CO2

Results from TPD-CO2 measured in the temperature range from 28 to 650 °C are shown in Figure 3. Several types of basic sites in mixed oxide are visible in TPD-CO2 profiles. Weak basic sites represent –OH groups on the surface of catalyst, medium sites consist of oxygen in Me2+–O2− and Me3+–O2− pairs, and strong basic sites correspond to the isolated O2− anions [58]. TPD profiles of all catalysts indicated the presence of all types of basic sites and the number of basic sites increased with increasing calcination temperature of catalysts from 0.02 to 0.05 mmol m−2 (Table 1). In our previous work, the increase in basicity with increasing K content on the Co-Mn-Al mixed oxide surface was observed [12]. Additionally, in the present work, the basicity increase can be explained by more the abundant population of K species on the unit surface (Table 3). Although all samples contain the same bulk amount of potassium, the surface area decreased with increasing calcination temperature and, simultaneously, the K surface content increased, probably due to potassium diffusion from the bulk to surface during high-temperature calcination [59,60]. During TPD-CO2, the evolution of NO was also observed above 450 °C by quadrupole MS detection (Figure S2). This can explain the presence of N species observed by XPS and confirms that residual amounts of nitrates from preparation were still present on the catalyst calcined at lower temperatures (500 and 600 °C), while all nitrates were decomposed during calcination at 700 °C.

2.5. TPD-NO

Since NO is often present in the off gases, TPD-NO was performed over the catalyst calcined at 500 and 700 °C in order to evaluate NO adsorption ability. Based on the TPD-CO2 results, we expected that more NO should be accumulated on the catalyst with higher basic site content (K/Co4MnAlOx calcined at 700 °C). NO signal obtained from TPD-NO is shown in Figure 4. The shapes of the NO signal for both measured catalysts are similar with the most evident differences observable up to temperatures of about 250 °C. However, the evaluation of peak area, indicating the amount of adsorbed NO, brought interesting results—more NO was adsorbed on the sample calcined at 500 °C (Table 1). This can be explained by different surface area of both samples and after the recalculation of the amount in relation to m2 the order of amount of desorbed NO is reversed. The NO signal was deconvoluted into individual peaks in order to differentiate the types of surface sites, which were occupied by NO. For the sample calcined at the lowest temperature (K/Co4MnAlOx-500), the NO signal is deconvoluted to five peaks (Figure 4a) in comparison to the K/Co4MnAlOx-700 sample (Figure 4b), where only four fit peaks are observable. It is obvious that the fitted peaks differ not only by their number but also by peak areas. The peak above 650 °C observed only for the sample calcined at 500 °C was ascribed to the decomposition of residual nitrates, as was already confirmed during TPD-CO2 measurement (Figure S2). Since the catalyst surface is heterogeneous from the point of view of cobalt and manganese cation coordination, different kinds of adsorbed NO species with different thermal stabilities were observed during TPD-NO. On the basis of the literature [61] and our results of NO direct decomposition [62,63], the first fit peak in the temperature region 50–250 °C corresponds to loosely bound mononitrosyl species associated to surface Co3+ and Mn3+ in octahedral positions, while the second two peaks in the 250–450 °C range belong to tetrahedral metal sites. The fourth peak with maxima around 600 °C represents the decomposition of surface nitrite species and, during TPD-NO, experiments were accompanied by oxygen evolution (not shown). Since the maximum reaction temperature of N2O decomposition used in this study was 450 °C, it is obvious that species observed in TPD-NO above 450 °C cannot decompose or desorb during the reaction, and only sites which were restored during TPD-NO up to 450 °C can take place in N2O decomposition. For that reason, we compared the total number of sites that are able to be restored from adsorbed NO during reaction (peak 1 + peak 2 in TPD-NO, Table 1) for both catalysts and more active sites are restored and present on the catalyst in the presence of NO on the sample calcined at lower temperature.

2.6. N2O Catalytic Decomposition

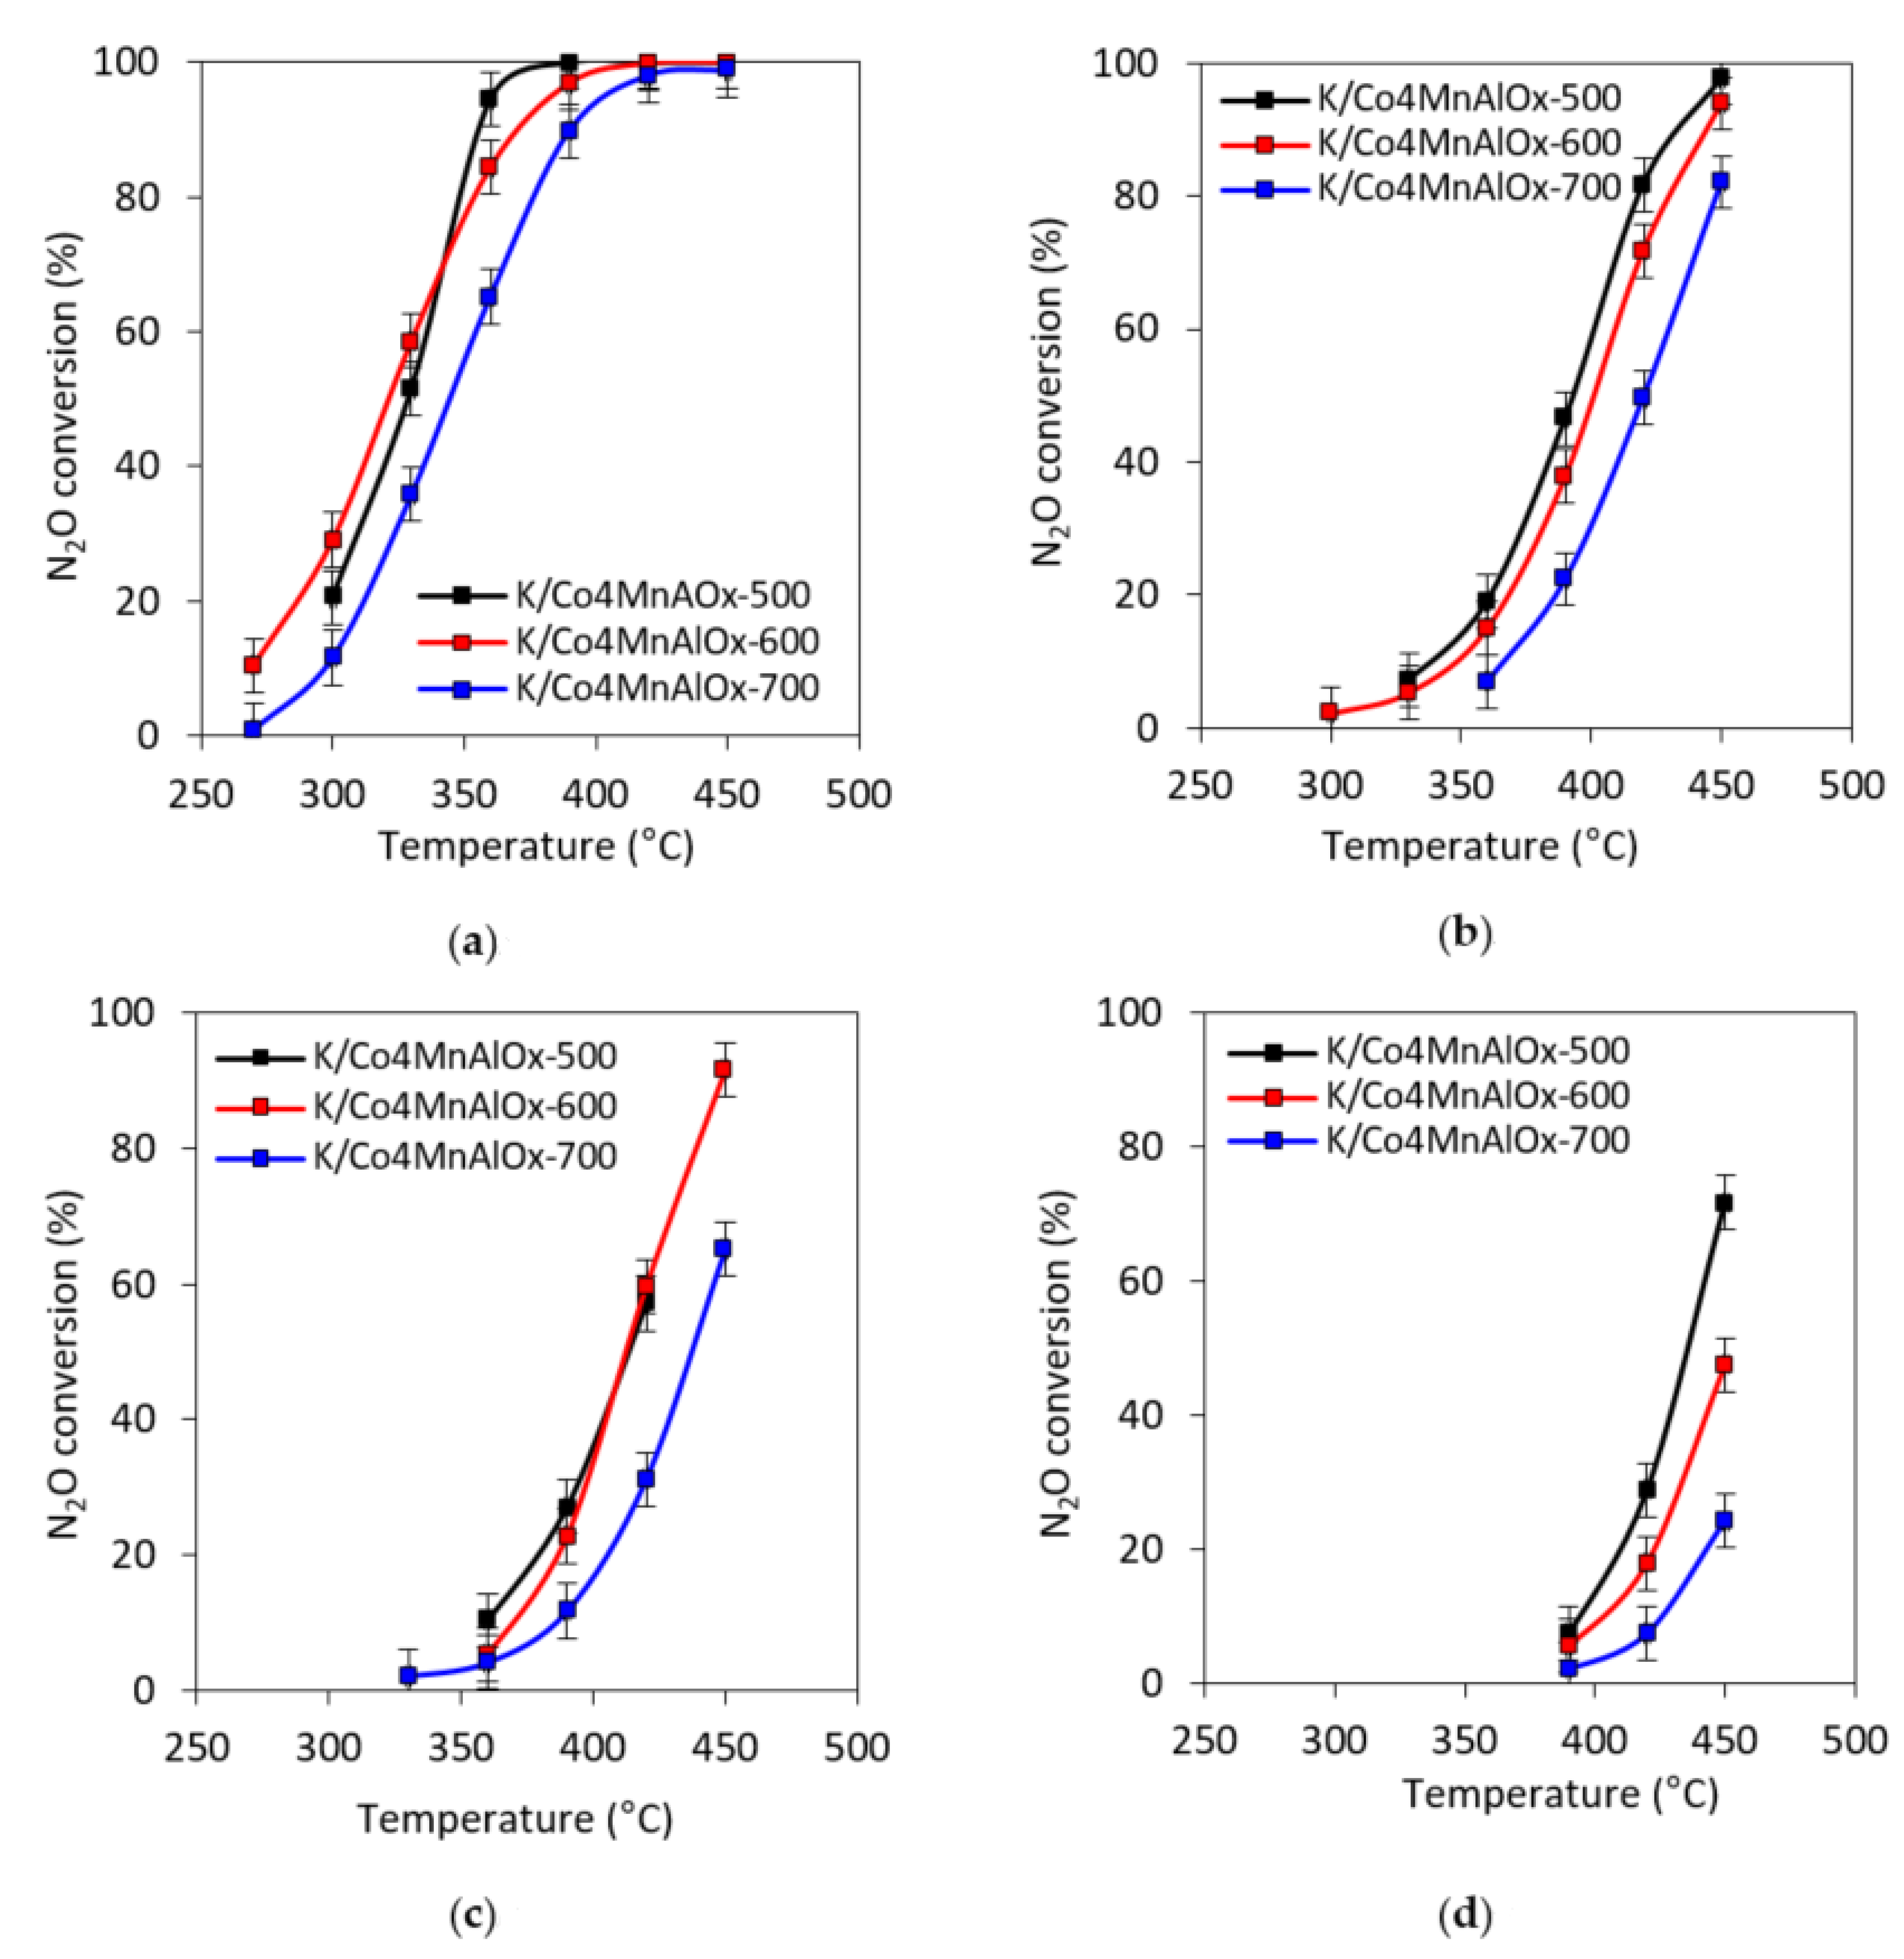
The temperature dependence of N2O conversion in inert gas over the K-modified Co-Mn-Al mixed oxide calcined at different temperatures is shown in Figure 5a. Taking into account the experimental error, N2O conversions over the catalysts calcined at 500 and 600 °C were nearly the same, while a slight decrease in N2O conversion was observed for the sample calcined at 700 °C.
Since components such as O2, NOx and water vapor always exist in the waste gases from the HNO3 plant, it is important to check the effect of these components on the rate of N2O catalytic decomposition. The temperature dependences of N2O conversion in simulated waste gas from HNO3 production are shown in Figure 5b–d. Three different gas mixtures corresponding to the real waste gas from HNO3 plant downstream the SCR NOx/NH3 and their effect on N2O decomposition was examined as: (i) less severe mixture consisting of 0.1 mol. % N2O + 5 mol. % O2 + 0.9 mol. % H2O (Figure 5b); (ii) more severe mixture of 0.1 mol. % N2O + 5 mol. % O2 + 0.9 mol. % H2O + 0.005 mol. % NO (Figure 5c); (iii) mixture of 0.1 mol. % N2O + 5 mol. % O2 + 3 mol. % H2O + 0.01 mol. % NO + 0.01 mol. % NO2 (Figure 5d) corresponding to the emission limit of NOx. In all three cases, N2O conversion curves were shifted to higher temperatures, in comparison to inert gas conditions. Differences among individual samples are more noticeable in simulated waste gas when the mixture of different contaminants is present. At these conditions, the adsorption of present contaminants takes place on different kinds of sites. In comparison to inert conditions, the values of T50% (i.e., the temperature at which the N2O conversion of 50% is achieved) in less severe conditions was higher by 64, 80, and 75 °C for the catalysts calcined at 500, 600, and 700 °C, respectively.
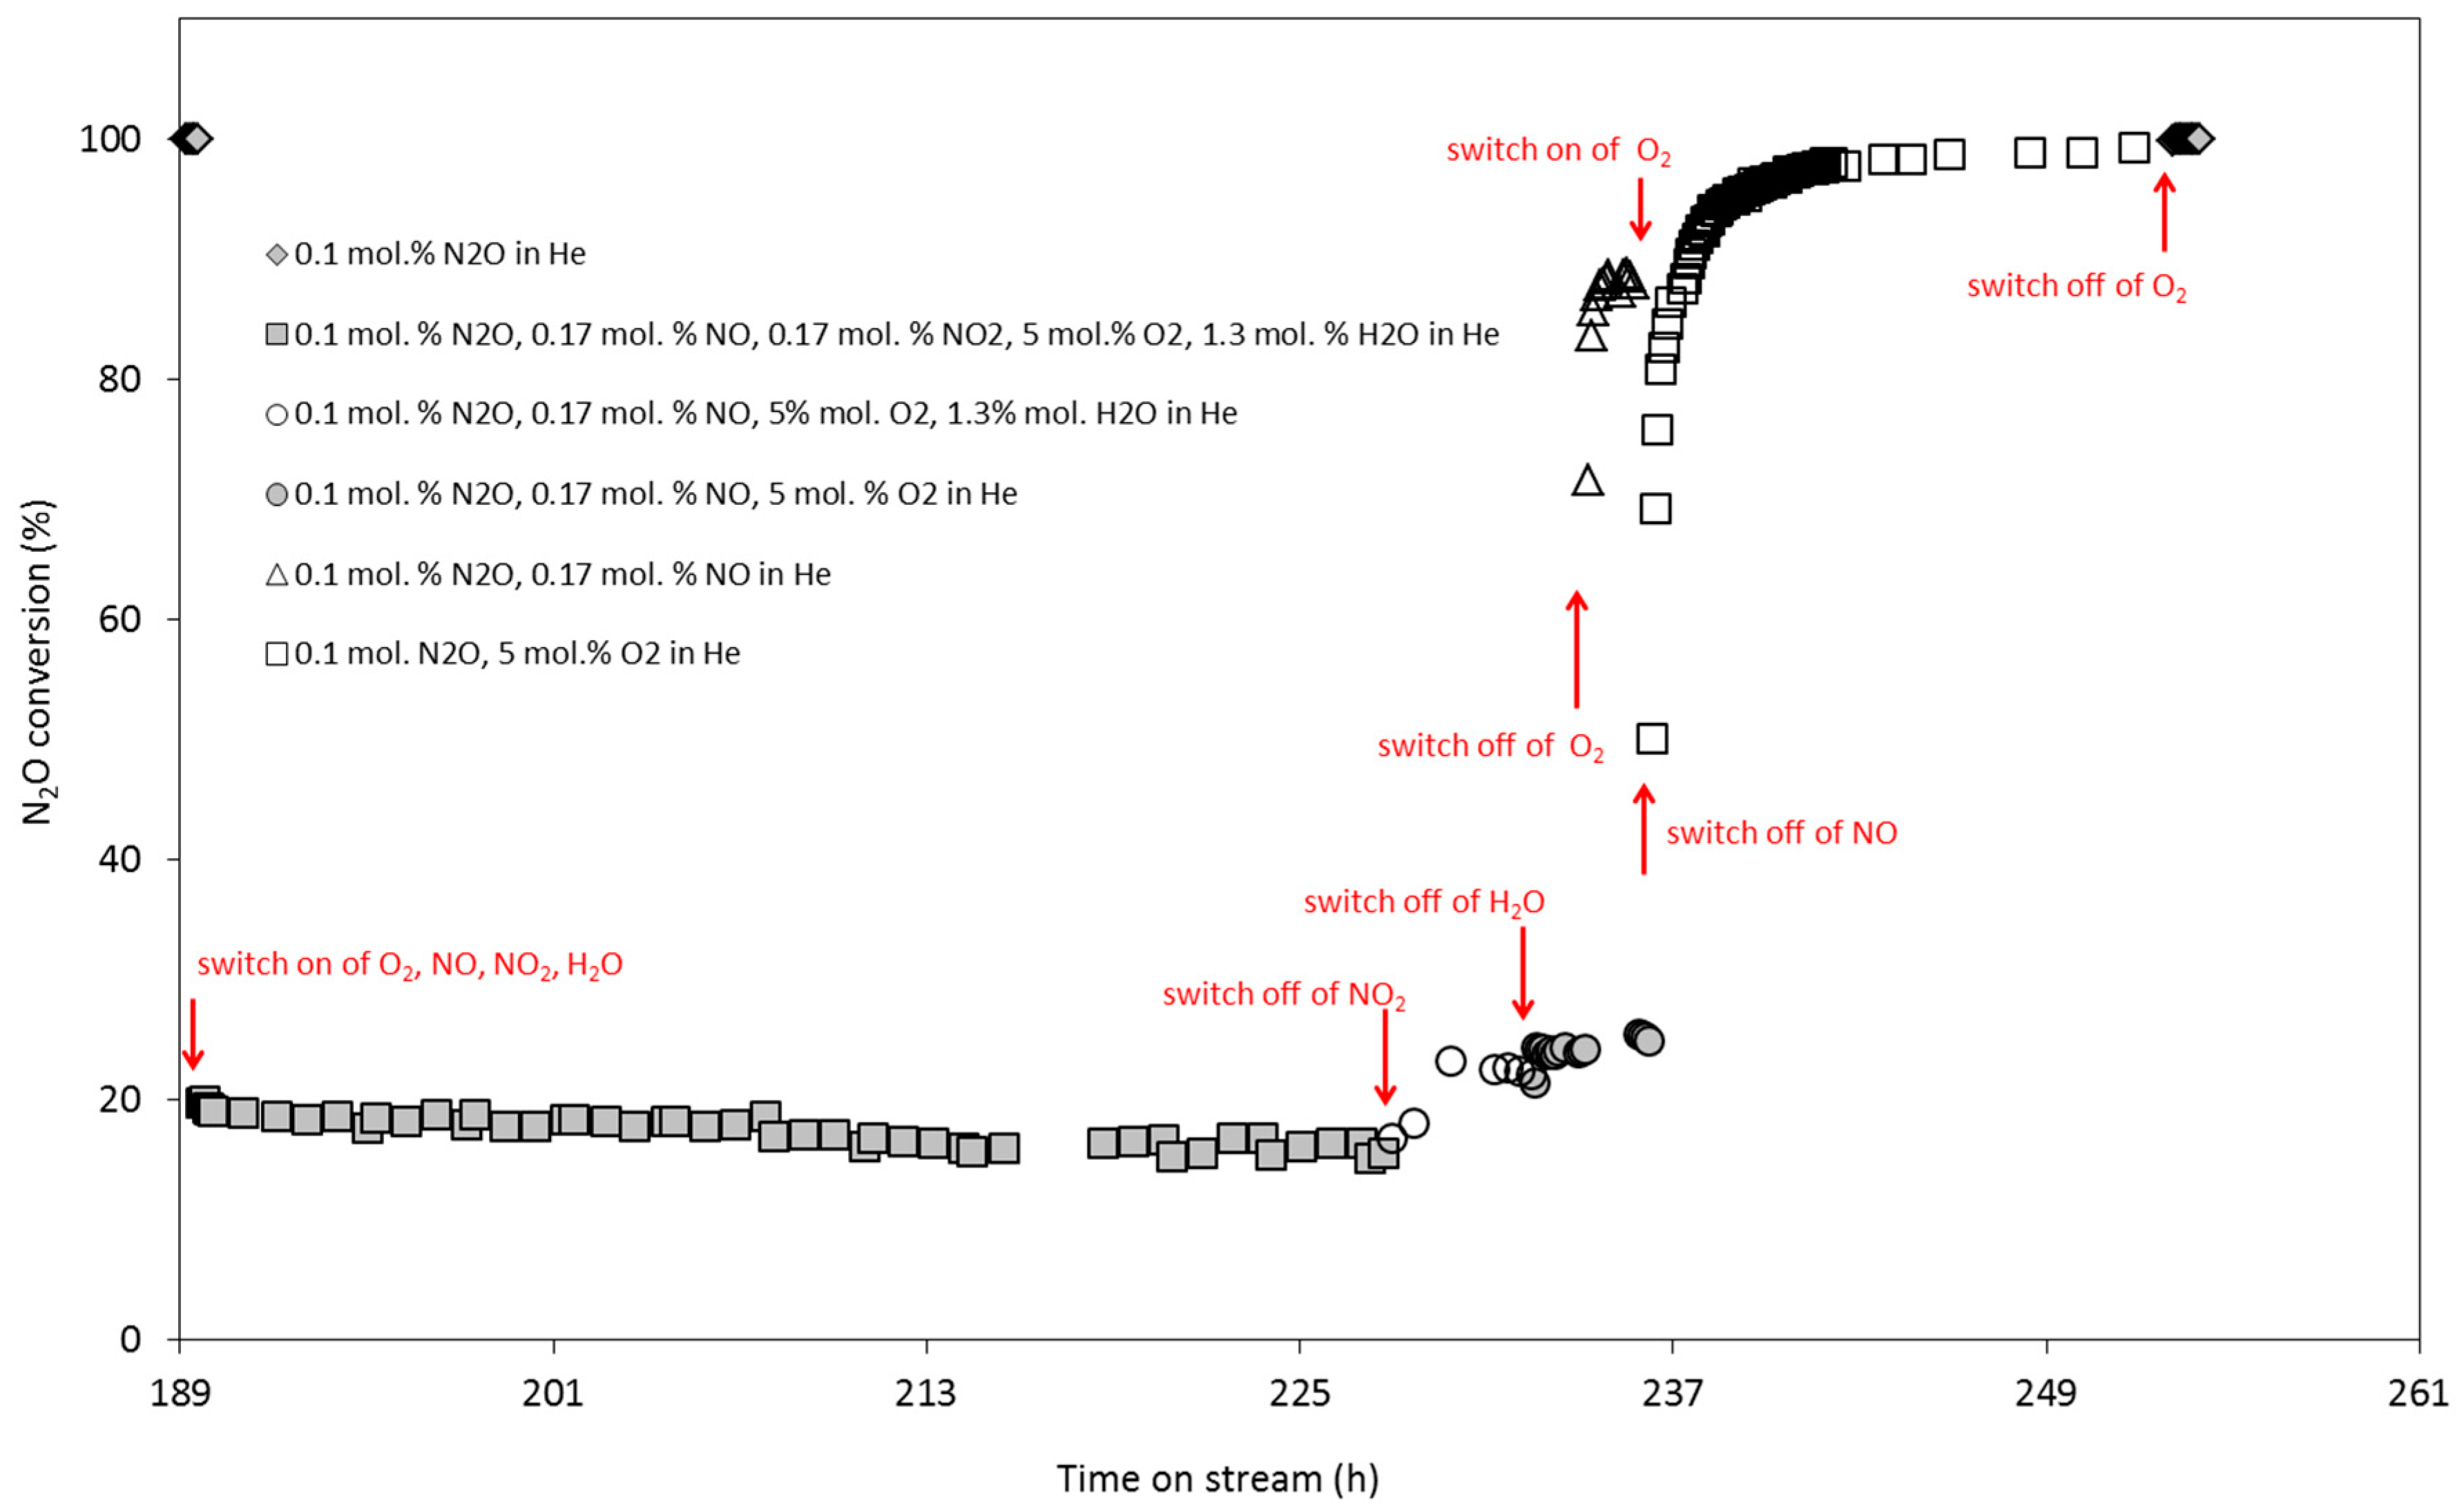
In more severe conditions, the further decrease in N2O conversion was observed; T50% = 436 °C (N2O conversion of 72% at 450 °C) was found over the K/Co4MnAlOx-500 catalyst, and a N2O conversion of only 24% was observed over the catalyst calcined at 700 °C. The observed inhibition in the simulated waste gas from nitric acid plant was reversible and catalytic activities were recovered to the values obtained in the inert gas after the removal of O2, H2O, and NOx from the reaction mixture (Figure 6).
In both conditions, inert gas and the presence of inhibition components, various surface area, mean crystallite size, reducibility as well as different basicity of catalysts can play a role in obtained N2O conversions. The insignificant influence of specific surface area on the activity for N2O decomposition over LDH derived catalysts was published previously [17,22]; however, the dependence of N2O conversion on specific surface area connected with difference in crystallite sizes was also published [21,64]. In inert gas conditions, the correlation of N2O decomposition activity with acid-base properties was never published in the scientific literature and was not observed during our previous studies.
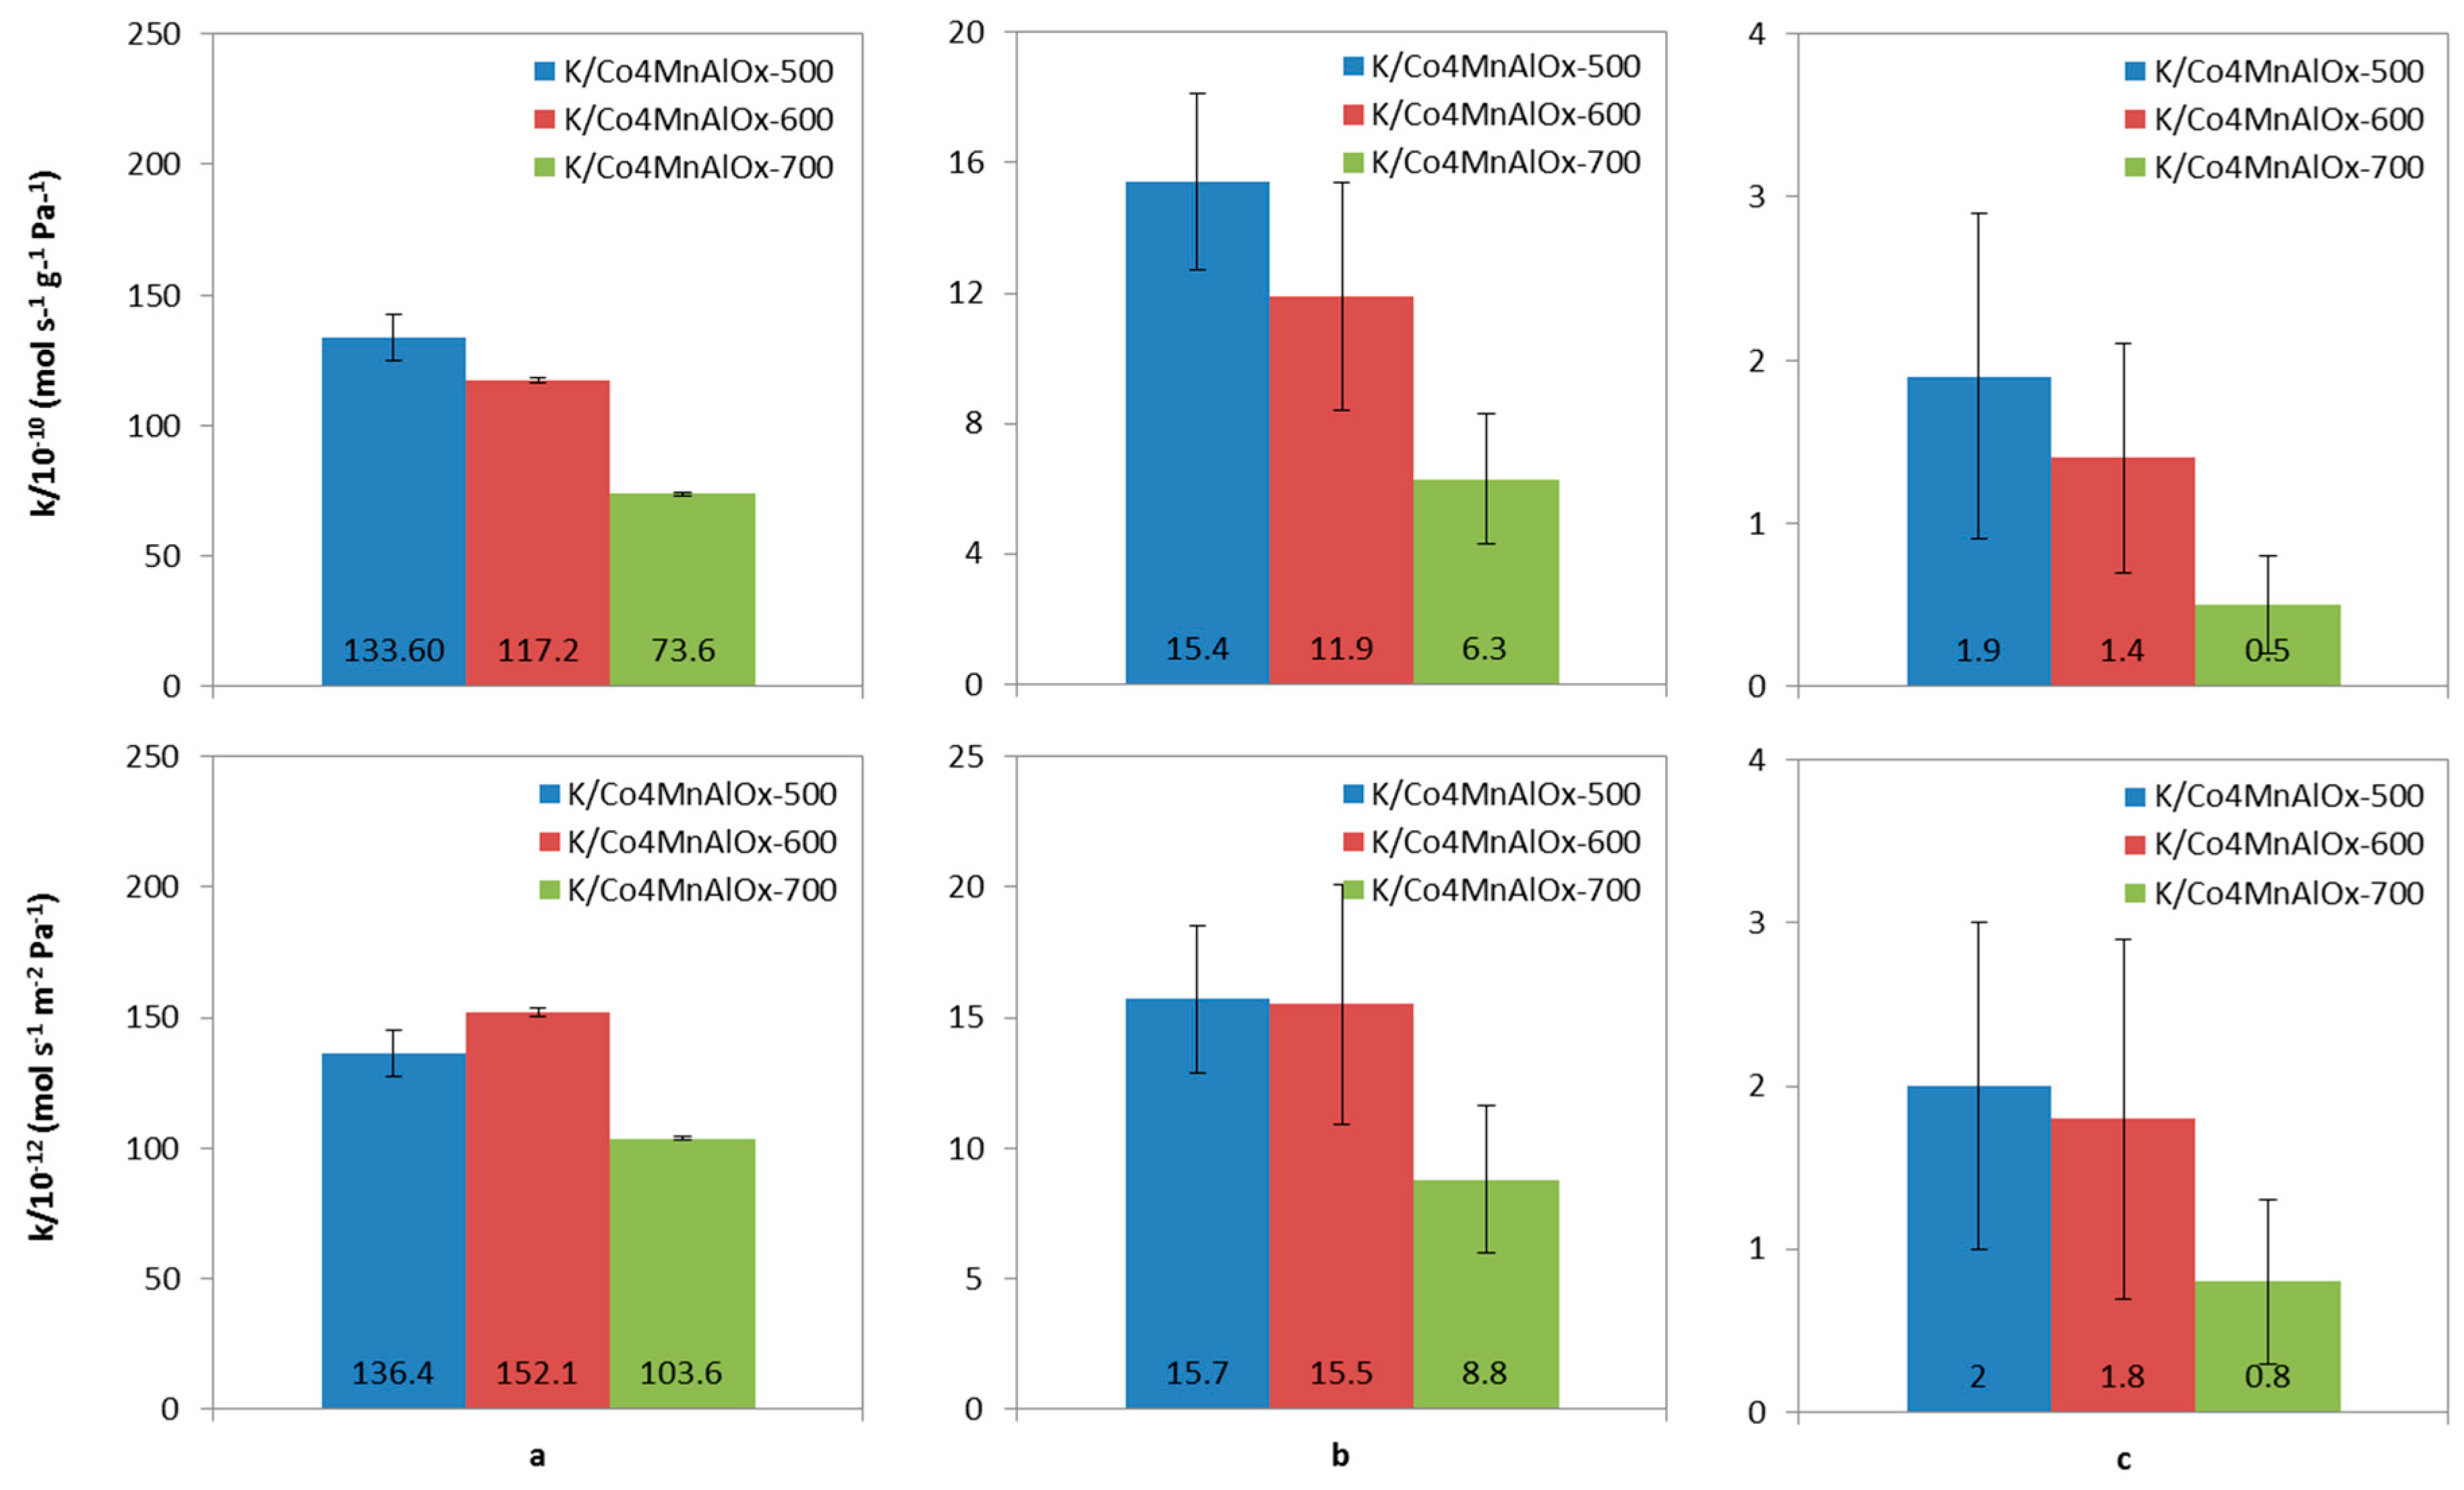
For the evaluation of the catalytic activity of samples, the kinetic constants for N2O decomposition at all reaction conditions were evaluated using the first-rate law and material balance of plug flow reactor (Figure 7). Kinetic constants decreased with increasing calcination temperature of the prepared K/Co4MnAlOx catalysts.
When the rate constant k, expressed as mmol N2O (g s Pa)−1, was depicted as the function of the amount of reducible species in the catalysts (expressed as mmol H2 per g of catalyst consumed in the temperature interval 25–500 °C, Table 1), no direct dependence was obtained. Obviously, the reaction rate of N2O decomposition is not a simple function of amount of reducible species in the catalysts. Compared to that, the decrease in k should be accompanied by the deterioration of reducibility of the catalyst according the published results, where the indirect proportion between Tmax or beginning of the low temperature TPR-H2 peak and catalytic activity was observed [34,65]. This is in agreement with the mechanism of N2O decomposition where the oxygen desorption, leading to active site reduction, is the slowest step in N2O decomposition [66,67]—i.e., the active catalyst needs easily reducible Co3+ to Co2+ (connected with Tmax of low temperature peak from TPR-H2) and Mn4+ to Mn3+. Moreover, charge donation ability for N2O chemisorption accompanied by Co2+ to Co3+ and Mn3+ to Mn4+ is also necessary. For this reason, the influence of the surface Co3+/Co2+ and Mn4+/Mn3+ molar ratios on the catalytic activity (expressed as k) was also analysed. Increase in kinetic constants with increase in Co3+/Co2+ and Mn4+/Mn3+ was observed. However, some uncertainties of XPS, TPR-H2 and kinetic measurements and low number of the examined catalysts did not allow for reaching unequivocal relationships between surface composition, reducibility and catalytic activity.
Activation energies for all samples in all different reaction atmospheres were evaluated and their values are shown in Table 1. It is rather interesting that determined activation energies do not follow the same trend as kinetic constants. The reason is compensation effect [68] revealed by the plotting of activation energy values against the natural logarithm of the pre-exponential factor k0, which was published in [34]. According to del Río and Marbán [68] the compensation effect is often encountered in heterogeneous reactions and occurs when the global reaction is a combination of competing reactions that take place on different groups of active centres, with each group depicting a different value of activation energy and a different pre-exponential factor.
The inhibiting effect of water vapor, oxygen and nitric oxide on N2O decomposition is well known [2,12,69,70] and is explained by competitive adsorption related to different energetic affinity of the compounds present in the feed gas towards investigated surface. In the case that they are simultaneously present in the feed, higher inhibition effect can be seen in the case when the inhibiting compound has higher energetic affinity towards the catalyst surface [5].
When catalytic tests were performed with NOx present in the feed gas, the N2O conversion and both kinetic constants decreased with the increase in calcination temperature (Figure 5 and Figure 7). Alkali metals are known to form basic sites favourable for NOx adsorption [71], which is efficiently used for NOx storage-reduction catalysts. For this reason, lower basicity is less favourable for NOx adsorption and thus more advantageous for higher N2O decomposition activity [12]. The presented results confirmed the literature findings. With increasing calcination temperature, the increase in surface basicity (mmol CO2 m−2) due to increasing K atoms nm−2 was observed, which led to the higher adsorbed amount of NO per unit surface. As the result, the bigger differences in intrinsic activity (expressed as kinetic constants normalized per unit surface) in the presence of high NOx concentrations (Figure 7c) was observed with the increase in calcination temperature. Observed NO inhibition is caused by the formation of surface nitrogen species, which are stable at reaction temperatures up to 450 °C and block active sites for N2O decomposition. From TPD-NO, the mononitrosyl species bonded to tetrahedral metal sites or nitrite species were estimated.

3. Materials and Methods

3.1. Catalyst Preparation

The Co-Mn-Al layered double hydroxide with Co:Mn:Al molar ratio of 4:1:1 was prepared by coprecipitation of Co(NO3)2 · 6H2O, Mn(NO3)2 · 4H2O and Al(NO3)3 · 9H2O nitrates in an alkaline Na2CO3/NaOH solution at 25 °C and pH 10. The resulting suspension was stirred at 25 °C for 1 h; the product was then filtered off and thoroughly washed with distilled water [18]. The washed filtration cake was re-suspended in a solution of KNO3, whose concentration was adjusted to obtain a desired concentration of 2 wt. % potassium in the mixed oxides [12]. The product was again filtered off, dried at 105 °C and calcined for 4 h at 500, 600 or 700 °C in air. The catalyst samples were denoted according to calcination temperature (e.g., K/Co4MnAlOx-600 means Co-Mn-Al mixed oxide modified by potassium and calcined at 600 °C).

3.2. Catalyst Characterization

Chemical analysis of calcined sample after milling and dissolving in an aqueous solution of hydrochloric acid was performed by inductively coupled plasma spectroscopy (ICP) using NexION 2000B ICP Mass Spectrometer (PerkinElmer, Waltham, MA, USA).
Powder X-ray diffraction patterns were recorded using Bruker D8 Advance equipment with Co Kα radiation (Bruker, Karlsruhe, Germany). For phase identification, the PDF-2 database, release 2004 (International Centre for Diffraction Data, Newtown Square, PA, USA) was used.
Superficial elemental analyses were performed by XPS (X-ray photoelectron spectrometry ESCA 3400, Kratos, Manchester, UK) at a base pressure higher than 5 × 10⁻⁷ Pa, using the polychromatic Mg X-ray source (Mg Kα, 1253.4 eV). The composition of the elements was determined without any etching. For the spectra, the Shirley background was subtracted, and the elemental compositions of layers were calculated from the areas divided by corresponding response factor.
The surface area and porous structure of the prepared catalysts were determined by adsorption/desorption of nitrogen at −196 °C using ASAP 2010 instrument (Micromeritics, Atlanta, GA, USA) and evaluated by BET method and BJH methods, respectively. Prior to the measurement, the samples were dried in a drying box at 120 °C for at least 12 h, then evacuated in the ASAP instrument.
Temperature-programmed reduction (TPR-H2) of the prepared catalysts (0.025 g) was performed with a H2/N2 mixture (10 mol. % H2), flow rate 50 mL min−1 and linear temperature increase 20 °C min−1 up to 1000 °C. A change in H2 concentration was detected with a mass spectrometer Omnistar 300 (Balzers, Pfeiffer Vacuum, Asslar, Germany). Reduction of the grained CuO (0.16–0.315 mm) was performed to calculate absolute values of the hydrogen consumed during reduction.
Temperature-programmed desorption of CO2 (TPD-CO2) was carried out on AutoChem II (Micromeritics, Atlanta, GA, USA) equipment connected on-line to mass spectrometer (Prevac, Rogów, Poland). Prior to CO2 adsorption, all catalysts (0.08 g) were heated up no more than calcination temperature in He for 1 h (flow rate 50 mL min−1). Then, the samples were cooled to adsorption temperature 28 °C and the adsorption of CO2 (mixture 50% CO2 in He) was performed for 1 h. To remove physically adsorbed CO2, the samples were purified for 105 min in helium stream (50 mL min−1) at 28 °C. TPD-CO2 was carried out on catalysts using helium as a carrier gas (50 mL min−1). The desorption of CO2 was invoked by heating (20 °C min−1) up to a final temperature of 650 °C. The temperature was held for 10 min.
Temperature-programmed desorption of NO (TPD-NO) was carried out on the AutoChem II-2920 system (Micromeritics, Atlanta, GA, USA) connected on-line to a mass spectrometer (Prevac, Rogów, Poland). Prior to NO adsorption, the catalysts (0.08 g, 0.160–0.315 mm) were heated up no more than the calcination temperature in He for 1 h (flow rate of 50 mL min−1). Then, the samples were cooled to adsorption temperature of 50 °C and the adsorption of NO (50 mol. % CO2 in He) was performed at 50 °C for 1 h. To remove physically adsorbed NO, the samples were purified for 70 min in helium stream (50 mL min−1) at 50 °C. TPD-NO was carried out on catalysts using helium as a carrier gas (50 mL min−1). The desorption of NO was induced by heating (20 °C min−1) up to a final temperature of 650 °C. The temperature was kept constant for 10 min.

3.3. N2O Catalytic Decomposition

Catalytic decomposition of N2O was performed in an integral fixed bed stainless steel reactor with internal diameter of 5 mm in the temperature range of 300–450 °C and under atmospheric pressure. Total flow rate was 100 mL min−1 (NTP). The catalyst bed contained 0.1 or 0.3 g of samples with particle sizes in the range 0.160–0.315 mm. The space velocity 20–60 l g−1 h−1 was applied. Inlet gas contained 0.1 mol. % N2O balanced by helium. Moreover, 5 mol. % oxygen, 0.9 or 3 mol. % water vapor, 0.01 mol. % NO and 0.01 mol. % NO2 were added to some catalytic runs. The catalyst was pre-treated in He flow at 450 °C for 1 h. Then, the catalyst was cooled to the reaction temperature and the steady state of N2O concentration level was measured. Absolute error of N2O conversion X (%) determination was determined as X ± 4 (%) from repeated catalytic runs. Kinetic constants of first order rate law (k) were determined from Equation (2),
k   =   n ˙ w   p .   ln   1 1   X
where n ˙ is total molar flow (mol s−1), w is weight of catalyst (g), p is atmospheric pressure and X is N2O conversion (-).
A mass spectrometer RGA 200 (Stanford Research Systems, Prevac, Rogów, Poland) and infrared analyser N2O (GMS 810 Series, Sick, Reute, Germany) were used for N2O analysis. In the case of the mass spectrometer, the mass/charge ratio of 44 was scanned and argon (0.3 mol. %) was applied as an internal standard for the instability elimination of the mass spectrometer. Data were acquired with UMS-TDS software. The content of the water vapor was determined from the measurements of temperature and relative humidity.

4. Conclusions

In this paper, the effect of calcination temperature on properties and catalytic activity of the Co-Mn-Al mixed oxide catalyst promoted with potassium was investigated. It was found that the increase in calcination temperature from 500 to 700 °C caused the gradual crystallization of Co-Mn-Al mixed oxide, which manifested itself in the decrease in Co2+/Co3+ and Mn3+/Mn4+ surface molar ratio, an increase in mean crystallite size, leading to lowering of specific surface area and worse reducibility. The catalyst surfaces of all catalysts were enriched by potassium and the increase in calcination temperature caused higher amounts of K atoms per unit of surface, which led to the increase in surface basicity and adsorbed amount of NO per unit surface.
In the inert gas and in the presence of O2 and H2O, the change in the physico-chemical properties due to the change in calcination temperature caused only slight catalytic activity decrease while a significant decrease was observed in wet acid stream. Observed NO inhibition was caused by the formation of surface mononitrosyl species bonded to tetrahedral metal sites or nitrite species, which are stable at reaction temperatures up to 450 °C and block active sites for N2O decomposition. The increase in number of these species with increasing calcination temperature was observed and was also reflected in differences in intrinsic activity expressed as kinetic constants normalized per unit surface.
A calcination temperature of 500 °C was concluded as the optimal temperature for the preparation of K-modified Co-Mn-Al mixed oxide catalyst for N2O decomposition in the tail gases from HNO3 production plant. The suitable position is downstream SCR NOx/NH3 where only small amounts of NOx can be present.

Supplementary Materials

The following are available online at https://www.mdpi.com/2073-4344/10/10/1134/s1, Figure S1: Deconvoluted XPS spectra of the individual elements of the catalysts, Figure S2: Signal of NO formed during TPD-CO2 analysis over K/Co4MnAlOx catalysts.

Author Contributions

Conceptualization, K.K., L.O.; Data curation, K.K., K.J., M.K. and D.F.; Investigation, K.P., K.J., D.F., M.K. and L.O.; Methodology, K.P.; Supervision, L.O.; Writing—original draft, K.K.; Writing—review and editing, K.P., K.J. and L.O. All authors have read and agreed to the published version of the manuscript.

Funding

This research was funded by ERDF “Institute of Environmental Technology-Excellent Research” (No.CZ.02.1.01/0.0/0.0/16_019/0000853). Experimental results were accomplished by using Large Research Infrastructure ENREGAT (LM2018098) supported by the Ministry of Education, Youth and Sports of the Czech Republic.

Acknowledgments

Authors are grateful to Žaneta Chromčáková for catalytic measurements and Vlastimil Matějka for XRD analyses.

Conflicts of Interest

The authors declare no conflict of interest. The funders had no role in the design of the study; in the collection, analyses, or interpretation of data; in the writing of the manuscript, or in the decision to publish the results.

References

  1. Konsolakis, M. Recent Advances on Nitrous Oxide (N2O) Decomposition over Non-Noble-Metal Oxide Catalysts: Catalytic Performance, Mechanistic Considerations, and Surface Chemistry Aspects. ACS Catal. 2015, 5, 6397–6421. [Google Scholar] [CrossRef]
  2. Karásková, K.; Obalová, L.; Jirátová, K.; Kovanda, F. Effect of promoters in Co-Mn-Al mixed oxide catalyst on N2O decomposition. Chem. Eng. J. 2010, 160, 480–487. [Google Scholar] [CrossRef]
  3. Obalová, L.; Jirátová, K.; Kovanda, F.; Pacultová, K.; Lacný, Z.; Mikulová, Z. Catalytic decomposition of nitrous oxide over catalysts prepared from Co/Mg-Mn/Al hydrotalcite-like compounds. Appl. Catal. B Environ. 2005, 60, 289–297. [Google Scholar] [CrossRef]
  4. Obalová, L.; Kovanda, F.; Jirátová, K.; Pacultová, K.; Lacný, Z. Application of calcined layered double hydroxides as catalysts for abatement of N2O emissions. Collect. Czech. Chem. Commun. 2008, 73, 1045–1060. [Google Scholar] [CrossRef]
  5. Piskorz, W.; Zasada, F.; Stelmachowski, P.; Kotarba, A.; Sojka, Z. Decomposition of N2O over the surface of cobalt spinel: A DFT account of reactivity experiments. Catal. Today 2008, 137, 418–422. [Google Scholar] [CrossRef]
  6. Stelmachowski, P.; Ciura, K.; Grzybek, G. Morphology-dependent reactivity of cobalt oxide nanoparticles in N2O decomposition. Catal. Sci. Technol. 2016, 6, 5554–5560. [Google Scholar] [CrossRef]
  7. Wojcik, S.; Grzybek, G.; Stelmachowski, P.; Sojka, Z.; Kotarba, A. Bulk, Surface and Interface Promotion of Co3O4 for the Low-Temperature N2O Decomposition Catalysis. Catalysts 2020, 10, 41. [Google Scholar] [CrossRef] [Green Version]
  8. Wojcik, S.; Thersleff, T.; Gebska, K.; Grzybek, G.; Kotarba, A. Atomic-Level Dispersion of Bismuth over Co3O4 Nanocrystals-Outstanding Promotional Effect in Catalytic DeN2O. Catalysts 2020, 10, 51. [Google Scholar] [CrossRef] [Green Version]
  9. Cavani, F.; Trifirò, F.; Vaccari, A. Hydrotalcite-type anionic clays: Preparation, properties and applications. Catal. Today 1991, 11, 173–301. [Google Scholar] [CrossRef]
  10. Vaccari, A. Clays and catalysis: A promising future. Appl. Clay Sci. 1999, 14, 161–198. [Google Scholar] [CrossRef]
  11. Pérez-Ramírez, J.; Overeijnder, J.; Kapteijn, F.; Moulijn, J.A. Structural promotion and stabilizing effect of Mg in the catalytic decomposition of nitrous oxide over calcined hydrotalcite-like compounds. Appl. Catal. B Environ. 1999, 23, 59–72. [Google Scholar] [CrossRef]
  12. Obalová, L.; Karásková, K.; Jirátová, K.; Kovanda, F. Effect of potassium in calcined Co-Mn-Al layered double hydroxide on the catalytic decomposition of N2O. Appl. Catal. B Environ. 2009, 90, 132–140. [Google Scholar] [CrossRef]
  13. Klyushina, A.; Pacultová, K.; Karásková, K.; Jirátová, K.; Ritz, M.; Fridrichová, D.; Volodarskaja, A.; Obalová, L. Effect of preparation method on catalytic properties of Co-Mn-Al mixed oxides for N2O decomposition. J. Mol. Catal. A Chem. 2016, 425, 237–247. [Google Scholar] [CrossRef]
  14. Obalová, L.; Karásková, K.; Wach, A.; Kustrowski, P.; Mamulová-Kutláková, K.; Michalik, S.; Jirátová, K. Alkali metals as promoters in Co-Mn-Al mixed oxide for N2O decomposition. Appl. Catal. A Gen. 2013, 462, 227–235. [Google Scholar] [CrossRef]
  15. Abu-Zied, B.M.; Soliman, S.A.; Abdellah, S.E. Enhanced direct N2O decomposition over CuxCo1−xCo2O4 (0.0 ≤ x ≤ 1.0) spinel-oxide catalysts. J. Ind. Eng. Chem. 2015, 21, 814–821. [Google Scholar] [CrossRef]
  16. De Roy, A.; Forano, C.; Besse, J.P. Layered Double Hydroxides: Present and Future; Nova Science Publishers: New York, NY, USA, 2001; pp. 1–39. [Google Scholar]
  17. Chmielarz, L.; Rutkowska, M.; Kustrowski, P.; Drozdek, M.; Piwowarska, Z.; Dudek, B.; Dziembaj, R.; Michalik, M. An influence of thermal treatment conditions of hydrotalcite-like materials on their catalytic activity in the process of N2O decomposition. J. Therm. Anal. Calorim. 2011, 105, 161–170. [Google Scholar] [CrossRef] [Green Version]
  18. Kovanda, F.; Rojka, T.; Dobešová, J.; Machovič, V.; Bezdička, P.; Obalová, L.; Jirátová, K.; Grygar, T. Mixed oxides obtained from Co and Mn containing layered double hydroxides: Preparation, characterization, and catalytic properties. J. Solid State Chem. 2006, 179, 812–823. [Google Scholar] [CrossRef]
  19. Roman-Martinez, M.C.; Kapteijn, F.; Cazorla-Amoros, D.; Perez-Ramirez, J.; Moulijn, J.A. A TEOM-MS study on the interaction of N2O with a hydrotalcite-derived multimetallic mixed oxide catalyst. Appl. Catal. A Gen. 2002, 225, 87–100. [Google Scholar] [CrossRef]
  20. Tao, Y.X.; Yu, J.J.; Liu, C.C.; Hao, Z.P. N2O catalytic decomposition over mixed oxides derived from Co-Mg/Al hydrotalcite-like compounds. Acta Phys. Chim. Sin. 2007, 23, 162–168. [Google Scholar]
  21. Xu, X.-L.; Xu, X.-F.; Zhang, G.-T.; Niu, X.-J. Preparation of Co-Al mixed oxide-supported gold catalysts and their catalytic activity for N2O decomposition. J. Fuel Chem. Technol. 2009, 37, 595–600. [Google Scholar] [CrossRef]
  22. Cheng, H.; Huang, Y.; Wang, A.; Li, L.; Wang, X.; Zhang, T. N2O decomposition over K-promoted Co-Al catalysts prepared from hydrotalcite-like precursors. Appl. Catal. B Environ. 2009, 89, 391–397. [Google Scholar] [CrossRef]
  23. Pacultová, K.; Bílková, T.; Klegova, A.; Karásková, K.; Fridrichová, D.; Jirátová, K.; Kiška, T.; Balabánová, J.; Koštejn, M.; Kotarba, A.; et al. Co-Mn-Al Mixed Oxides Promoted by K for Direct NO Decomposition: Effect of Preparation Parameters. Catalysts 2019, 9, 593. [Google Scholar] [CrossRef] [Green Version]
  24. Grzybek, G.; Wójcik, S.; Legutko, P.; Gryboś, J.; Indyka, P.; Leszczyński, B.; Kotarba, A.; Sojka, Z. Thermal stability and repartition of potassium promoter between the support and active phase in the K-Co2.6Zn0.4O4|α-Al2O3 catalyst for N2O decomposition: Crucial role of activation temperature on catalytic performance. Appl. Catal. B Environ. 2017, 205, 597–604. [Google Scholar] [CrossRef]
  25. Obalová, L.; Jirátová, K.; Kovanda, F.; Valášková, M.; Balabánová, J.; Pacultová, K. Structure–activity relationship in the N2O decomposition over Ni-(Mg)-Al and Ni-(Mg)-Mn mixed oxides prepared from hydrotalcite-like precursors. J. Mol. Catal. A Chem. 2006, 248, 210–219. [Google Scholar] [CrossRef]
  26. Obalová, L.; Pacultová, K.; Balabánová, J.; Jirátová, K.; Bastl, Z.; Valášková, M.; Lacný, Z.; Kovanda, F. Effect of Mn/Al ratio in Co–Mn–Al mixed oxide catalysts prepared from hydrotalcite-like precursors on catalytic decomposition of N2O. Catal. Today 2007, 119, 233–238. [Google Scholar] [CrossRef]
  27. Obalová, L.; Maniak, G.; Karásková, K.; Kovanda, F.; Kotarba, A. Electronic nature of potassium promotion effect in Co-Mn-Al mixed oxide on the catalytic decomposition of N2O. Catal. Commun. 2011, 12, 1055–1058. [Google Scholar] [CrossRef] [Green Version]
  28. Pacultová, K.; Karásková, K.; Kovanda, F.; Jirátová, K.; Šramek, J.; Kustrowski, P.; Kotarba, A.; Chromčáková, Ž.; Kočí, K.; Obalová, L. K-doped Co-Mn-Al mixed oxide catalyst for N2O abatement from nitric acid plant waste gases: Pilot plant studies. Ind. Eng. Chem. Res. 2016, 55, 7076–7084. [Google Scholar] [CrossRef]
  29. Kovanda, F.; Grygar, T.; Dorničák, V.; Rojka, T.; Bezdička, P.; Jirátová, K. Thermal behaviour of Cu–Mg–Mn and Ni–Mg–Mn layered double hydroxides and characterization of formed oxides. Appl. Clay Sci. 2005, 28, 121–136. [Google Scholar] [CrossRef]
  30. Kannan, S.; Swamy, C.S. Catalytic decomposition of nitrous oxide over calcined cobalt aluminum hydrotalcites. Catal. Today 1999, 53, 725–737. [Google Scholar] [CrossRef]
  31. Atribak, I.; Guillén-Hurtado, N.; Bueno-López, A.; García-García, A. Influence of the physico-chemical properties of CeO2–ZrO2 mixed oxides on the catalytic oxidation of NO to NO2. Appl. Surf. Sci. 2010, 256, 7706–7712. [Google Scholar] [CrossRef]
  32. Biesinger, M.C.; Payne, B.P.; Grosvenor, A.P.; Lau, L.W.M.; Gerson, A.R.; Smart, R.S. Resolving surface chemical states in XPS analysis of first row transition metals, oxides and hydroxides: Cr, Mn, Fe, Co and Ni. Appl. Surf. Sci. 2011, 257, 2717–2730. [Google Scholar] [CrossRef]
  33. Hagelin-Weaver, H.A.E.; Hoflund, G.B.; Minahan, D.A.; Salaita, G.N. Electron energy loss spectroscopic investigation of Co metal, CoO, and Co3O4 before and after Ar+ bombardment. Appl. Surf. Sci. 2004, 235, 420–448. [Google Scholar] [CrossRef]
  34. Chromčáková, Ž.; Obalová, L.; Kovanda, F.; Legut, D.; Titov, A.; Ritz, M.; Fridrichová, D.; Michalik, S.; Kuśtrowski, P.; Jirátová, K. Effect of precursor synthesis on catalytic activity of Co3O4 in N2O decomposition. Catal. Today 2015, 257, 18–25. [Google Scholar] [CrossRef]
  35. Langell, M.A.; Gevrey, F.; Nydegger, M.W. Surface composition of MnxCo1-xO solid solutions by X-ray photoelectron and Auger spectroscopies. Appl. Surf. Sci. 2000, 153, 114–127. [Google Scholar] [CrossRef] [Green Version]
  36. Iablokov, V.; Barbosa, R.; Pollefeyt, G.; Van Driessche, I.; Chenakin, S.; Kruse, N. Catalytic CO Oxidation over Well-Defined Cobalt Oxide Nanoparticles: Size-Reactivity Correlation. ACS Catal. 2015, 5, 5714–5718. [Google Scholar] [CrossRef]
  37. Wang, Y.Z.; Hu, X.B.; Zheng, K.; Wei, X.H.; Zhao, Y.X. Effect of SnO2 on the structure and catalytic performance of Co3O4 for N2O decomposition. Catal. Commun. 2018, 111, 70–74. [Google Scholar] [CrossRef]
  38. Abu-Zied, B.M.; Bawaked, S.M.; Kosa, S.A.; Schwieger, W. Effect of microwave power on the thermal genesis of Co3O4 nanoparticles from cobalt oxalate micro-rods. Appl. Surf. Sci. 2015, 351, 600–609. [Google Scholar] [CrossRef]
  39. Lykaki, M.; Papista, E.; Kaklidis, N.; Carabineiro, S.A.C.; Konsolakis, M. Ceria Nanoparticles’ Morphological Effects on the N2O Decomposition Performance of Co3O4/CeO2 Mixed Oxides. Catalysts 2019, 9, 233. [Google Scholar] [CrossRef] [Green Version]
  40. Kim, S.C.; Shim, W.G. Catalytic combustion of VOCs over a series of manganese oxide catalysts. Appl. Catal. B Environ. 2010, 98, 180–185. [Google Scholar] [CrossRef]
  41. Moulder, J.F.; Stickle, W.F.; Sobol, P.E.; Bomben, K.D. Handbookof X-ray Photoeletron Spectroscopy: A Reference Book of Standard Spectra for Identification and Interpretation of XPS Data; Perkin-Elmer Corporation: Eden Prairie, MN, USA, 1995. [Google Scholar]
  42. Dupin, J.C.; Gonbeau, D.; Vinatier, P.; Levasseur, A. Systematic XPS studies of metal oxides, hydroxides and peroxides. Phys. Chem. Chem. Phys. 2000, 2, 1319–1324. [Google Scholar] [CrossRef]
  43. Piumetti, M.; Bensaid, S.; Russo, N.; Fino, D. Nanostructured ceria-based catalysts for soot combustion: Investigations on the surface sensitivity. Appl. Catal. B Environ. 2015, 165, 742–751. [Google Scholar] [CrossRef]
  44. Chuang, T.J.; Brundle, C.R.; Rice, D.W. Interpretation of X-ray Photoemission spectra of cobalt oxides and cobalt oxide surfaces. Surf. Sci. 1976, 59, 413–429. [Google Scholar] [CrossRef]
  45. Li, W.; Yang, S.S.; Wang, K.L.; Tu, S.H.; Lu, M.J.; Wu, P.X. Evaluation of the physiochemical properties and catalytic performance of CuCoMnAl mixed oxides derived from layered double hydroxides precursors with different mole ratios of Cu/Co on the oxidation of toluene. React. Kinet. Mech. Catal. 2019, 128, 965–977. [Google Scholar] [CrossRef]
  46. Chen, H.H.; Yang, M.; Tao, S.; Chen, G.W. Oxygen vacancy enhanced catalytic activity of reduced Co3O4 towards p-nitrophenol reduction. Appl. Catal. B Environ. 2017, 209, 648–656. [Google Scholar] [CrossRef]
  47. Luo, Y.J.; Zheng, Y.B.; Zuo, J.C.; Feng, X.S.; Wang, X.Y.; Zhang, T.H.; Zhang, K.; Jiang, L.L. Insights into the high performance of Mn-Co oxides derived from metal organic frameworks for total toluene oxidation. J. Hazard. Mater. 2018, 349, 119–127. [Google Scholar] [CrossRef]
  48. Kaczmarczyk, J.; Zasada, F.; Janas, J.; Indyka, P.; Piskorz, W.; Kotarba, A.; Sojka, Z. Thermodynamic Stability, Redox Properties, and Reactivity of Mn3O4, Fe3O4, and Co3O4 Model Catalysts for N2O Decomposition: Resolving the Origins of Steady Turnover. ACS Catal. 2016, 6, 1235–1246. [Google Scholar] [CrossRef]
  49. Jung, D.H.; Umirov, N.; Kim, T.; Bakenov, Z.; Kim, J.S.; Kim, S.S. Thermal and Structural Stabilities of LixCoO2 Cathode for Li Secondary Battery Studied by a Temperature Programmed Reduction. Eurasian Chem. Technol. J. 2019, 21, 3–12. [Google Scholar] [CrossRef]
  50. Lin, H.Y.; Chen, Y.W. The mechanism of reduction of cobalt by hydrogen. Mater. Chem. Phys. 2004, 85, 171–175. [Google Scholar] [CrossRef]
  51. Calgaro, C.O.; Perez-Lopez, O.W. Decomposition of methane over Co3-xAlxO4 (x = 0-2) coprecipitated catalysts: The role of Co phases in the activity and stability. Int. J. Hydrog. Energy 2017, 42, 29756–29772. [Google Scholar] [CrossRef]
  52. Wang, Z.; Jiang, Z.; Shangguan, W. Simultaneous catalytic removal of NOx and soot particulate over Co–Al mixed oxide catalysts derived from hydrotalcites. Catal. Commun. 2007, 8, 1659–1664. [Google Scholar] [CrossRef]
  53. Arnoldy, P.; van Oers, E.M.; Bruinsma, O.S.L.; de Beer, V.H.J.; Moulijn, J.A. Temperature-Programmed Reduction of Al2O3-, SiO2-, and carbon-supported Re2O7 catalysts. J. Catal. 1985, 93, 231–245. [Google Scholar] [CrossRef] [Green Version]
  54. Wu, M.; Zhan, W.; Guo, Y.; Guo, Y.; Wang, Y.; Wang, L.; Lu, G. An effective Mn-Co mixed oxide catalyst for the solvent-free selective oxidation of cyclohexane with molecular oxygen. Appl. Catal. A Gen. 2016, 523, 97–106. [Google Scholar] [CrossRef]
  55. Kapteijn, F.; Singoredjo, L.; Andreini, A.; Moulijn, J.A. Activity and selectivity of pure manganese oxides in the selective catalytic reduction of nitric-oxide with ammonia. Appl. Catal. B Environ. 1994, 3, 173–189. [Google Scholar] [CrossRef]
  56. Arena, F.; Torre, T.; Raimondo, C.; Parmaliana, A. Structure and redox properties of bulk and supported manganese oxide catalysts. Phys. Chem. Chem. Phys. 2001, 3, 1911–1917. [Google Scholar] [CrossRef]
  57. Royer, S.; Bérubé, F.; Kaliaguine, S. Effect of the synthesis conditions on the redox and catalytic properties in oxidation reactions of LaCo1−xFexO3. Appl. Catal. A Gen. 2005, 282, 273–284. [Google Scholar] [CrossRef]
  58. Smoláková, L.; Frolich, K.; Troppová, I.; Kutálek, P.; Kroft, E.; Čapek, L. Determination of basic sites in Mg-Al mixed oxides by combination of TPD-CO2 and CO2 adsorption calorimetry. J. Therm. Anal. Calorim. 2017, 127, 1921–1929. [Google Scholar] [CrossRef]
  59. Kotarba, A.; Bieniasz, W.; Kuśtrowski, P.; Stadnicka, K.; Sojka, Z. Composite ferrite catalyst for ethylbenzene dehydrogenation: Enhancement of potassium stability and catalytic performance by phase selective doping. Appl. Catal. A Gen. 2011, 407, 100–105. [Google Scholar] [CrossRef]
  60. Kotarba, A.; Kruk, I.; Sojka, Z. Energetics of Potassium Loss from Styrene Catalyst Model Components: Reassignment of K Storage and Release Phases. J. Catal. 2002, 211, 265–272. [Google Scholar] [CrossRef]
  61. Pinho, P.V.B.; Grybos, J.; Hudy, C.; Janas, J.; Gora-Marek, K.; Zasada, F.; Sojka, Z. Interaction of nitric oxide with the (100) surface of cobalt spinel nanocubes—A comprehensive DFT, atomistic thermodynamic, IR and TPD account. Appl. Surf. Sci. 2020, 513, 10. [Google Scholar] [CrossRef]
  62. Pacultová, K.; Klegová, A.; Karásková, K.; Fridrichová, D.; Bílková, T.; Obalová, L. Oxygen effect in NO direct decomposition over K/Co-Mg-Mn-Al mixed oxide catalyst-temperature programmed desorption study. J. Catal. 2020. submitted. [Google Scholar]
  63. Bílková, T.; Pacultová, K.; Karásková, K.; Fridrichová, D.; Obalová, L.; Haneda, M. Reaction mechanism of NO direct decomposition over K-promoted Co-Mn-Al mixed oxides–DRIFTS, TPD and transient kinetic studies. Appl. Surf. Sci. submitted. 2020. [Google Scholar]
  64. Alvarez, P.; Aguila, G.; Guerrero, S.; Araya, P. Thermal stability of the Cu-CeO2 interface on silica and alumina, and its relation with activity in the oxidation reaction of Co and the decomposition of N2O. J. Chil. Chem. Soc. 2018, 63, 4102–4108. [Google Scholar] [CrossRef] [Green Version]
  65. Pacultová, K.; Karásková, K.; Strakošová, J.; Jirátová, K.; Obalová, L. Supported Co–Mn–Al mixed oxides as catalysts for N2O decomposition. Comptes Rendus Chim. 2015, 18, 1114–1122. [Google Scholar] [CrossRef]
  66. Obalová, L.; Fíla, V. Kinetic analysis of N2O decomposition over calcined hydrotalcites. Appl. Catal. B Environ. 2007, 70, 353–359. [Google Scholar] [CrossRef]
  67. Zasada, F.; Stelmachowski, P.; Maniak, G.; Paul, J.F.; Kotarba, A.; Sojka, Z. Potassium Promotion of Cobalt Spinel Catalyst for N2O Decomposition-Accounted by Work Function Measurements and DFT Modelling. Catal. Lett. 2009, 127, 126–131. [Google Scholar] [CrossRef]
  68. Del Río, L.; Marbán, G. Stainless steel wire mesh-supported potassium-doped cobalt oxide catalysts for the catalytic decomposition of nitrous oxide. Appl. Catal. B Environ. 2012, 126, 39–46. [Google Scholar] [CrossRef]
  69. Stelmachowski, P.; Zasada, F.; Piskorz, W.; Kotarba, A.; Paul, J.-F.; Sojka, Z. Experimental and DFT studies of N2O decomposition over bare and Co-doped magnesium oxide—Insights into the role of active sites topology in dry and wet conditions. Catal. Today 2008, 137, 423–428. [Google Scholar] [CrossRef]
  70. Asano, K.; Ohnishi, C.; Iwamoto, S.; Shioya, Y.; Inoue, M. Potassium-doped Co3O4 catalyst for direct decomposition of N2O. Appl. Catal. B Environ. 2008, 78, 242–249. [Google Scholar] [CrossRef]
  71. Nguyen, H.P.; Del Valle, S.P.; Marie, O. NOx adsorption on K and Ba loaded on zirconia-titania NSR catalysts: A comparative study by in situ and operando IR spectroscopy. Appl. Catal. B Environ. 2018, 231, 391–399. [Google Scholar] [CrossRef]
Figure 1. Powder XRD patterns of the K/Co4MnAlOx mixed oxide calcined at different temperatures. S—spinel.
Catalysts 10 01134 g001
Figure 2. TPR-H2 patterns of the K/Co4MnAlOx mixed oxide calcined at different temperatures.
Catalysts 10 01134 g002
Figure 3. TPD-CO2 profiles of the K/Co4MnAlOx mixed oxide calcined at different temperatures.
Catalysts 10 01134 g003
Figure 4. NO signal from TPD-NO over (a) K/Co4MnAlOx-500 and (b) K/Co4MnAlOx-700.
Catalysts 10 01134 g004
Figure 5. Temperature dependence of N2O conversion over K/Co4MnAlOx mixed oxide calcined at different temperatures. Conditions: (a) 0.1 mol. % N2O balanced by He, (b) 0.1 mol. % N2O + 5 mol. % O2 + 0.9 mol. % H2O, (c) 0.1 mol. % N2O + 5 mol. % O2 + 0.9 mol. % H2O + 0.005 mol. % NO balanced by He (d) 0.1 mol. % N2O + 5 mol. % O2 + 3 mol. % H2O + 0.01 mol. % NO + 0.01 mol. % NO2 balanced by He, GHSV = 20 L g−1 h−1.
Catalysts 10 01134 g005
Figure 6. Time-on-stream, N2O catalytic decomposition in different reaction mixture over K/Co4MnAlOx calcined at 500 °C. Conditions: 450 °C, GHSV = 20 L g−1 h−1.
Catalysts 10 01134 g006
Figure 7. Kinetic constants of N2O catalytic decomposition at different reaction atmospheres (390 °C) over K/Co4MnAlOx mixed oxide calcined at different temperatures. Legend: (a) 0.1 mol. % N2O balanced by He; (b) 0.1 mol. % N2O + 5 mol. % O2 + 0.9 mol. % H2O balanced by He; (c) 0.1 mol. % N2O + 5 mol. % O2 + 3 mol. % H2O + 0.01 mol. % NO + 0.01 mol. % NO2 balanced by He.
Catalysts 10 01134 g007
Table 1. Physico-chemical properties of K/Co4MnAlOx mixed oxide calcined at different temperatures and activation energies of N2O catalytic decomposition in their presence.
SampleK/Co4MnAlOx-500K/Co4MnAlOx-600K/Co4MnAlOx-700
Co (wt.%)52.254.556.1
Mn (wt.%)11.011.511.8
Al (wt.%)5.05.25.2
K (wt.%)2.22.32.3
SBET (m2 g−1)987771
Vmeso (cm3 g−1)0.370.350.36
Lc a (nm)8.79.811.7
TPR-H2 (25–1000 °C) (mmol g−1)10.913.612.4
TPR-H2 (25–500 °C) (mmol g−1)3.64.53.8
Tmax b (°C)173; 387; 589; 776218; 434; 604; 754; 856229; 434; 625; 759; 856
(Co + Mn) mean oxidation state2.42.82.5
TPD-CO2 (28–650 °C) (mmol g−1)1.93.23.7
TPD-CO2 (28–650 °C) (mmol m−2)0.020.040.05
TPD-NO (50–650 °C) (a.u. g−1) c2.4; 8.3; 7.0; 11.8; 1.4n.d.1.2; 5.5; 14.7; 6.1
TPD-NO (50–650 °C) (a.u. m−2)0.30n.d.0.39
Ea (J mol−1) d104,423 e
117,626 f
188,013 g
88,452 e
107,907 f
160,576 g
97,315 e
136,848 f
167,477 g
a Mean crystallite size calculated from half-width of XRD peak S (311) using Scherrer’s formula. b Temperature maxima of reduction peaks from TPR-H2. c Area of individual peaks after deconvolution of NO signal. d Apparent activation energy evaluated from Arrhenius plot ln(k) = f(1/T). e 0.1 mol. % N2O balanced by He. f 0.1 mol. % N2O + 5 mol. % O2 + 0.9 mol. % H2O balanced by He. g 0.1 mol. % N2O + 5 mol. % O2 + 3 mol. % H2O + 0.01 mol. % NO + 0.01 mol. % NO2 balanced by He.
Table 2. Binding energies of core level electrons of catalysts and molar ratios of Co2+/Co3+ and Mn3+/Mn4+ ions.
SampleCo 2p3/2 aMn 2p3/2 bO 1sO 1sCo2+/Co3+Mn3+/Mn4+
K/Co4MnAlOx-500780.0641.9530.1531.81.322.88
K/Co4MnAlOx-600779.9641.6529.7531.31.302.72
K/Co4MnAlOx-700779.9641.5529.7531.41.262.68
a Position of the fitting peak corresponding to Co2+. b Position of the fitting peak corresponding to Mn3+.
Table 3. Surface concentration determined using X-ray photoelectron spectrometry.
SampleK/Co4MnAlOx-500K/Co4MnAlOx-600K/Co4MnAlOx-700
Co 2p (at. %)13.1612.5611.78
Mn 2p (at. %)3.765.055.24
Al 2p(at. %)7.727.447.86
O 1s (at. %)55.0851.8051.68
C 1s (at. %)13.5018.6818.21
K 2p (at. %)4.043.824.48
K (atoms nm−2)6.47.69.7
Na 1s (at. %)1.240.640.75
N 1s (at. %)1.5100
Table 4. Relation of surface to bulk concentrations of individual components.
Surface/Bulk Molar RatioK/Co4MnAlOx-500K/Co4MnAlOx-600K/Co4MnAlOx-700
Co0.50.40.4
Mn0.60.70.7
Al1.31.21.2
K2.32.02.3