Eco-Friendly Photocatalysts for Degradation of Dyes

 , ,
, ,  and
and
Abstract
:1. Introduction
2. Results
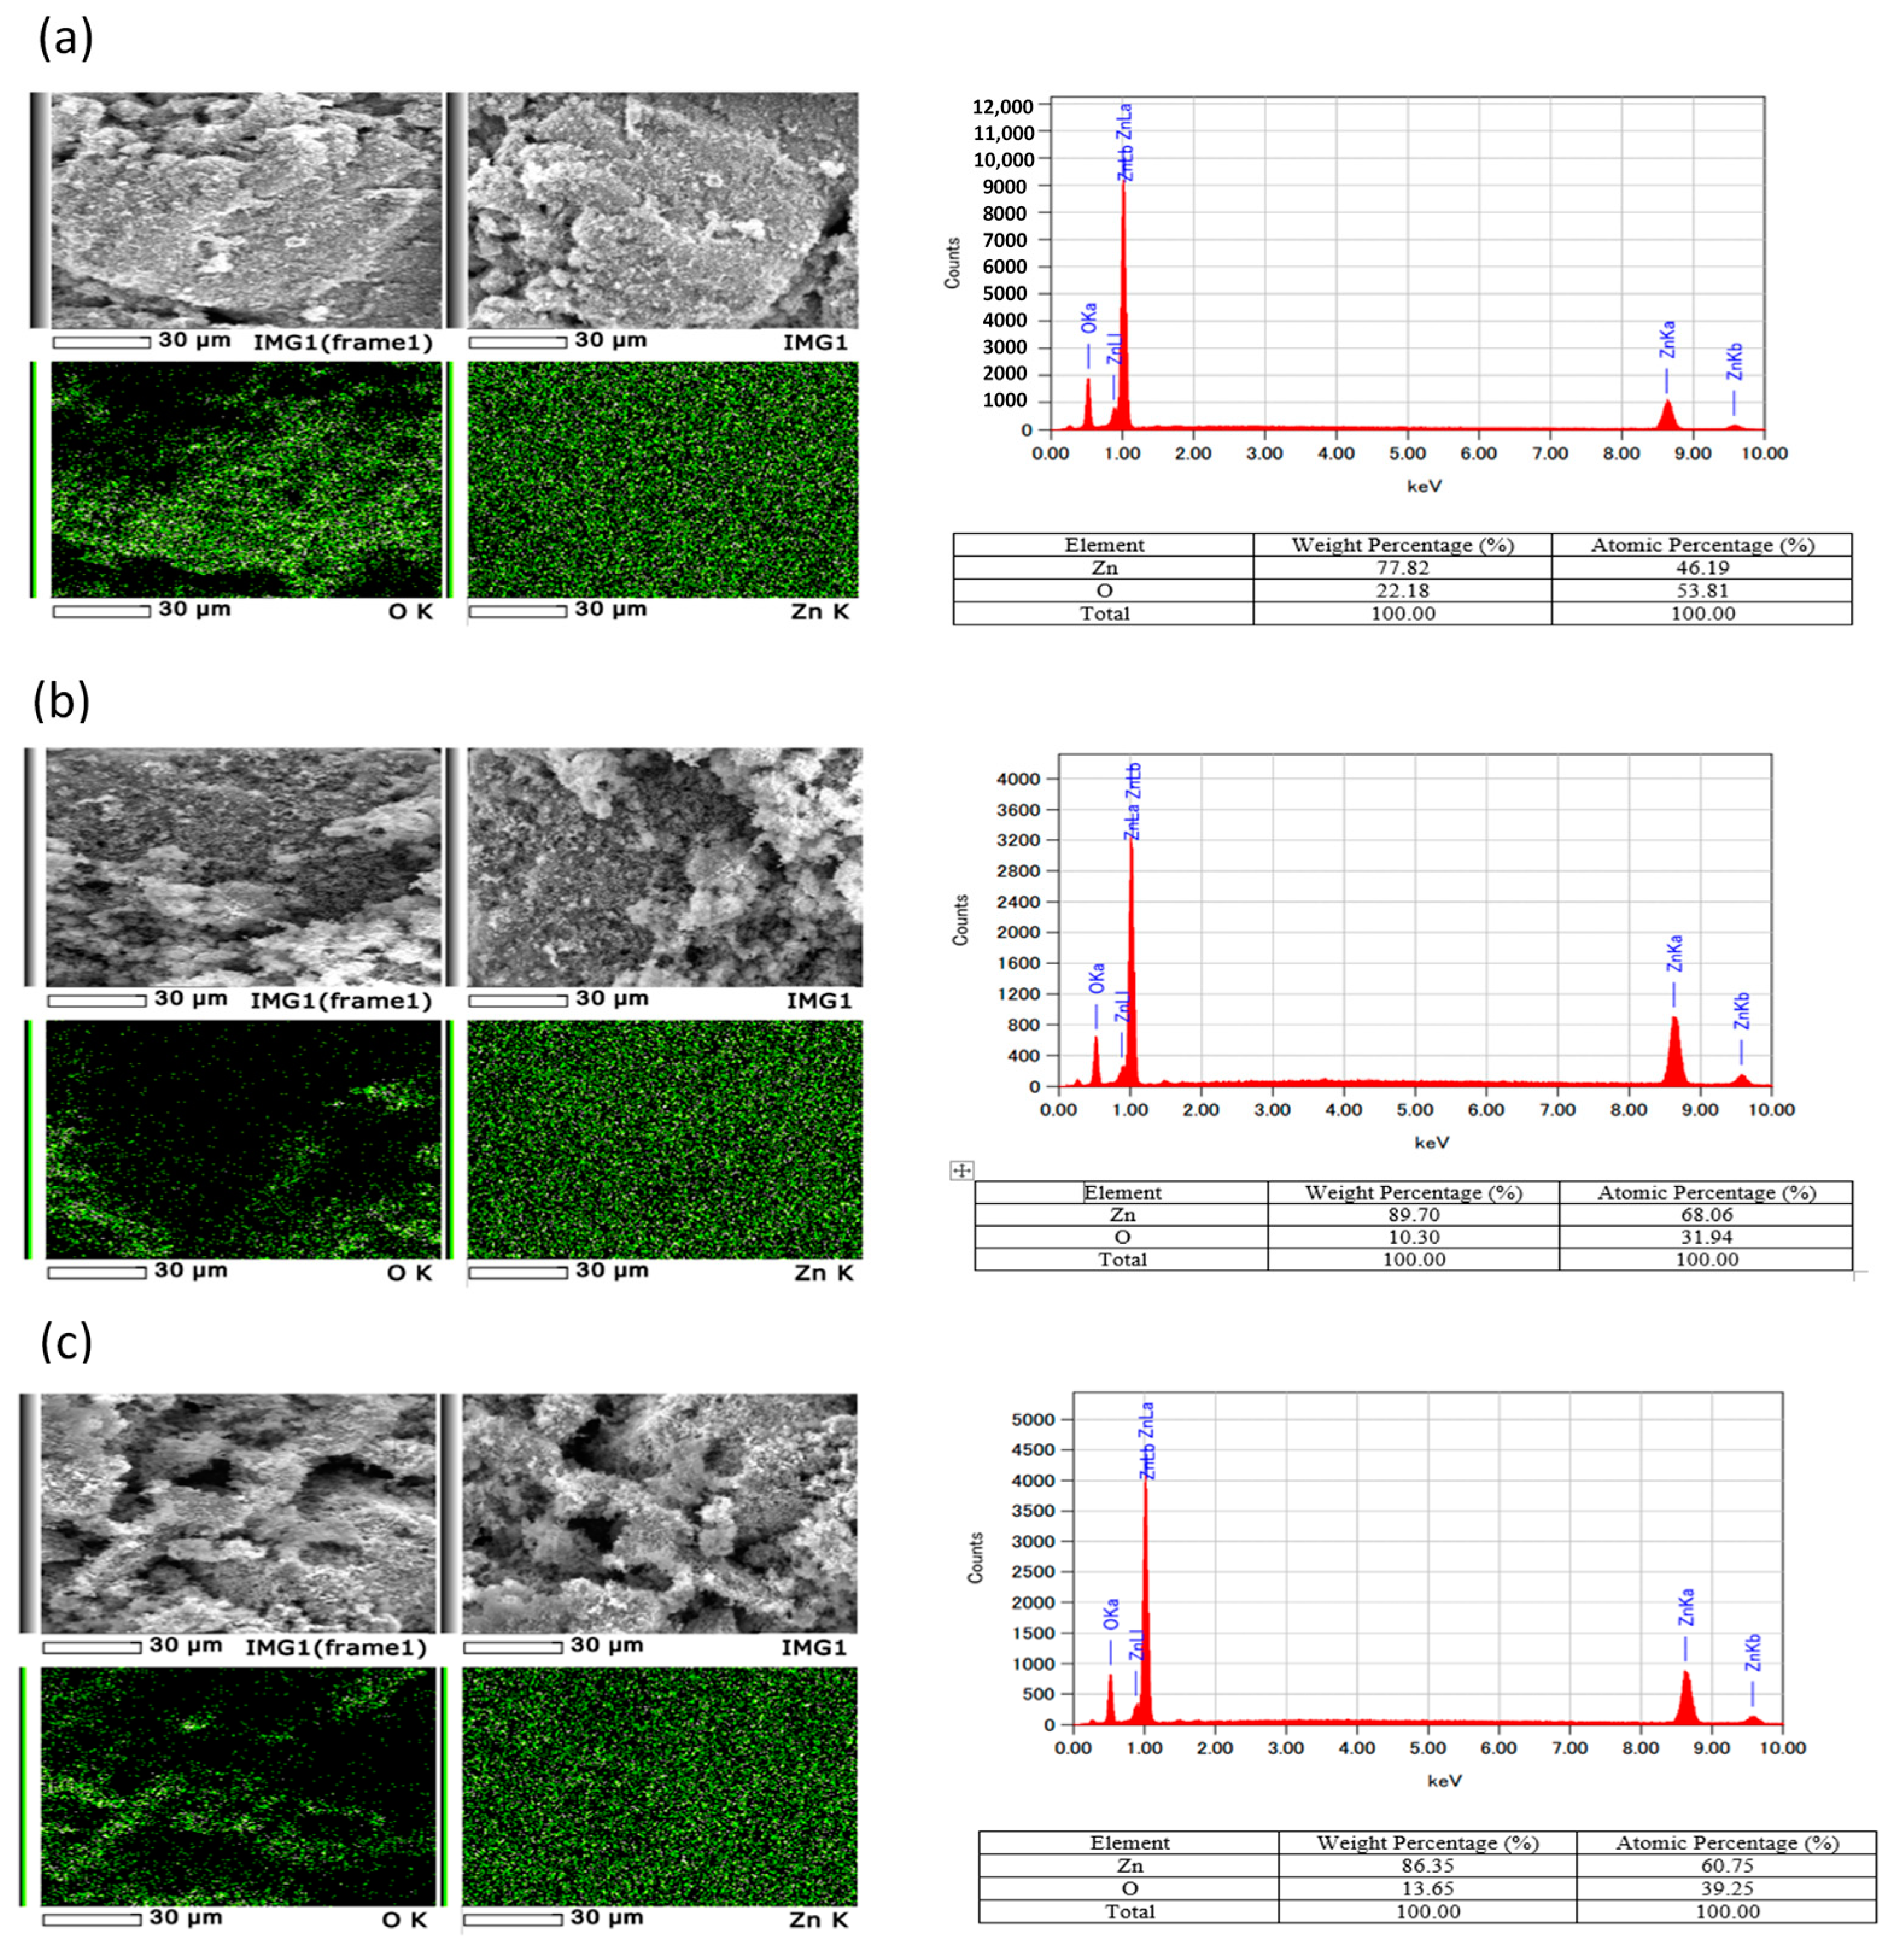
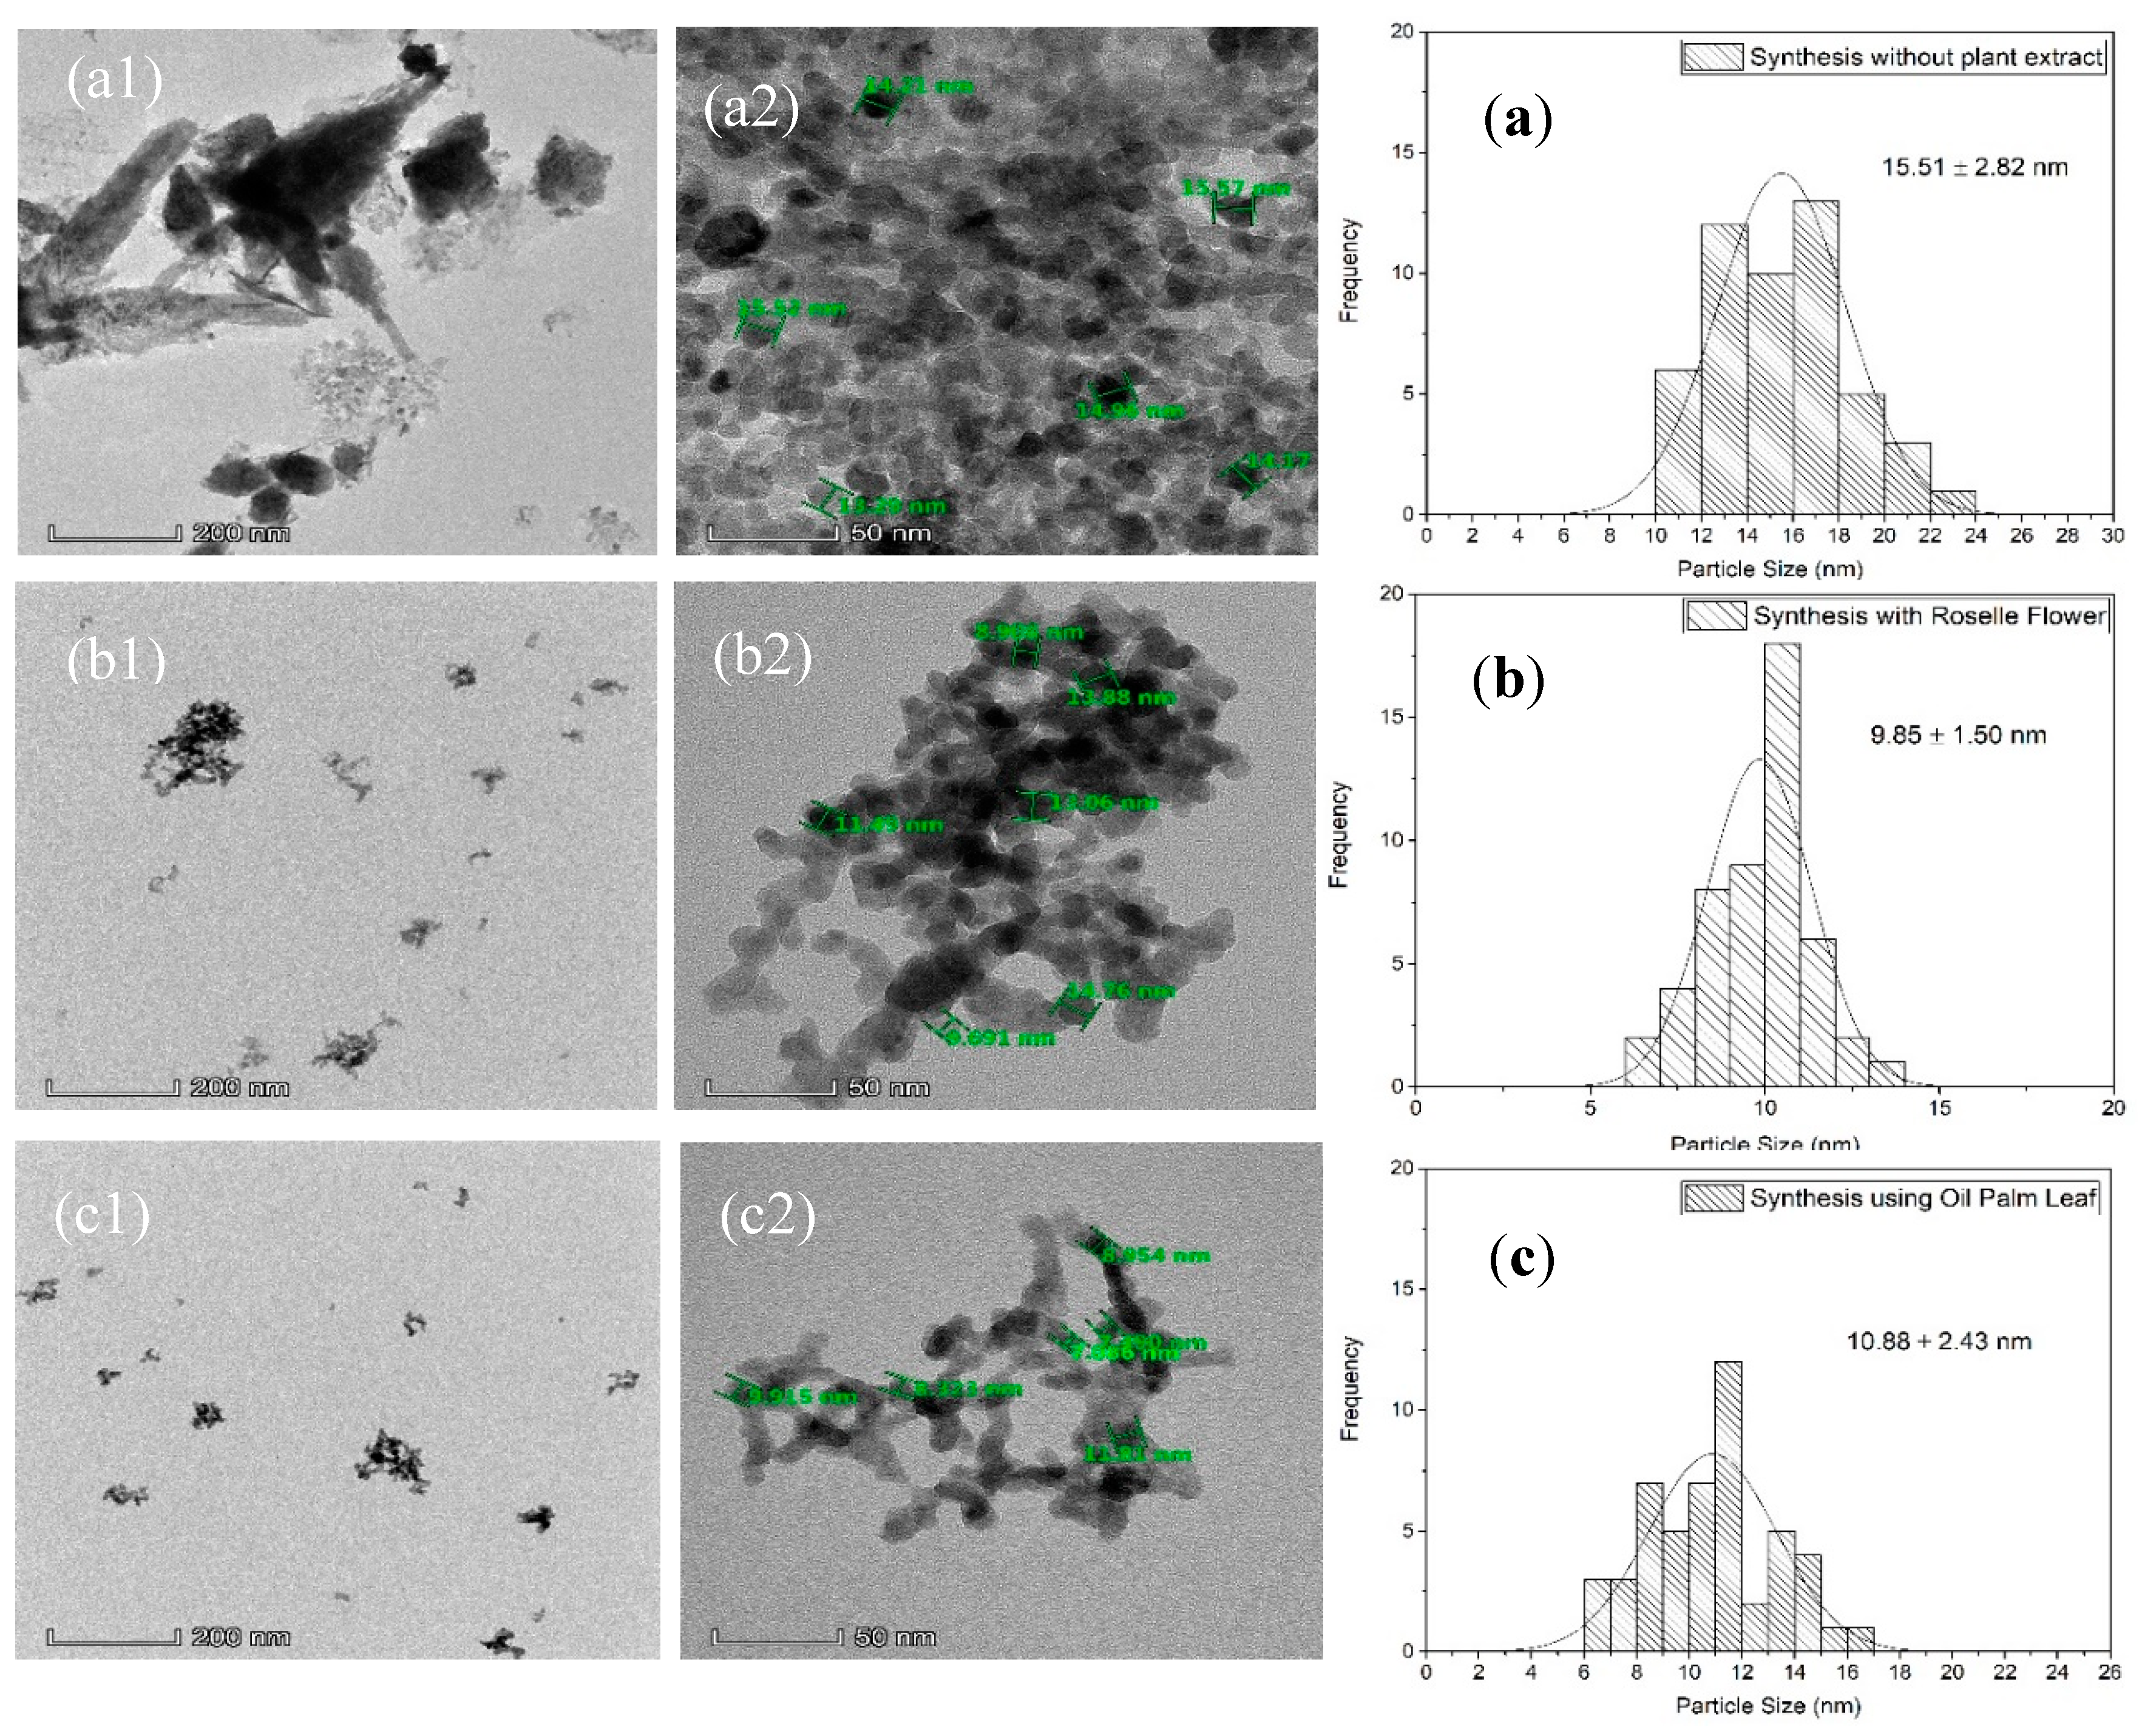
2.1. Morphology
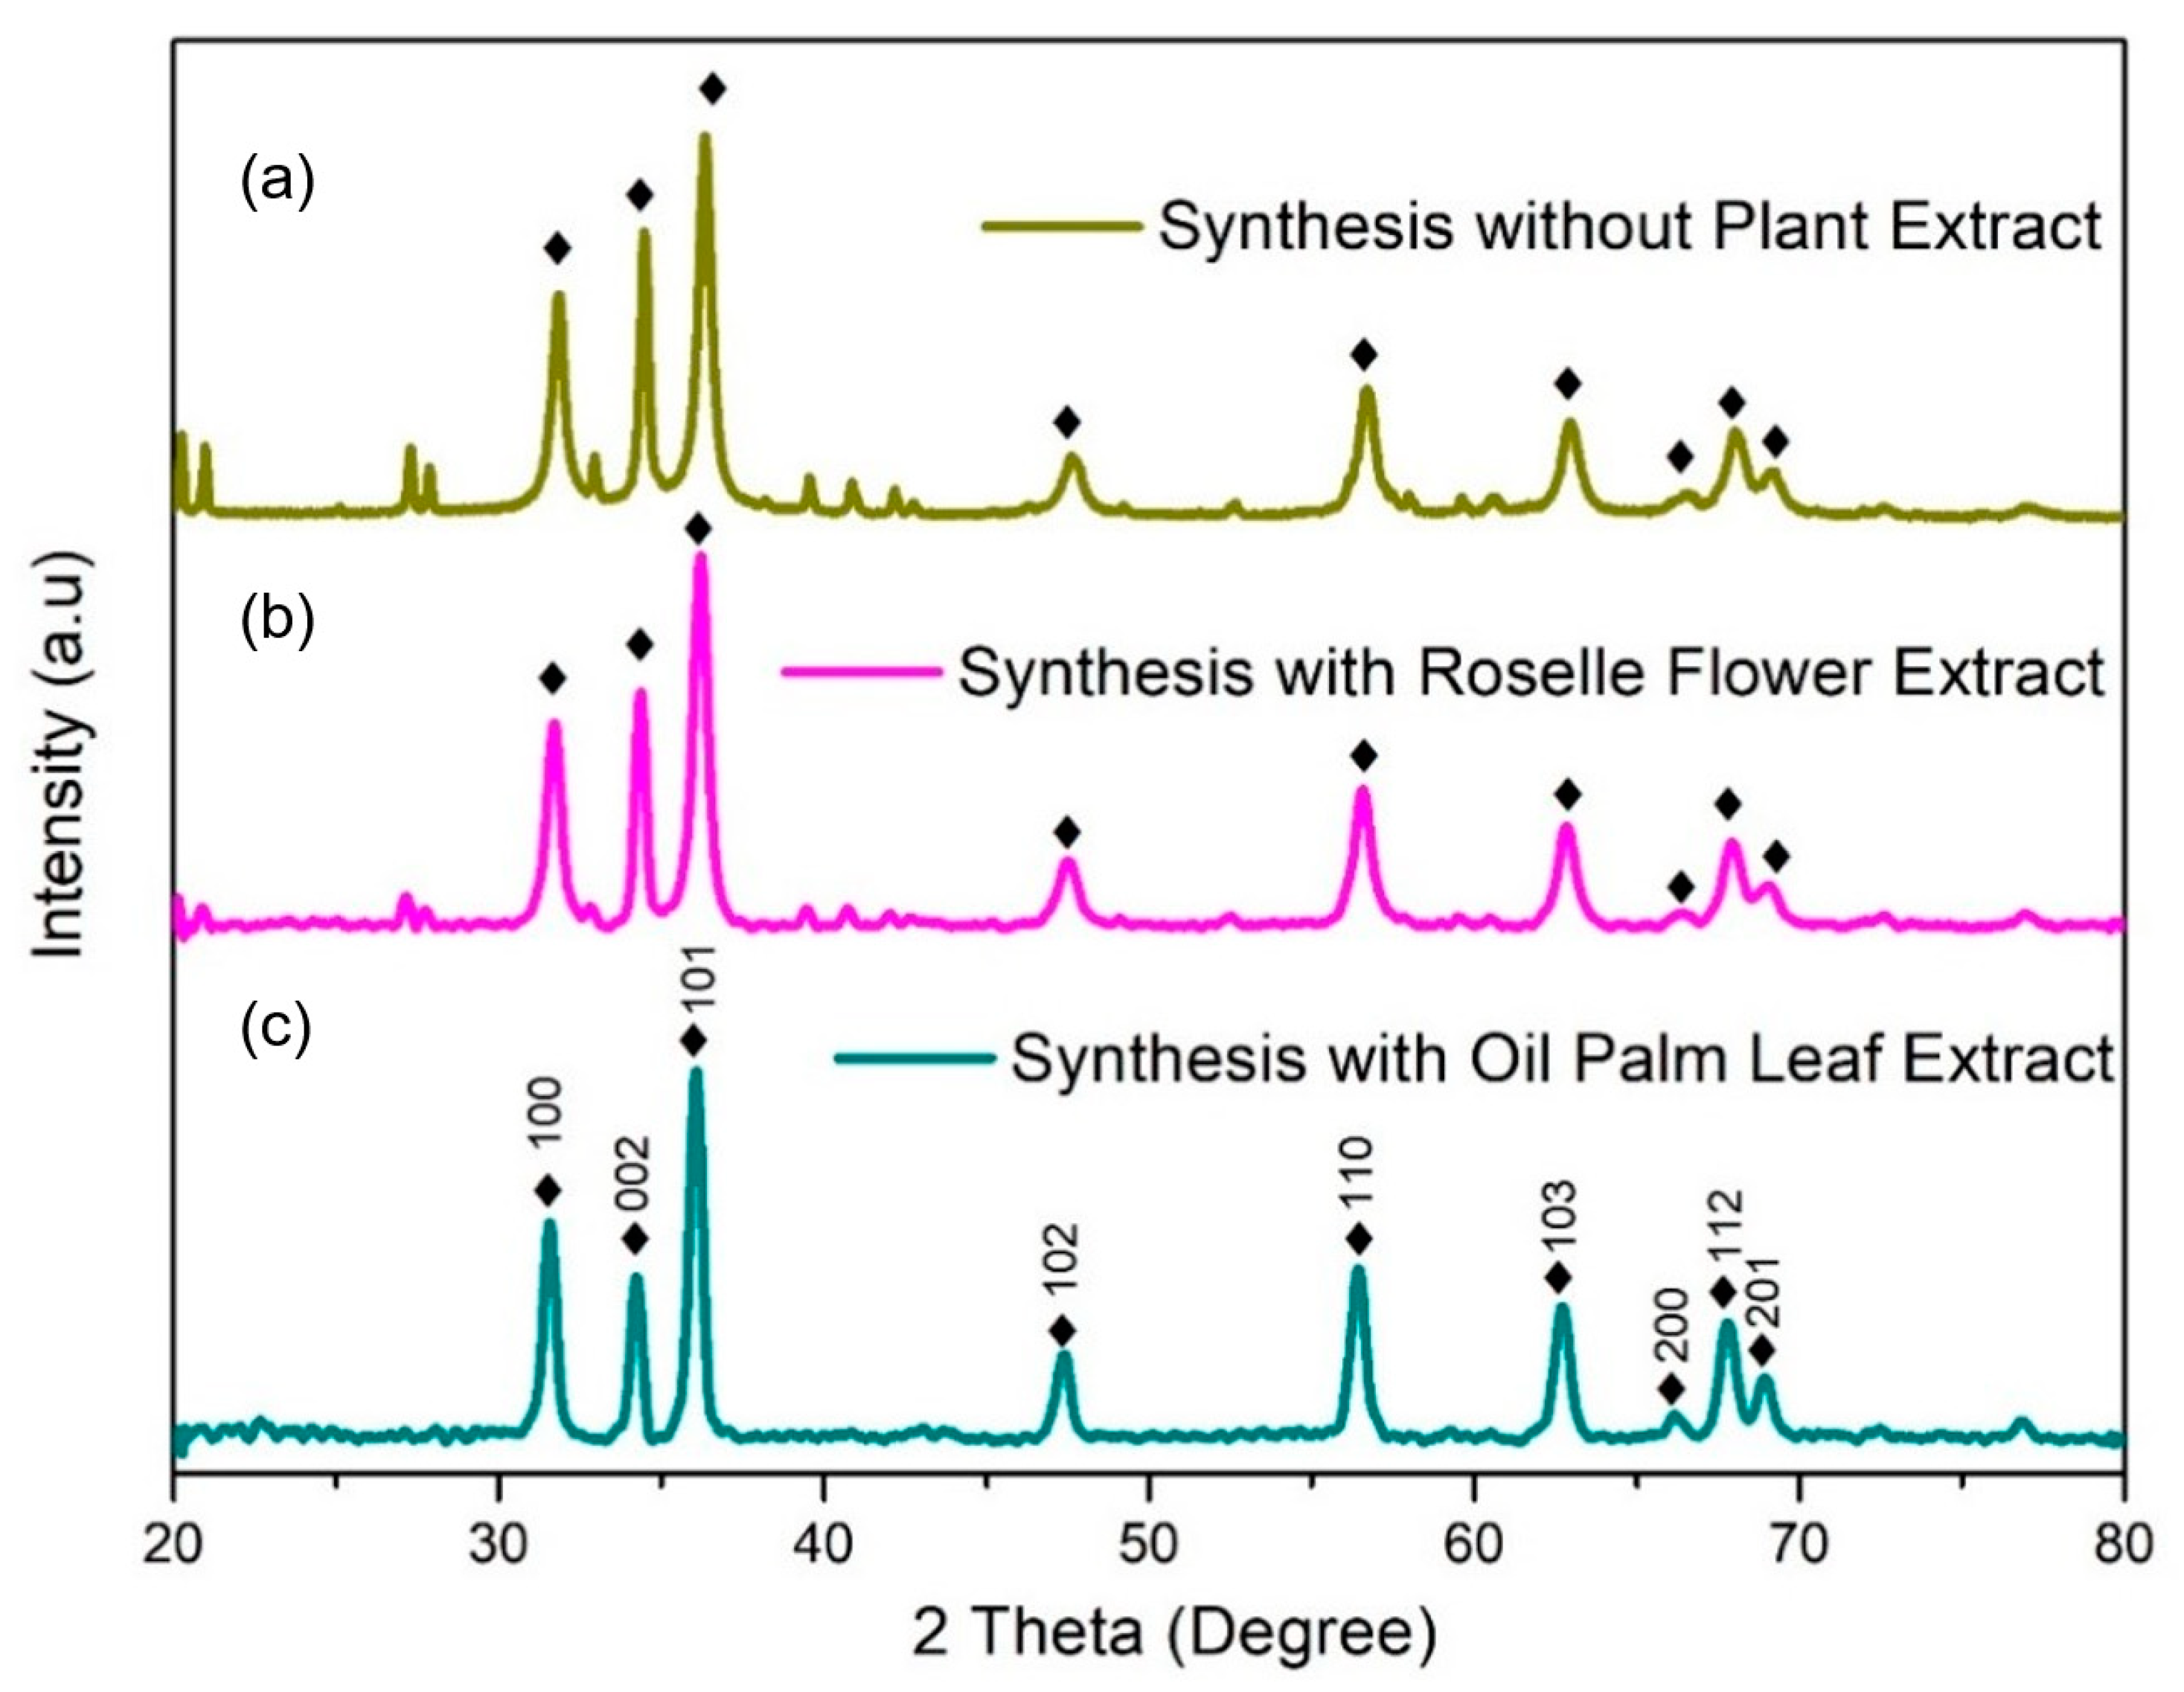
2.2. X-ray Diffractometer (XRD)
2.3. Fourier Transform Infrared Spectroscopy (FTIR)
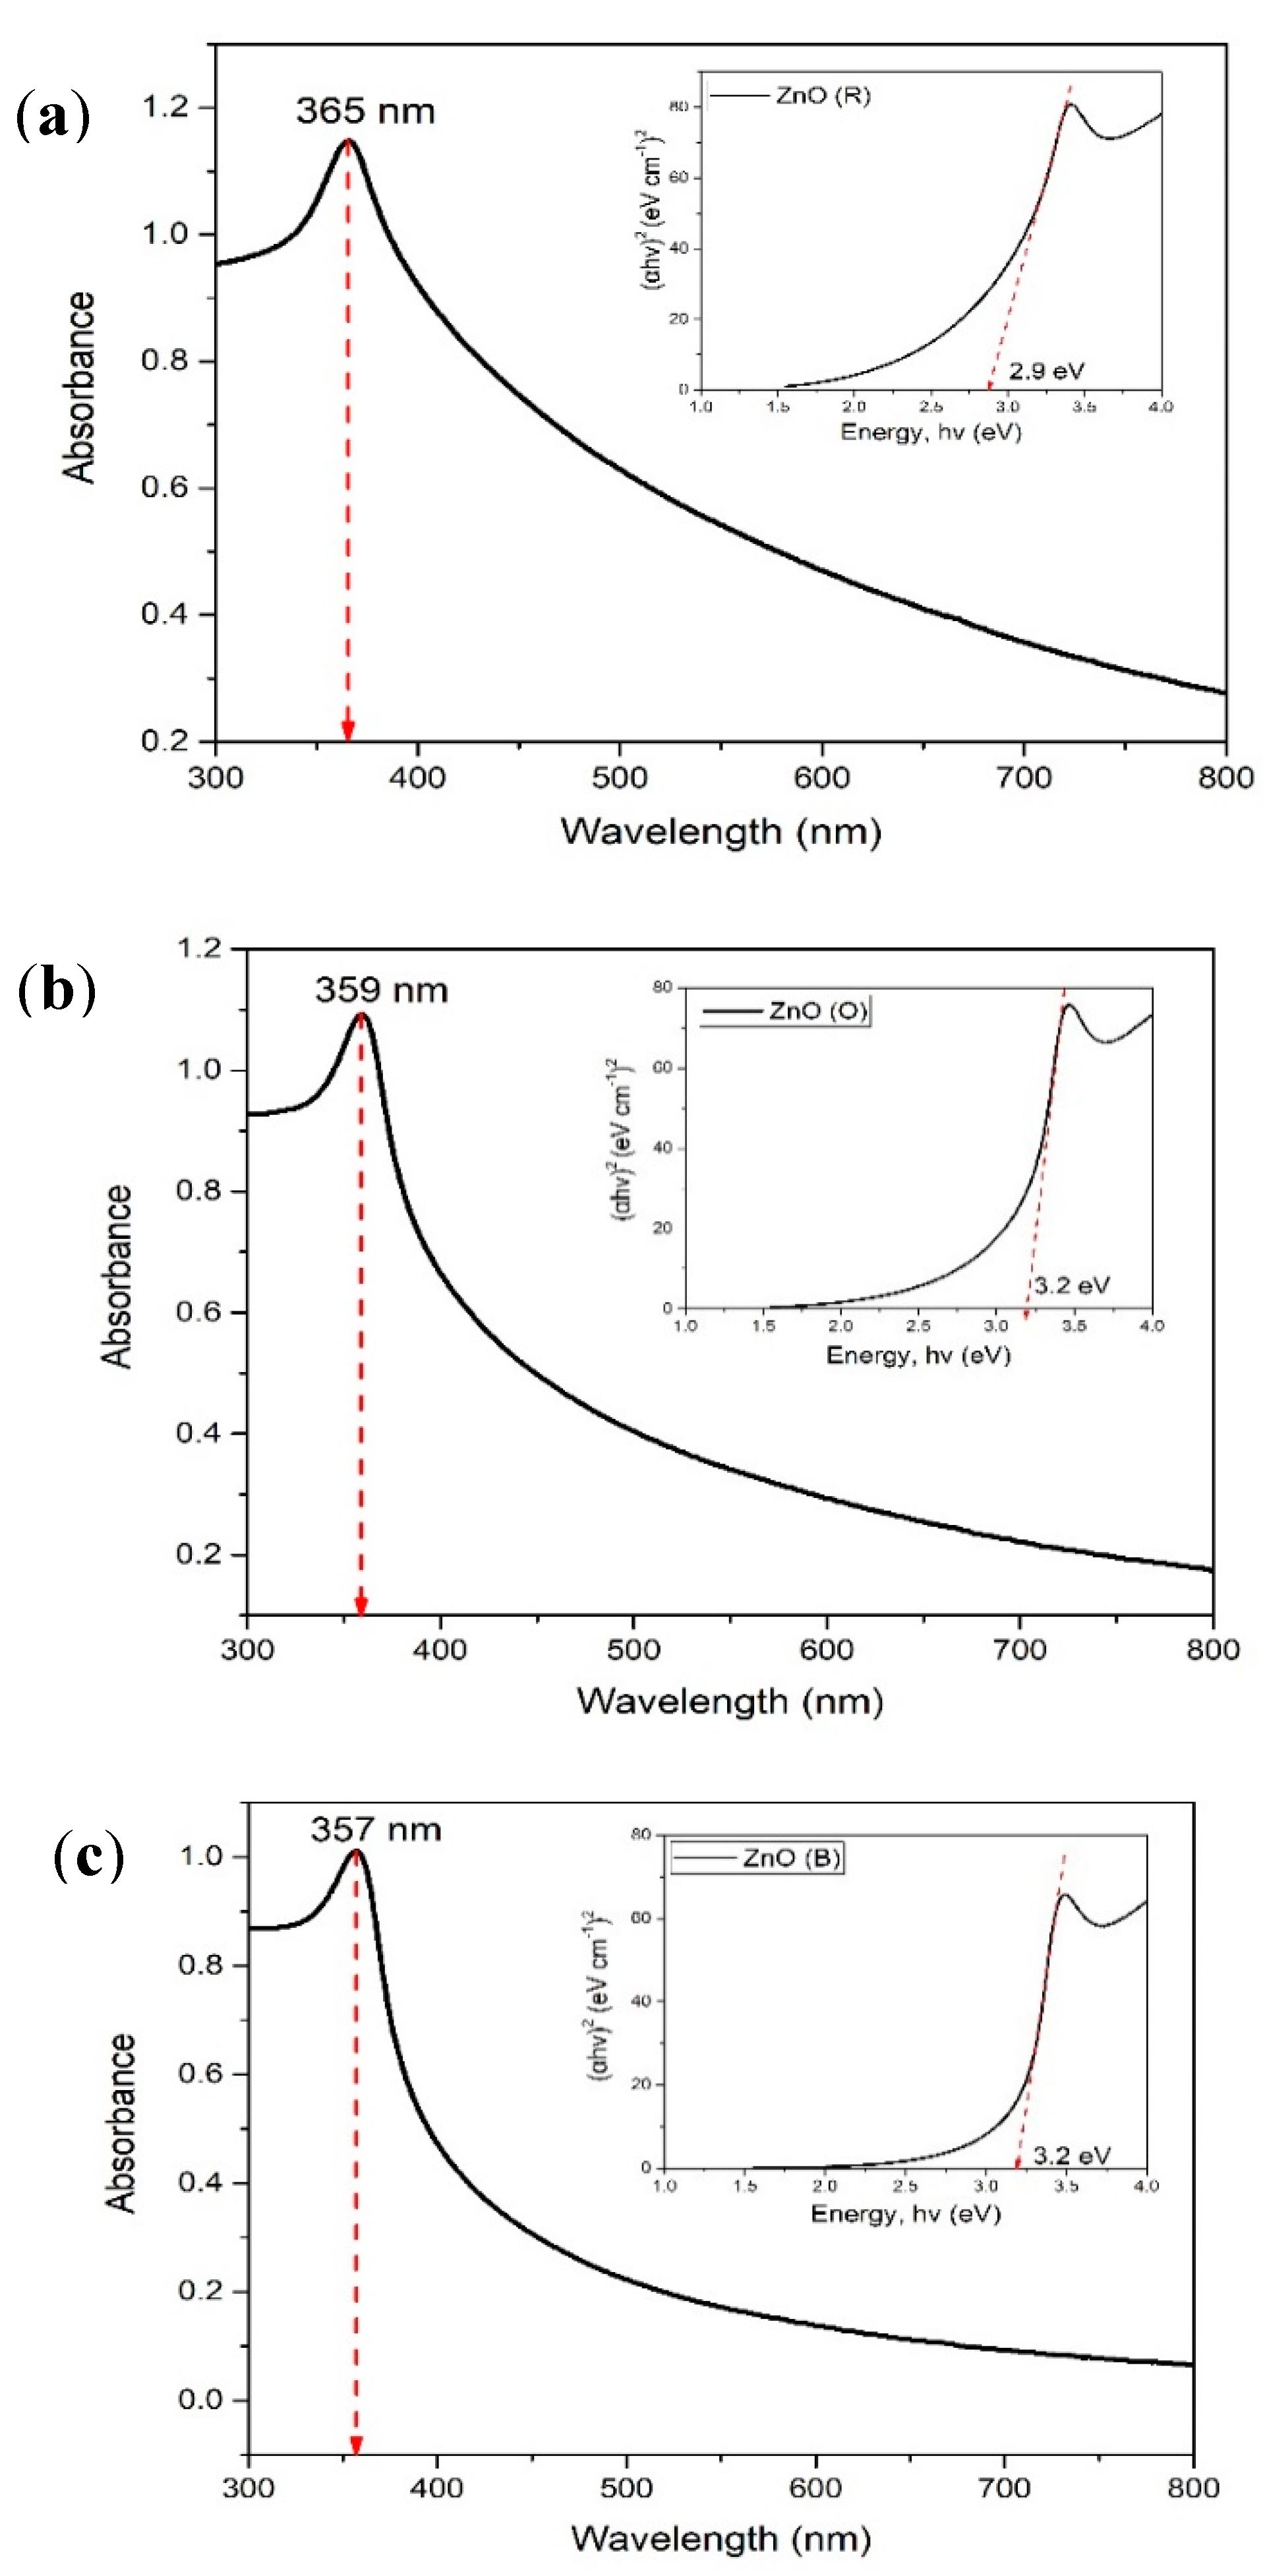
2.4. Ultraviolet-Visible Spectorscopy (UV-Vis)
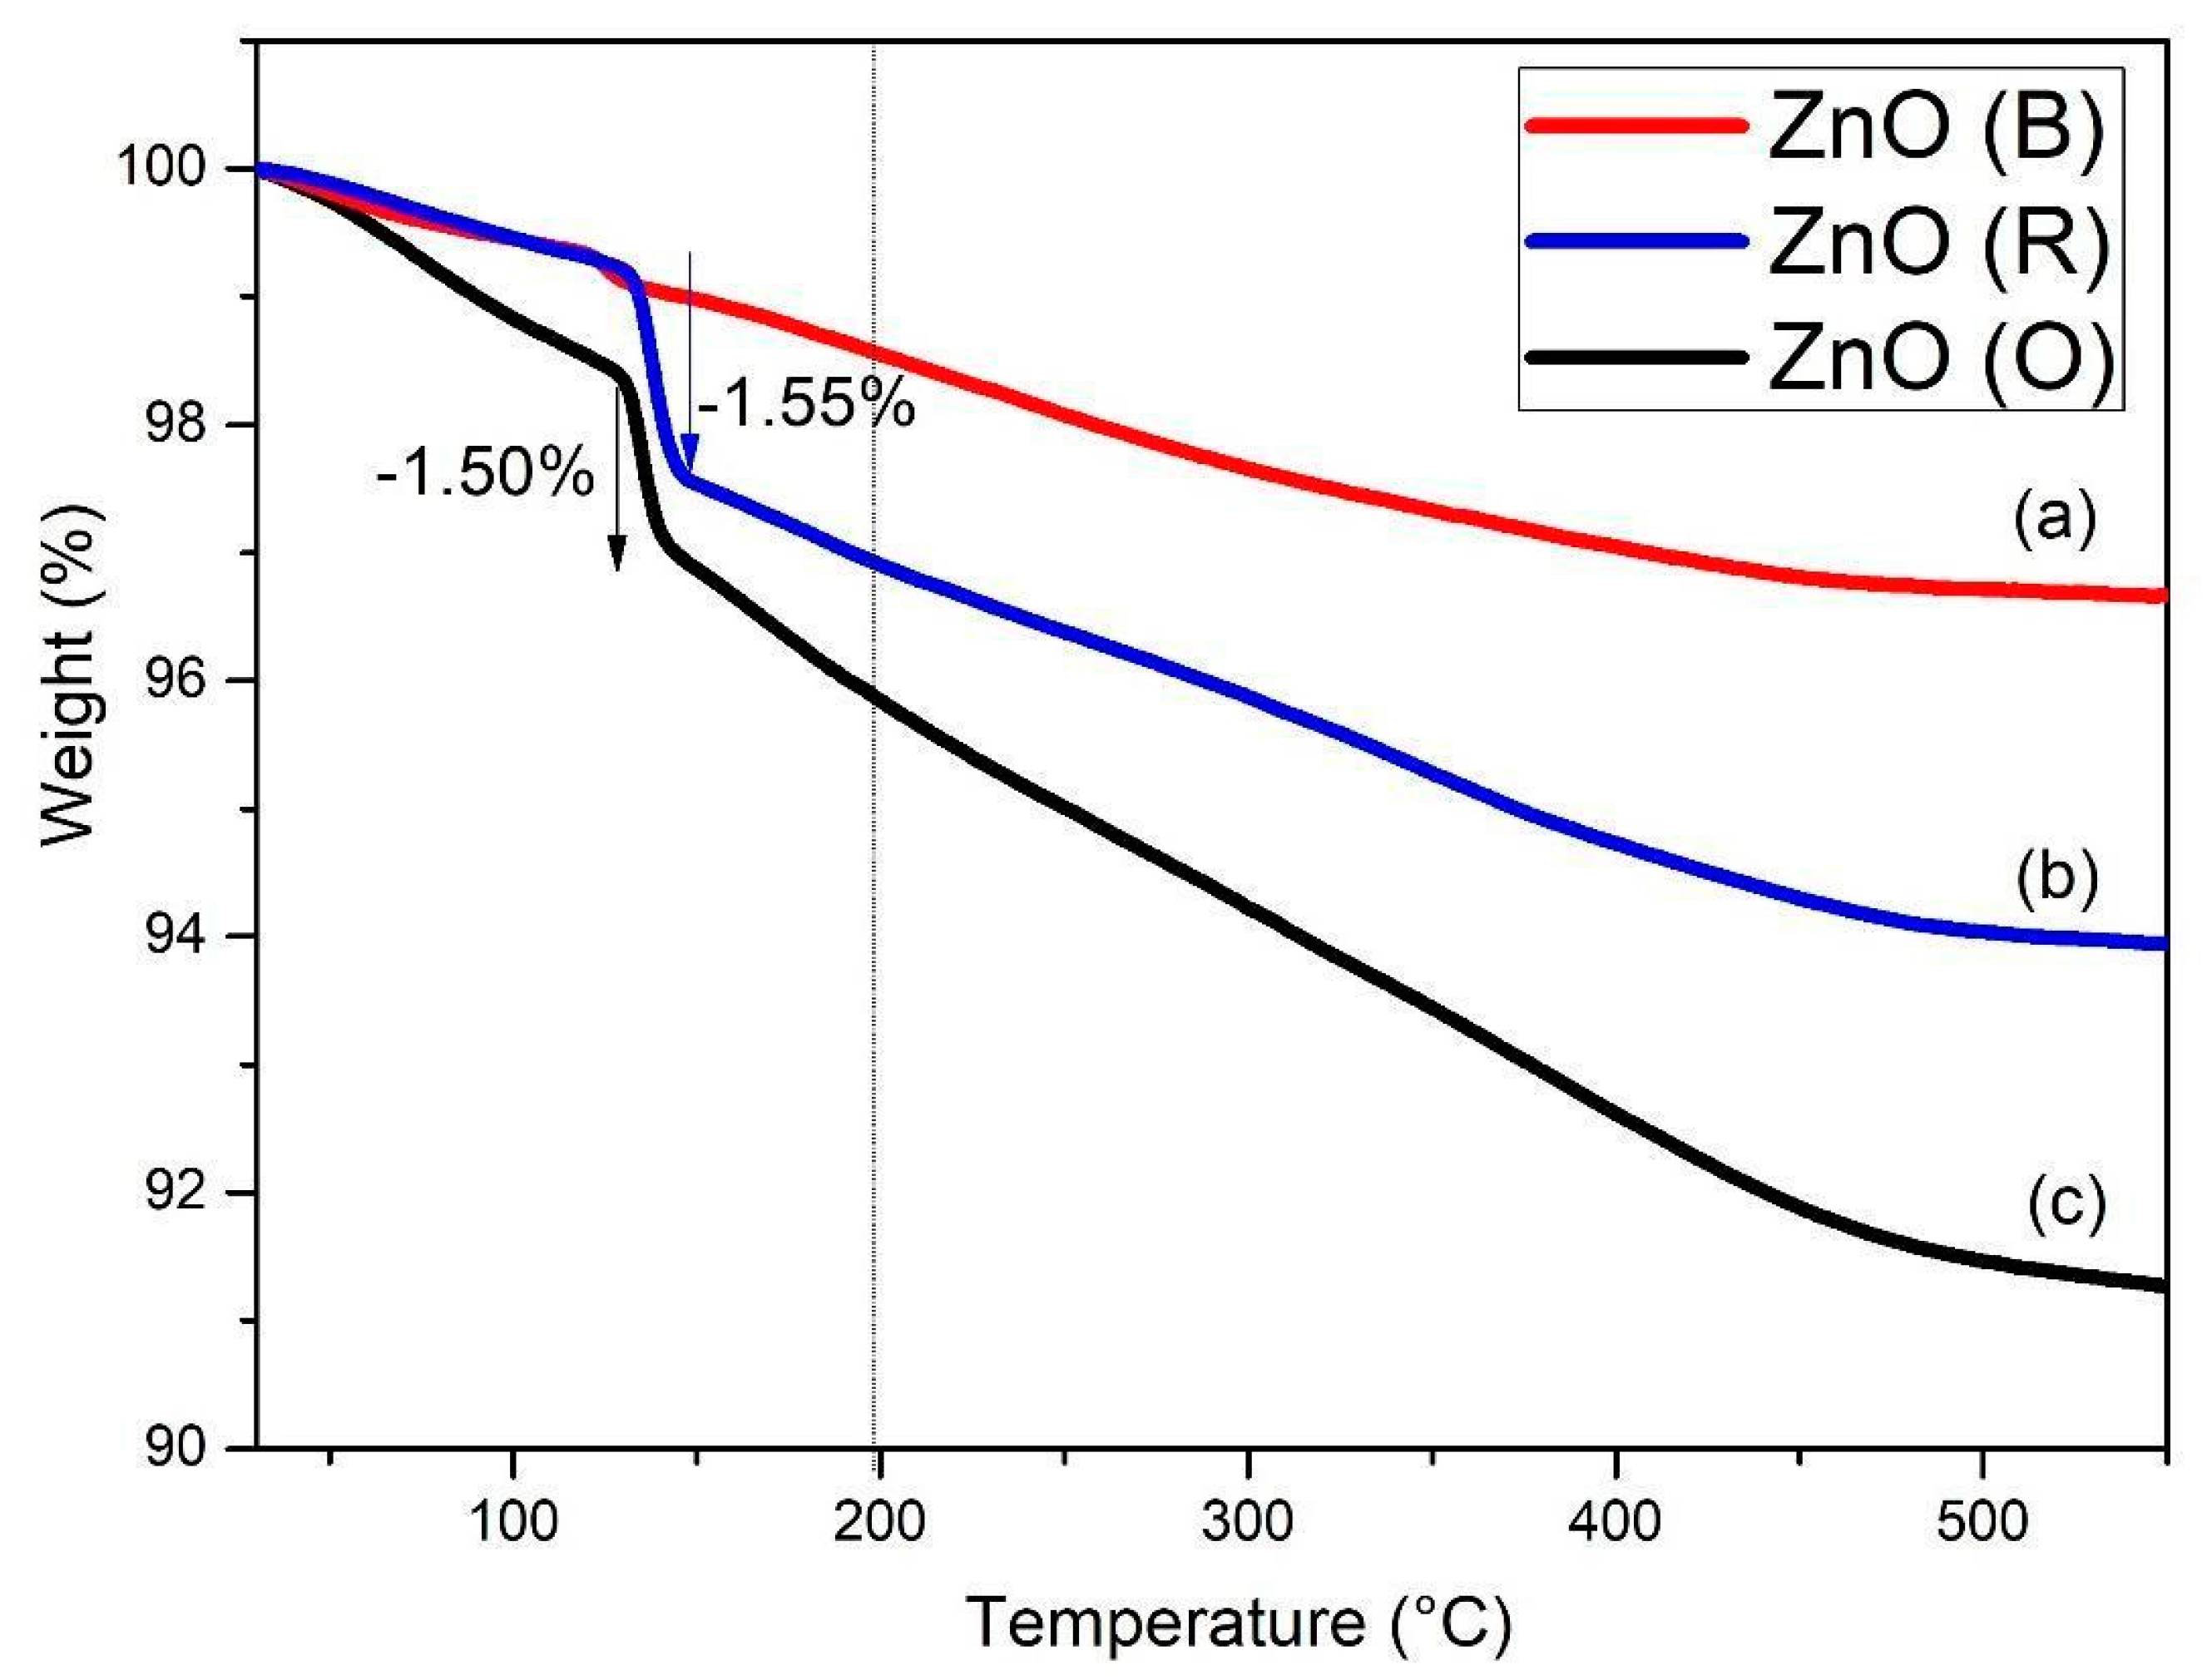
2.5. Thermogravimetric Analysis (TGA)
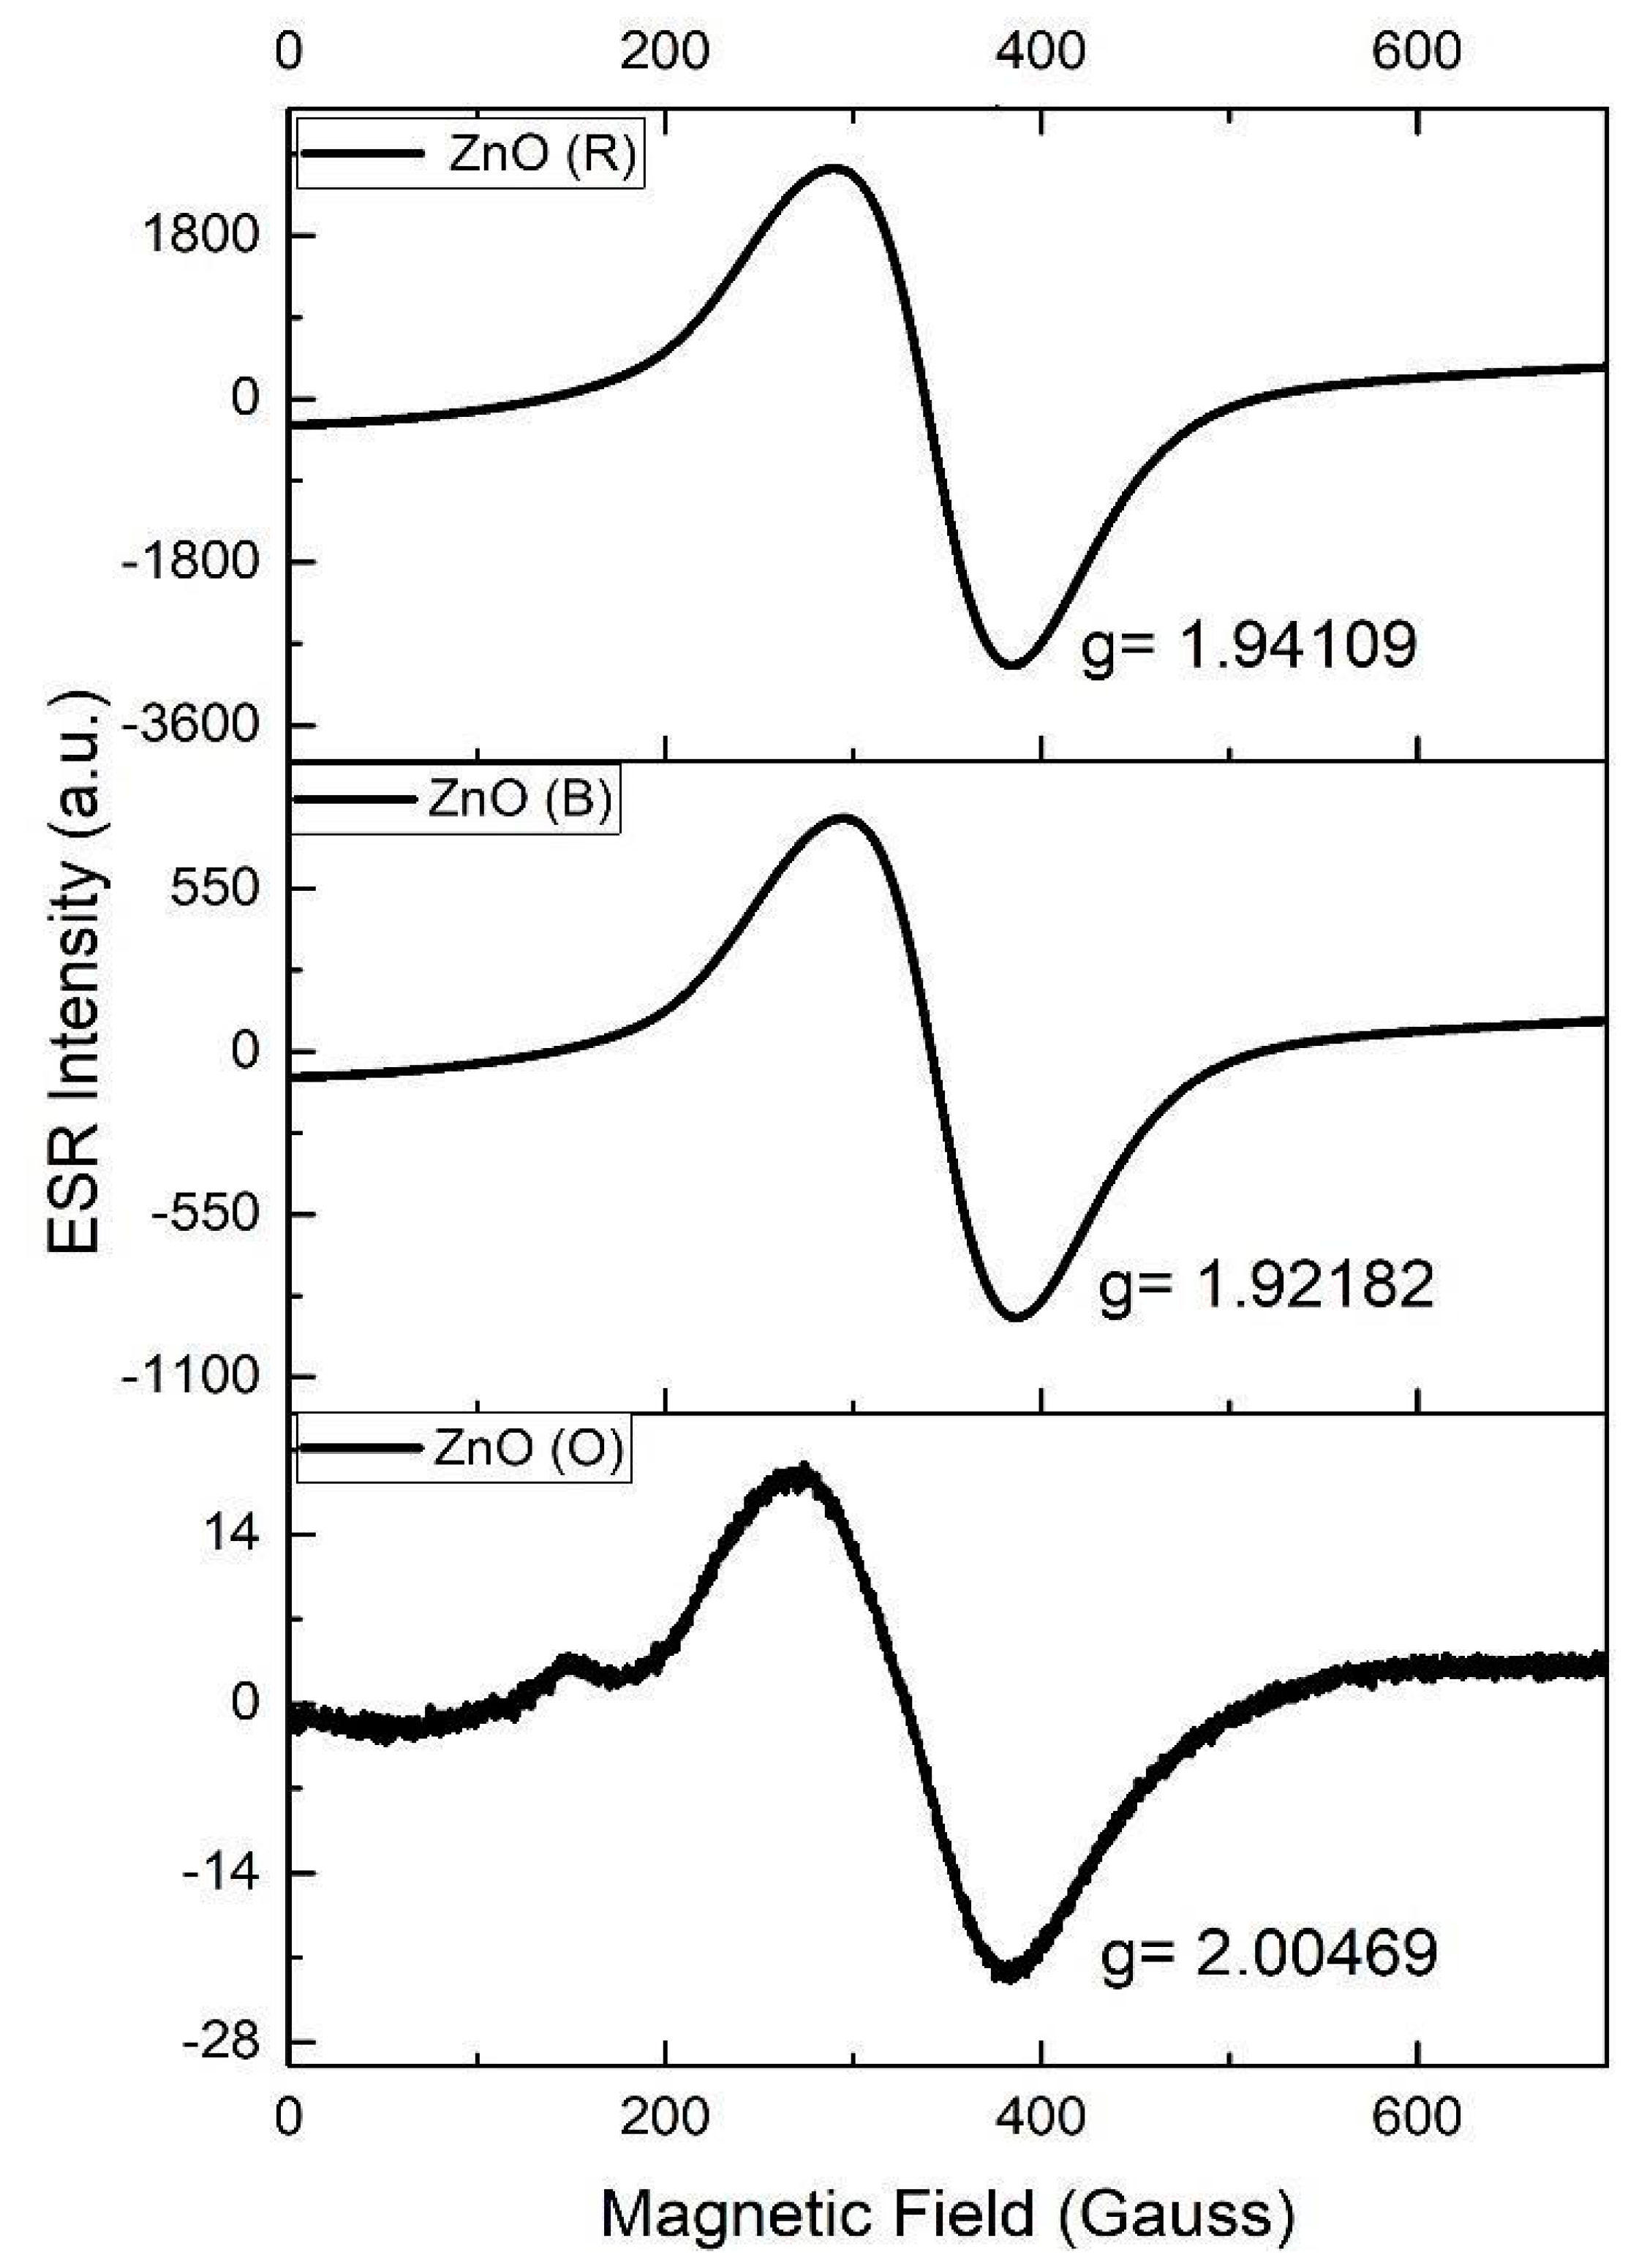
2.6. Electron Spin Resonance (ESR)
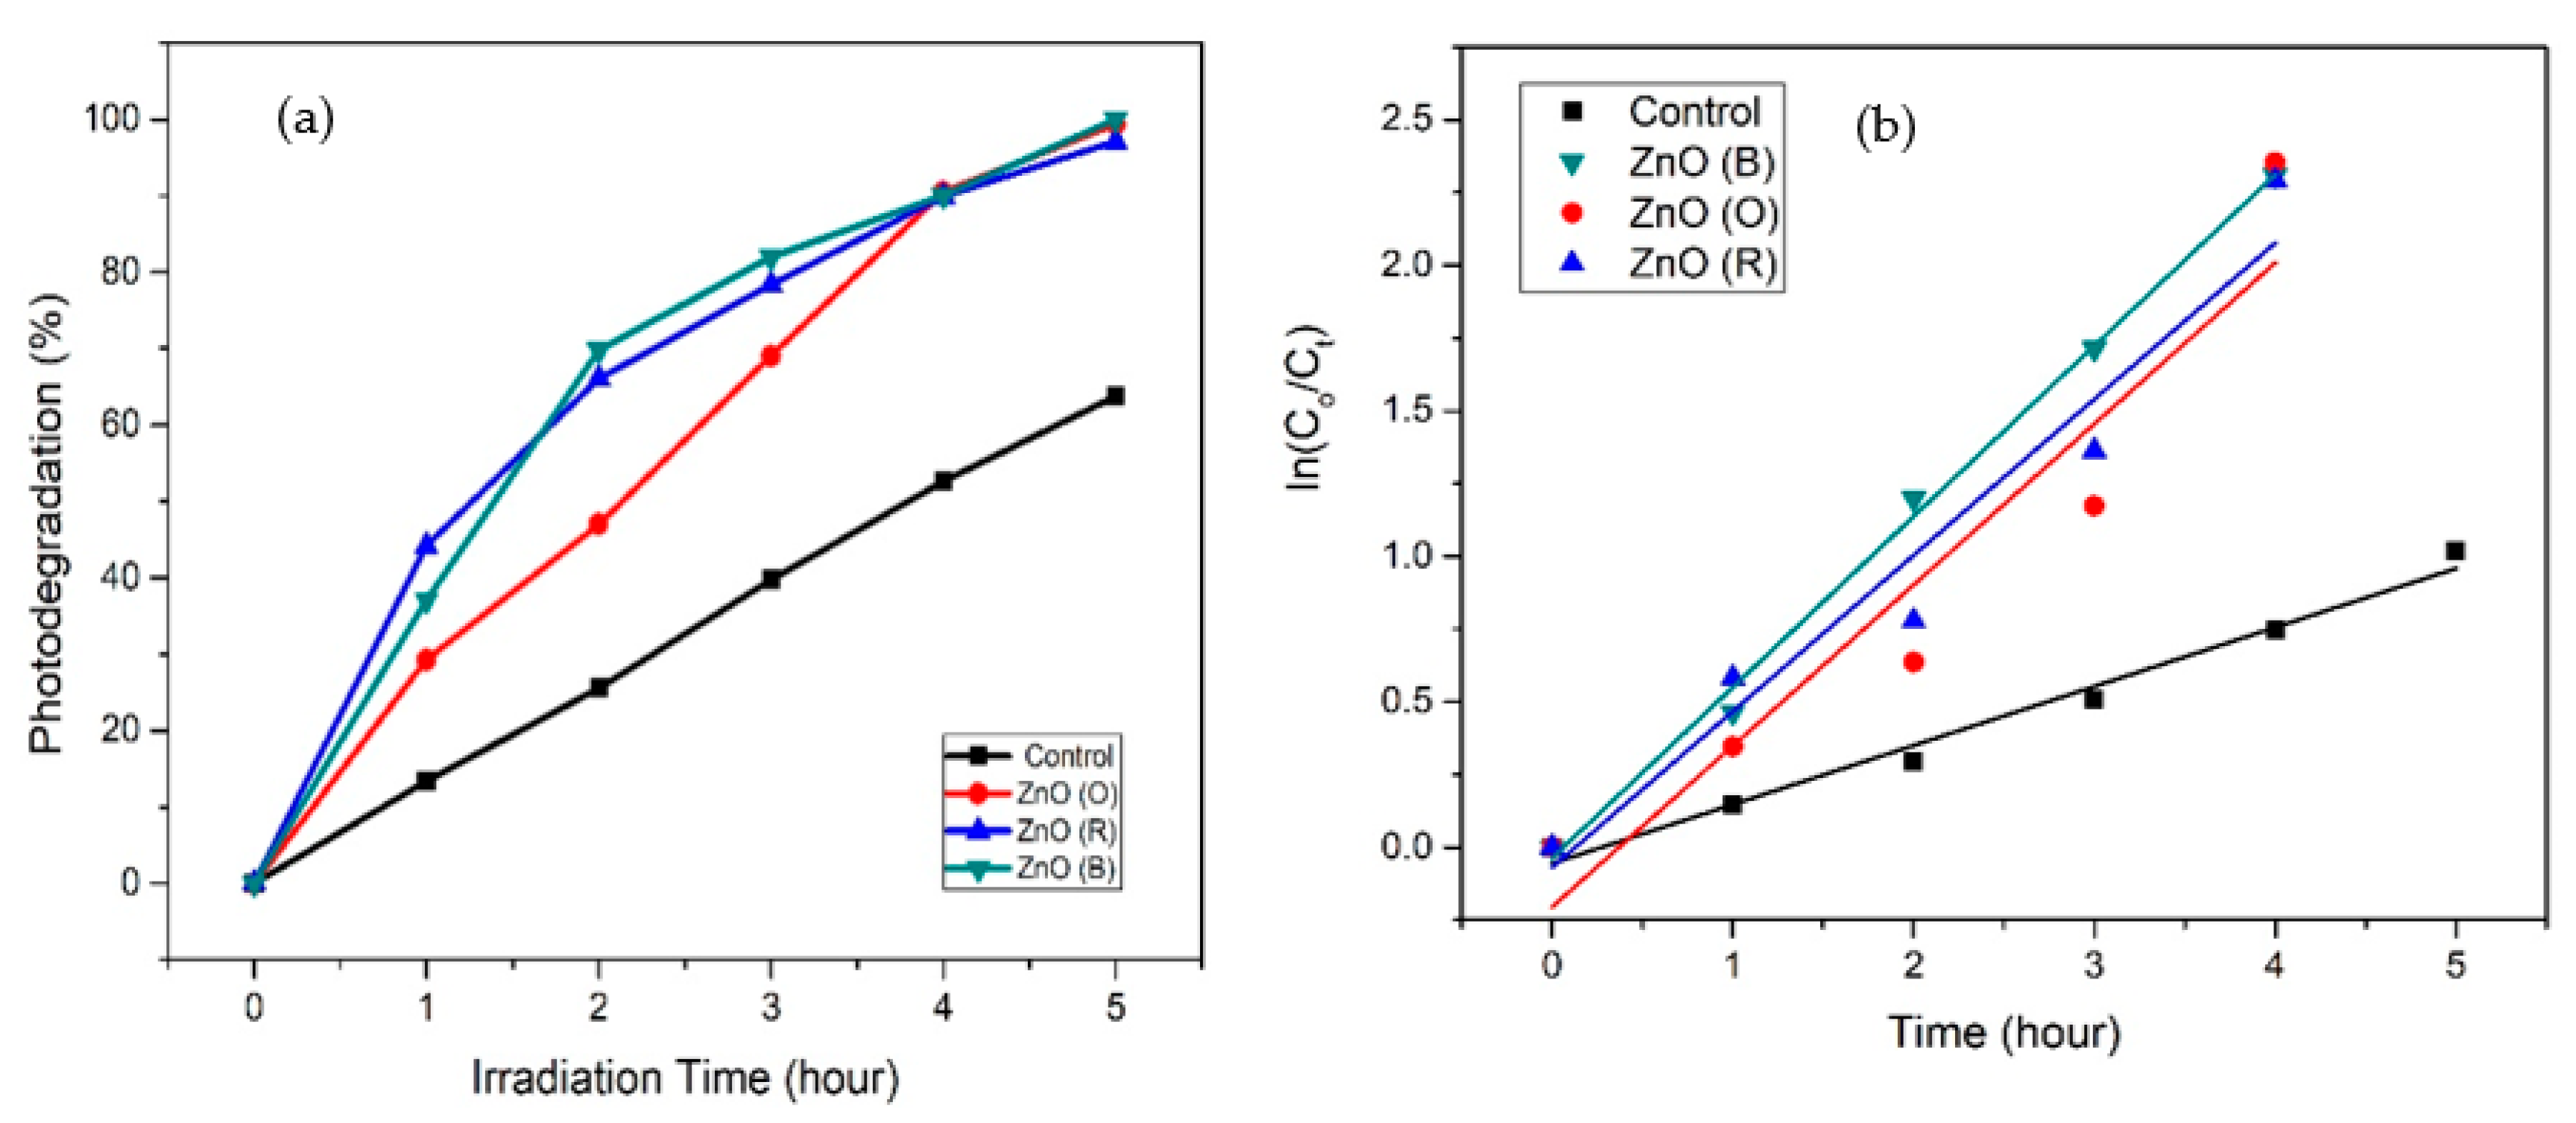
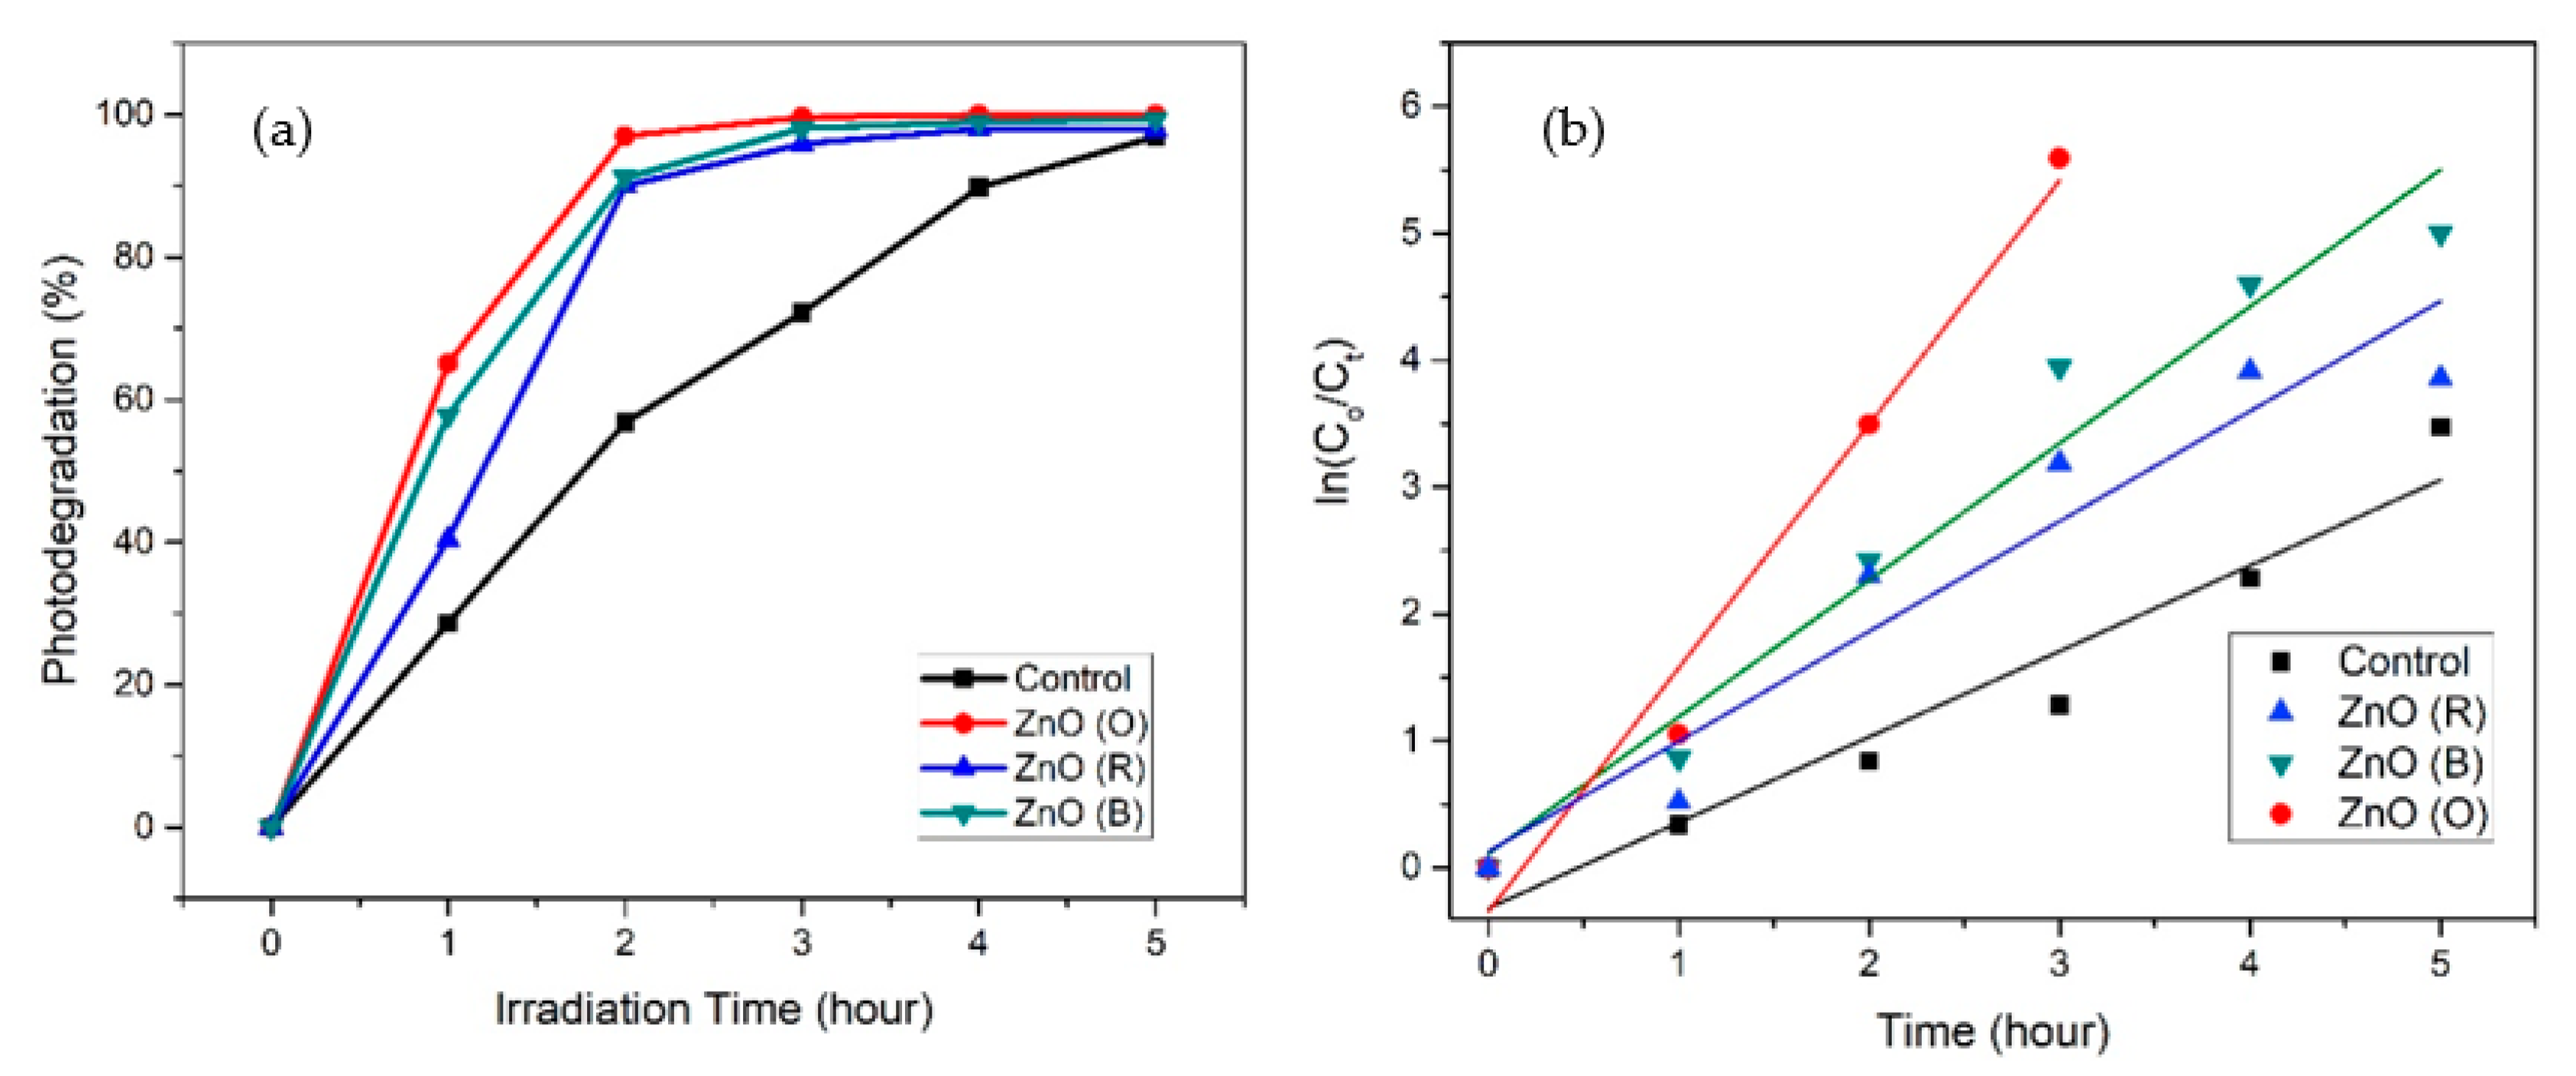
2.7. Photocatalytic Activity
2.8. Antioxidant Activity
3. Materials and Methods
3.1. Materials
3.2. Synthesis of Photocatalyst (ZnONPs)
3.3. Characterization
3.4. Photocatalytic Activity
3.5. Antioxidant Activity
4. Conclusions
Supplementary Materials
Author Contributions
Funding
Acknowledgments
Conflicts of Interest
References
- Kant, R. Textile dyeing industry an environmental hazard. Sci. Res. 2011, 4. [Google Scholar] [CrossRef] [Green Version]
- Bhatia, S.; Verma, N. Photocatalytic activity of ZnO nanoparticles with optimization of defects. Mater. Res. Bull. 2017, 95, 468–476. [Google Scholar] [CrossRef]
- Weitzel, T.; Rodriguez, M.F.; Ciapponi, A.; Calderón, M. Methylene blue for treating malaria. Cochrane Database Syst. Rev. 2017. [Google Scholar] [CrossRef]
- Cengiz, S.; Cavas, L. Removal of methylene blue by invasive marine seaweed: Caulerpa racemosa var. cylindracea. Bioresour. Technol. 2008, 99, 2357–2363. [Google Scholar] [CrossRef]
- Gita, S.; Hussan, A.; Choudhury, T. Impact of textile dyes waste on aquatic environments and its treatment. Environ. Ecol. 2017, 35, 2349–2353. [Google Scholar]
- Rai, H.S.; Bhattacharyya, M.S.; Singh, J.; Bansal, T.; Vats, P.; Banerjee, U.J.C. Removal of dyes from the effluent of textile and dyestuff manufacturing industry: A review of emerging techniques with reference to biological treatment. Crit. Rev. Environ. Sci. Technol. 2005, 35, 219–238. [Google Scholar] [CrossRef]
- Kumar, A.; Pandey, G. A review on the factors affecting the photocatalytic degradation of hazardous materials. Mater. Sci. Eng. Int. J. 2017, 1, 1–10. [Google Scholar] [CrossRef] [Green Version]
- Trandafilović, L.V.; Jovanović, D.J.; Zhang, X.; Ptasińska, S.; Dramićanin, M. Enhanced photocatalytic degradation of methylene blue and methyl orange by ZnO: Eu nanoparticles. Appl. Catal. B Environ. 2017, 203, 740–752. [Google Scholar] [CrossRef] [Green Version]
- Siripireddy, B.; Mandal, B.K. Facile green synthesis of zinc oxide nanoparticles by Eucalyptus globulus and their photocatalytic and antioxidant activity. Adv. Powder Technol. 2017, 28, 785–797. [Google Scholar] [CrossRef]
- Nagajyothi, P.; Prabhakar Vattikuti, S.; Devarayapalli, K.; Yoo, K.; Shim, J.; Sreekanth, T. Green synthesis: Photocatalytic degradation of textile dyes using metal and metal oxide nanoparticles-latest trends and advancements. Crit. Rev. Environ. Sci. Technol. 2019. [Google Scholar] [CrossRef]
- Suresh, J.; Pradheesh, G.; Alexramani, V.; Sundrarajan, M.; Hong, S.I. Green synthesis and characterization of zinc oxide nanoparticle using insulin plant (Costus pictus D. Don) and investigation of its antimicrobial as well as anticancer activities. Adv. Nat. Sci. Nanosci. Nanotechnol. 2018, 9, 015008. [Google Scholar] [CrossRef]
- Albiter, E.; Barrera-Andrade, J.M.; Rojas-García, E.; Valenzuela, M.A. Recent Advances of Nanocarbon-inorganic Hybrids in Photocatalysis. In Nanocarbon and Its Composites; Elsevier: Amsterdam, The Netherlands, 2019; pp. 521–588. [Google Scholar]
- Samuel, J.J.; Yam, F.K. Photocatalytic degradation of methylene blue under visible light by dye sensitized titania. Mater. Res. Express 2020, 7, 015051. [Google Scholar] [CrossRef]
- Gnanasekaran, L.; Hemamalini, R.; Saravanan, R.; Ravichandran, K.; Gracia, F.; Agarwal, S.; Gupta, V.K. Synthesis and characterization of metal oxides (CeO2, CuO, NiO, Mn3O4, SnO2 and ZnO) nanoparticles as photo catalysts for degradation of textile dyes. J. Photochem. Photobiol. B Biol. 2017, 173, 43–49. [Google Scholar] [CrossRef]
- Sabir, S.; Arshad, M.; Chaudhari, S.K. Zinc oxide nanoparticles for revolutionizing agriculture: Synthesis and applications. Sci. World J. 2014. [Google Scholar] [CrossRef] [Green Version]
- Halim, D.; Sihning, E. The Effect of Roselle (Hibiscus sabdariffa Linn) Flower Extract to the SGPT Activity in Male Wistar Rats (Rattus Norvegicus) Induced by High Dose Paracetamol. In Earth and Environmental Science; IOP Conference Series; IOP Publishing: Bristol, UK, 2019; p. 012018. [Google Scholar]
- Nasir, S.; Hussein, M.Z.; Yusof, N.A.; Zainal, Z. Oil palm waste-based precursors as a renewable and economical carbon sources for the preparation of reduced graphene oxide from graphene oxide. Nanomaterials 2017, 7, 182. [Google Scholar] [CrossRef] [Green Version]
- Shivaji, K.; Monica, E.S.; Devadoss, A.; Kirubakaran, D.D.; Dhas, C.R.; Jain, S.M.; Pitchaimuthu, S. Synthesizing Green Photocatalyst Using Plant Leaf Extract for Water Pollutant Treatment. In Green Photocatalysts; Springer: Berlin, Germany, 2020; pp. 25–46. [Google Scholar]
- Dodd, A.; McKinley, A.; Saunders, M.; Tsuzuki, T. Effect of particle size on the photocatalytic activity of nanoparticulate zinc oxide. J. Nanopart. Res. 2006, 8, 43. [Google Scholar] [CrossRef]
- Yusof, N.Z.; Abd Gani, S.S.; Siddiqui, Y.; Mohd Mokhtar, N.; Hasan, Z.A. Potential uses of oil palm (Elaeis guineensis) leaf extract in topical application. J. Oil Palm Res. 2016, 28, 520–530. [Google Scholar] [CrossRef]
- Heinlaan, M.; Ivask, A.; Blinova, I.; Dubourguier, H.-C.; Kahru, A. Toxicity of nanosized and bulk ZnO, CuO and TiO2 to bacteria Vibrio fischeri and crustaceans Daphnia magna and Thamnocephalus platyurus. Chemosphere 2008, 71, 1308–1316. [Google Scholar] [CrossRef]
- Hasnidawani, J.; Azlina, H.; Norita, H.; Bonnia, N.; Ratim, S.; Ali, E. Synthesis of ZnO nanostructures using sol-gel method. Procedia Chem. 2016, 19, 211–216. [Google Scholar] [CrossRef] [Green Version]
- Küünal, S.; Rauwel, P.; Rauwel, E. Plant extract mediated synthesis of nanoparticles. In Emerging Applications of Nanoparticles and Architecture Nanostructures; Elsevier: Amsterdam, The Netherlands, 2018; pp. 411–446. [Google Scholar]
- Osuntokun, J.; Onwudiwe, D.C.; Ebenso, E.E. Green synthesis of ZnO nanoparticles using aqueous Brassica oleracea L. var. italica and the photocatalytic activity. Green Chem. Lett. Rev. 2019, 12, 444–457. [Google Scholar] [CrossRef] [Green Version]
- Chaudhary, A.; Kumar, N.; Kumar, R.; Salar, R.K. Antimicrobial activity of zinc oxide nanoparticles synthesized from Aloe vera peel extract. SN Appl. Sci. 2019, 1, 136. [Google Scholar] [CrossRef] [Green Version]
- Yedurkar, S.; Maurya, C.; Mahanwar, P.A. A biological approach for the synthesis of copper oxide nanoparticles by Ixora coccinea leaf extract. J. Mater. Environ. Sci. 2017, 8, 1173–1178. [Google Scholar]
- Hassan, S.S.; El Azab, W.I.; Ali, H.R.; Mansour, M.S. Green synthesis and characterization of ZnO nanoparticles for photocatalytic degradation of anthracene. Adv. Nat. Sci. Nanosci. Nanotechnol. 2015, 6, 045012. [Google Scholar] [CrossRef]
- Vijayakumar, S.; Arulmozhi, P.; Kumar, N.; Sakthivel, B.; Kumar, S.P.; Praseetha, P. Acalypha fruticosa L. leaf extract mediated synthesis of ZnO nanoparticles: Characterization and antimicrobial activities. Mater. Today Proc. 2019, 23, 73–80. [Google Scholar] [CrossRef]
- Ji, W.; Zhu, D.; Chen, Y.; Hu, J.; Li, F. In-vitro cytotoxicity of biosynthesized Zinc oxide nanoparticles towards cardiac cell lines of Catla catla. Boimed. Res. 2017, 28, 2262–2266. [Google Scholar]
- Raj, A.; Lawerence, R. Green synthesis and charcterization of zno nanoparticles from leafs extracts of rosa indica and its antibacterial activity. Nutrition 2018, 11, 1339–1348. [Google Scholar] [CrossRef]
- Kumar, B.; Smita, K.; Cumbal, L.; Debut, A. Green approach for fabrication and applications of zinc oxide nanoparticles. Bioinorg. Chem. Appl. 2014. [Google Scholar] [CrossRef]
- Chanayath, N.; Lhieochaiphant, S.; Phutrakul, S.J. Pigment extraction techniques from the leaves of Indigofera tinctoria Linn. and Baphicacanthus cusia Brem. and chemical structure analysis of their major components. Chiang Mai Univ. J. 2002, 1, 149–160. [Google Scholar]
- Patil, B.N.; Taranath, T.C. Limonia acidissima L. leaf mediated synthesis of zinc oxide nanoparticles: A potent tool against Mycobacterium tuberculosis. Int. J. Mycobacterial. 2016, 5, 197–204. [Google Scholar] [CrossRef] [Green Version]
- Varughese, G.; Jithin, P.; Usha, K. Determination of optical band gap energy of wurtzite ZnO: Ce nanocrystallites. Phys. Sci. Int. J. 2015, 5, 146–154. [Google Scholar] [CrossRef]
- Sengupta, A.; Sarkar, C.K. Introduction to Nano: Basics to Nanoscience and Nanotechnology; Springer: Berlin, Germany, 2015. [Google Scholar]
- Gupta, P.; Ramrakhiani, M. Influence of the particle size on the optical properties of CdSe nanoparticles. Open Nanosci. J. 2009, 3, 15–19. [Google Scholar] [CrossRef] [Green Version]
- Brus, L. Electronic wave functions in semiconductor clusters: Experiment and theory. J. Phys. Chem. 1986, 90, 2555–2560. [Google Scholar] [CrossRef]
- Jayappa, M.D.; Ramaiah, C.K.; Kumar, M.A.P.; Suresh, D.; Prabhu, A.; Devasya, R.P.; Sheikh, S. Green synthesis of zinc oxide nanoparticles from the leaf, stem and in vitro grown callus of Mussaenda frondosa L.: Characterization and their applications. Appl. Nanosci. 2020. [Google Scholar] [CrossRef]
- Tomaszewska, E.; Soliwoda, K.; Kadziola, K.; Tkacz-Szczesna, B.; Celichowski, G.; Cichomski, M.; Szmaja, W.; Grobelny, J. Detection limits of DLS and UV-Vis spectroscopy in characterization of polydisperse nanoparticles colloids. J. Nanomater. 2013. [Google Scholar] [CrossRef] [Green Version]
- Ferreira-Neto, E.P.; Worsley, M.A.; Rodrigues-Filho, U.P. Towards thermally stable aerogel photocatalysts: TiCl4-based sol-gel routes for the design of nanostructured silica-titania aerogel with high photocatalytic activity and outstanding thermal stability. J. Environ. Chem. Eng. 2019, 7, 103425. [Google Scholar] [CrossRef]
- Acosta-Humánez, F.; Pitalúa, R.C.; Almanza, O. Electron paramagnetic resonance in Zn1− xCoxO. J. Magn. Magn. Mater. 2013, 329, 39–42. [Google Scholar] [CrossRef]
- Acosta-Humánez, M.; Montes-Vides, L.; Almanza-Montero, O. Sol-gel synthesis of zinc oxide nanoparticle at three different temperatures and its characterization via XRD, IR and EPR. Dyna 2016, 83, 224–228. [Google Scholar] [CrossRef]
- Nguyen, C.H.; Fu, C.-C.; Juang, R.-S. Degradation of methylene blue and methyl orange by palladium-doped TiO2 photocatalysis for water reuse: Efficiency and degradation pathways. J. Clean. Prod. 2018, 202, 413–427. [Google Scholar] [CrossRef]
- Kazeminezhad, I.; Sadollahkhani, A. Influence of pH on the photocatalytic activity of ZnO nanoparticles. J. Mater. Sci. Mater. Electron. 2016, 27, 4206–4215. [Google Scholar] [CrossRef]
- Thongam, D.D.; Gupta, J.; Sahu, N.K. Effect of induced defects on the properties of ZnO nanocrystals: Surfactant role and spectroscopic analysis. SN Appl. Sci. 2019, 1, 1030. [Google Scholar] [CrossRef] [Green Version]
- Reed, A.E.; Weinhold, F. Natural bond orbital analysis of near-Hartree–Fock water dimer. J. Chem. Phys. 1983, 78, 4066–4073. [Google Scholar] [CrossRef]
- Nakkala, J.R.; Mata, R.; Sadras, S.R. The antioxidant and catalytic activities of green synthesized gold nanoparticles from Piper longum fruit extract. Process Saf. Environ. Prot. 2016, 100, 288–294. [Google Scholar] [CrossRef]
- Kumar, B.; Smita, K.; Cumbal, L.; Debut, A. Synthesis of silver nanoparticles using Sacha inchi (Plukenetia volubilis L.) leaf extracts. Saudi J. Biol. Sci. 2014, 21, 605–609. [Google Scholar] [CrossRef] [PubMed] [Green Version]
- Ullah, A.; Ullah, S.; Khan, M.Q.; Hashmi, M.; Nam, P.D.; Kato, Y.; Tamada, Y.; Kim, I.S. Manuka honey incorporated cellulose acetate nanofibrous mats: Fabrication and in vitro evaluation as a potential wound dressing. Int. J. Biol. Macromol. 2020, 155, 479–489. [Google Scholar] [CrossRef] [PubMed]
- Kumar, B.; Smita, K.; Cumbal, L.; Debut, A.; Angulo, Y. Biofabrication of copper oxide nanoparticles using Andean blackberry (Rubus glaucus Benth.) fruit and leaf. J. Saudi Chem. Soc. 2017, 21, S475–S480. [Google Scholar] [CrossRef] [Green Version]
- Stan, M.; Popa, A.; Toloman, D.; Silipas, T.-D.; Vodnar, D.C. Antibacterial and antioxidant activities of ZnO nanoparticles synthesized using extracts of Allium sativum, Rosmarinus officinalis and Ocimum basilicum. Acta Metall. Sin. (Engl. Lett.) 2016, 29, 228–236. [Google Scholar] [CrossRef] [Green Version]


| Sample Material | Band Gap Energy E (eV) | Wavelength Maximum λmax (nm) |
|---|---|---|
| ZnO (R) | 2.90 | 365 |
| ZnO (O) | 3.20 | 359 |
| ZnO (B) | 3.20 | 357 |
| Photocatalytic Activity | Photodegradation of MO (%) | Kinetic Constant, k | Regression Coefficient (R2) | 95% Confidence Interval Low | 95% Confidence Interval High |
|---|---|---|---|---|---|
| Control | 63 | 0.2028 | 0.9841 | 0.1670 | 0.2385 |
| ZnO (B) | 100 | 0.5868 | 0.9964 | 0.5213 | 0.6520 |
| ZnO (R) | 97 | 0.5533 | 0.9076 | 0.2289 | 0.8778 |
| ZnO (O) | 99 | 0.5364 | 0.9512 | 0.3132 | 0.7596 |
| Photocatalytic Activity | Photodegradation of MB (%) | Kinetic Constant, k | Regression Coefficient (R2) | 95% Confidence Interval Low | 95% Confidence Interval High |
|---|---|---|---|---|---|
| Control | 96 | 0.6751 | 0.9407 | 0.4397 | 0.9104 |
| ZnO (R) | 98 | 0.8675 | 0.9218 | 0.5168 | 1.2183 |
| ZnO (B) | 99 | 1.0784 | 0.9632 | 0.7857 | 1.3711 |
| ZnO (O) | 100 | 1.9213 | 0.9776 | 1.0355 | 2.8071 |
© 2020 by the authors. Licensee MDPI, Basel, Switzerland. This article is an open access article distributed under the terms and conditions of the Creative Commons Attribution (CC BY) license (http://creativecommons.org/licenses/by/4.0/).
Share and Cite
Lau, G.E.; Che Abdullah, C.A.; Wan Ahmad, W.A.N.; Assaw, S.; Zheng, A.L.T. Eco-Friendly Photocatalysts for Degradation of Dyes. Catalysts 2020, 10, 1129. https://doi.org/10.3390/catal10101129
Lau GE, Che Abdullah CA, Wan Ahmad WAN, Assaw S, Zheng ALT. Eco-Friendly Photocatalysts for Degradation of Dyes. Catalysts. 2020; 10(10):1129. https://doi.org/10.3390/catal10101129
Chicago/Turabian StyleLau, Gee Een, Che Azurahanim Che Abdullah, Wan Amir Nizam Wan Ahmad, Suvik Assaw, and Alvin Lim Teik Zheng. 2020. "Eco-Friendly Photocatalysts for Degradation of Dyes" Catalysts 10, no. 10: 1129. https://doi.org/10.3390/catal10101129
APA StyleLau, G. E., Che Abdullah, C. A., Wan Ahmad, W. A. N., Assaw, S., & Zheng, A. L. T. (2020). Eco-Friendly Photocatalysts for Degradation of Dyes. Catalysts, 10(10), 1129. https://doi.org/10.3390/catal10101129