2.1. Dry Reforming of Methane
DRM experiments were conducted using CH
4 and CO
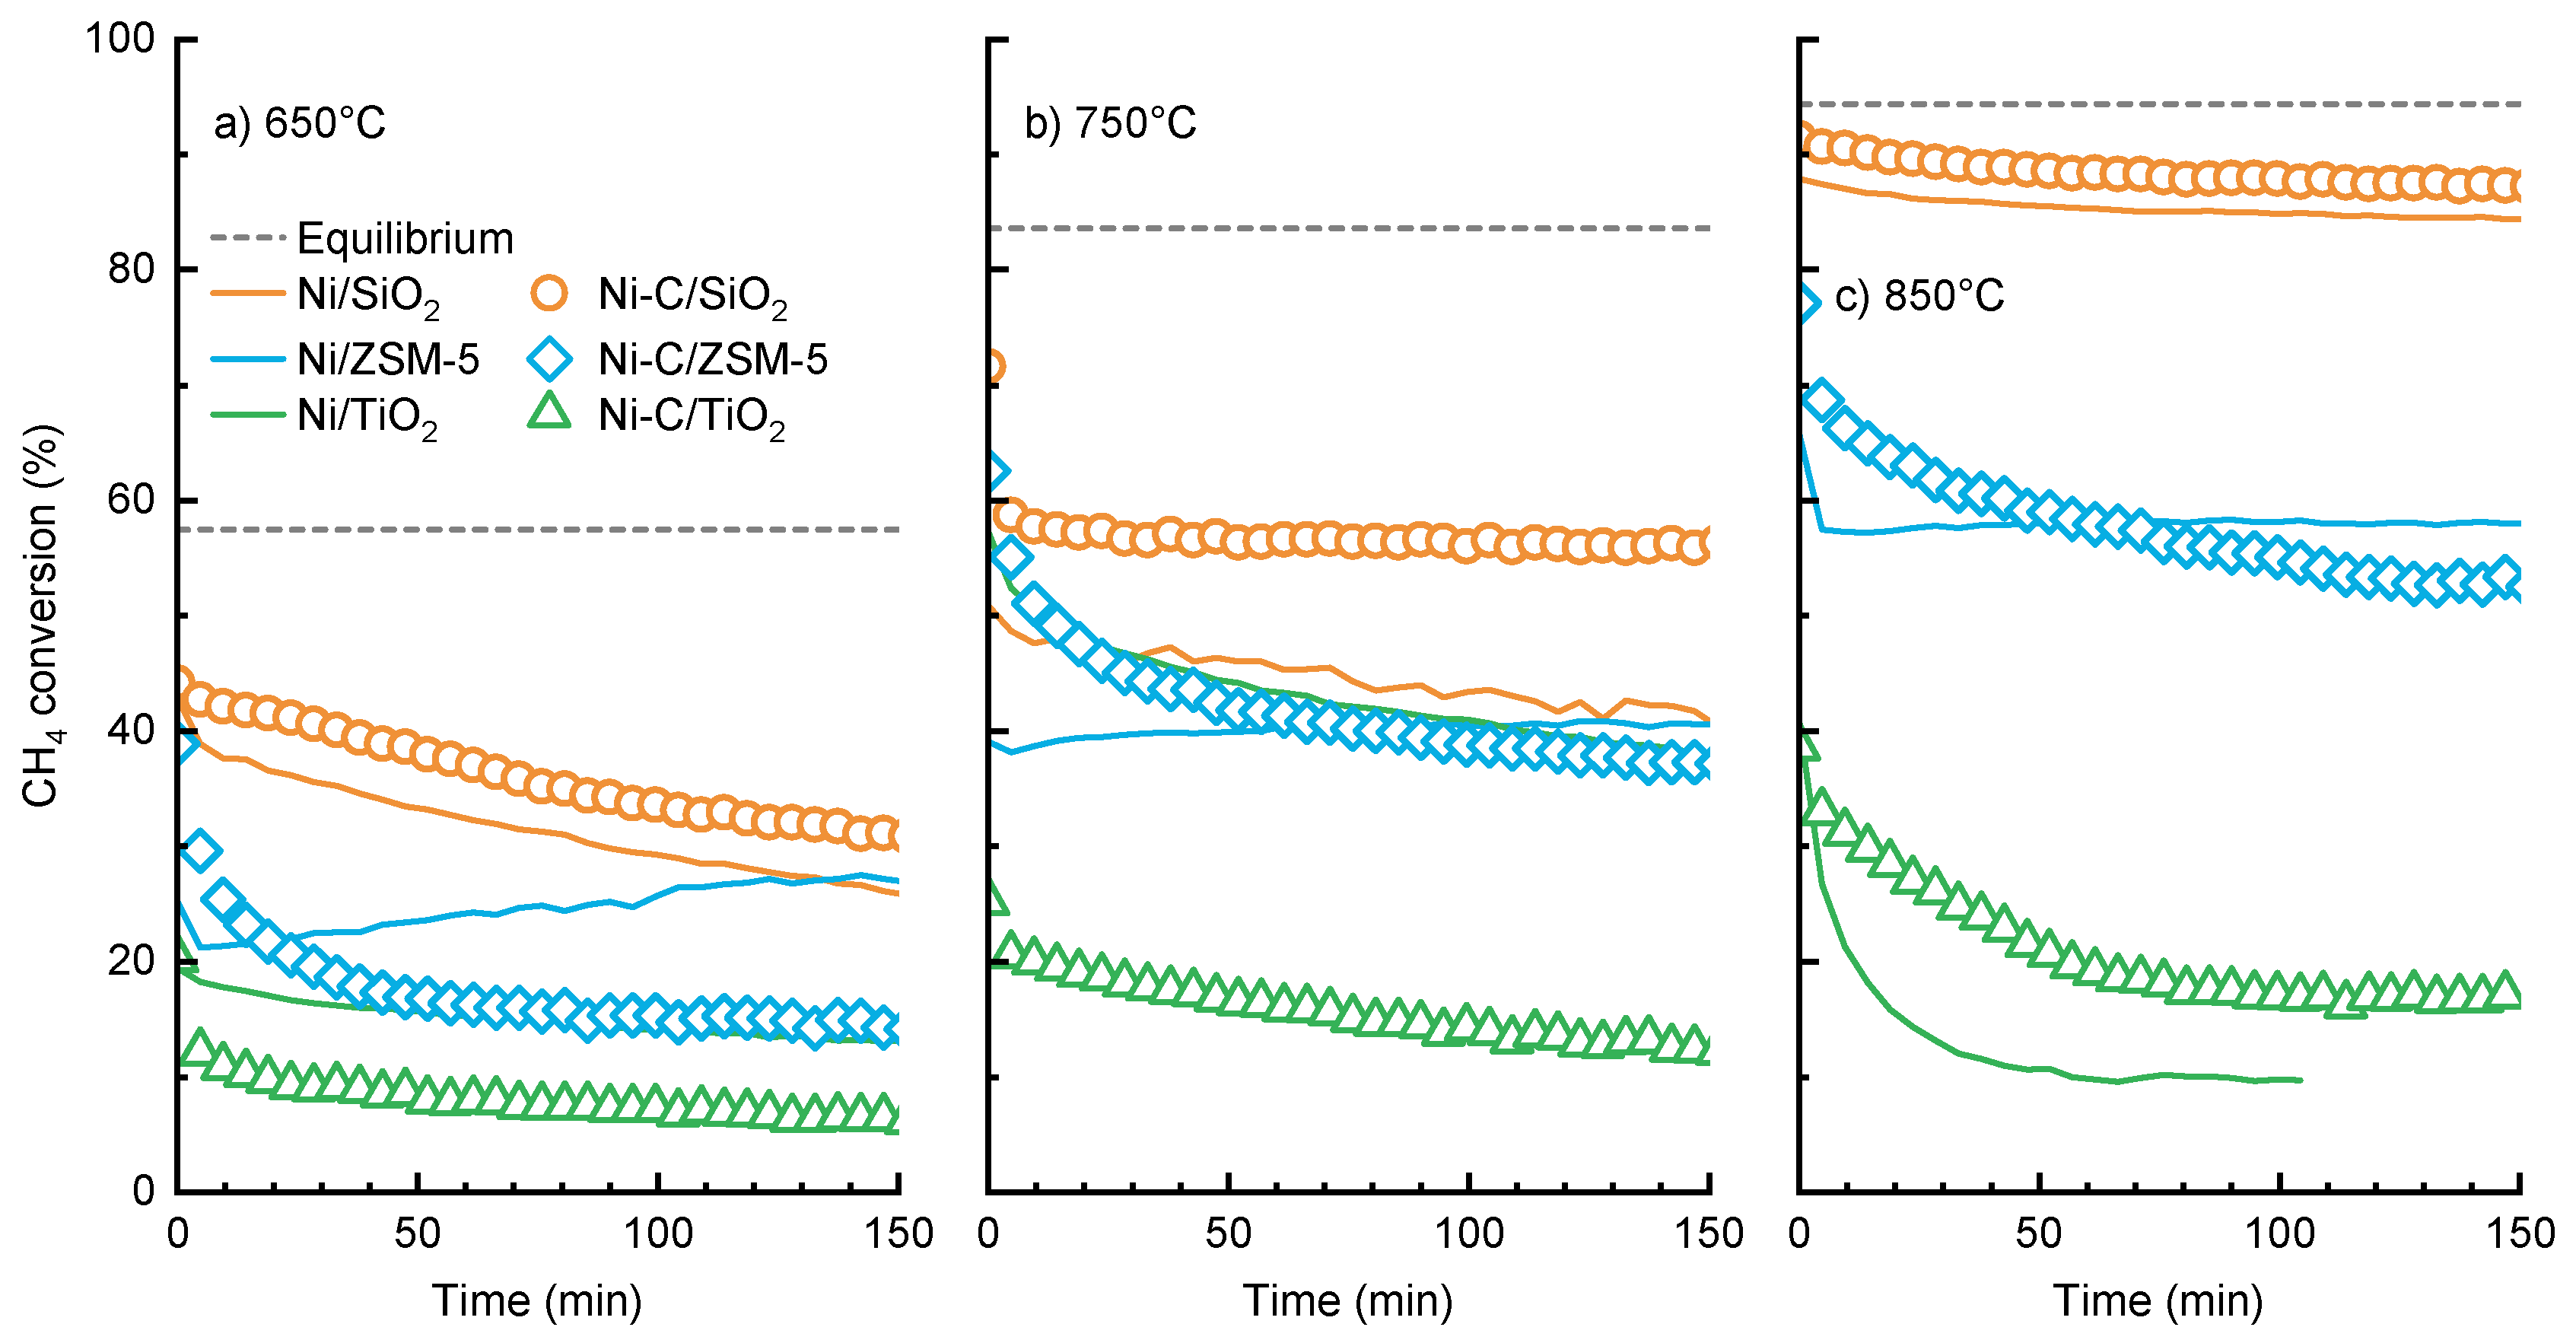
2 feed gas mixture with a molar ratio of 1/1 at three different temperatures (650 °C, 750 °C, and 850 °C). The composition of the gaseous product was recorded every 4 min. The catalyst with deposited carbon was collected after each experiment and then characterized. Conversions of CH
4 and CO
2 with investigated catalysts at different temperatures are shown in
Figure 1 and
Figure 2, respectively. Corresponding H
2 and CO yields are exhibited in
Figures S1 and S2, respectively.
Among the investigated catalysts, SiO
2-supported catalysts presented exceptional activity and stability regardless of the C-promotion effect. All investigated catalysts showed an increasing trend of feed gas conversion with increasing temperature. For example, the initial CH
4 conversion for Ni-C/SiO
2 catalyst was increased from 44% at 650 °C to 91% at 850 °C. The deactivation rate of non-doped and C-doped Ni/SiO
2 catalysts was high at low temperatures. Ni-based catalysts are substantially active from 600 °C to 750 °C to decompose methane and produce C-deposits (CH
4 → 2H
2 + C, ΔH = 74.5 kJ/mol) [
20]. Throughout this process, side reaction (C + CO
2 → 2CO) might not be well executed at low reaction temperatures and resulted in the production of graphitic carbon species, which block the active sites from the reaction medium. The high graphitic carbon deposition at 650 °C over Ni-based catalysts was confirmed via XRD analysis, as shown later. This phenomenon subsequently led to gradual deactivation. By contrast, the advanced stability of Ni-C/SiO
2 was observed at 850 °C, with 91% initial methane conversion and 87% conversion after 150 min. The low deactivation rate might be due to the high consumption of accumulated carbon by CO
2 to form CO. Ni/SiO
2 converted feed gas at a slightly lower rate than Ni-C/SiO
2 at 850 °C; however, the trend was upheld. The promotion effect of C on Ni/SiO
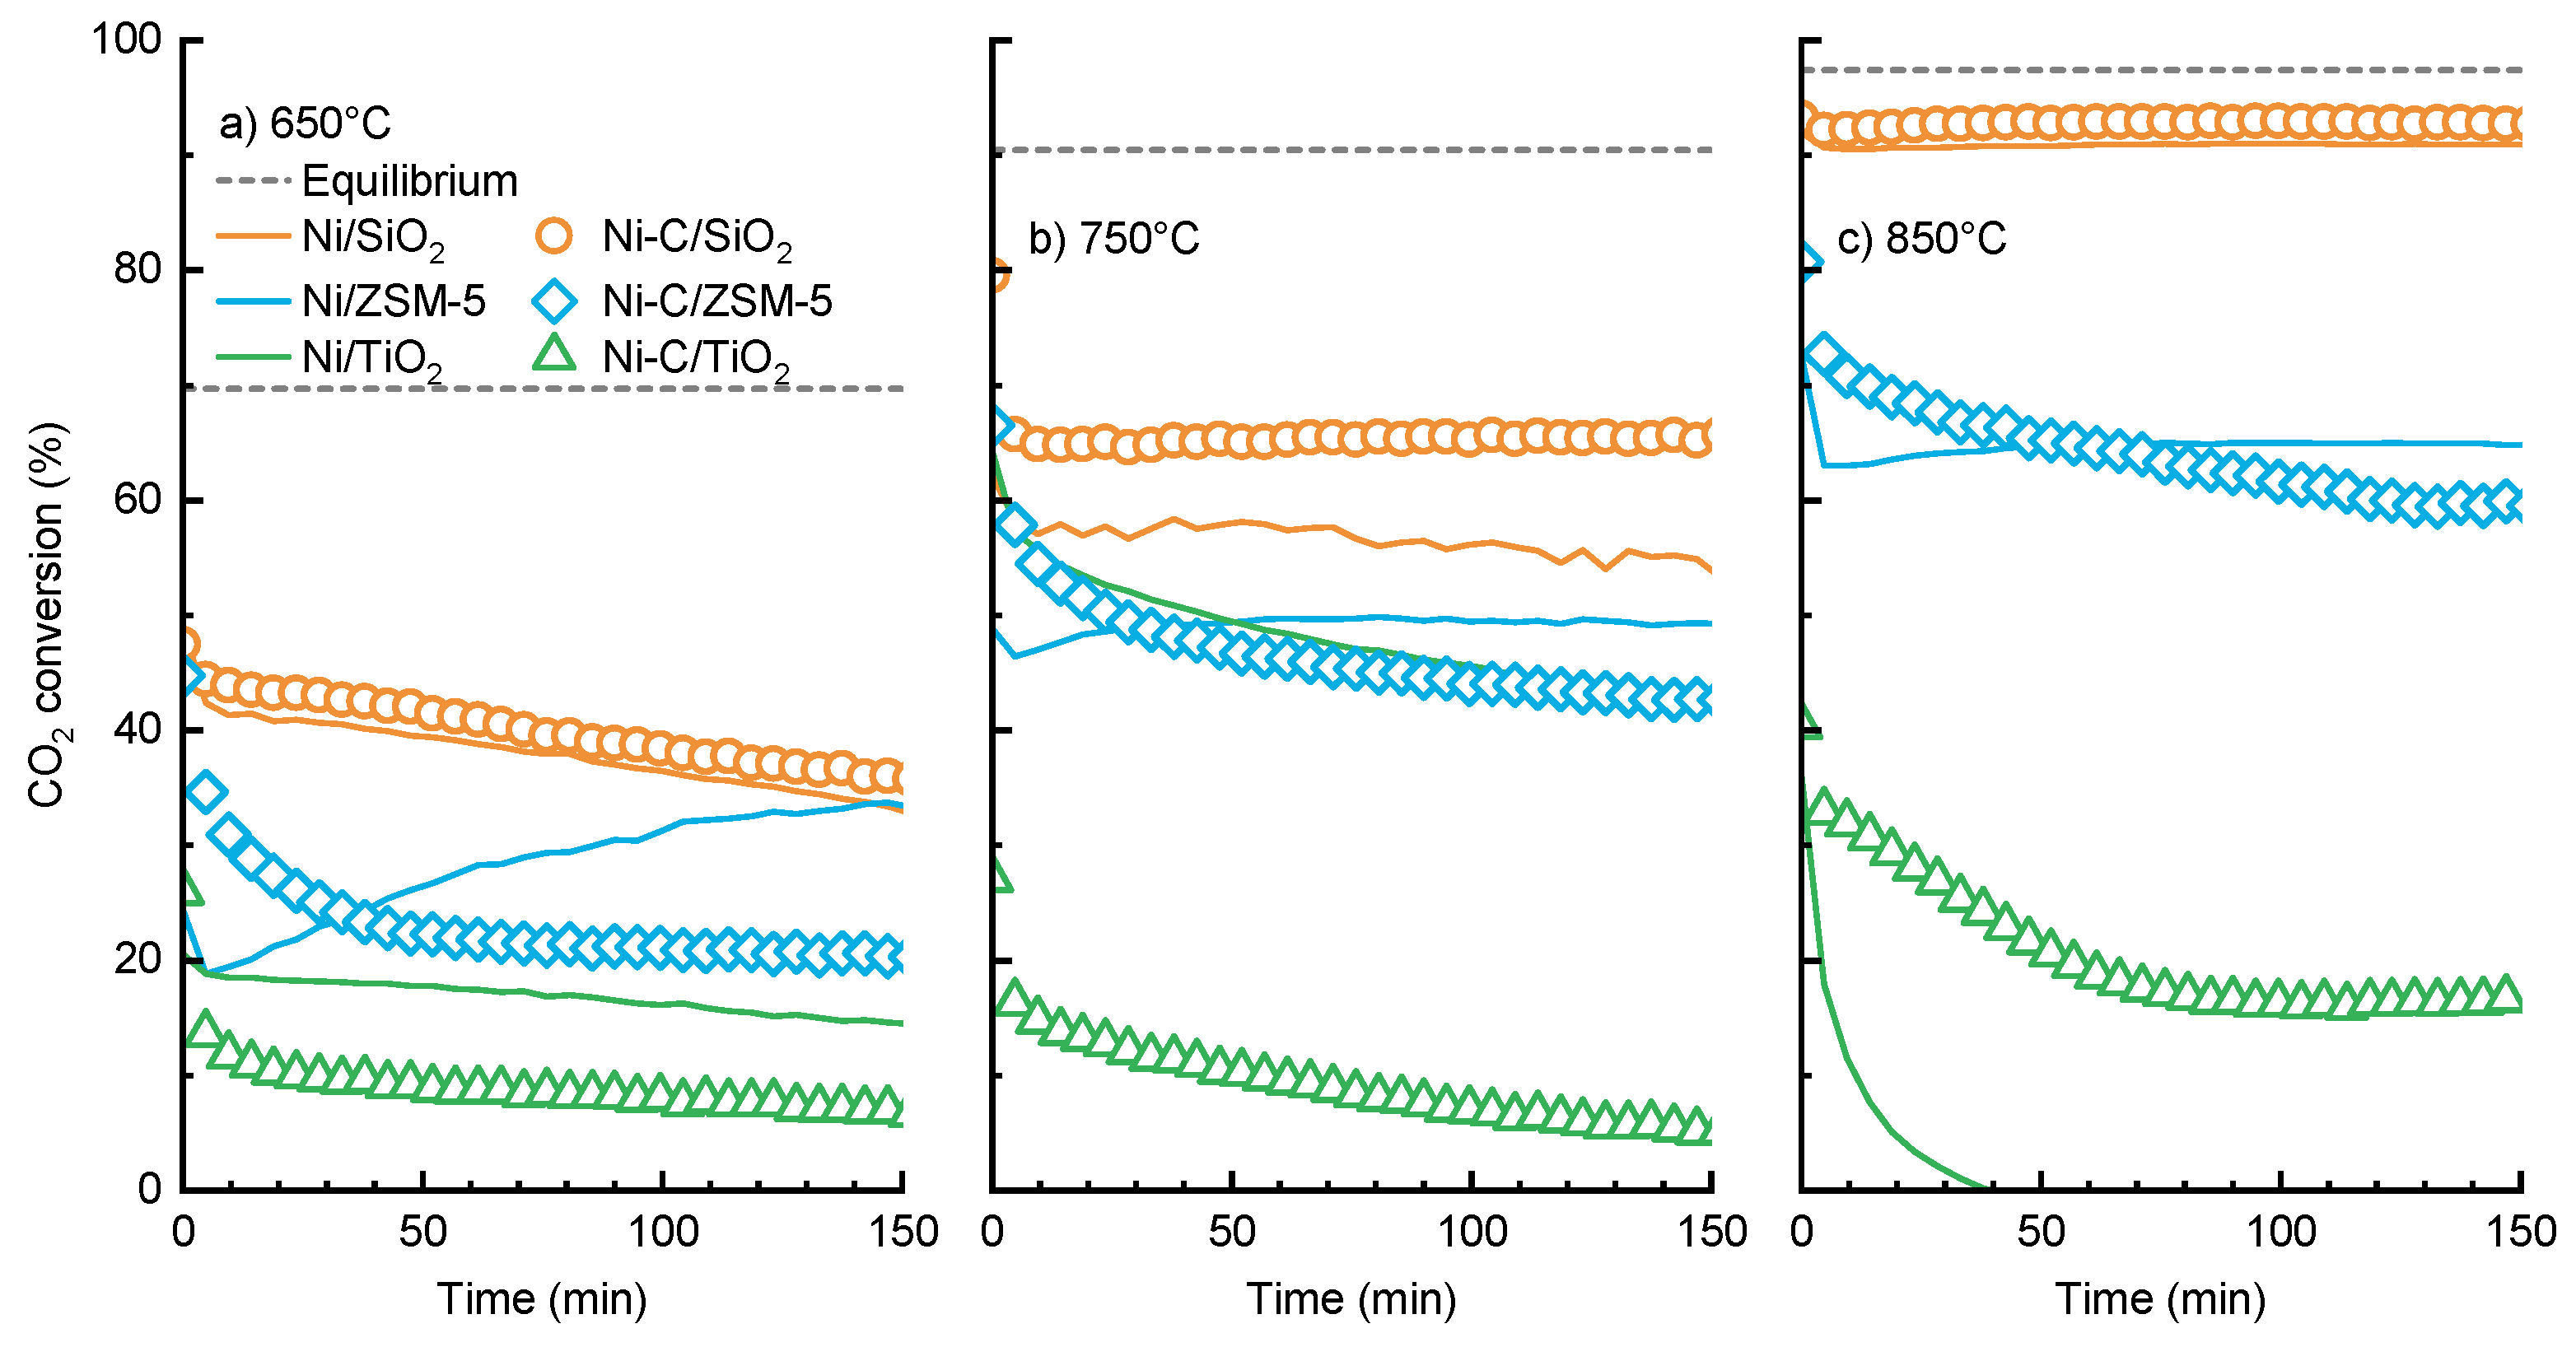
2 was highly noticeable at 650 °C and 750 °C. Similar to CH
4 conversion, CO
2 conversion also maintained a similar trend with slightly high percent conversion, as shown in
Figure 2. The reverse water gas shift (H
2 + CO
2 → H
2O + CO, ΔH = 41.1 kJ/mol) and reverse Boudouard (CO
2 + C → 2CO) could be the reason for the high CO
2 conversion compared with CH
4 conversion. The presence of water in the cold trap during reaction also clearly signposted the occurrence of reverse water–gas shift reaction [
21].
The downward inclination of the H
2/CO ratio at low temperature in
Figure S3a was due mainly to the occurrence of reverse water–gas shift. This result could be attributed to the endothermic nature of reverse water–gas shift compared with that of DRM (CH
4 + CO
2 → H
2 + CO, ΔH = 247 kJ/mol) [
22]. High temperature favors a strong endothermic dry reforming reaction. It also favors endothermic CH
4 decomposition and exothermic water–gas shift reaction (H
2O + CO → H
2 + CO
2, ΔH = −41.1 kJ/mol) and subsequently increases the amount of H
2. The H
2:CO ratio was always below unity, which confirmed the existence of methane decomposition and Boudouard reactions. However, Ni-C/SiO
2 catalyst controlled those demoting reactions and maintained an H
2:CO ratio of 0.8 at 850 °C (
Figure S3c). Irrespective of the declining activity of Ni/SiO
2 catalyst at 650 °C and 750 °C, Ni/ZSM-5 exhibited stable conversion after a slight drop from the initial conversion at all experimented temperatures. This finding could be attributed to the fast balance of production and consumption of carbon deposition. The total carbon balance throughout process was close to 100, which is exhibited in
Figure S4. Compared with that of SiO
2-supported catalysts, feed conversion was lower for ZSM-5- and TiO
2-supported ones. The addition of C improved the initial activity of Ni/ZSM-5, but failed to maintain stability and caused fast deactivation. The performance of the TiO
2-supported catalyst was poor compared to others considered in this study, and the addition of C had further decreased the performance of Ni/TiO
2 at 650 and 750 °C (
Figure 2a,b). The catalytic performance of Ni/TiO
2 at 850 °C was lower than that at 750 °C, and this might be attributed to the oxidation of Ni active sites and the sintering of Ni particles at high temperature, which happened due to their weak metal-support interaction. The slightly high catalytic performance of Ni-C/TiO
2 at 850 °C than that of Ni/TiO
2 might be due to the combined contributions of glucose-derived carbon and the endothermic nature of DRM.
2.2. Physicochemical Characteristics of the Catalysts
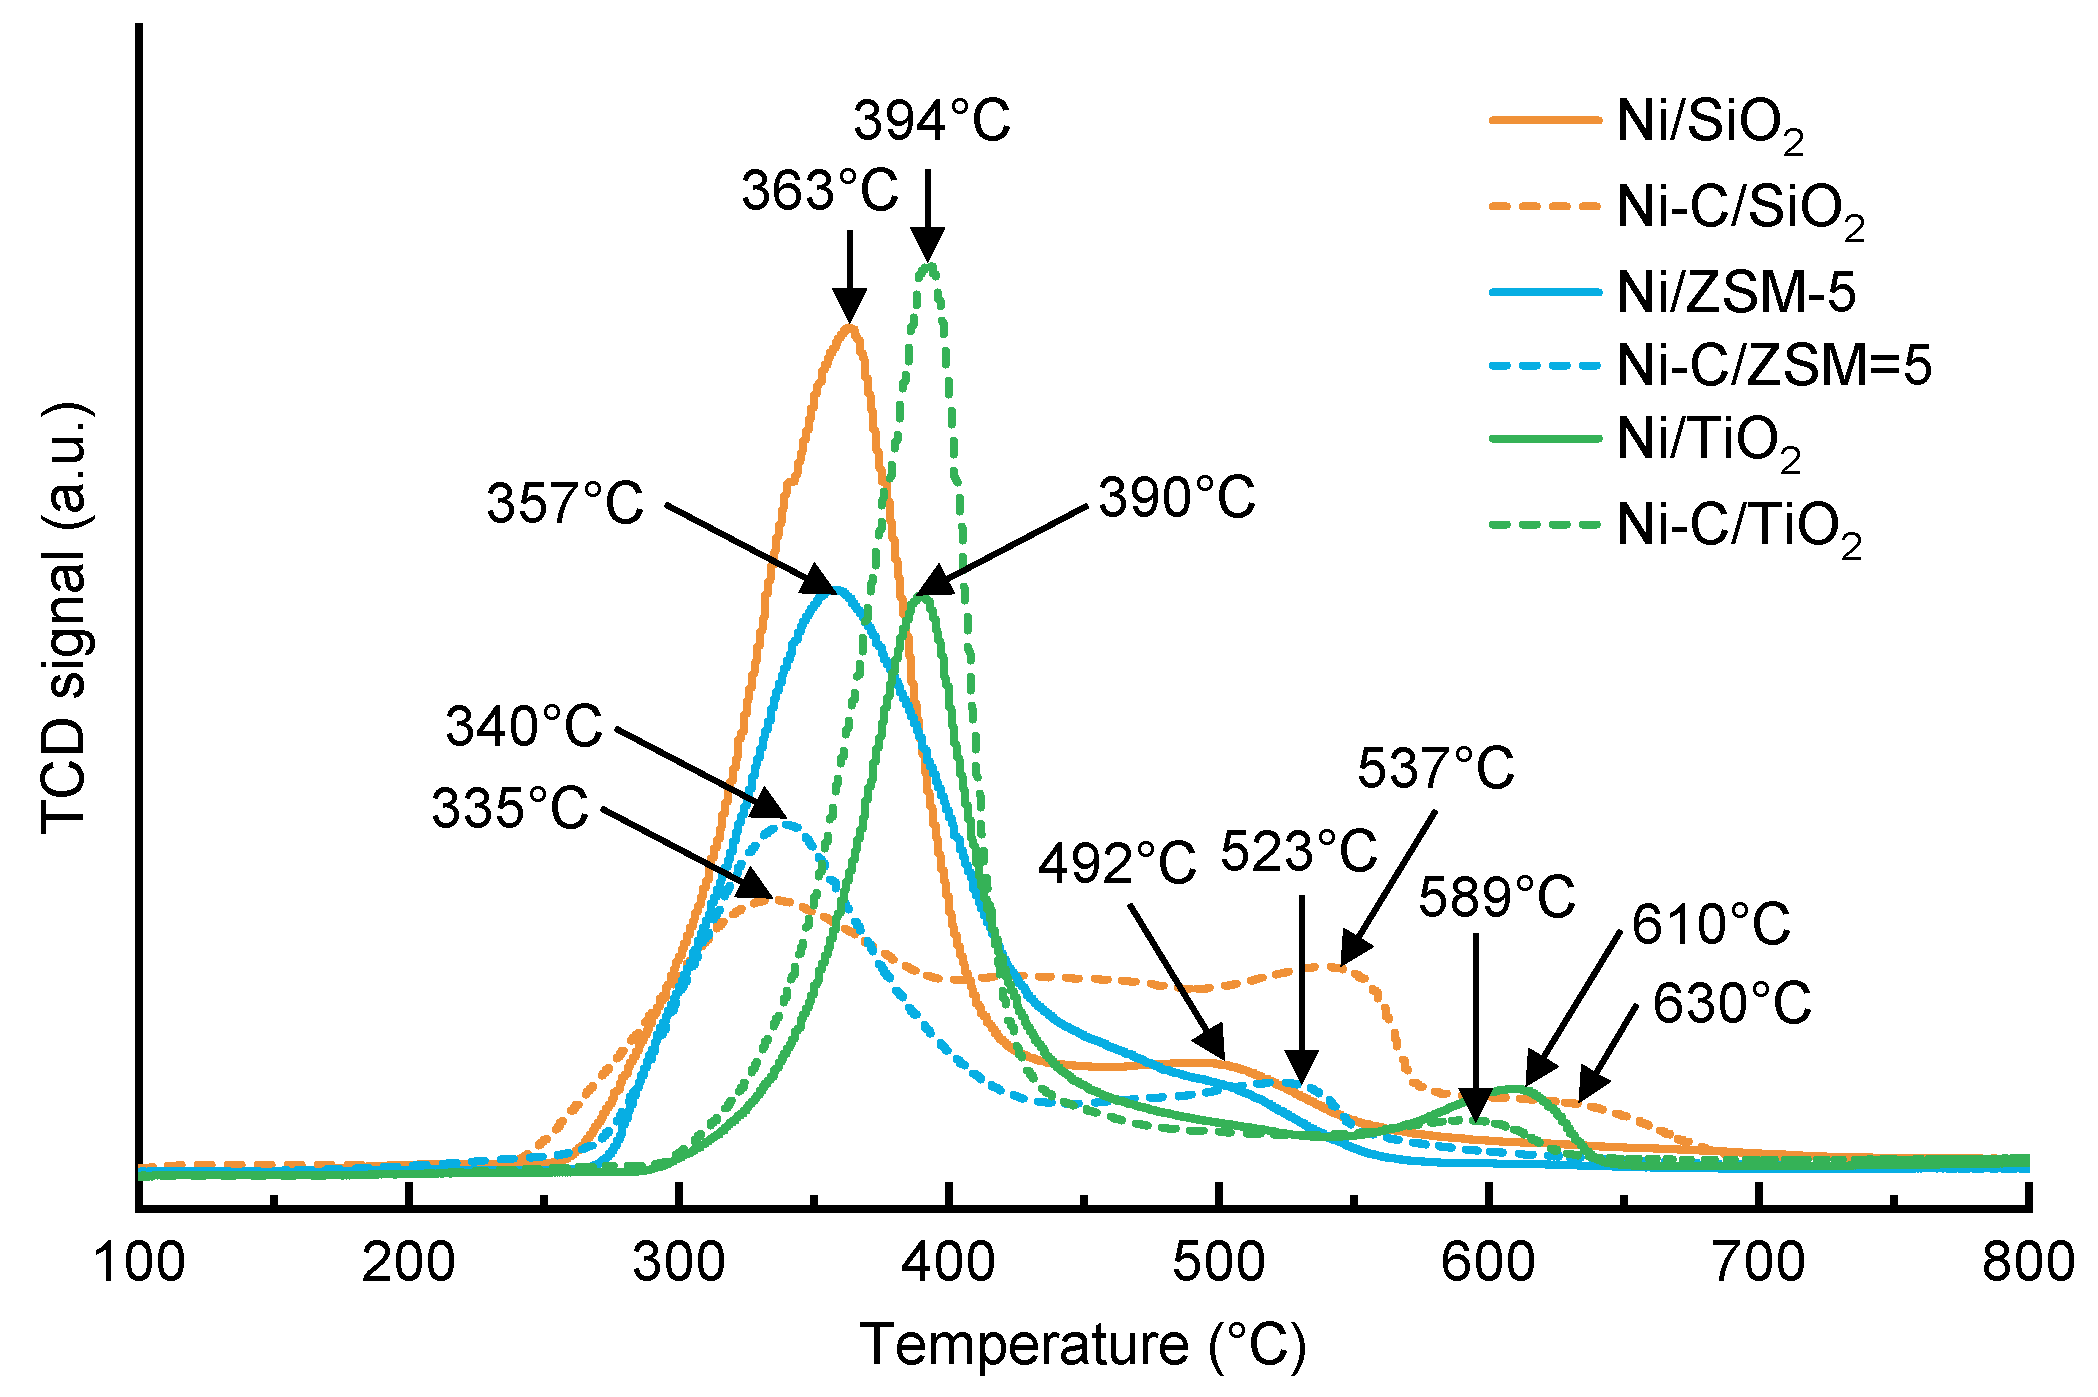
The reducibility of the developed catalysts, metal-support interaction, and influence of the promoter on metal-support interaction were investigated using H
2-TPR (temperature programmed reduction) measurements. The H
2-TPR profiles of investigated catalysts are exhibited in
Figure 3.
The distinctive effect of doped C on NiO reduction and metal-support interaction was indicated by the changes in the TPR profiles. A reduction band in the temperature range of 300–450 °C, typically assigned to the reduction of nickel oxide or Ni
2+ species without or with low interaction with the support [
23], was exhibited by all investigated catalysts. The reduction of Ni/SiO
2 occurred in two stages. The intense low-temperature hydrogen consumption peak centered at 363 °C with a shoulder at 342 °C was attributed to the reduction of weakly or non-interacted NiO species. The second low intense shoulder peak with a maximum at 492 °C indicated the reduction of NiO having intermediate interaction with the support. Earlier studies explicitly support the complete reduction of Ni/SiO
2 between 300 °C and 600 °C [
24]. The extended second shoulder peak beyond 600 °C might be attributed to the low quantity of NiO having strong interaction with the support [
25]. The presence of C had a huge effect on the Ni–SiO
2 interaction. Ni-C/SiO
2 was reduced in three stages. The low-temperature reduction peak shifted to a much low temperature with a maximum at 335 °C and severely reduced the intensity. Two shoulder peaks, which indicated a strong metal-support interaction, were observed above 500 °C. The low intense high-temperature shoulder peak between 600 °C and 630 °C was noted as the highest temperature peak among investigated catalysts, thereby confirming the highest metal-support interaction in Ni-C/SiO
2. The results explicitly indicated that Ni species were well dispersed over SiO
2 in the presence of C.
The low-temperature broad reduction band of Ni/ZSM-5 with a peak centered at 357 °C depicted the presence of Ni-species lightly or not bounded with ZSM-5 and/or positioned in the supercages, cavities, and/or channels of ZSM-5. The addition of C lowered the intensity of low-temperature peaks. However, a newly generated high-temperature peak with a maximum at 523 °C vividly portrayed the slightly improved Ni–zeolite interaction. Considering the reduction profiles of Ni-C/SiO2 and Ni-C/ZSM-5, we could assume that Ni was supported over the surface of SiO2 and ZSM-5 and on the surface of the promoter C, thereby proving the better metal-support interaction. Among the non-doped catalysts, Ni/TiO2 showed a high-temperature low-intense reduction peak centered at 610 °C, which could be assigned to the significant interaction of Ni2+ with TiO2. However, the incorporation of C lowered the intensity of high-temperature reduction peaks and increased the intensity of low-temperature peak centered at 394 °C. This finding revealed the easy reduction and lowered Ni–TiO2 interaction upon C-addition and could be attributed to the pre-filling of pores of TiO2 with C during impregnation that caused aggregation of bulk Ni-species over the surface of TiO2. These assumptions were also confirmed by the STEM-EDS elemental scanning results shown later.
The textural properties of all nickel catalysts and bare supports were evaluated by nitrogen adsorption-desorption isotherms. Isotherms are shown in
Figure 4, and the physicochemical characteristics obtained from N
2 adsorption-desorption isotherms and XRD patterns (
Figure 5) are presented in
Table 1. The commonly exhibited type II isotherms were presented by Ni-based catalysts following International Union of Pure and Applied Chemistry (IUPAC) classification [
26]. However, the different supports exhibiting diverse hysteresis loops might be attributed to the different pore structures.
As seen in
Figure 4, SiO
2 exhibited type II isotherms with an H3-H4 hysteresis loop, thereby indicating a meso-macroporous structure. The sharp increase in adsorption amount from relative pressure = 0.7 might be attributed to the fairly narrow pore size distributions, which was further confirmed from the pore-size distribution curve in
Figure S5. The figure also indicated that the pore size distributions were mainly distributed in a region of >25 nm diameter (meso-macroporous-region). Impregnation of Ni decreased the width of the hysteresis loop to a likely H4, indicating a decrease in the amount of N
2 adsorption. This meant the destruction of the mesoporous structure by the anchored Ni particles, which resulted in low surface area and total pore volume (
Table 1) [
27]. In addition, the hysteresis loop indicated a high pore size uniformity, as shown in
Figure S5. The addition of C improved the surface area of Ni/SiO
2, which designated the inhibition of Ni-particle agglomeration in the presence of C. In short, the doped C improved the overall surface characteristics and metal-support interaction of Ni/SiO
2 (
Table 1). The catalytic performance of Ni-C/SiO
2 was higher compared with that of Ni/SiO
2 due to its improved surface characteristics, higher dispersion, and metal-support interaction. Similar to SiO
2, TiO
2 exhibited type I isotherms with H4 hysteresis loops. The incorporation of Ni largely diminished its surface area from 86 m
2/g to 4 m
2/g, whereas the addition of C improved the surface area to 31 m
2/g. This higher surface area might be attributed to the similar doped C effect in Ni-C/SiO
2.
Figure 4 also shows the isotherms of free ZSM-5, Ni/ZSM-5, and Ni-C/ZSM-5. The isotherm with a high adsorption volume at a relative pressure of 0.1 specifically indicated the existence of the micropores in the zeolites [
28]. The rectangular H4 hysteresis loop identified at a high relative pressure (above 0.5) corresponded to the mesopores in the zeolite. The impregnation of Ni and Ni–C eliminated the microporosity, whereas the hysteresis loop was not altered. The impregnation of Ni reduced the total surface area, whereas pore volume remained intact. Furthermore, the BET surface area of the C-doped Ni/ZSM-5 was slightly higher than that of the non-doped catalyst, and the former subsequently possessed higher initial catalytic activity than the later.
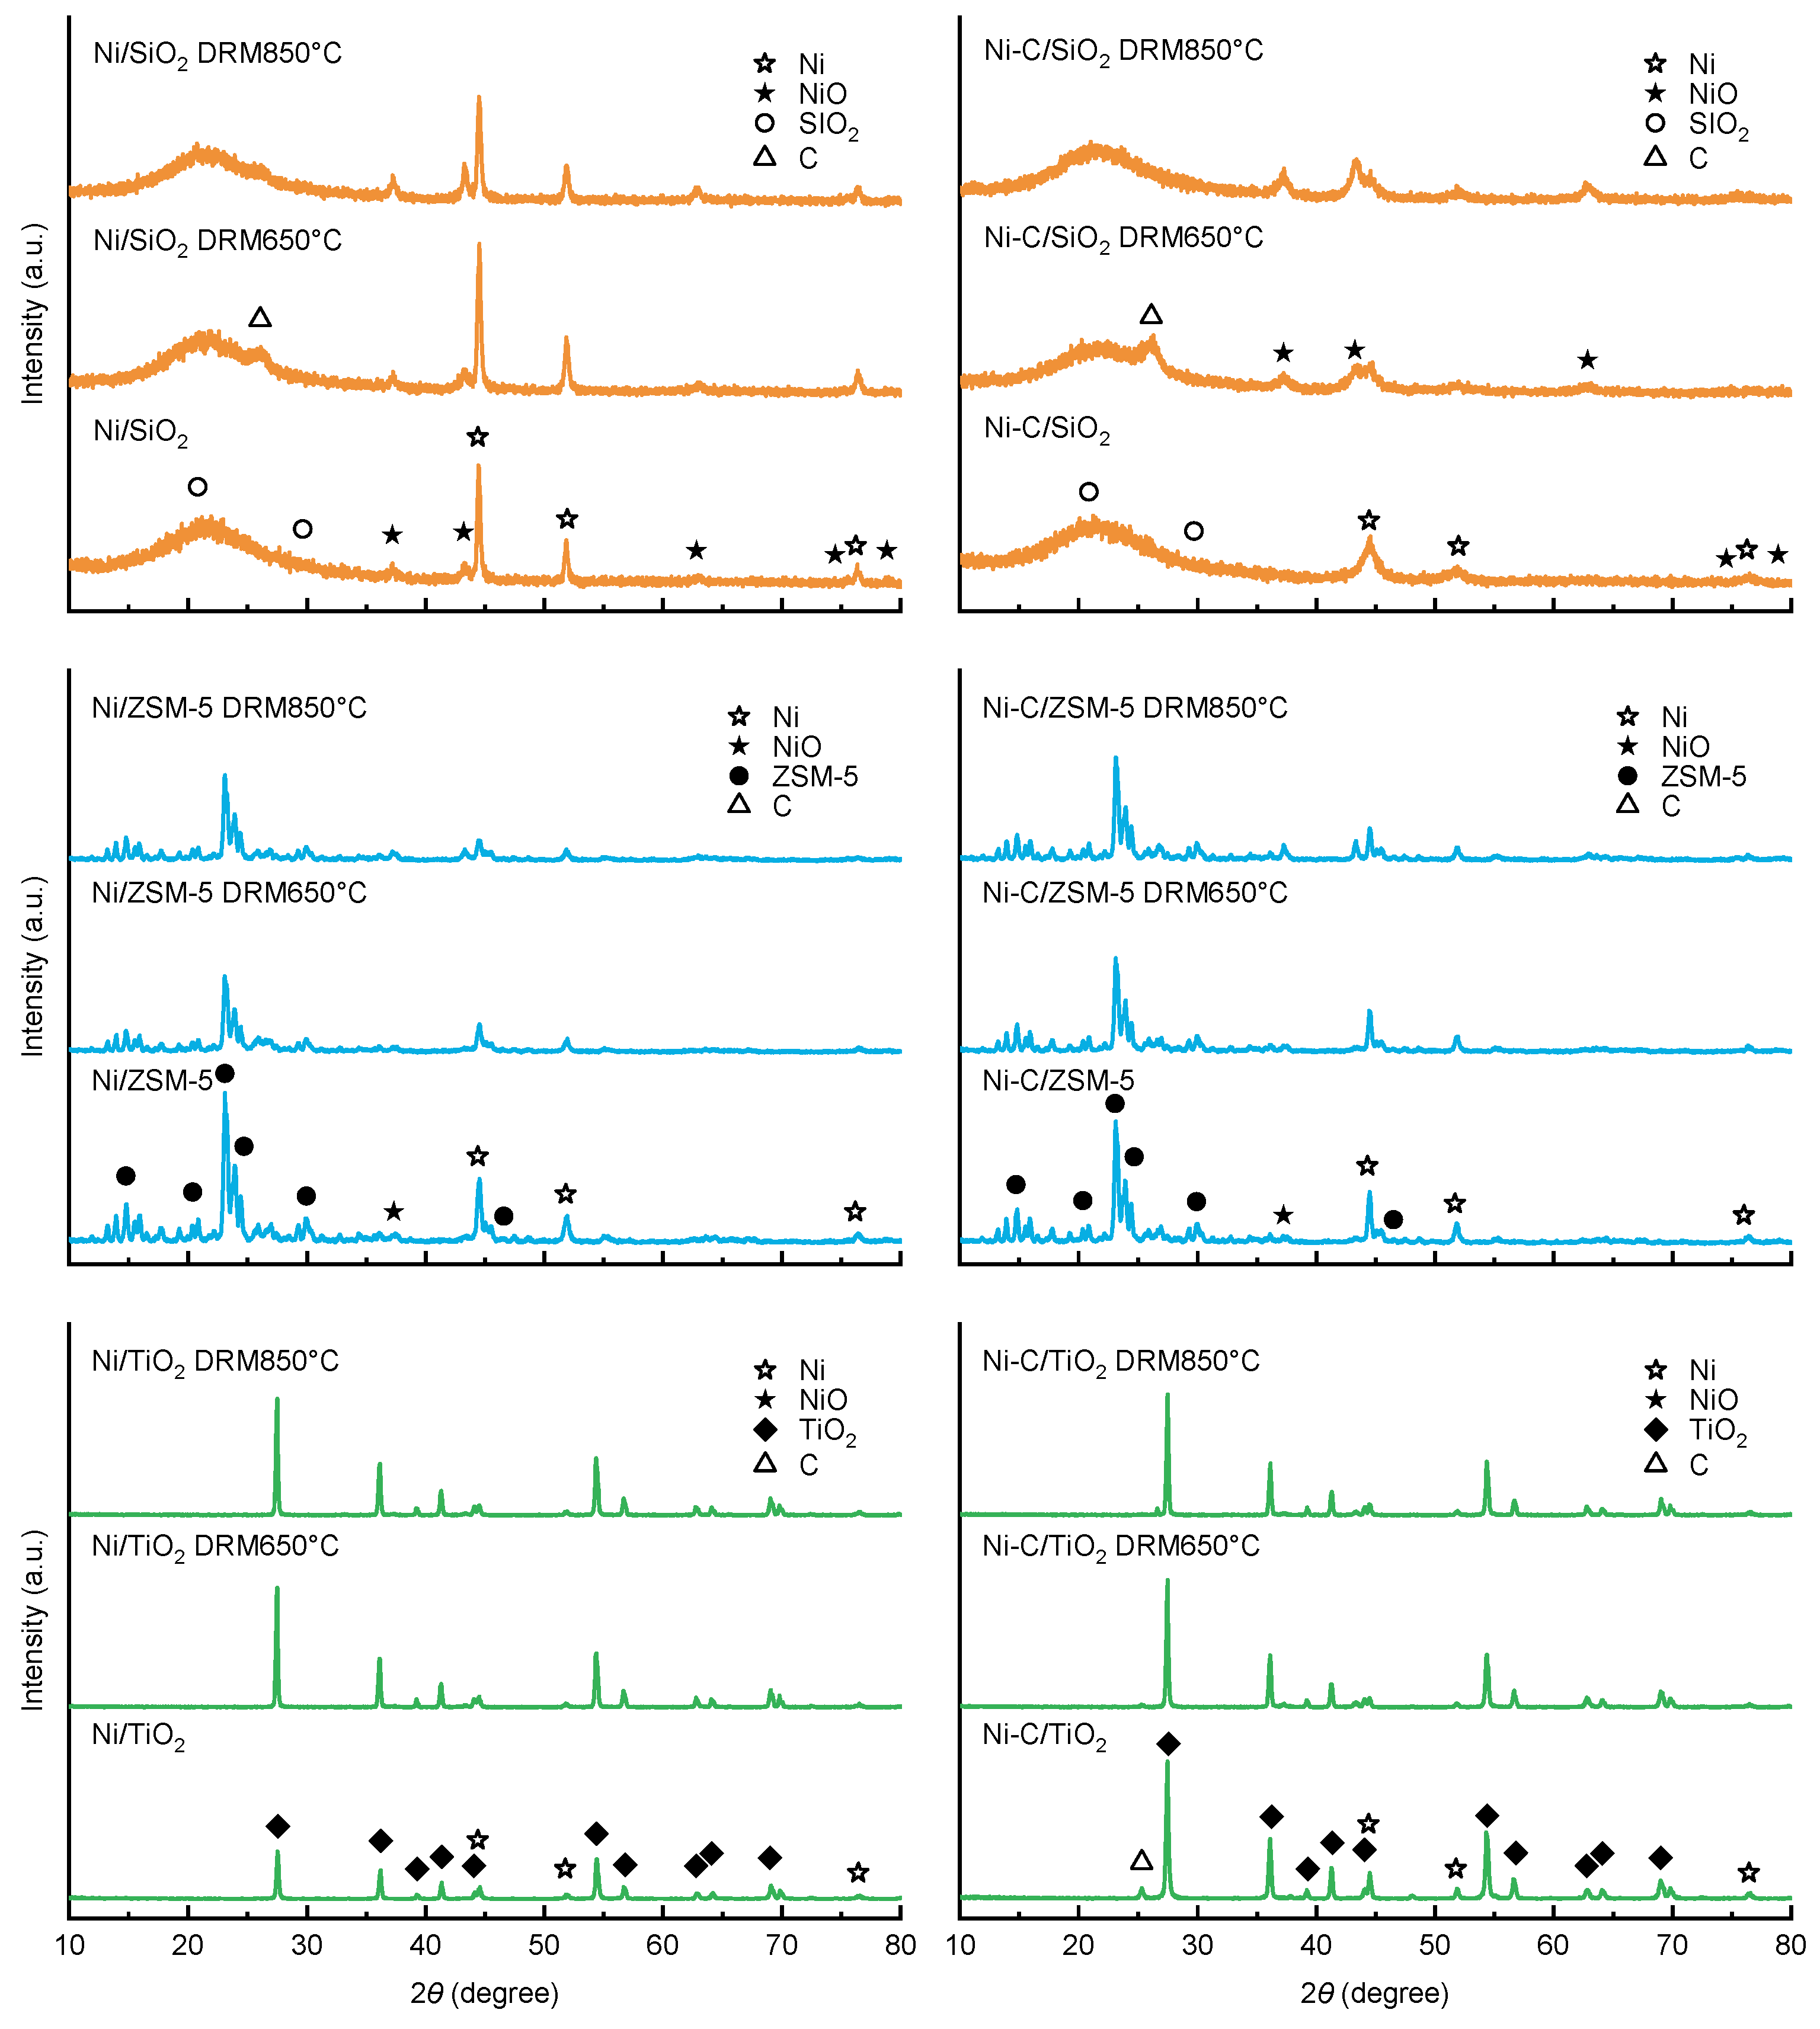
The crystalline structure of catalysts, the size of Ni particles, and their alteration upon DRM were clarified from X-ray diffraction patterns.
Figure 5 depicts the recorded XRD patterns. Average Ni crystallite size was estimated from diffraction peaks at 2
θ = 44.6°, 51.9°, and 76.8°. The addition of C to Ni/SiO
2 reduced its average Ni-crystallite size from 33.52 nm to 16.89 nm, thereby indicating that C promoted the widespread dispersion of Ni over SiO
2. These results were consistent with the findings in pore structure and H
2-TPR analyses. Slightly intense NiO phases were found in Ni/SiO
2 diffraction pattern as identified by the peaks centered at 2
θ = 37.4°, 43.5°, and 63.2°, designating small quantity of incompletely reduced NiO at 850 °C. This finding was supported by the extended shoulder peak of Ni/SiO
2 in the TPR profile (
Figure 3). However, NiO diffraction peaks were not found in the Ni-C/SiO
2 diffraction pattern. It might be because of an easy NiO reduction or its high dispersion in the presence of glucose, rendering the XRD detection difficult. At the same time, the reappearance of NiO peaks upon DRM at 850 °C indicated the agglomeration of highly dispersed NiO and enabled its XRD detection. The high degree of Ni-dispersion in the presence of C resulted in the high initial activity of Ni-C/SiO
2 (
Figure 1 and
Figure 2). The less intense XRD peaks observed with Ni-C/SiO
2 might be attributed to low crystallinity and good dispersion upon C addition. The comparable Ni-crystallite sizes in
Table 1 before and after DRM clearly eliminated the possibility of particle agglomeration at the high-temperature reaction. Thus, catalyst deactivation owing to particle agglomeration could be excluded. Furthermore, a noticeable graphitic carbon peak could be found after DRM at 650 °C (as seen in peaks centered at 2
θ = 26.4°). The fast catalyst deactivation of Ni supported over SiO
2 could be attributed to this high carbon deposit (
Figure 1). Thus, the deposition of carbon atoms either destabilized the adsorption capacity of clean active catalyst phases or hindered it from reacting with feed gases. However, the peaks for carbon were absent after DRM at 850 °C due to very low or negligible carbon deposition. In addition to the diffraction peaks that corresponded to Ni-phases, the diffraction peaks corresponded to the NiO phases became evident after DRM for Ni/SiO
2 and Ni-C/SiO
2, especially at 850 °C. This result indicated the existence of non-reduced NiO phases even after reaction or reoxidization at the high temperature. The H
2-TPR and XRD results concisely validated the high activity and stability of Ni-C/SiO
2 at high temperatures during the entire analysis (
Figure 1 and
Figure 2). Compared to Ni/SiO
2, Ni/ZSM-5 presented fairly similar diffraction peaks in the presence of added C. By contrast, the diffraction intensity of Ni/TiO
2 was reduced upon C-addition. Furthermore, NiO and/or Ni crystal sizes were increased after C-addition, thereby indicating the low effect of C on Ni-dispersion in ZSM-5 and TiO
2 supports. The presence of NiO peaks in Ni/ZSM-5 samples after reduction at 850 °C might be attributed to the difficulty in reducing the deeply placed Ni-particles at internal cavities of ZSM-5. Furthermore, the comparable H
2-TPR profiles and XRD patterns of ZSM-5 supported samples indicated the neutral influence of C on Ni/ZSM-5. These results revealed that C played an inverse effect on the characteristics of Ni/TiO
2. The neutral and negative influences of C on the physicochemical characteristics of Ni/ZSM-5 and Ni/TiO
2 were evident in the similar and low catalytic performance of Ni-C/ZSM-5 and Ni-C/TiO
2 (
Figure 1 and
Figure 2), respectively. The higher initial catalytic activity of Ni-C/ZSM-5 than that of Ni/ZSM-5 might be attributed to the slightly high Ni dispersion in the presence of C, which was confirmed by the slightly less intense XRD peaks and H
2-TPR profile.
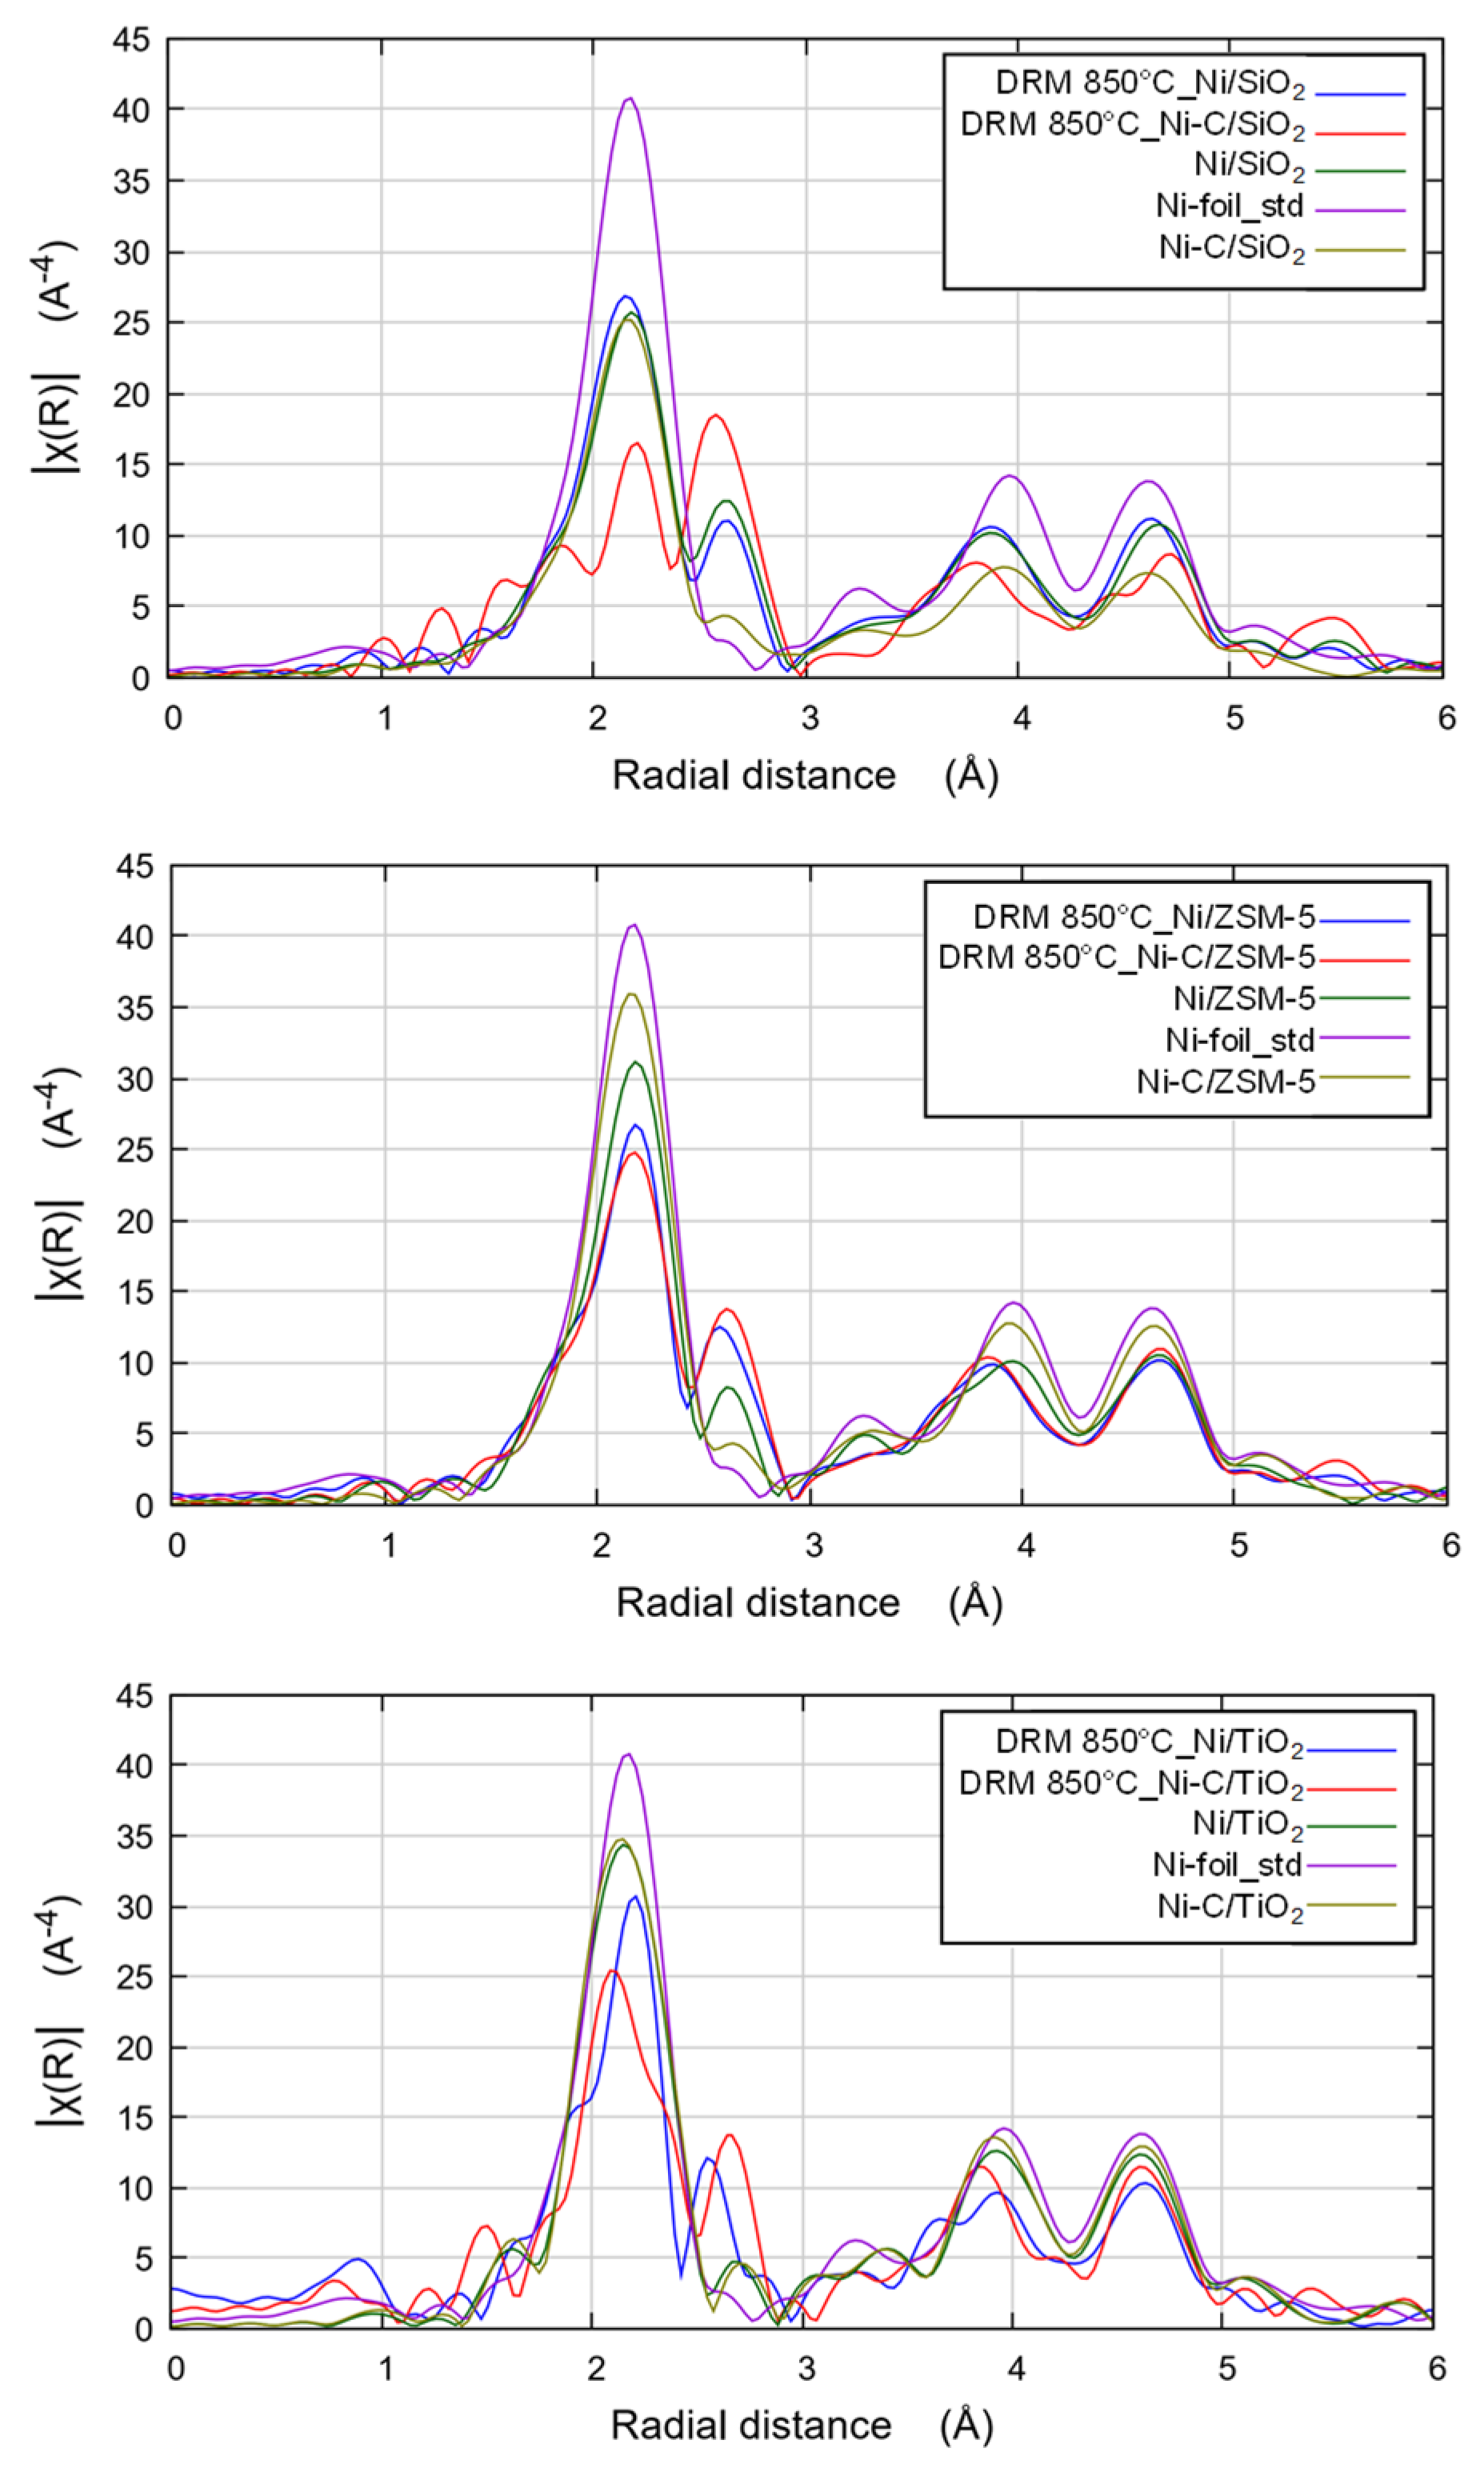
EXAFS analyses were conducted to confirm the characteristics of catalysts before and after DRM. EXAFS profiles are shown in
Figure 6. The EXAFS profile of Ni-C/SiO
2 clearly followed the Ni-foil profile, thereby indicating complete reduction as confirmed with XRD patterns in
Figure 5. However, Ni/SiO
2 analogous to Ni-foil was attributed to the presence of non-reduced NiO phases. In addition, NiO peaks became prominent after DRM. The declined intensity was credited to the abridged size of the supported Ni particle. The EXAFS patterns of Ni-catalysts supported over ZSM-5 and TiO
2 also clearly supported the described H
2-TPR and XRD results.
Given that XRD confirmed the existence of produced carbon after DRM, the nature and stability of as-produced carbon were confirmed with TGA (thermogravimetric analysis) under an air atmosphere. TGA traces of catalysts before and after DRM at 650 °C and 850 °C are shown in
Figure S6. In general, the weight loss of fresh non-doped catalysts below 500 °C was attributed to the desorption of binder gas vapors inside the pores. The successive weight gain was due to oxidation of reduced Ni to NiO in the presence of O
2. However, the weight loss exhibited by the C-supported catalyst after 500 °C was due to the removal of C with O
2. The less intense C-removal of Ni-C/SiO
2 indicated its higher interaction with the materials compared with that of Ni–C/ZSM-5, thereby supporting XRD and TPR results. Similarly, the spent catalysts exhibited similar weight loss after 500 °C based on the extent of C-deposition during DRM. The least weight loss was exhibited by the spent catalyst at 850 °C, as shown in
Figure 7, pointing out its low C-deposit, which was in good agreement with previously discussed results. The removal of deposited C together with in-situ present C in catalysts might be the reason for their high weight loss observed with C-doped catalysts. The TGA results explicitly proved that C-doping did not improve the C-deposition resistance of Ni/SiO
2, but enhanced its stability and activity. Irrespective of the behavior of the SiO
2- and ZSM-5-supported catalysts, the spent Ni/TiO
2 showed a weight gain that indicated Ni oxidation and no carbon deposition. These results effectively validated the XRD results.
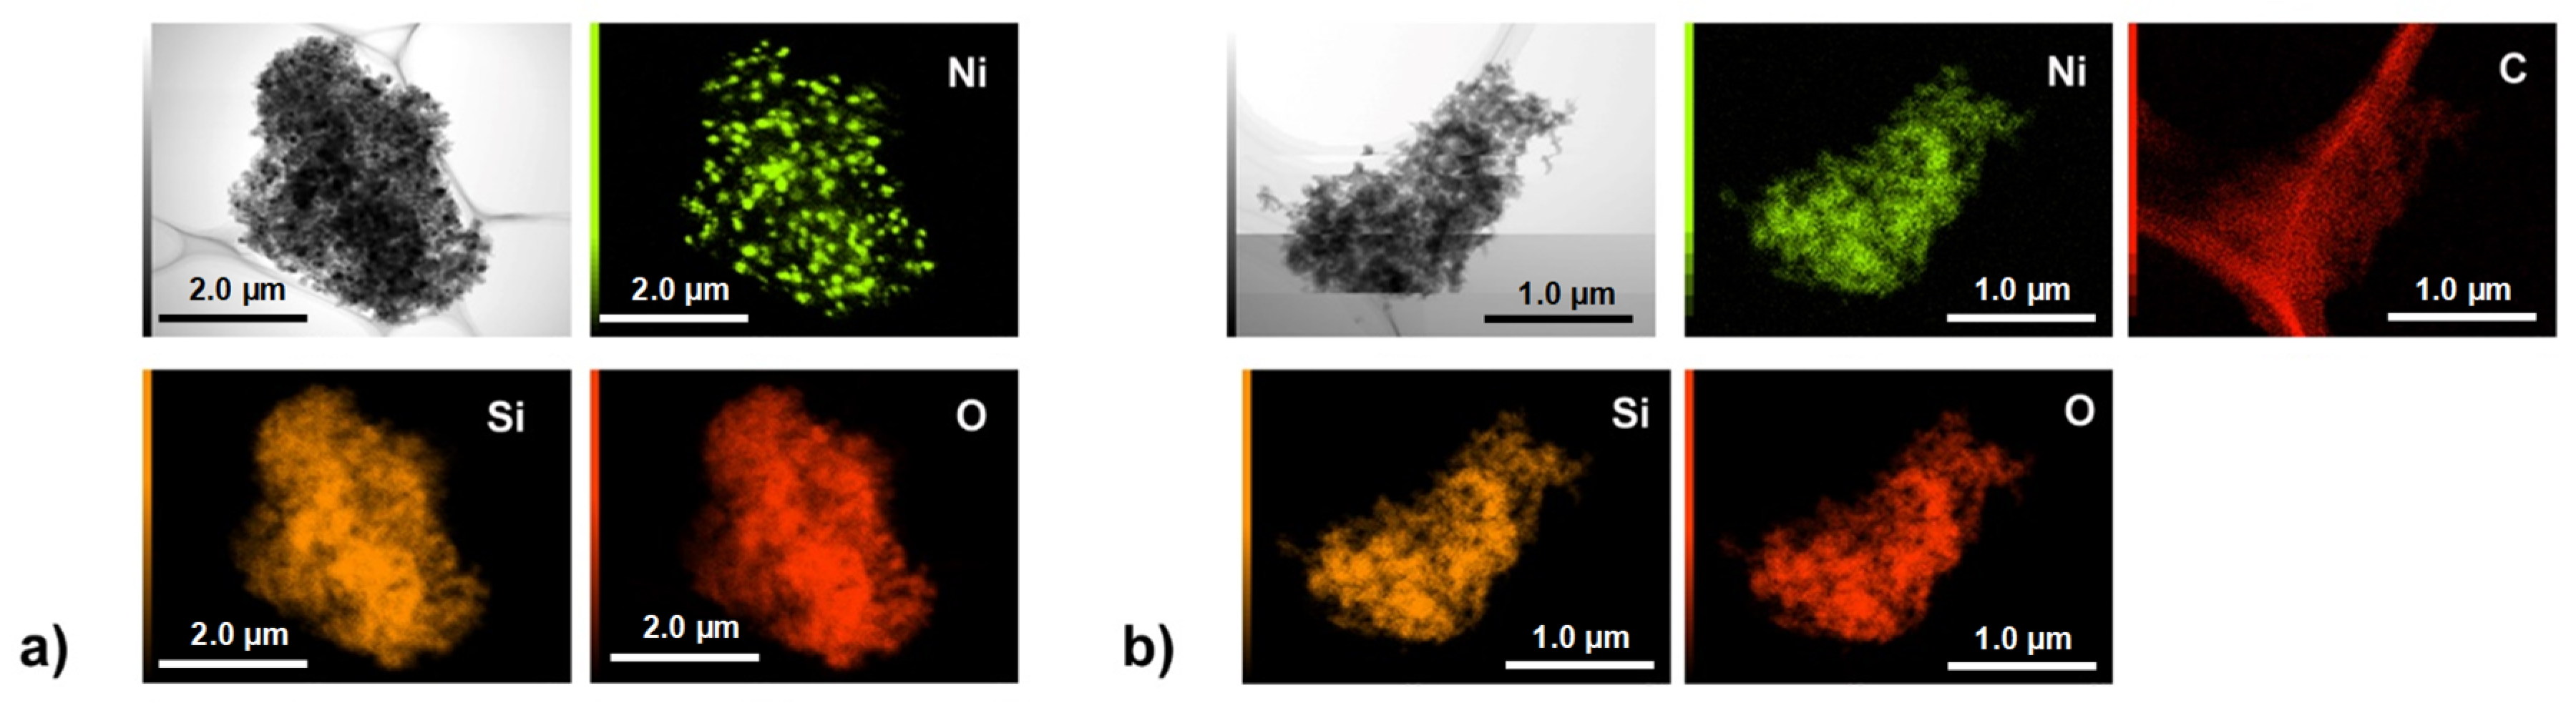
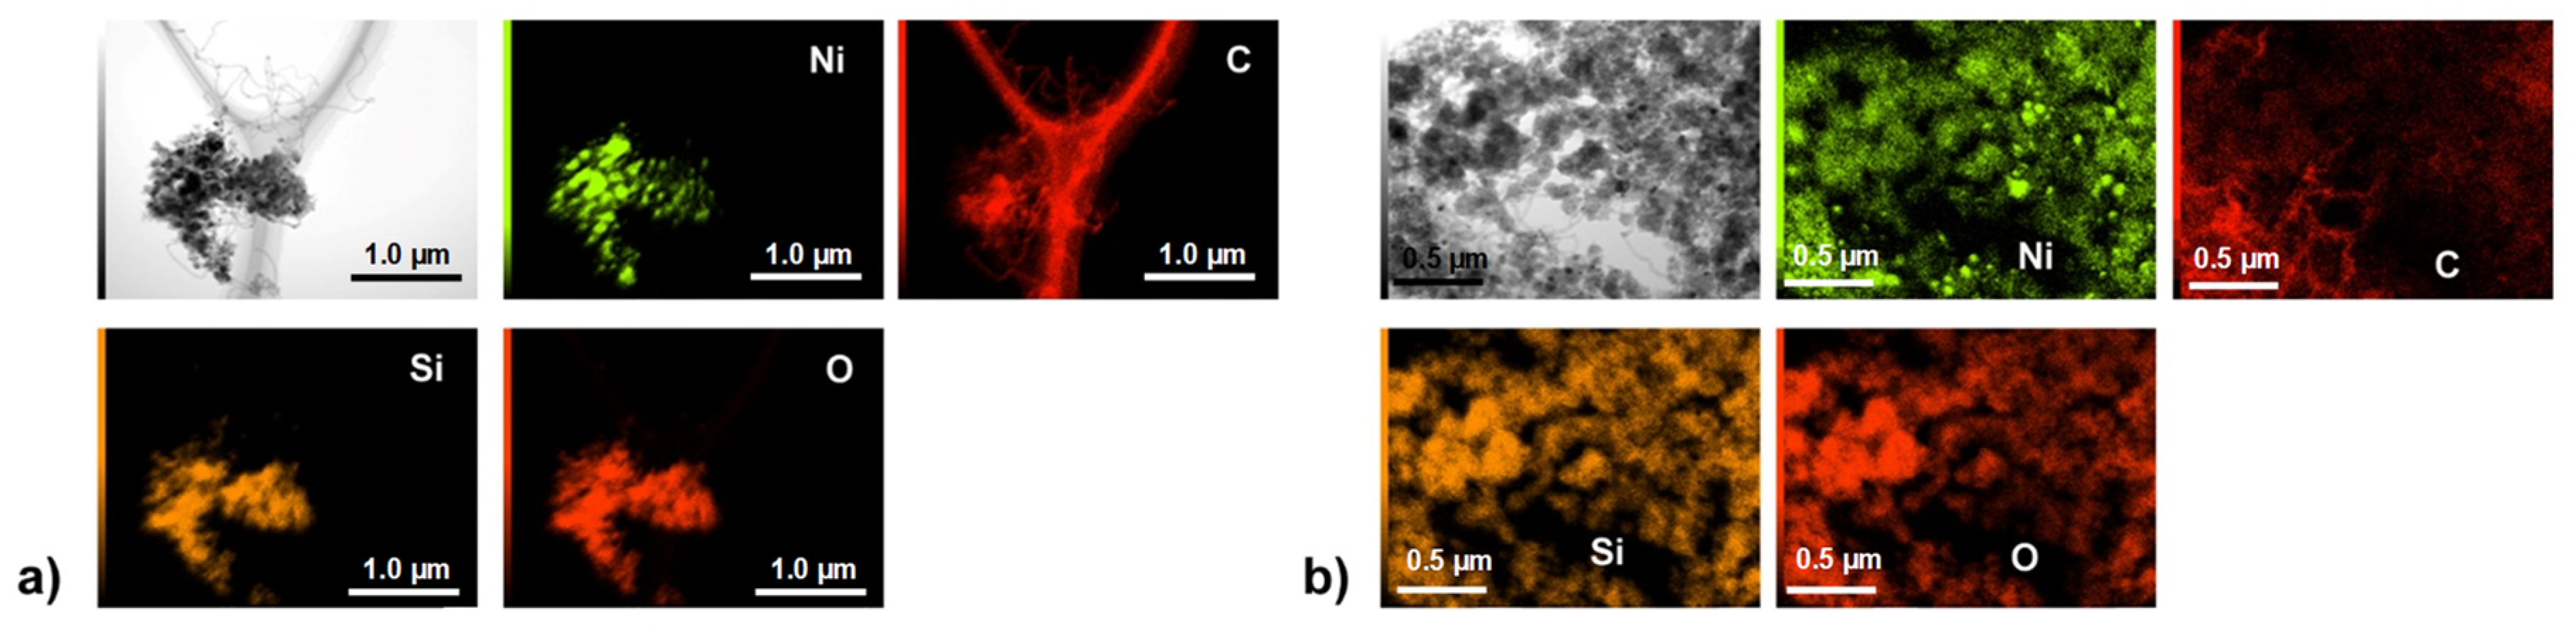
Figure 8 reveals that the addition of glucose effectively eliminated the Ni-agglomeration tendency. The bright spots in
Figure 8a indicate the agglomerated Ni-species, whereas such agglomerations are absent in
Figure 8b, exhibiting a homogeneous distribution of Ni. These phenomena resulted in high catalytic performance (
Figure 1 and
Figure 2). However, the incorporation of C in Ni/ZSM-5 catalyst did not significantly change the Ni-agglomeration (
Figure S7), thereby reflecting the similar catalytic performance of Ni/ZSM-5 and Ni-C/ZSM-5 catalysts. Different from the effect of glucose on Ni/SiO
2 and Ni/ZSM-5, extensive agglomeration occurred for Ni/TiO
2 and resulted in fast deactivation during DRM. This finding might be attributed to the strong interaction between C and TiO
2, which consecutively resulted in high Ni-aggregation.

 ,
, 


