Article

Structural Evolution of Ni-Based Co-Catalysts on [Ca2Nb3O10] Nanosheets during Heating and Their Photocatalytic Properties

1
Max-Planck-Institut für Eisenforschung GmbH, Max-Planck-Straße 1, 40239 Düsseldorf, Germany
2
Max-Planck-Institut für Festkörperforschung, Heisenbergstraße 1, 70569 Stuttgart, Germany
3
Ludwig-Maximilians-Universität München, Butenandtstraße 5–13, 81377 München, Germany
4
Uppsala University, Lägerhyddsvägen 1, 75120 Uppsala, Sweden
*
Author to whom correspondence should be addressed.
Catalysts 2020, 10(1), 13; https://doi.org/10.3390/catal10010013
Submission received: 29 November 2019 / Revised: 16 December 2019 / Accepted: 18 December 2019 / Published: 20 December 2019
(This article belongs to the Special Issue Photocatalytic Nanocomposite Materials)

Abstract

:
Nickel compounds are among the most frequently used co-catalysts for photocatalytic water splitting. By loading Ni(II) precursors, submonolayer Ni(OH)2 was uniformly distributed onto photocatalytic [Ca2Nb3O10] nanosheets. Further heating of the nanocomposite was studied both ex situ in various gas environments and in situ under vacuum in the scanning transmission electron microscope. During heating in non-oxidative environments including H2, argon and vacuum, Ni nanoparticles form at ≥200 °C, and they undergo Ostwald ripening at ≥500 °C. High resolution imaging and electron energy loss spectroscopy revealed a NiO shell around the Ni core. Ni loading of up to 3 wt% was demonstrated to enhance the rates of photocatalytic hydrogen evolution. After heat treatment, a further increase in the reaction rate can be achieved thanks to the Ni core/NiO shell nanoparticles and their large separation.

1. Introduction

Sunlight and water are plentiful resources on Earth, as they sustain various life forms, including the human civilization. Photocatalytic water splitting into hydrogen has been envisioned to power the globe sustainably. Many semiconducting compounds have been developed as water splitting photocatalysts [1,2], where the basic requirements include good absorption of sunlight and high stability in water. Moreover, nanostructured photocatalysts have higher specific surface areas to provide more reaction sites and allow shorter transport paths for photogenerated carriers [3]. In order to mitigate enhanced recombination on the surface of nanostructured photocatalysts, nanoparticulate co-catalysts for hydrogen evolution reaction (HER) and/or oxygen evolution reaction (OER) can be introduced, and such nanocomposites are the state of the art for photocatalysts [1,2,3,4,5].
Compared to numerous types of photocatalysts, only a handful of co-catalysts have been employed in photocatalytic nanocomposites. In particular, nickel-based compounds are widely used, including NiOx, NiO, Ni(OH)2, and metallic Ni [1,2,3,4]. Indeed, nickel-based compounds are well known as catalysts for electrocatalytic HER and OER [6], particularly in alkaline environments. On the OER side, many layered double hydroxides based on Ni(OH)2 yield excellent activity [7]. On the HER side, high activity has been demonstrated for Ni core/NiO shell nanoparticles, as Ni provides H adsorption sites and NiO is hypothesized to favor OH desorption [8].
β-Ni(OH)2 has a layered, Brucite-type structure, and nanostructures such as nanosheets, nanoribbons, and nanoflowers have been synthesized [9]. Thermal decomposition of Ni(OH)2 is a useful way to make NiO [10,11] and Ni [12] nanosheets. Moreover, the size of nanoparticles can be stabilized by exothermic interaction with the underlying support [13]. Low dimensional Ni-based structures have been synthesized on low dimensional supports such as niobates [13] and CdS [14] nanosheets, carbon [8], CdS [15], and ZnO [16] nanotubes, and nanoparticles of SrTiO3 and niobates [17,18,19,20]. In the early reported synthesis of NiO co-catalysts, Ni2+ was impregnated and the nanocomposites were either heated in air at ~500 °C [17], or in H2 at ~500 °C followed by re-oxidation at ~200 °C [18,19]. Many subsequent reports [20] followed similar recipes and acknowledge the uncertainty in the oxidation states by using the term NiOx catalysts. Gong et al. has found that depending on the heat treatment and gas environment, both Ni and NiO nanoparticles can be derived, as well as Ni core/NiO shell nanoparticles [8].
Thermal decomposition of Ni(OH)2 [10,21,22] and reduction of NiO [23,24,25,26] have been studied since many decades given their technological importance. In photocatalytic nanocomposites, however, co-catalysts are usually dispersed in much less quantity relative to the photoabsorber [4]. It becomes increasingly challenging to characterize the phase and chemistry of the Ni nanostructures as their size decreases. In particular, there is a lack of knowledge on the formation of these nanostructures during heat treatment.
To facilitate observation of Ni co-catalysts and their structural evolution, the photocatalytically active [Ca2Nb3O10] nanosheets were chosen as support. They are derived from the Dion–Jacobson layered perovskite KCa2Nb3O10 [27], and can be exfoliated to micrometer-sized nanosheets [28,29,30,31,32,33,34,35]. It has been shown that the band gap of ~3.9 eV remains essentially unchanged from the bulk phase down to a monolayer [35]. HER activity under ultraviolet (UV) light has been demonstrated without [36] and with Pt co-catalysts [29,30,33], and OER catalysts, such as IrOx nanoparticles [34], have been deposited. Moreover, [Ca2Nb3O10] nanosheets have a good thermal stability up to at least 500 °C [37].
In this article, we examined the dispersion, phases, oxidation states of Ni-based co-catalysts on [Ca2Nb3O10] nanosheets by scanning transmission electron microscopy (STEM) and related spectroscopy probes, as well as the structural evolution during in situ heating. HER performance of selected nanocomposites was measured under UV illumination, the results of which can be rationalized based on their nanostructures.

2. Results and Discussion
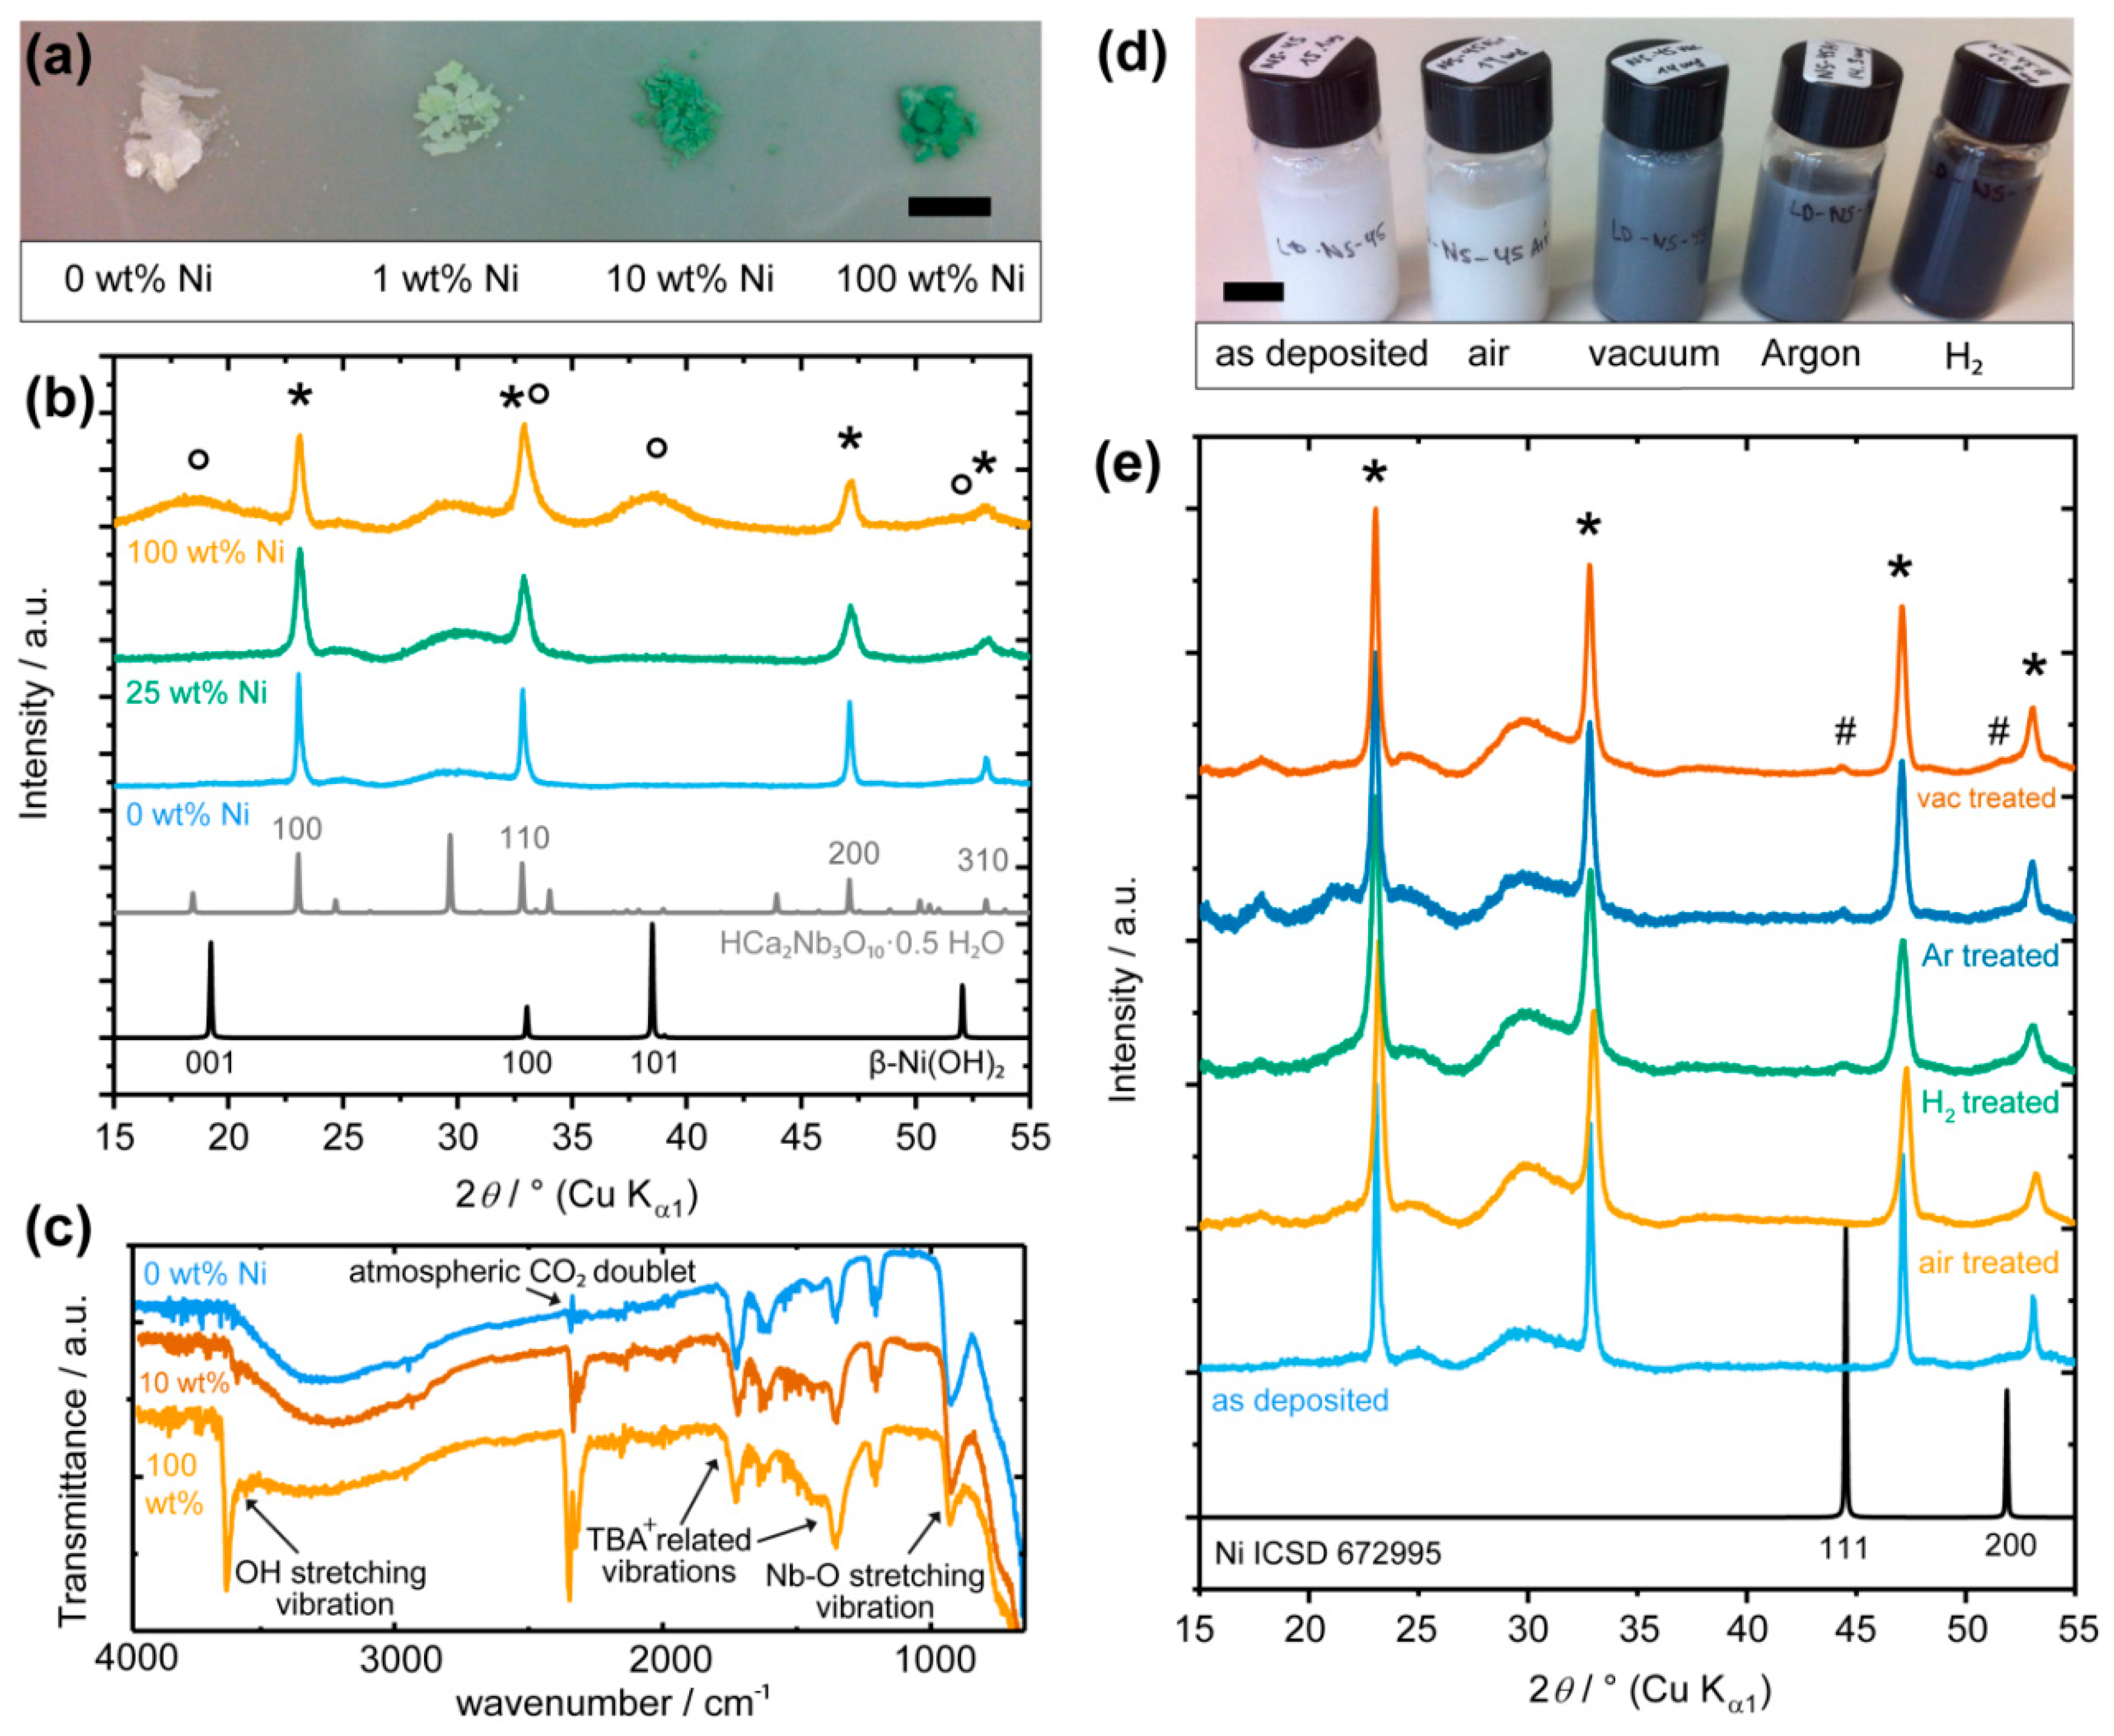
2.1. Loading of Ni on [Ca2Nb3O10] Nanosheets

The synthesis of [Ca2Nb3O10] nanosheets and the subsequent Ni deposition are described in Section 3. Different amount of Ni loading from 1 to 100 wt% is labelled by the weight of the NiCl2 precursor with respect to the [Ca2Nb3O10] nanosheets. As shown in Figure 1a, the nanocomposites gradually change from white to green color with increasing Ni loading, which suggests a continuous formation of a Ni phase. The sharp lines in the X-ray powder diffraction (XRPD) patterns (Figure 1b) marked by asterisks were indexed based on the (hk0) reflections of the precursor HCa2Nb3O10·0.5 H2O [31], as [Ca2Nb3O10] nanosheets are ordered only in the in-plane dimensions. The broad lines marked by circles can be assigned to β-Ni(OH)2 reflections, which are only visible in the nanocomposite with 100 wt% Ni loading. Furthermore, Fourier transform infrared (FTIR) spectra (Figure 1c) reveal vibration modes from the [Ca2Nb3O10] nanosheets up to 2000 cm−1, including, e.g., Nb=O at ~940 cm−1 [36] and those from the exfoliating agent tetra-n-butylammonium (TBA+) [38]. A clear OH-stretching vibration at 3640 cm−1 was only identified for the nanocomposite with 100 wt% Ni loading.
It is estimated that ~18 wt% Ni loading can cover a unit cell of [Ca2Nb3O10] nanosheets by a monolayer of β-Ni(OH)2. In order to observe the Ni(OH)2 (001) reflection, at least two monolayers of β-Ni(OH)2, or 36 wt% Ni loading, are necessary. Although challenging to characterize the phase of the co-catalysts at lower Ni loading, it is reasonable to conclude from the trend that Ni(II) species were loaded on the nanosheets with OH counter-ions that are ready to form β-Ni(OH)2 phases upon further Ni loading.
As Ni(OH)2 is known to undergo thermal decomposition from temperatures as low as 200 °C [10,21,22], heat treatment was performed at 500 °C for 10 min where the [Ca2Nb3O10] nanosheets remain stable [37]. As shown in Figure 1d, this heat treatment of the nanocomposites with 3 wt% Ni loading for 10 min at 500 °C can readily change their optical appearance depending on the environment. The nanocomposites heated in air hardly changed their color after dispersion in water. Those heated in argon and vacuum appeared dark after dispersion in water, whereas those heated in the reducing atmosphere of H2 became even darker. For as little as 3 wt% loading, additional reflection at 2θ ~45° can be observed for the nanocomposites heated in non-oxidative conditions (H2, argon, and vacuum), which is characteristic of the Ni (111) reflection (marked by # in Figure 1e).

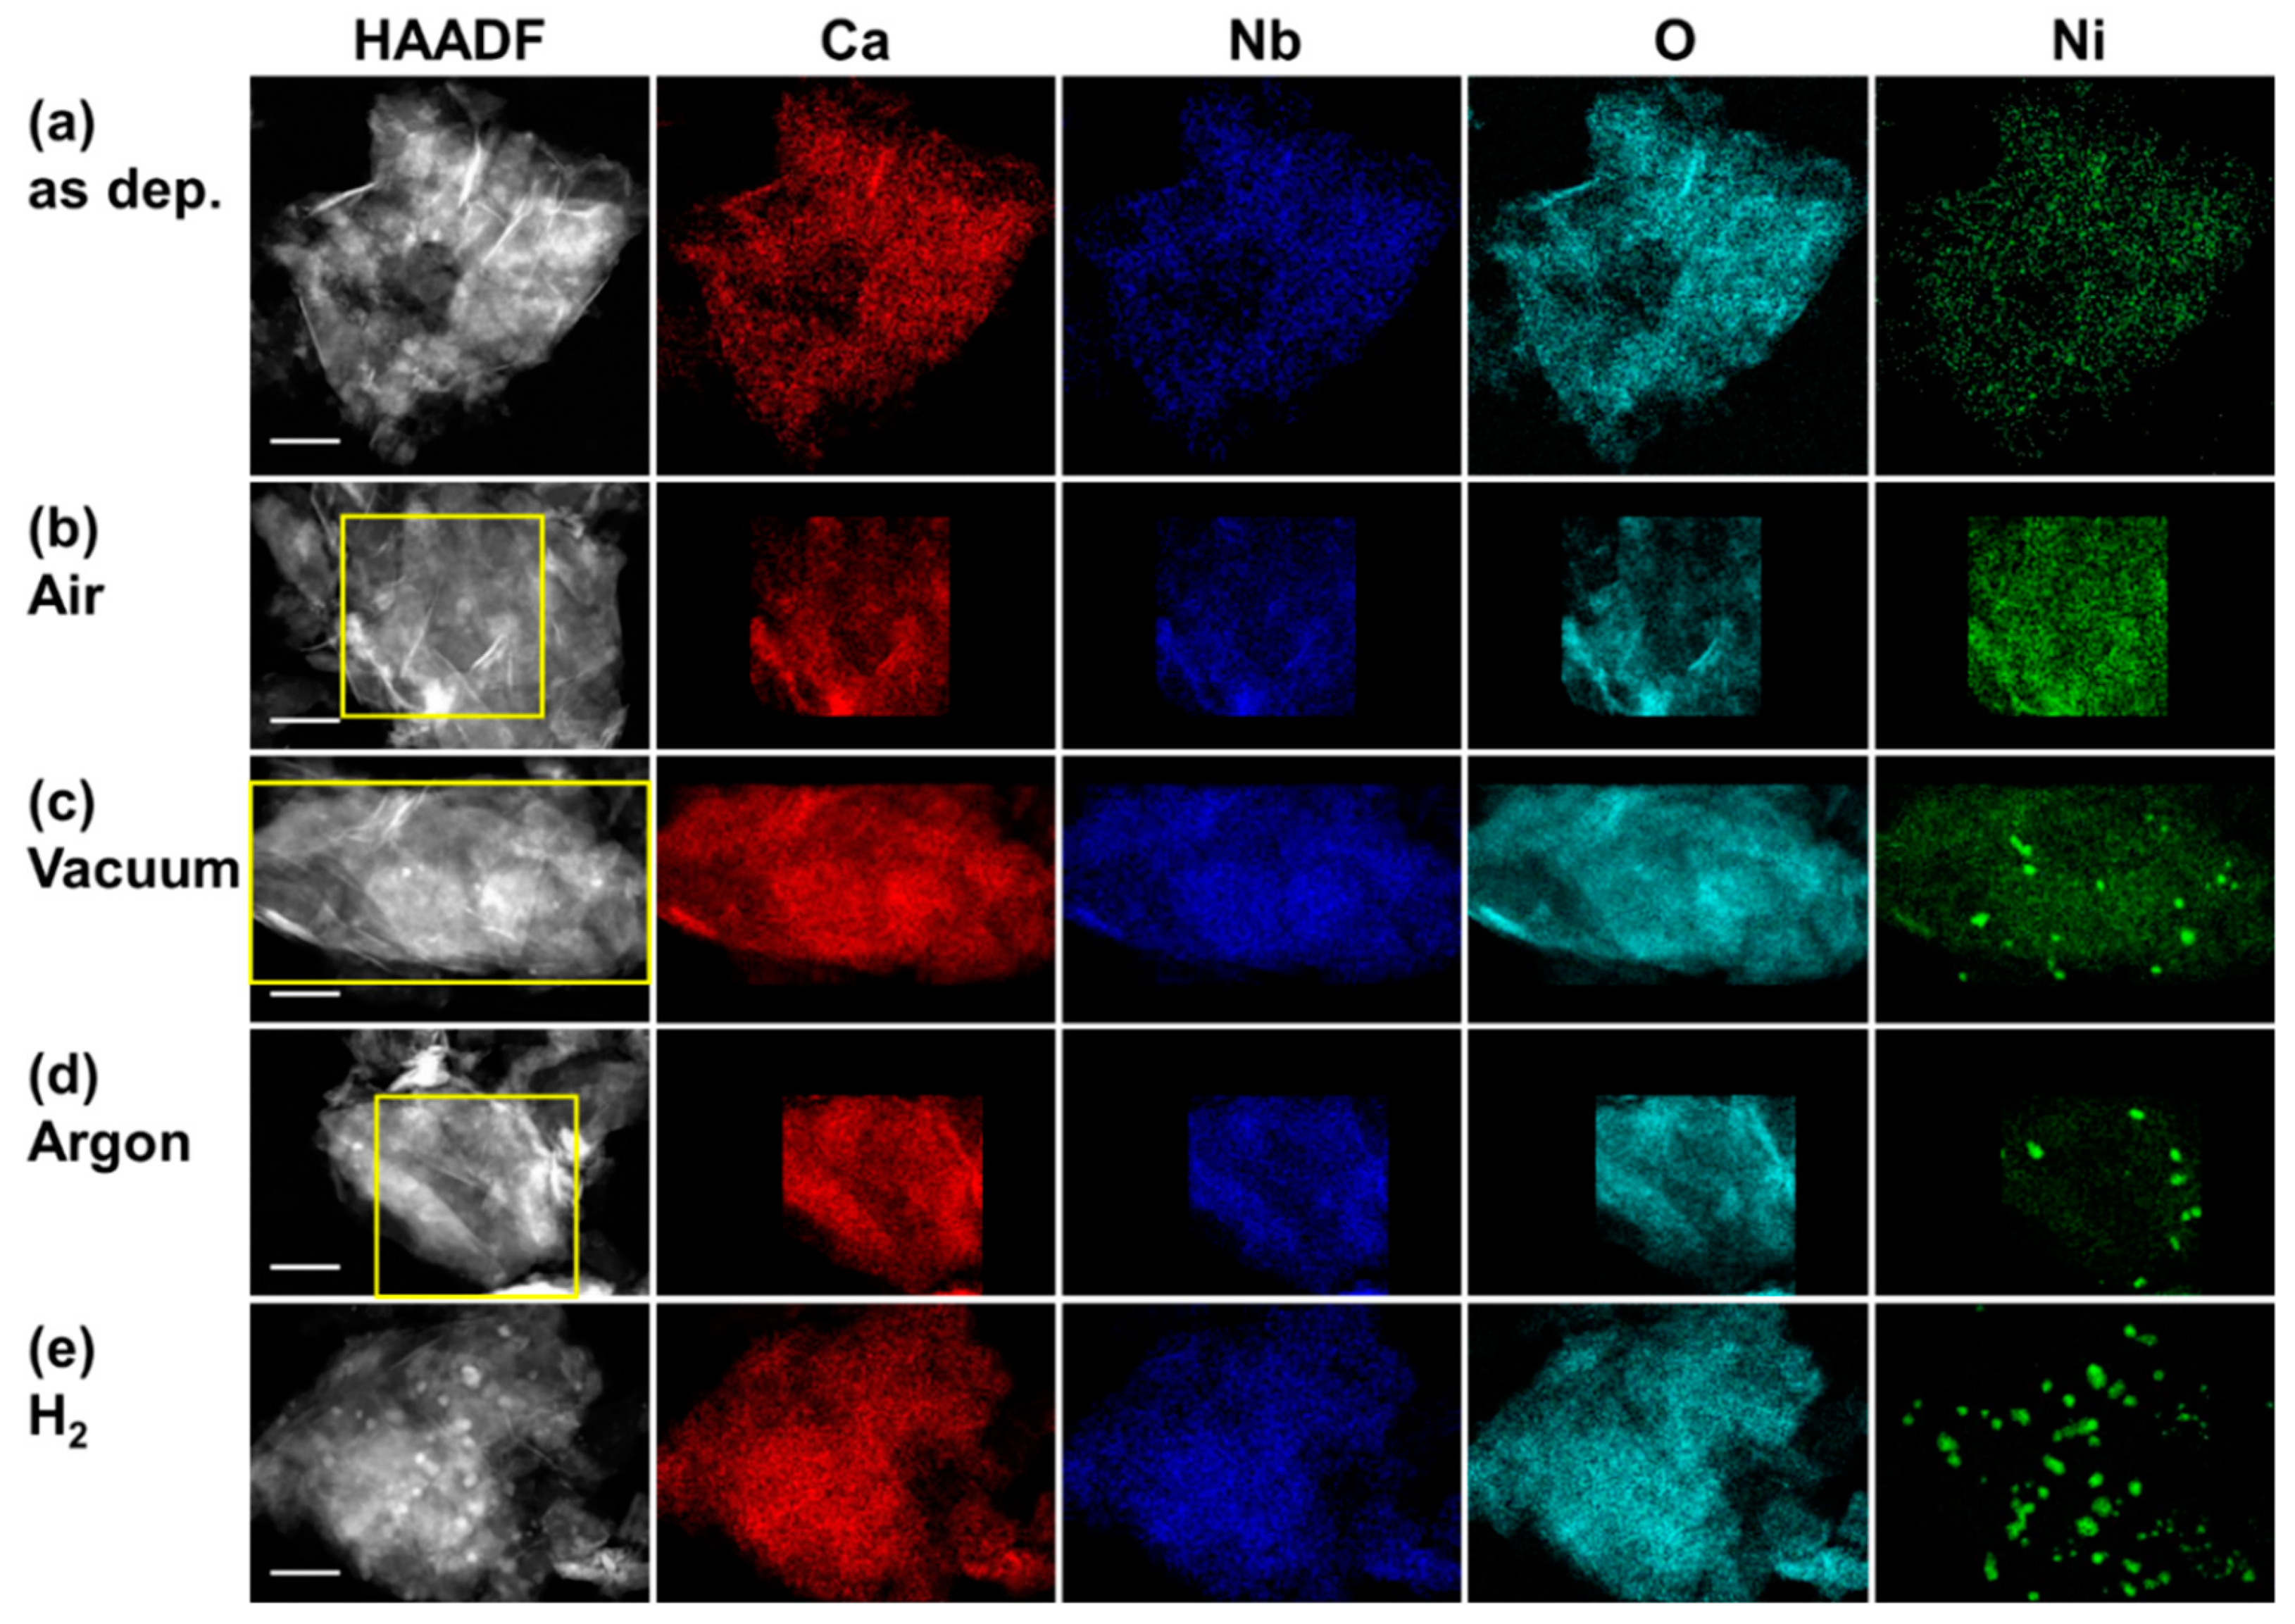
2.2. Morphology of Ni(OH)2 and Ni Nanoparticles on [Ca2Nb3O10] Nanosheets

The morphology of the nanocomposites was further studied by STEM. As shown in Figure 2, [Ca2Nb3O10] nanosheets have a size of ~1 µm. Many nanosheets are restacked on top of each other, as the dispersion diluted the exfoliating agent TBA+. The distribution of Ni over the nanosheets is conveniently revealed by energy dispersive X-ray spectroscopy (EDS) spectrum imaging. As evident in Figure 2, Ni is homogeneously distributed over the as deposited nanocomposite, consequential to the uniform coverage of Ni(II) on the nanosheets. The nanocomposite heated in air shows the same distribution. In contrast, Ni-rich nanoparticles are formed in the nanocomposites heat-treated in non-oxidizing environments, including H2, argon, and vacuum. There is a good correspondence with the XRPD observation that only these nanocomposites show diffraction lines of Ni(0).
There is little variance in the overall Ni concentration in the nanocomposites prior to and after heat treatments in various conditions. As shown in Table 1, the measured molar ratio between Nb and Ca, ~1.6, is close to the nominal value 3/2 of the [Ca2Nb3O10] nanosheets. The molar ratio between Ni and Ca, 0.14–0.16, envelops the nominal 15 mol% of Ca for 3 wt% Ni loading. Despite changes in the phase of Ni, there is no net gain or loss of Ni co-catalysts with respect to the [Ca2Nb3O10] nanosheets during the applied heat treatments.
The homogeneous distribution of Ni in the nanocomposites without heat treatment or the ones heat-treated in air agrees well to the submonolayer coverage of Ni(OH)2 below 18 wt% Ni loading. It has been shown that like many transition metals, Ni(II) bonds exothermically with [Ca2Nb3O10] nanosheets so that the homogeneous coverage on the nanosheets are more favorable than the formation of nanoparticles [13]. Upon heating in non-oxidative environments, the formation of Ni(0) nanoparticles indicates the reduction of Ni(II). It is straightforward to understand that in a reducing atmosphere, H2 can readily reduce Ni(OH)2 to form Ni(0). However, in argon or vacuum, there must be other factors to cause Ni(II) reduction. Indeed, decomposition of NiO and Ni(OH)2 to Ni has been observed [12,21,24]. In our nanocomposites, however, the carbon-rich TBA+ introduced to exfoliate the nanosheets may also act as a reductant. It is noteworthy that by heating in air, an oxidative atmosphere, Ni nanoparticle formation was not observed, which can be explained by the preferential reaction of reductants (e.g., TBA+) with O2 rather than with Ni(OH)2.

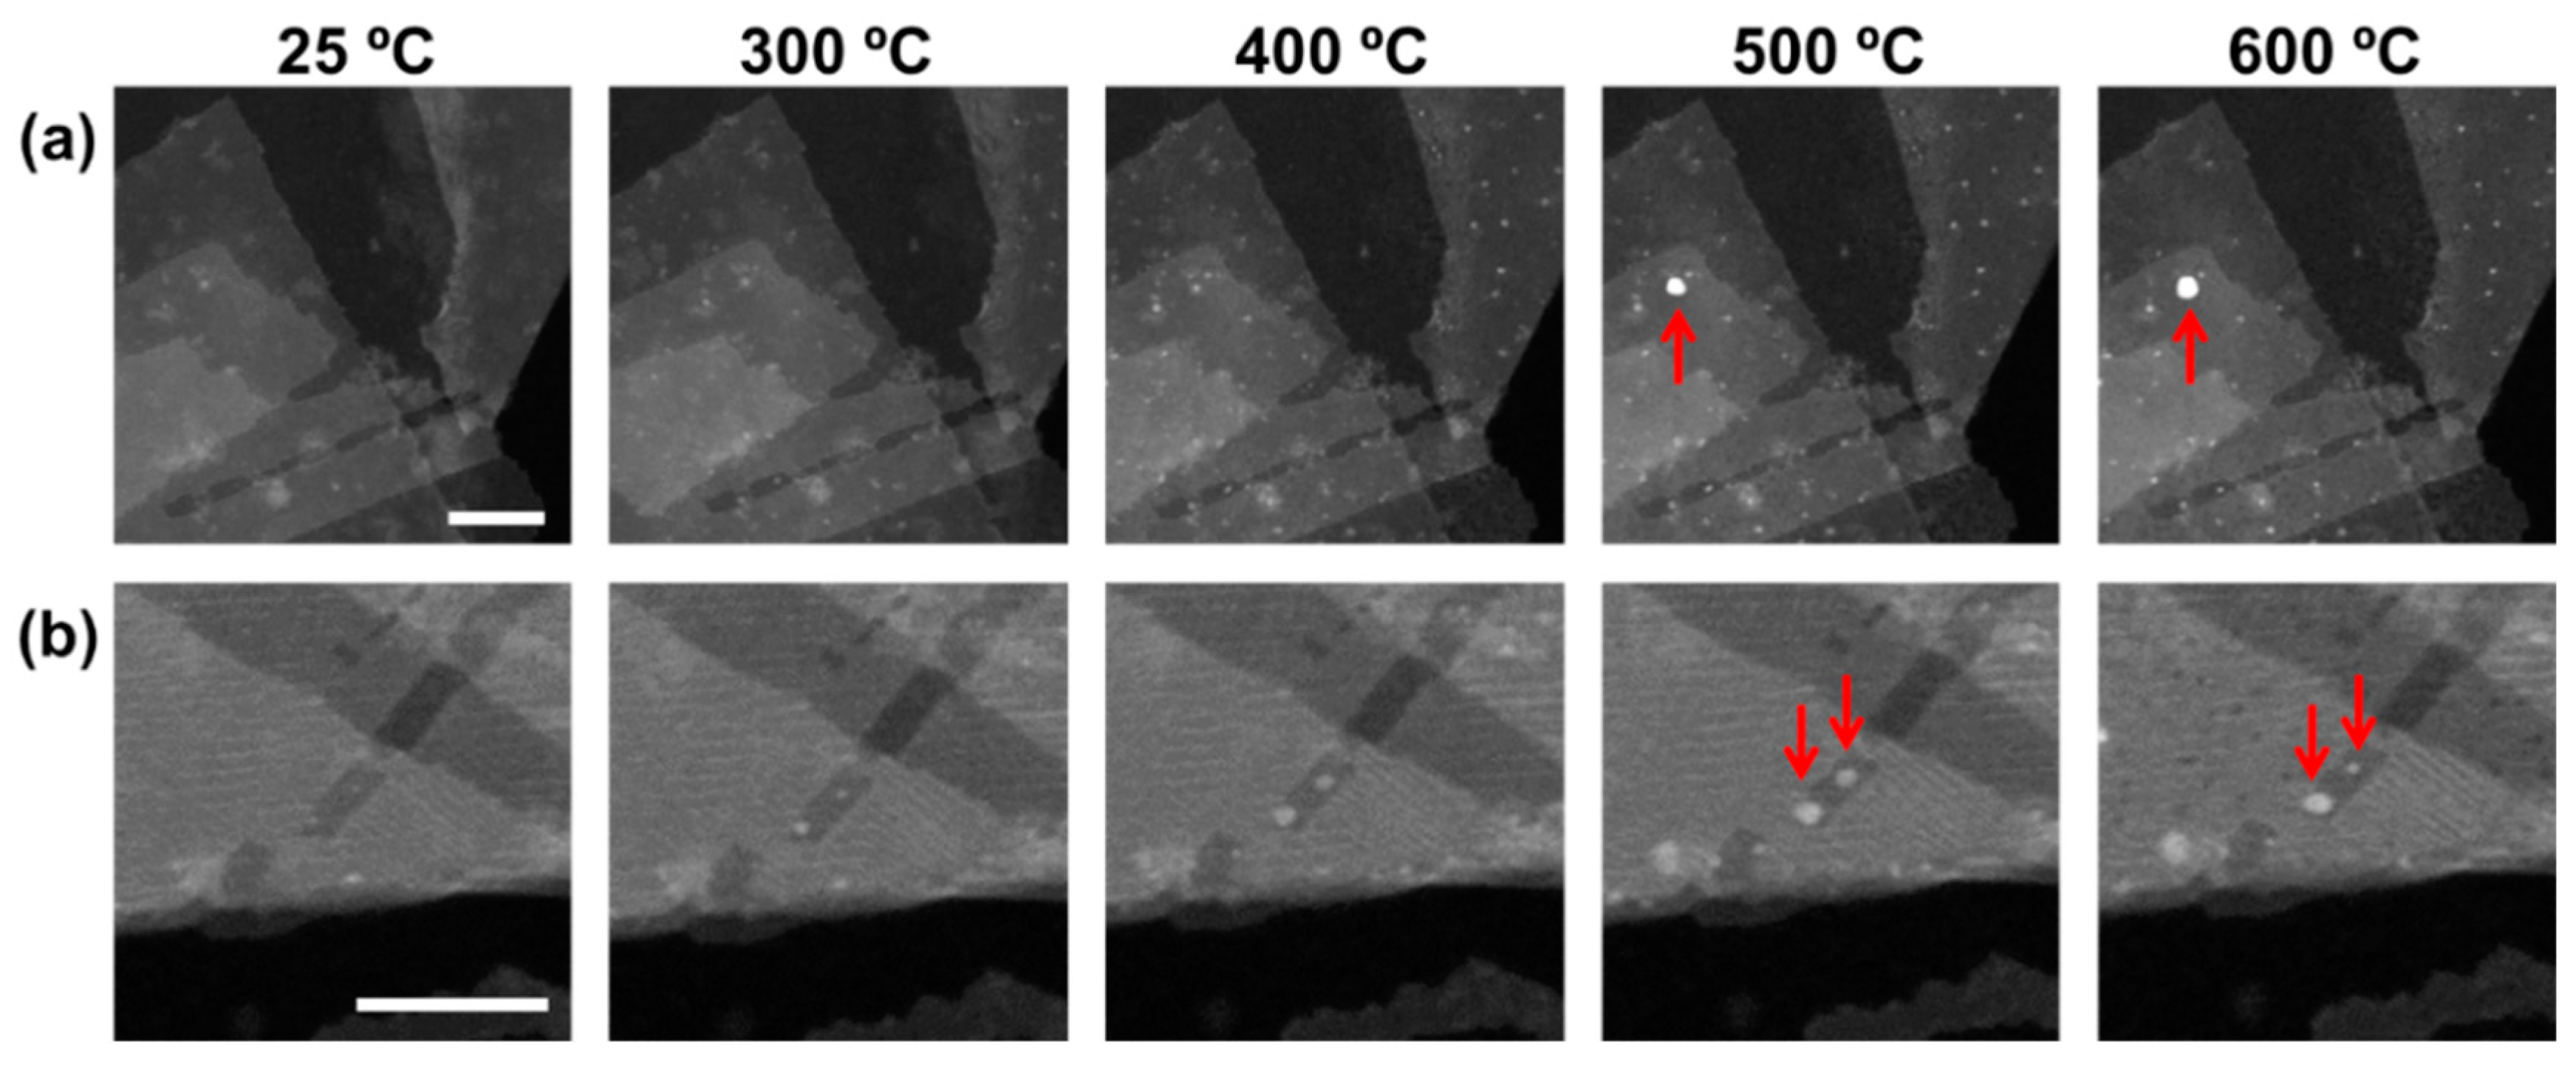
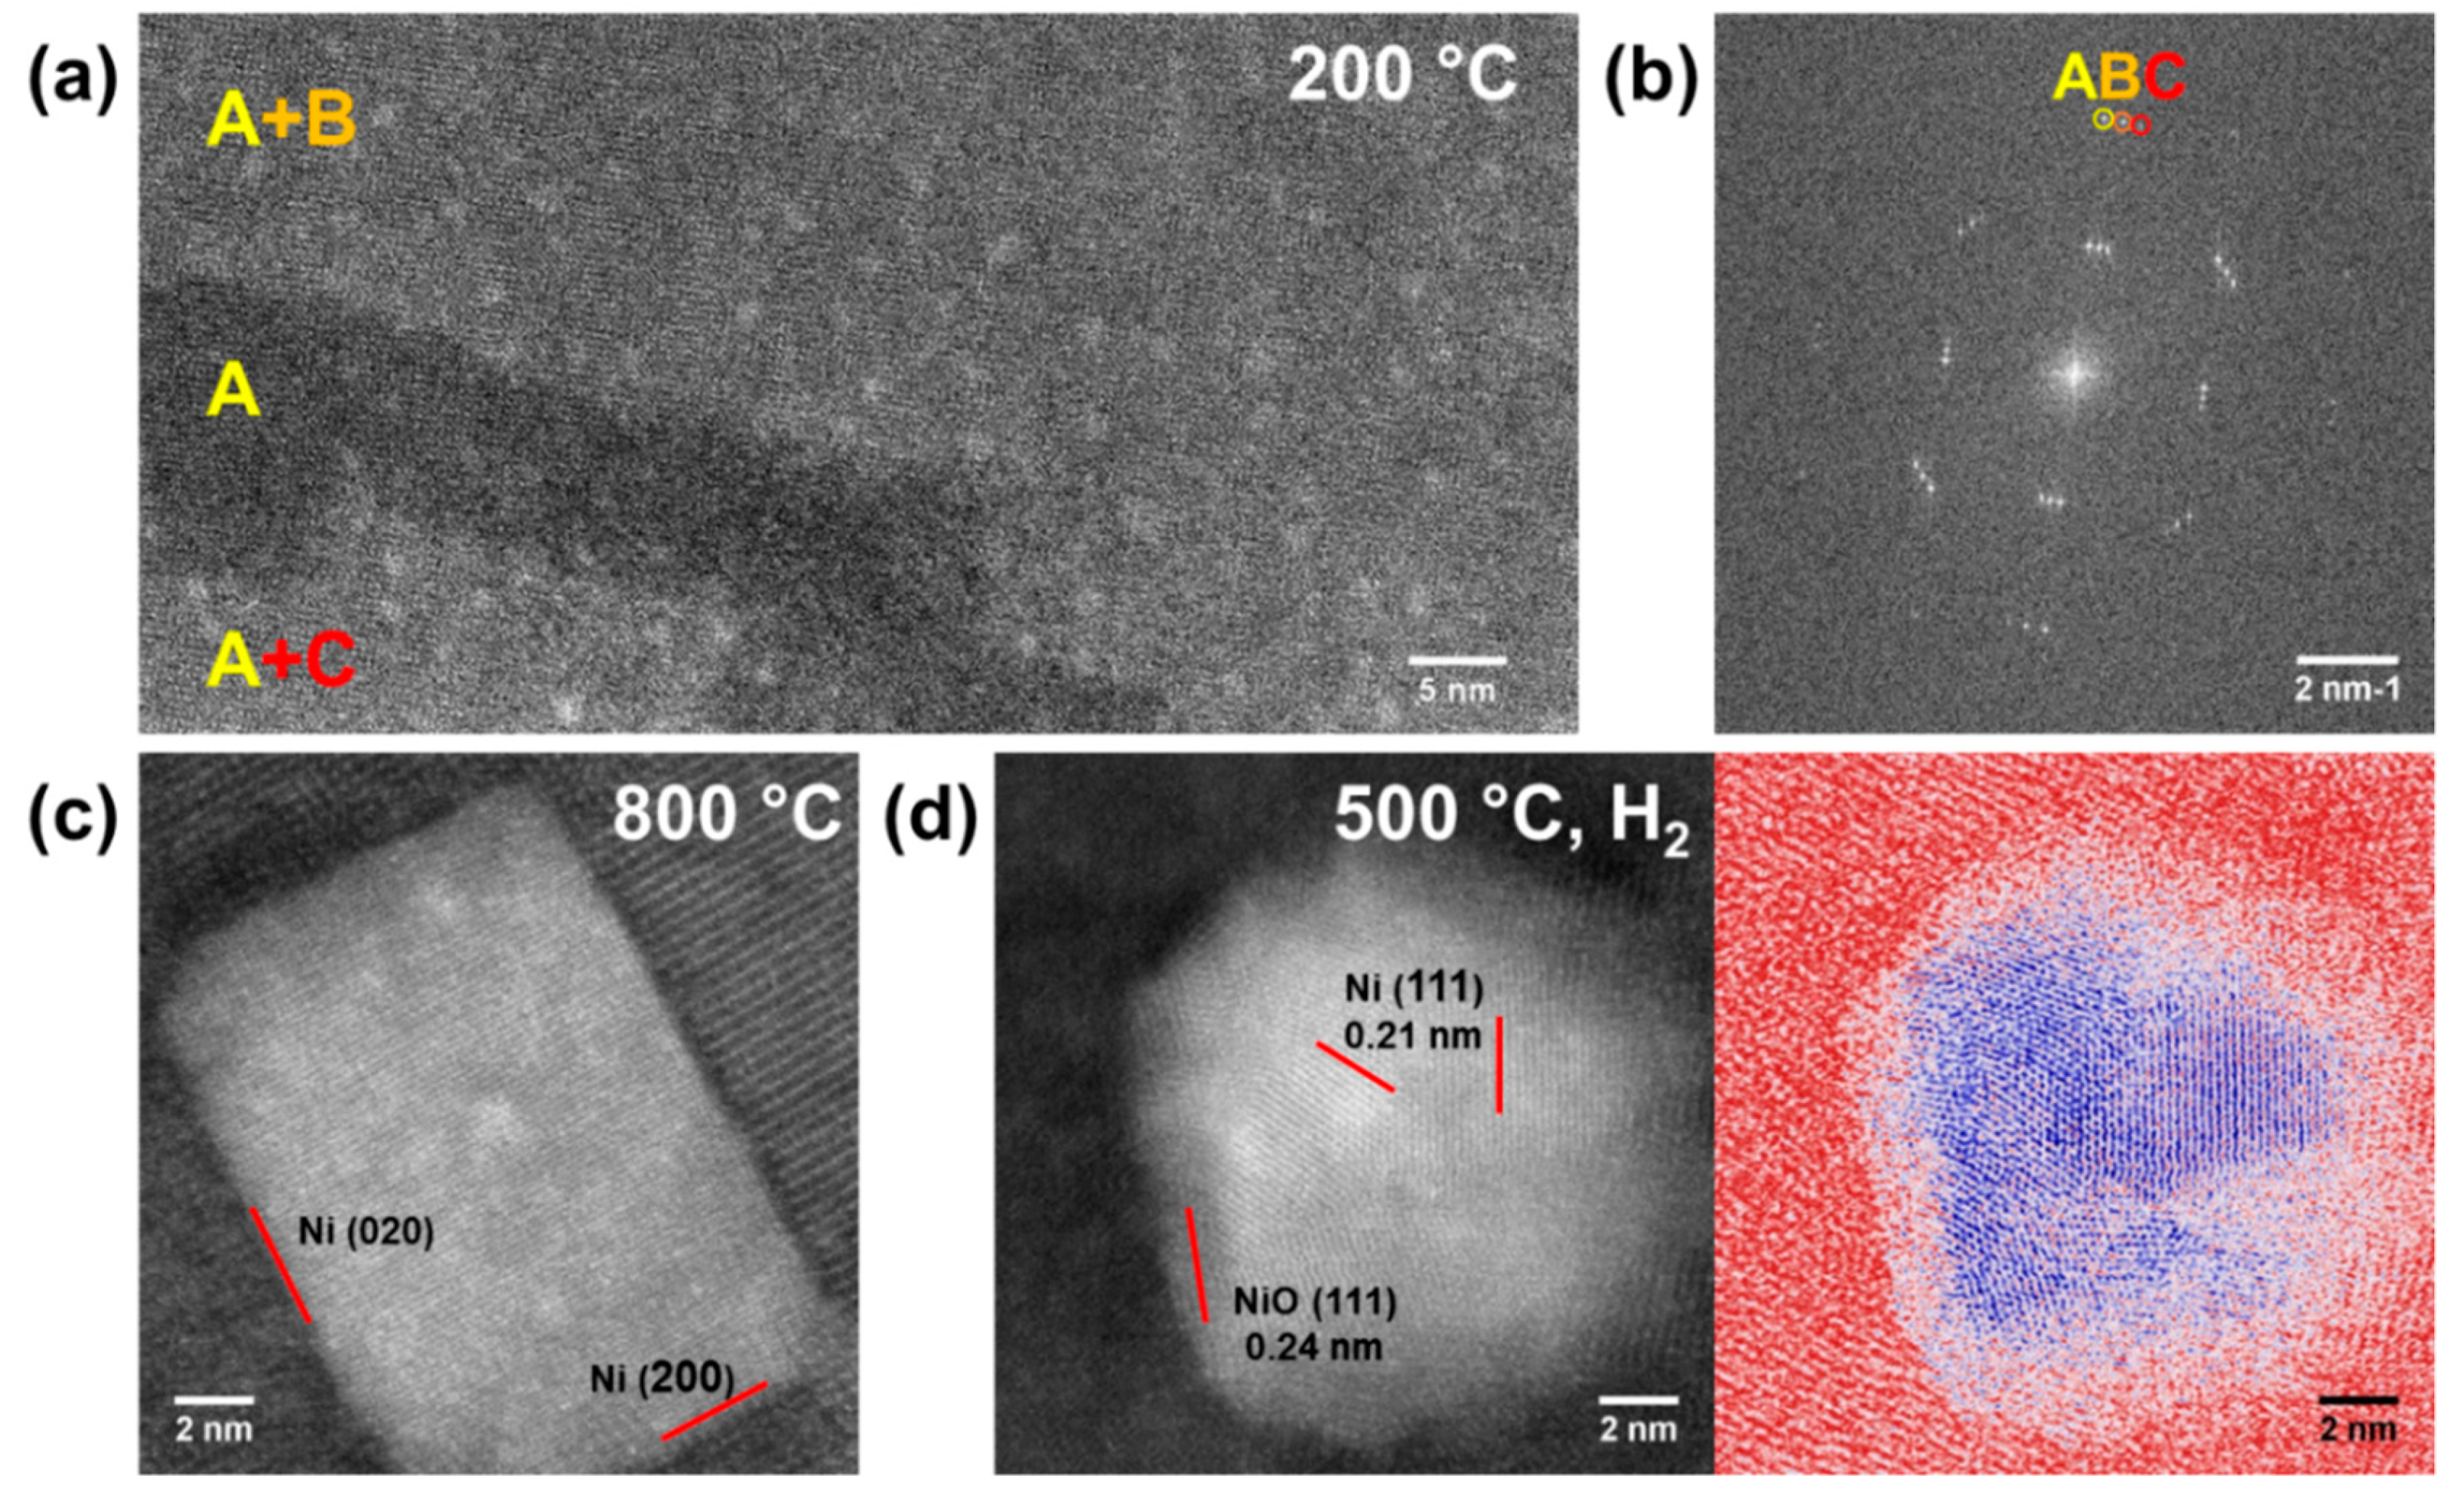
2.3. Structural Evolution of the Nanocomposite during in Situ Heating

Structural evolution of the nanocomposite during heat treatment was also observed in situ by STEM under vacuum. As shown in Figure 3, nanoparticles appear and grow as the holding temperature increases from 300 to 600 °C. The temperature was held for one hour for each step and the ramp in between the steps took <1 min. As the nanoparticles grow from submonolayer Ni(OH)2 that uniformly covers the nanosheets, they are evenly dispersed on the nanosheets. At ~500 °C, the growth gradually ceases as the local Ni(II) source is exhausted, whereas big nanoparticles (e.g., the one pointed out by the arrow in Figure 3a) appear as they grow by the Ostwald ripening mechanism.
Ostwald ripening describes the process that a nanoparticle above a critical radius grows at the expense of smaller nanoparticles through diffusion processes between them. This can be exemplified by the micrograph series in Figure 3b. Between 300 and 500 °C, the two nanoparticles grew simultaneously. Between 500 and 600 °C, it is apparent that the upper nanoparticle shrank as the lower one continued to grow, likely by the atoms from the upper nanoparticle, i.e., by Ostwald ripening. The nanoparticle growth from local Ni(II) source is facilitated by short-range diffusion of a few tens of nanometers. Ostwald ripening, on the other hand, may involve longer diffusion pathways either through the nanosheet surface or the gas phase, and hence higher temperatures (500 °C and above) to activate.
Nucleation and structural evolution of Ni nanoparticles have been further studied at atomic resolution. At 200 °C, nuclei of ~1 nm were formed on the [Ca2Nb3O10] nanosheets (Figure 4a) during in situ heating in vacuum, in agreement with the decomposition temperature of Ni(OH)2 [10,21,22]. The nuclei were found on single and multiple layers of nanosheets, as individual layers were identified by the fast Fourier transform patterns in Figure 4b. As the nanoparticles grew at higher temperatures, they became polycrystalline before some of them recrystallized at 800 °C. As shown in Figure 4c, the recrystallized particle has a rectangular shape with {200} planes as surface termination, and an orientation relationship with the underlying nanosheets Ni (200)[001] // [Ca2Nb3O10] (200)[001]. For the nanocomposites heated ex situ in H2 at 500 °C, various Ni (111) planes were resolved in the polycrystalline core (Figure 4d). Moreover, NiO (111) planes were resolved on the surface, suggesting the existence of a NiO shell around the Ni core.

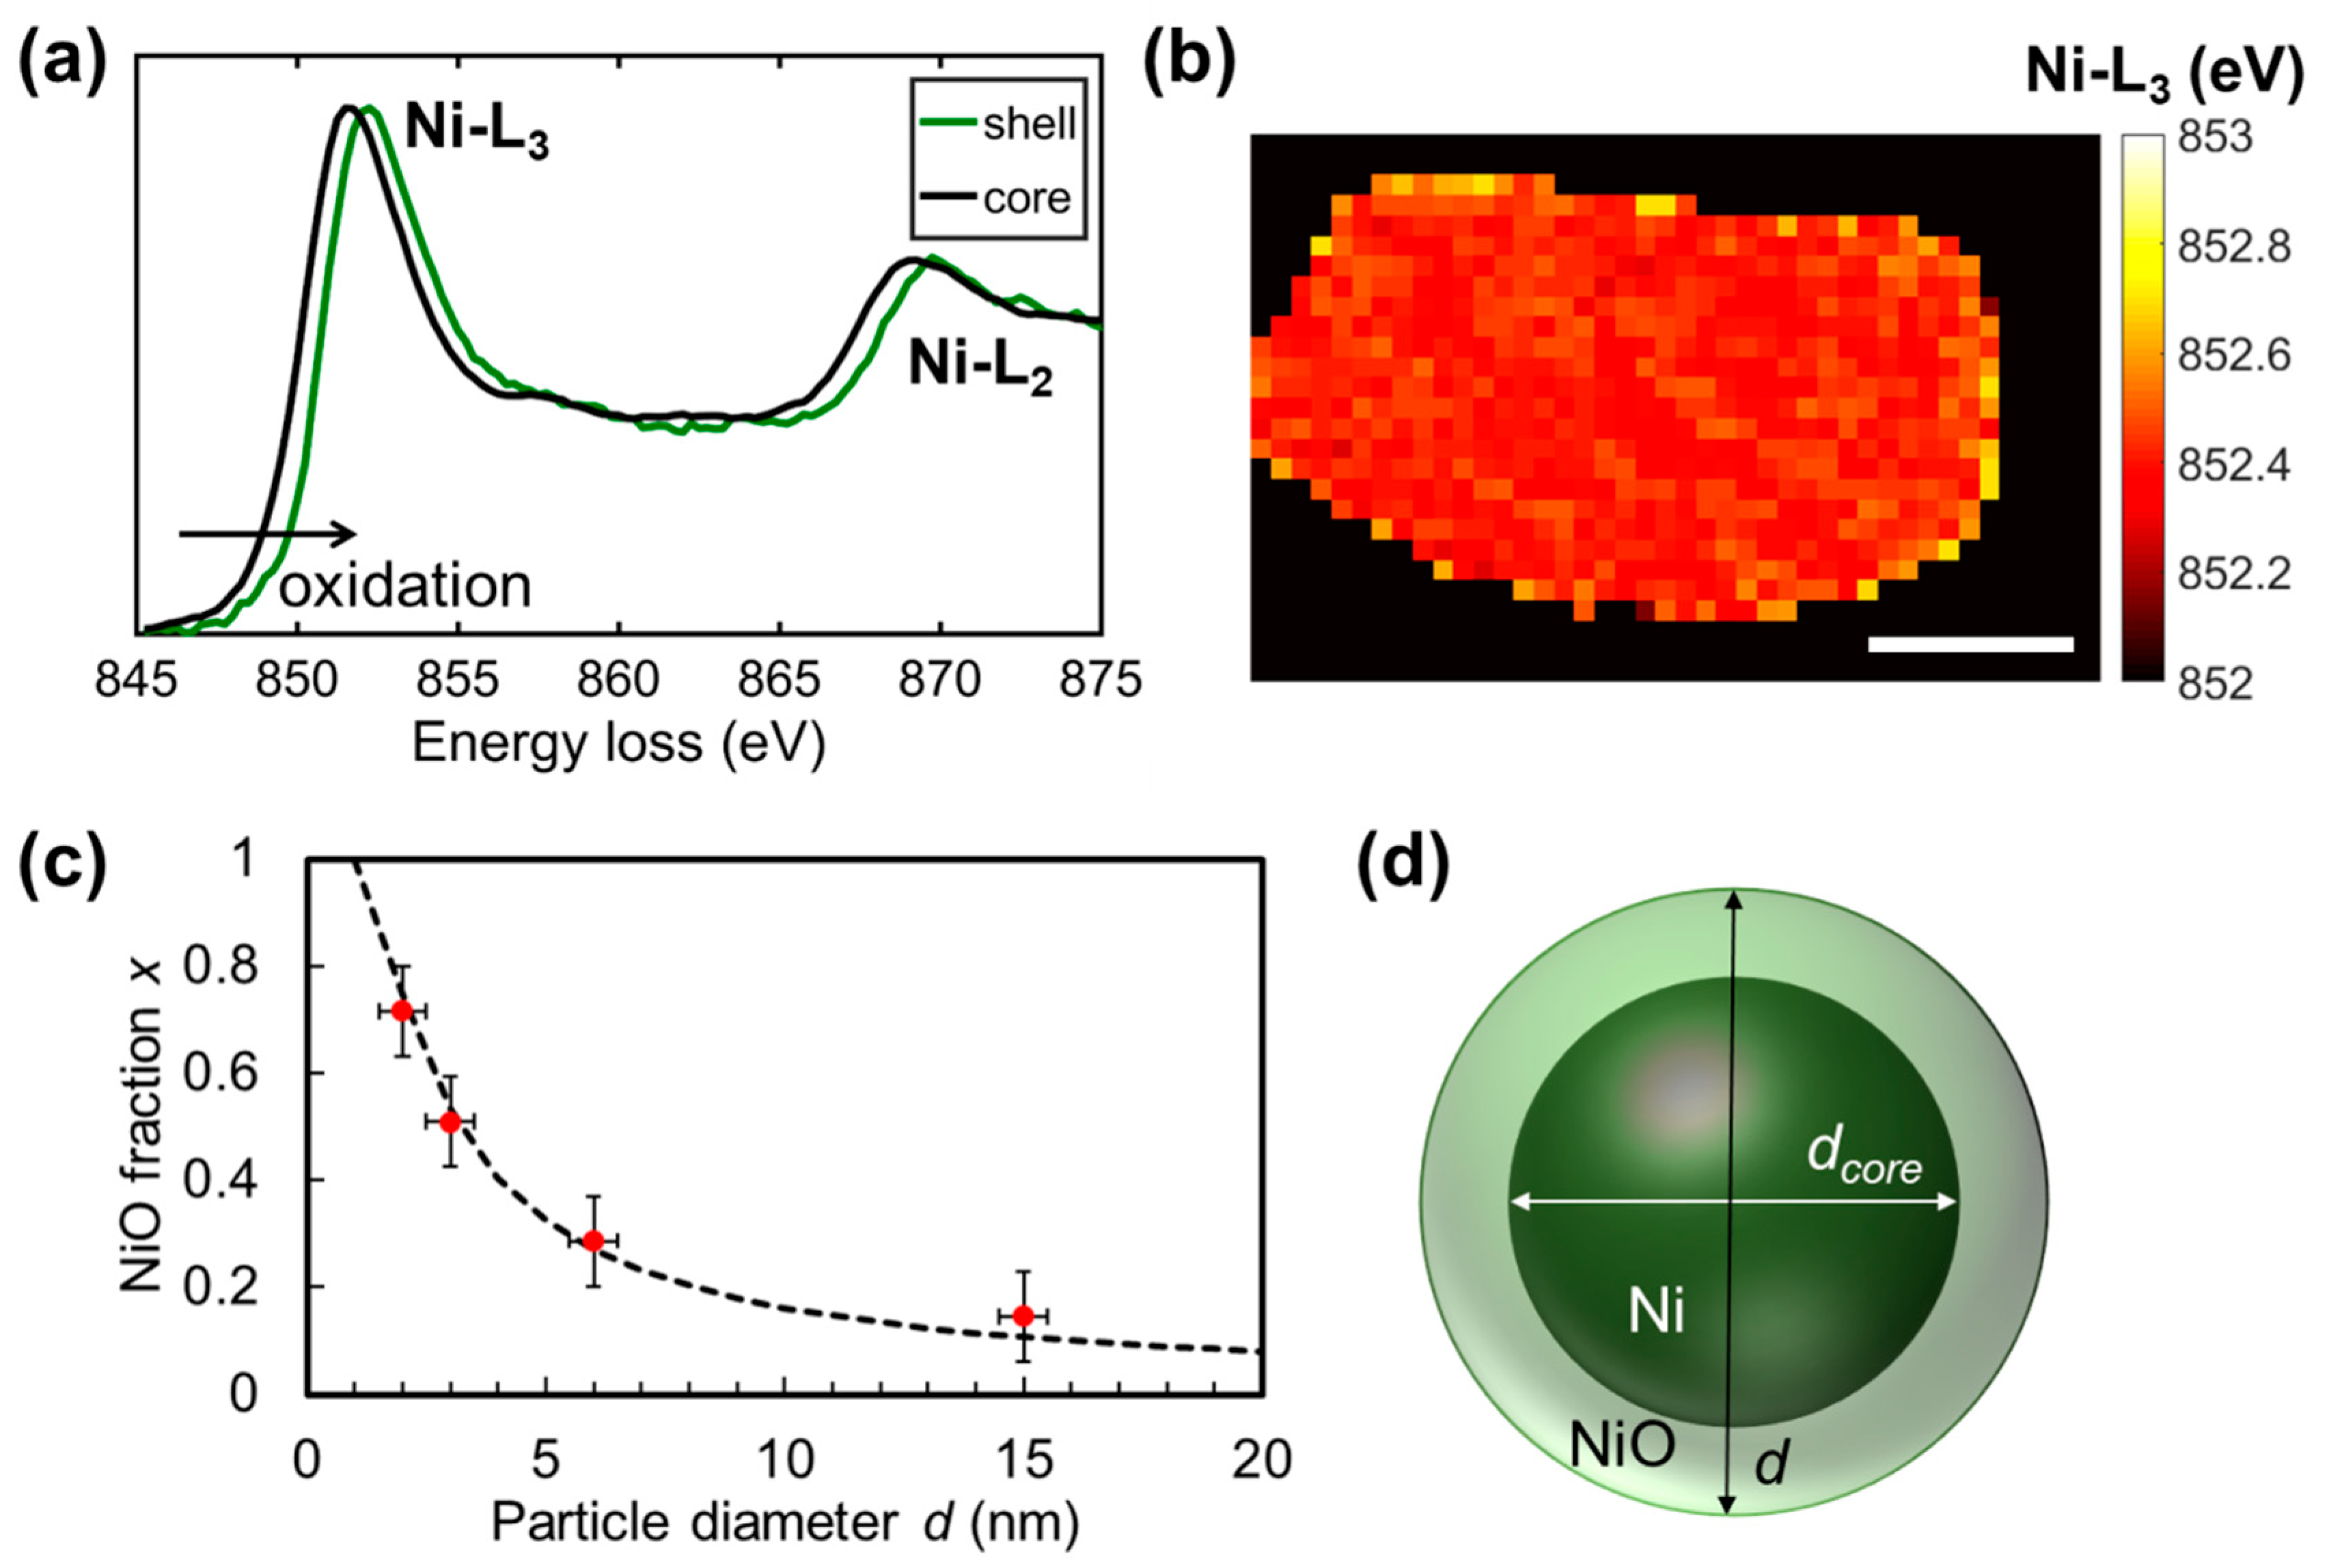
2.4. Average Oxidation States of Ni Core/NiO Shell Nanoparticles

Except during recrystallization at higher temperatures (Figure 4c), the nanoparticles rarely have an orientation relationship with the underlying nanosheets, making phase determination by high resolution imaging only applicable to favorable cases and hence prone to sampling bias. Electron energy loss spectroscopy (EELS) is an alternative method to study the composition, which has been applied to map the Ni and O distribution of nanoparticles on a carbon nanotube support [8]. As the support in our nanocomposite, [Ca2Nb3O10] nanosheets, are already rich in O, we make use of the fine structures of the Ni-L edges to determine the oxidation states of Ni. As shown in Figure 5a, compared to the spectra from the Ni core, Ni-L3 and Ni-L2 edges from the NiO shell are shifted towards higher energy losses. Such a chemical shift is related to a higher energy difference between the Ni 2p states and the Fermi energy, or a higher oxidation state of Ni. Spatial mapping of the chemical shift was facilitated by component-based EELS quantification [39], and the result in Figure 5b correlates well with the Ni core/NiO shell structure such as in Figure 4d.
To analyze the Ni oxidation state of the nanoparticles before they grew by Ostwald ripening, EELS spectra were also taken on nanoparticles with different sizes formed during in situ heating experiments. As mapping the Ni oxidation state of smaller nanoparticles is prone to noise, average oxidation states of whole particles were evaluated by the sum of EELS spectra. As evident in Figure 5c, there is a monotonous trend that an increase in the nanoparticle diameter d relates to smaller x (NiO fraction), and a lesser overall oxidized state of the nanoparticles, +2x. The result is in agreement with a growing Ni core within the nanoparticle. Given a diameter of the nanoparticle d, and that of the Ni core dcore, the NiO fraction x can be expressed as:
x =   n ( N i O ) n ( N i O ) + n ( N i ) = ( d 3 d c o r e 3 ) a 3 ( N i ) ( d 3 d c o r e 3 ) a 3 ( N i ) + d c o r e 3 a 3 ( N i O )
where n refers to the number of Ni atoms in NiO and Ni, a(Ni) = 0.350 nm and a(NiO) = 0.417 nm are their lattice parameters. The dashed line in Figure 5c represents a fit with a constant shell thickness ddcore = 0.9 nm, roughly one unit cell of NiO on each side of the Ni core. As nanoparticles with diameters from 2 nm to over 10 nm have similarly thin NiO shells, they were likely formed as a native oxide layer.

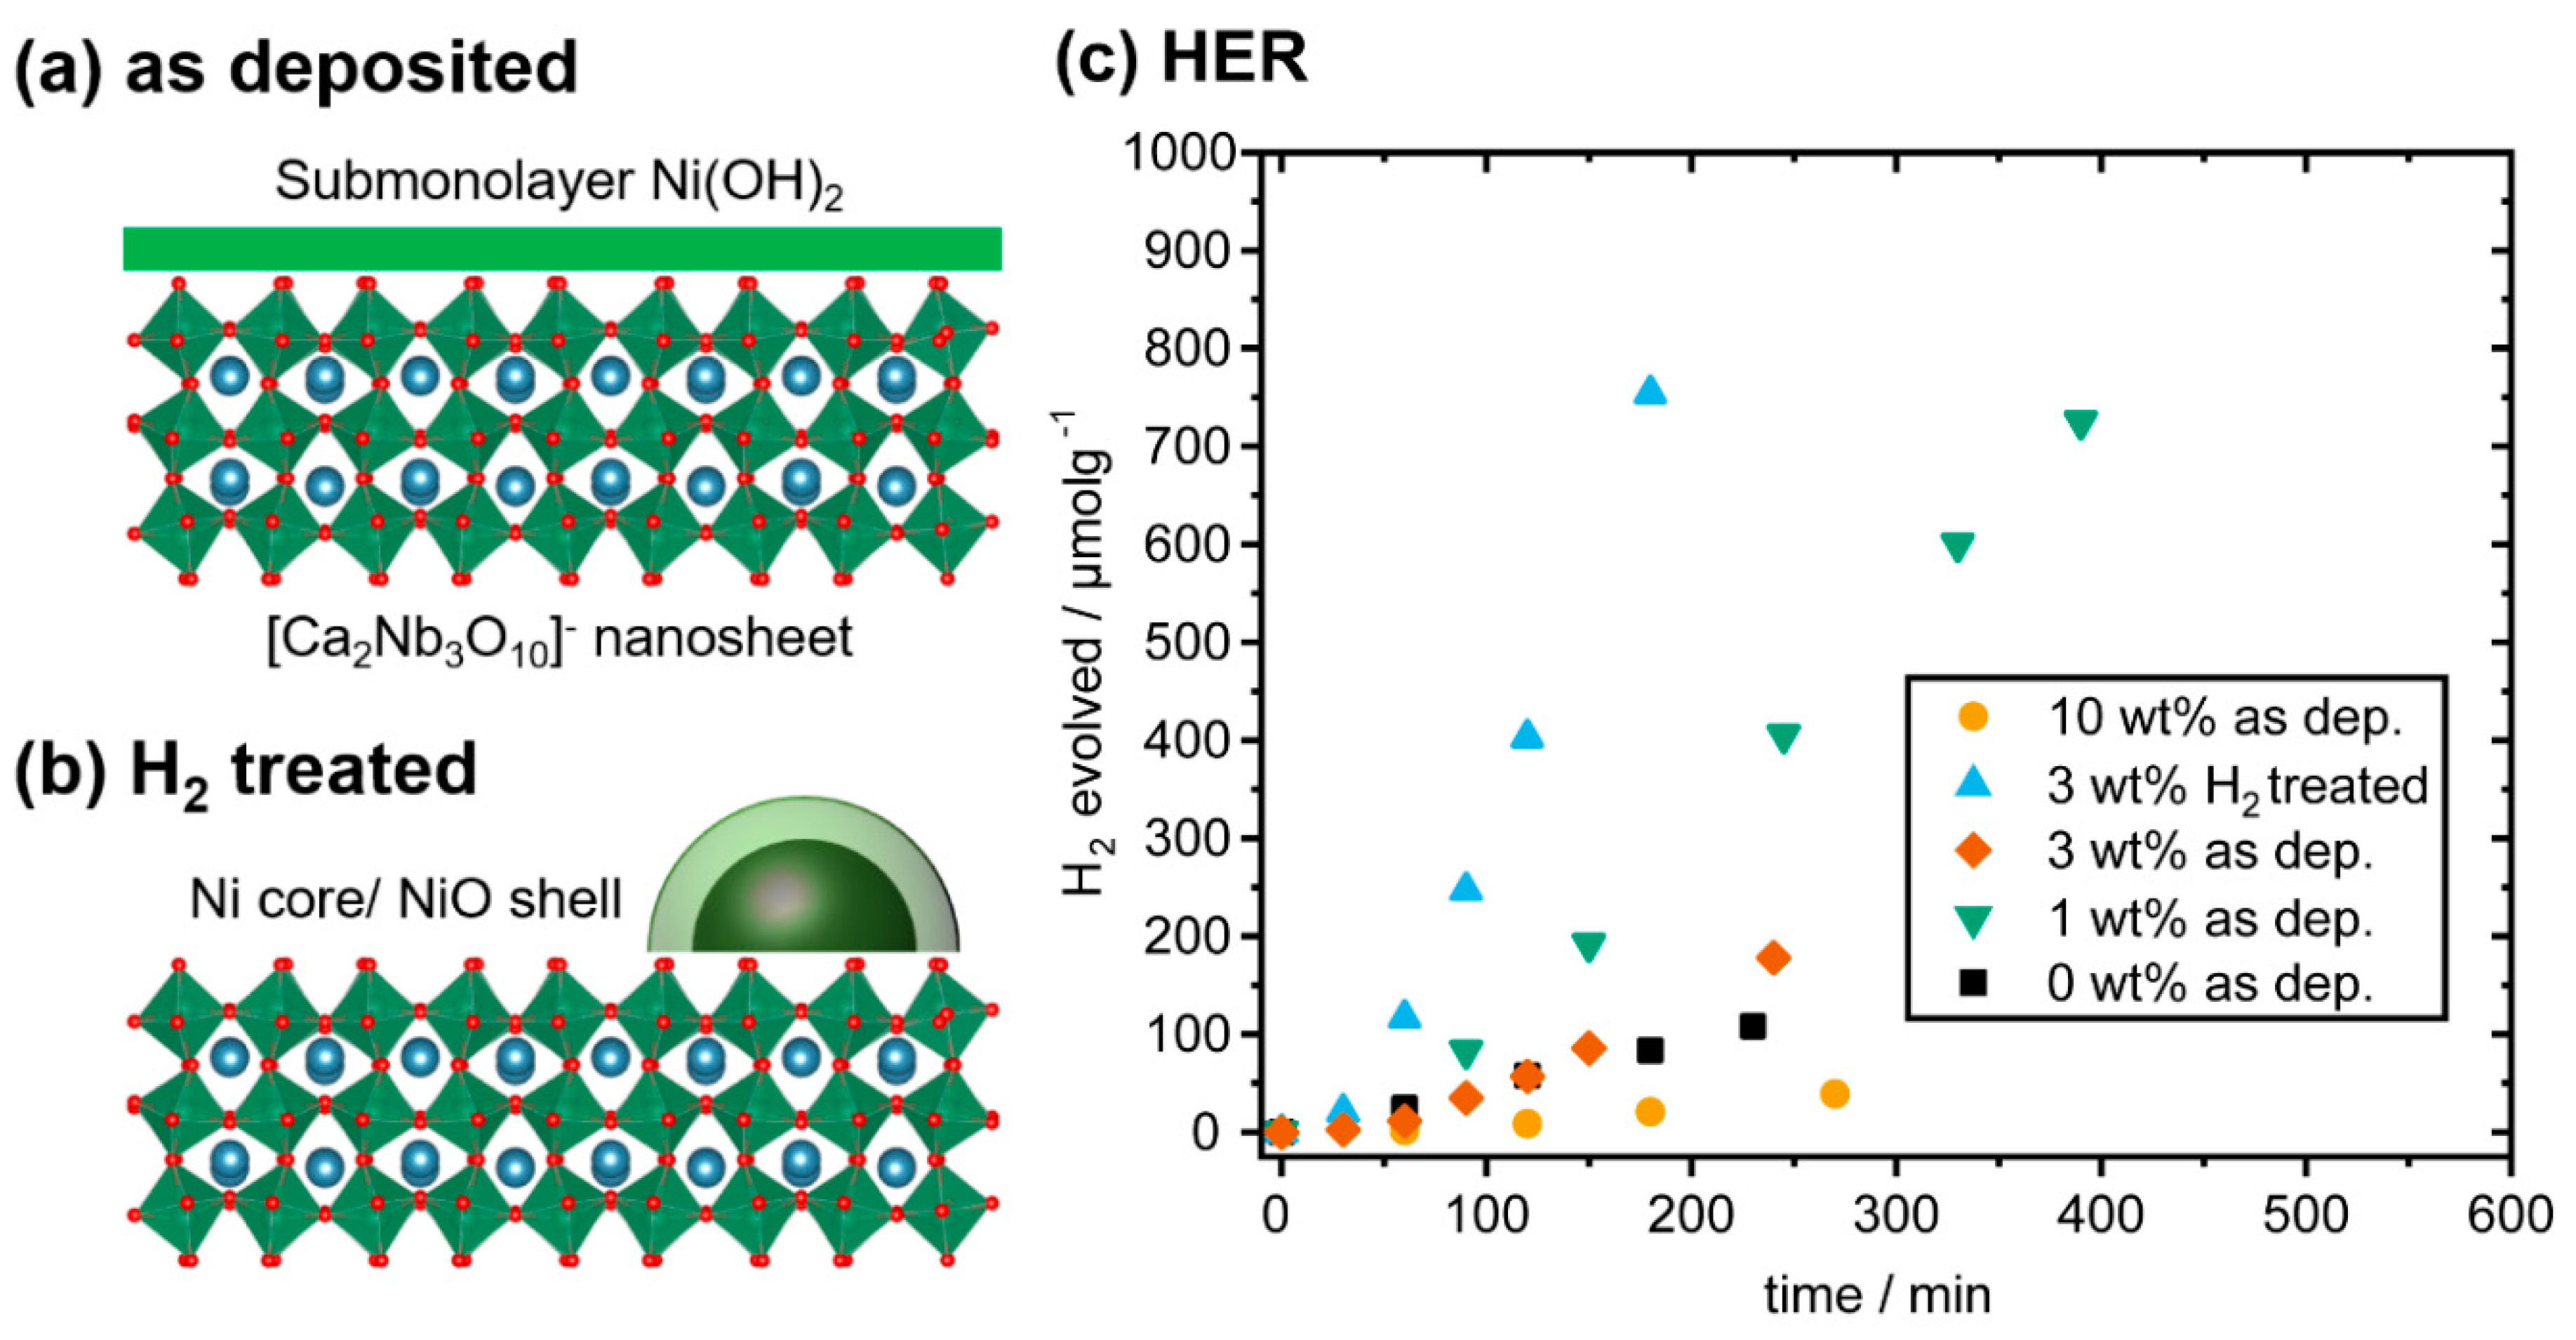
2.5. Photocatalytic Activity of the Nanocomposites

Two types of morphology of the nanocomposites are summarized in Figure 6a,b. The as-deposited Ni(OH)2 has a submonolayer coverage on [Ca2Nb3O10] nanosheets, which only reaches a monolayer with ≥18 wt% Ni loading. Heat treatment under H2 flow at 500 °C decomposes Ni(OH)2 into Ni core/NiO shell nanoparticles. Nanocomposites with both types of morphology have been tested under full arc illumination of a Xe lamp from a 10 vol% solution of methanol in water. As shown in Figure 6c, [Ca2Nb3O10] nanosheets without co-catalysts are already active for HER. A four-fold increase in the HER rate was obtained for the as deposited nanocomposite with 1 wt% Ni loading. Higher Ni loading is clearly detrimental, as the nanocomposite with 3 wt% Ni loading barely matches the HER rate without co-catalysts. Ni loading of 10 wt% results in even lower HER rates and such high loading is considered excessive.
As proposed by Ran et al., [4], “excessive loading of co-catalysts causes (1) covering active sites on the photocatalyst, (2) shielding the light absorption by the photocatalyst, (3) decreasing the surface area and activity of co-catalysts, or (4) increasing the charge recombination in co-catalysts.” Effect (1) may apply to the first morphology (Figure 6a) as the Ni(OH)2 layer covers the active sites for the oxidation half-reaction on the [Ca2Nb3O10] nanosheets. Effect (2) may apply to the second morphology (Figure 6b) as the Ni core/NiO shell nanoparticles make the suspension appear dark (Figure 1d). Both types of morphology remain nanometer-sized and would not contribute much to Effects (3) or (4).
Another effect has been proposed by Nakibli et al., [40]: (5) Fewer numbers of co-catalyst particles on a photocatalyst lead to higher efficiency of multielectron processes, including the two-electron process HER. Efficient HER requires a single co-catalyst particle to host the two required electrons and resulting intermediates such as H* simultaneously at close proximity. It was demonstrated that nanocomposites with one Pt nanoparticle on CdSe/CdS nanorod photocatalysts had higher HER efficiency than those with two and more Pt nanoparticles [40,41].
As shown in Figure 6c, nanocomposites of the second morphology (3 wt% H2 treated) can reach two times the HER rates of the best nanocomposite of the first morphology (1 wt% as deposited). The Ni core/NiO shell nanostructures are known to be good HER catalysts [8]. Moreover, the nanoparticles cover much less surface of [Ca2Nb3O10] nanosheets than submonolayer Ni(OH)2, and can hence avoid blocking many active sites as mentioned in Effect (1). Furthermore, the nanoparticles are well separated due to Ostwald ripening, which reduces the number of co-catalyst particles for HER and hence contributes to speeding up the reaction as mentioned in Effect (5).

3. Materials and Methods

3.1. Synthesis of [Ca2Nb3O10] Nanosheets

We adapted a published protocol for the synthesis of [Ca2Nb3O10] nanosheets [35]. Nb2O5 (99.5%, Thermo Fischer Scientific, Waltham, MA, USA), CaCO3 (99+%, Merck, Darmstadt, Germany) and K2CO3 (>98%, Bernd Kraft GmbH, Duisburg, Germany) were ground together in the targeted stoichiometry and then reacted at 1200 °C for 60 h to form KCa2Nb3O10. KCa2Nb3O10 particles were then immersed in 6 M HCl for over three days to obtain the ion-exchanged product HCa2Nb3O10. HCa2Nb3O10 was then washed by H2O and subsequently shaken in 1:1 TBAOH·30 H2O solution (Merck, Darmstadt, Germany) for seven days to exfoliate into [Ca2Nb3O10] nanosheets. The nanosheets were centrifuged at 3000 rpm for 10 min, and the supernatant after this cleaning step had ~4 mg/10 mL of [Ca2Nb3O10] nanosheets.

3.2. Loading of Ni Co-Catalysts

[Ca2Nb3O10] nanosheets suspension of 10 mL was diluted in 35 mL H2O. Then 5 mL of ethanol was added to the suspension as sacrificial agent, together with the required amount of ethanolic NiCl2 solution. Ni loading of 1 wt% with respect to [Ca2Nb3O10] nanosheets corresponds to a molar ratio of 5% between Ni and Ca. The suspension was stirred and irradiated by a Syngene UV Transilluminator (Bangalore, India) at 312 nm wavelength for 30 min. To obtain powders for characterization or further heat treatment, the suspension was sedimented at rpm for 20 min, redispersed in H2O to wash away unreacted precursors, and then dried at 60 °C.
The powders were introduced into a tube furnace preheated at 500 °C under continuous flow of air, argon, or 5 vol% H2 in argon (named H2 treatment in Section 2), and heat treated for 10 min. For the heat treatment under vacuum, the powders were heated in an ampoule under continuous evacuation to keep the pressure below 0.05 mbar.

3.3. Structural Characterization

The X-ray powder diffractograms were obtained on a Huber G670 diffractometer (Rimsting, Germany) with Cu-Kα1 radiation and Ge-111 monochromator. Fourier transform infrared (FTIR) spectroscopy was conducted using dried powders on a Perkin Elmer Spectrum BXII/1000 with Smiths ATR (Waltham, MA, USA).
The nanocomposite suspension was drop cast onto either grids with lacey carbon support or heating chips from DENS solutions (Delft, Netherlands). Electron micrographs were taken on a JEOL 2200F microscope (Tokyo, Japan) operated at 200 kV or a FEI Titan Themis microscope (Thermo Fischer Scientific, Waltham, MA, USA) operated at 300 kV. Energy dispersive X-ray spectroscopy (EDS) spectrum imaging was acquired using a SuperX detector (Thermo Fischer Scientific, Waltham, MA, USA). Electron energy loss spectroscopy (EELS) spectrum imaging was acquired using a Gatan Quantum ERS spectrometer (Pleasanton, CA, USA) with 35 mrad collection semiangle. Multivariate statistical analysis of the spectrum imaging data [39] was performed to reduce the noise and quantify the chemical shift of Ni-L3.

3.4. Photocatalytic Measurements

For photocatalytic measurements 3 mg of the nanocomposites were dispersed in 20 mL of 10 vol% methanolic solution and degassed by applying vacuum down to 0.01 mbar and refilling with argon for at least six cycles. No additional co-catalysts or sacrificial agents were added. The home-built reactor was illuminated from the top by a full-arc 300 W Xe lamp at 150 mW/cm2. The evolved H2 was measured by an online GC gas chromatograph (Thermo Fischer Scientific, Waltham, MA, USA) using argon as the carrier gas.

4. Conclusions

We successfully introduced Ni species as co-catalysts on photocatalytically active [Ca2Nb3O10] nanosheets. The as deposited Ni(OH)2 layer homogeneously covers the nanosheets, and functions as HER co-catalyst with an optimal loading of 1 wt%. Above 3 wt%, the Ni(OH)2 layer is detrimental to the HER rates. However, our results demonstrate that decomposition of the Ni(OH)2 layer by heating provides another way to improve the HER activity. After heating the nanocomposites at 500 °C for 10 min in air, there is hardly any change in morphology. After heat treatment in non-oxidative environments (H2, argon, vacuum), Ni(OH)2 was decomposed and formed Ni cores, a process likely driven by reducing agents H2 or TBA+. A NiO shell thickness of 0.9 nm fits well to the overall oxidation state of the Ni core/NiO shell nanoparticles regardless of their size. The in situ heating experiments revealed nucleation of Ni nanoparticles from 200 °C. At 500 °C and above, Ostwald ripening is observed, which results in an increase of the overall spacing between the nanoparticles as the small ones dissolve. From ~800 °C, recrystallization of Ni nanoparticles was observed, which have a preferred orientation relationship with the nanosheets Ni (200)[001] // [Ca2Nb3O10] (200)[001]. The best HER rate was demonstrated in a nanocomposite with Ni core/NiO shell nanoparticles, heated at 500 °C in H2 atmosphere. Ostwald ripening during the heat treatment reduces the number of Ni-based co-catalyst nanoparticles, and may contribute to the improved HER activity by an effect observed for Pt co-catalysts [40,41]. This strategy can be applied to optimize Ni-based co-catalysts in many other photocatalytic nanocomposite systems.

Author Contributions

S.Z. and L.D. contributed equally to this work, as they conceptualized the study and wrote the manuscript. L.D. and S.W. synthesized the samples, conducted the XRPD and FTIR characterization. S.Z. performed the STEM, EDS, and EELS characterization, including the in situ heating experiments. L.D. conducted the photocatalytic measurements. All authors including B.V.L. and C.S. have critically commented on the interpretation of data and proofread the manuscript. All authors have read and agreed to the published version of the manuscript.

Funding

S.Z. and C.S. acknowledge funding from German Research Foundation DFG under the SPP 1613 programme (DFG SCHE 634/12-2). B.V.L. acknowledges financial support by the German Research Foundation DFG under Germany’s Excellence Strategy–EXC 2089/1-390776260 and the Center for Nanoscience.

Acknowledgments

We thank Christian Ziegler for his discussion during the experimental design. Open Access Funding by Max Planck Society and Uppsala University.

Conflicts of Interest

The authors declare no conflict of interest. The funders had no role in the design of the study; in the collection, analyses, or interpretation of data; in the writing of the manuscript, or in the decision to publish the results.

References

  1. Osterloh, F.E. Inorganic materials as catalysts for photochemical splitting of water. Chem. Mater. 2008, 20, 35–54. [Google Scholar] [CrossRef]
  2. Kudo, A.; Miseki, Y. Heterogeneous photocatalyst materials for water splitting. Chem. Soc. Rev. 2009, 38, 253–278. [Google Scholar] [CrossRef] [PubMed]
  3. Osterloh, F.E. Inorganic nanostructures for photoelectrochemical and photocatalytic water splitting. Chem. Soc. Rev. 2013, 42, 2294–2320. [Google Scholar] [CrossRef] [PubMed]
  4. Ran, J.; Zhang, J.; Yu, J.; Jaroniec, M.; Qiao, S.Z. Earth-abundant cocatalysts for semiconductor-based photocatalytic water splitting. Chem. Soc. Rev. 2014, 43, 7787–7812. [Google Scholar] [CrossRef] [PubMed]
  5. Osterloh, F.E. Nanoscale Effects in Water Splitting Photocatalysis. In Solar Energy for Fuels; Tüysüz, H., Chan, C.K., Eds.; Springer International Publishing: Cham, Switzerland, 2015; Volume 371, pp. 105–142. [Google Scholar] [CrossRef] [Green Version]
  6. McCrory, C.C.L.; Jung, S.; Ferrer, I.M.; Chatman, S.M.; Peters, J.C.; Jaramillo, T.F. Benchmarking hydrogen evolving reaction and oxygen evolving reaction electrocatalysts for solar water splitting devices. J. Am. Chem. Soc. 2015, 137, 4347–4357. [Google Scholar] [CrossRef] [PubMed] [Green Version]
  7. Gong, M.; Dai, H. A mini review of NiFe-based materials as highly active oxygen evolution reaction electrocatalysts. Nano Res. 2015, 8, 23–39. [Google Scholar] [CrossRef] [Green Version]
  8. Gong, M.; Zhou, W.; Tsai, M.-C.; Zhou, J.; Guan, M.; Lin, M.-C.; Zhang, B.; Hu, Y.; Wang, D.-Y.; Yang, J.; et al. Nanoscale nickel oxide/nickel heterostructures for active hydrogen evolution electrocatalysis. Nat. Commun. 2014, 5, 4695. [Google Scholar] [CrossRef]
  9. Hall, D.S.; Lockwood, D.J.; Bock, C.; MacDougall, B.R. Nickel hydroxides and related materials: A review of their structures, synthesis and properties. Proc. R. Soc. A 2014, 471, 0792. [Google Scholar] [CrossRef]
  10. Cronan, C.L.; Micale, F.J.; Topic, M.; Leidheiser, H.; Zettlemoyer, A.C.; Popovic, S. Surface properties of Ni(OH)2 and NiO II. Mechanism for the thermal decomposition of Ni(OH)2 and other metal hydroxides. J. Colloid Interface Sci. 1976, 55, 546–557. [Google Scholar] [CrossRef]
  11. Liang, Z.-H.; Zhu, Y.-J.; Hu, X.-L. β-nickel hydroxide nanosheets and their thermal decomposition to nickel oxide nanosheets. J. Phys. Chem. B 2004, 108, 3488–3491. [Google Scholar] [CrossRef]
  12. Kuang, Y.; Feng, G.; Li, P.; Bi, Y.; Li, Y.; Sun, X. Single-crystalline ultrathin nickel nanosheets array from in situ topotactic reduction for active and stable electrocatalysis. Angew. Chem. Int. Ed. 2016, 55, 693–697. [Google Scholar] [CrossRef] [PubMed] [Green Version]
  13. Strayer, M.E.; Senftle, T.P.; Winterstein, J.P.; Vargas-Barbosa, N.M.; Sharma, R.; Rioux, R.M.; Janik, M.J.; Mallouk, T.E. Charge transfer stabilization of late transition metal oxide nanoparticles on a layered niobate support. J. Am. Chem. Soc. 2015, 137, 16216–16224. [Google Scholar] [CrossRef] [PubMed] [Green Version]
  14. Zhukovskyi, M.; Tongying, P.; Yashan, H.; Wang, Y.; Kuno, M. Efficient photocatalytic hydrogen generation from Ni nanoparticle decorated CdS nanosheets. ACS Catal. 2015, 5, 6615–6623. [Google Scholar] [CrossRef]
  15. Ran, J.; Yu, J.; Jaroniec, M. Ni(OH)2 modified CdS nanorods for highly efficient visible-light-driven photocatalytic H2 generation. Green Chem. 2011, 13, 2708–2713. [Google Scholar] [CrossRef]
  16. Lo, I.-H.; Wang, J.-Y.; Huang, K.-Y.; Huang, J.-H.; Kang, W.P. Synthesis of Ni(OH)2 nanoflakes on ZnO nanowires by pulse electrodeposition for high-performance supercapacitors. J. Power Sources 2016, 308, 29–36. [Google Scholar] [CrossRef]
  17. Domen, K.; Naito, S.; Onishi, T.; Tamaru, K.; Soma, M. Study of the photocatalytic decomposition of water vapor over a NiO-SrTiO3 catalyst. J. Phys. Chem. 1982, 86, 3657–3661. [Google Scholar] [CrossRef]
  18. Domen, K.; Kudo, A.; Shinozaki, A.; Tanaka, A.; Maruya, K.; Onishi, T. Photodecomposition of water and hydrogen evolution from aqueous methanol solution over novel niobate photocatalysts. J. Chem. Soc. Chem. Commun. 1986, 4, 356–357. [Google Scholar] [CrossRef]
  19. Kudo, A.; Tanaka, A.; Domen, K.; Maruya, K.; Aika, K.; Onishi, T. Photocatalytic decomposition of water over NiO-K4Nb6O17 catalyst. J. Catal. 1988, 111, 67–76. [Google Scholar] [CrossRef]
  20. Townsend, T.K.; Browning, N.D.; Osterloh, F.E. Overall photocatalytic water splitting with NiOx–SrTiO3—A revised mechanism. Energy Environ. Sci. 2012, 5, 9543. [Google Scholar] [CrossRef]
  21. Teichner, S.J.; Morrison, J.A. The adsorption of gases on nickel oxides. Trans. Faraday Soc. 1955, 51, 961–966. [Google Scholar] [CrossRef]
  22. Carney, C.S.; Chinn, R.E.; Dogan, Ö.N.; Gao, M.C. Isothermal decomposition kinetics of nickel (II) hydroxide powder. J. Alloy Compd. 2015, 644, 968–974. [Google Scholar] [CrossRef] [Green Version]
  23. Parravano, G. The reduction of nickel oxide by hydrogen. J. Am. Chem. Soc. 1952, 74, 1194–1198. [Google Scholar] [CrossRef]
  24. Larkins, F.P.; Fensham, P.J. Decomposition of nickel oxide. Nature 1967, 215, 1268–1269. [Google Scholar] [CrossRef]
  25. Jeangros, Q.; Hansen, T.W.; Wagner, J.B.; Damsgaard, C.D.; Dunin-Borkowski, R.E.; Hébert, C.; Van herle, J.; Hessler-Wyser, A. Reduction of nickel oxide particles by hydrogen studied in an environmental TEM. J. Mater. Sci. 2013, 48, 2893–2907. [Google Scholar] [CrossRef] [Green Version]
  26. Manukyan, K.V.; Avetisyan, A.G.; Shuck, C.E.; Chatilyan, H.A.; Rouvimov, S.; Kharatyan, S.L.; Mukasyan, A.S. Nickel oxide reduction by hydrogen: Kinetics and structural transformations. J. Phys. Chem. C 2015, 119, 16131–16138. [Google Scholar] [CrossRef]
  27. Fukuoka, H.; Isami, T.; Yamanaka, S. Crystal structure of a layered perovskite niobate KCa2Nb3O10. J. Solid State Chem. 2000, 151, 40–45. [Google Scholar] [CrossRef]
  28. Schaak, R.E.; Mallouk, T.E. Self-assembly of tiled perovskite monolayer and multilayer thin films. Chem. Mater. 2000, 12, 2513–2516. [Google Scholar] [CrossRef]
  29. Ebina, Y.; Sasaki, T.; Harada, M.; Watanabe, M. Restacked perovskite nanosheets and their Pt-loaded materials as photocatalysts. Chem. Mater. 2002, 14, 4390–4395. [Google Scholar] [CrossRef]
  30. Compton, O.C.; Carroll, E.C.; Kim, J.Y.; Larsen, D.S.; Osterloh, F.E. Calcium niobate semiconductor nanosheets as catalysts for photochemical hydrogen evolution from water. J. Phys. Chem. C 2007, 111, 14589–14592. [Google Scholar] [CrossRef] [Green Version]
  31. Chen, Y.; Zhao, X.; Ma, H.; Ma, S.; Huang, G.; Makita, Y.; Bai, X.; Yang, X. Structure and dehydration of layered perovskite niobate with bilayer hydrates prepared by exfoliation/self-assembly process. J. Solid State Chem. 2008, 181, 1684–1694. [Google Scholar] [CrossRef]
  32. Hata, H.; Kobayashi, Y.; Bojan, V.; Youngblood, W.J.; Mallouk, T.E. Direct deposition of trivalent rhodium hydroxide nanoparticles onto a semiconducting layered calcium niobate for photocatalytic hydrogen evolution. Nano Lett. 2008, 8, 794–799. [Google Scholar] [CrossRef] [PubMed]
  33. Maeda, K.; Eguchi, M.; Youngblood, W.J.; Mallouk, T.E. Calcium niobate nanosheets prepared by the polymerized complex method as catalytic materials for photochemical hydrogen evolution. Chem. Mater. 2009, 21, 3611–3617. [Google Scholar] [CrossRef]
  34. Sabio, E.M.; Chi, M.; Browning, N.D.; Osterloh, F.E. Charge separation in a niobate nanosheet photocatalyst studied with photochemical labelling. Langmuir 2010, 26, 7254–7261. [Google Scholar] [CrossRef] [PubMed]
  35. Virdi, K.S.; Kauffmann, Y.; Ziegler, C.; Ganter, P.; Blaha, P.; Lotsch, B.V.; Kaplan, W.D.; Scheu, C. Band gap extraction from individual two-dimensional perovskite nanosheets using valence electron energy loss spectroscopy. J. Phys. Chem. C 2016, 120, 11170–11179. [Google Scholar] [CrossRef]
  36. Compton, O.C.; Osterloh, F.E. Niobate nanosheets as catalysts for photochemical water splitting into hydrogen and hydrogen peroxide. J. Phys. Chem. C 2009, 113, 479–485. [Google Scholar] [CrossRef] [Green Version]
  37. Xu, F.-F.; Ebina, Y.; Bando, Y.; Sasaki, T. In-situ transmission electron microscopic study of perovskite-type niobate nanosheets under electron-irradiation and heating. J. Phys. Chem. B 2003, 107, 6698–6703. [Google Scholar] [CrossRef]
  38. Spectral Database for Organic Compounds SDBS. Available online: https://sdbs.db.aist.go.jp/sdbs/cgi-bin/landingpage?sdbsno=10891 (accessed on 16 December 2019).
  39. Zhang, S.; Scheu, C. Evaluation of EELS spectrum imaging data by spectral components and factors from multivariate analysis. Microscopy 2018, 67, i133–i141. [Google Scholar] [CrossRef]
  40. Nakibli, Y.; Kalisman, P.; Amirav, L. Less is more: The case of metal cocatalysts. J. Phys. Chem. Lett. 2015, 6, 2265–2268. [Google Scholar] [CrossRef]
  41. Choi, W.; Choi, J.Y.; Song, H. Regulation of electron-hole recombination kinetics on uniform metal-semiconductor nanostructures for photocatalytic hydrogen evolution. APL Mater. 2019, 7, 100702. [Google Scholar] [CrossRef]
Figure 1. (a) Photographs of [Ca2Nb3O10] nanosheets with 0, 1, 10, 100 wt% Ni loading, (b) XRPDs of [Ca2Nb3O10] nanosheets without, with 25 and 100 wt% Ni loading. Simulated XRPD from β-Ni(OH)2 (ICSD 161899) and HCa2Nb3O10·0.5 H2O (ICSD 246002) are plotted at the bottom. (c) FTIR of [Ca2Nb3O10] nanosheets without, with 10 and 100 wt% Ni loading. (d) Photographs of nanocomposite suspension in water with 3 wt% Ni loading without and after treatment in air, vacuum, argon, or H2 at 500 °C for 10 min. (e) XRPDs of [Ca2Nb3O10] nanosheets with 3 wt% Ni loading, as deposited and heated at 500 °C for 10 min in air, H2, argon, and vacuum. Simulated XRPD from Ni (ICSD 672995) is plotted at the bottom. Scale bars in (a) and (d) are 1 cm.
Catalysts 10 00013 g001
Figure 2. High angle annular dark field (HAADF)-STEM micrographs and EDS elemental maps of the nanocomposites with 3 wt% Ni loading (a) as deposited, heated at 500 °C for 10 min in (b) air, (c) vacuum, (d) argon, and (e) H2. All scale bars are 200 nm.
Catalysts 10 00013 g002
Figure 3. Growth of Ni nanoparticles from the nanocomposite with 10 wt% Ni loading during in situ heating under vacuum. Scale bars in both image sets (a), (b) are 50 nm.
Catalysts 10 00013 g003
Figure 4. (a) Nucleation of nanoparticles on [Ca2Nb3O10] nanosheets heated in situ under vacuum at 200 °C with corresponding layers A, B, C identified by (b) the fast Fourier transform. (c) A recrystallized Ni particle in the nanocomposite heated in situ under vacuum up to 800 °C. (d) A Ni core/NiO shell nanoparticle from the nanocomposite heated in H2 at 500 °C, with the color-coded image to enhance the contrast between the Ni core and the NiO shell.
Catalysts 10 00013 g004
Figure 5. (a) Ni-L3 and Ni-L2 edges from the core and shell areas of a nanoparticle after 500 °C heating in H2, and (b) mapping of the energy centroid of the Ni-L3 edge (scale bar is 10 nm). (c) NiO fraction of Ni core/NiO shell nanoparticles derived from the Ni-L3 chemical shift as a function of nanoparticle diameter d observed during in situ heating. Dashed line shows a fit according to Equation (1). (d) Schematic of the Ni core/NiO shell particles with definition of their diameters.
Catalysts 10 00013 g005
Figure 6. Schematics of (a) the as-deposited nanocomposite and (b) after heating at 500 °C in H2. (c) HER rates of the nanocomposites (normalized by their mass) in methanolic solution under full arc Xe lamp irradiation without and with Ni loading of 1 wt%, 3 wt%, 10 wt%, and the nanocomposite with 3 wt% Ni loading heated at 500 °C in H2 for 10 min.
Catalysts 10 00013 g006
Table 1. Molar ratio between Nb and Ca, Ni and Ca from EDS elemental quantification.
500 °C HeatingNb/CaNi/Ca
As deposited1.620.14
Air1.590.14
Vacuum1.640.16
Argon1.640.14
H21.630.16

